4 Waste Quantities and Characteristics - City University of...
22
IV Waste Quantities and Characteristics 1 4 Waste Quantities and Characteristics Background … 4.1 Definition of Waste Solid wastes are materials, which no longer have any useful purpose in their present form or condition. Solid waste management can be defined as the disposal of waste materials (also known as rubbish, garbage, trash), generated from household and industrial sources, in a cost effective way, without degrading the environment (Cotter, 2000). Waste is an unwanted or undesired material or substance. It is also referred to as rubbish, trash, garbage, or junk depending upon the type of material and the regional terminology. In living organisms, waste relates to unwanted substances or toxins that are expelled from them. The European Union defines waste as an object the holder discards, intends to discard or is required to discard is waste under the Waste Framework Directive (European Directive 75/442/EC as amended). Once a substance or object has become waste, it will remain waste until it has been fully recovered and no longer poses a potential threat to the environment or to human health." The UK's Environmental Protection Act 1990 indicated waste includes any substance which constitutes a scrap material, an effluent or other unwanted surplus arising from the application of any process or any substance or article which requires to be disposed of which has been broken, worn out, contaminated or otherwise spoiled; this is supplemented with anything which is discarded otherwise dealt with as if it were waste shall be presumed to be waste unless the contrary is proved. According to the Notification of the Ministry of Industry B.E. 2548, waste and discarded materials are identified as follows. Industrial waste is defined as waste and discarded materials resulted from industrial activities including raw materials, intermediates, sub-quality products, production processes and water effluent containing hazardous properties. According to the Environmental Quality Conservation Act B.E. 2535, waste includes garbage, manure, wastewater, air emission, pollution or any other hazardous substances, which are emitted or discharged from pollution sources including sludge and their remaining in forms of solid, liquid, and gas. 4.2 Waste Quantity, Generation and Composition in Cambodia 4.2.1 Municipal Solid Waste Municipal solid waste (MSW) –generated from households, offices, hotels, shops, schools and other institutions– is composed of food waste, paper, plastic, rags, metal and glass. Table 4.2-1 shows the estimated quantity of solid waste generated per day in some municipalities and provinces in Educational objective of the chapter …
Transcript of 4 Waste Quantities and Characteristics - City University of...

IV Waste Quantities and Characteristics 1
4 Waste Quantities and Characteristics
Background …
4.1 Definition of Waste Solid wastes are materials, which no longer have any useful purpose in their present form or condition. Solid waste management can be defined as the disposal of waste materials (also known as rubbish, garbage, trash), generated from household and industrial sources, in a cost effective way, without degrading the environment (Cotter, 2000). Waste is an unwanted or undesired material or substance. It is also referred to as rubbish, trash, garbage, or junk depending upon the type of material and the regional terminology. In living organisms, waste relates to unwanted substances or toxins that are expelled from them. The European Union defines waste as an object the holder discards, intends to discard or is required to discard is waste under the Waste Framework Directive (European Directive 75/442/EC as amended). Once a substance or object has become waste, it will remain waste until it has been fully recovered and no longer poses a potential threat to the environment or to human health." The UK's Environmental Protection Act 1990 indicated waste includes any substance which constitutes a scrap material, an effluent or other unwanted surplus arising from the application of any process or any substance or article which requires to be disposed of which has been broken, worn out, contaminated or otherwise spoiled; this is supplemented with anything which is discarded otherwise dealt with as if it were waste shall be presumed to be waste unless the contrary is proved. According to the Notification of the Ministry of Industry B.E. 2548, waste and discarded materials are identified as follows. Industrial waste is defined as waste and discarded materials resulted from industrial activities including raw materials, intermediates, sub-quality products, production processes and water effluent containing hazardous properties. According to the Environmental Quality Conservation Act B.E. 2535, waste includes garbage, manure, wastewater, air emission, pollution or any other hazardous substances, which are emitted or discharged from pollution sources including sludge and their remaining in forms of solid, liquid, and gas.
4.2 Waste Quantity, Generation and Composition in Cambodia
4.2.1 Municipal Solid Waste
Municipal solid waste (MSW) –generated from households, offices, hotels, shops, schools and other institutions– is composed of food waste, paper, plastic, rags, metal and glass. Table 4.2-1 shows the estimated quantity of solid waste generated per day in some municipalities and provinces in
Educational objective of the chapter
…

IV Waste Quantities and Characteristics 2
Cambodia. It is obvious that Phnom Penh, with a population of 1.3 millions, creates the largest amount of solid waste. The expected waste amount for various sources based in population and waste generation projections in Phnom Penh is shown in Table 4.2-2. An analysis of ratio of carbon and nitrogen contained in the waste of household, restaurants, and market showed a C/N ratio of 15.8 to 18.3 for kitchen waste and 24.3 to 20.2% for grass and wood waste, indicating that these wastes are suitable for composting.
Table 4.2-1: Quantity of solid waste generated per day in Cambodia [Cotter, 2000]
Town / Province Quantity / Day
Phnom Penh 464 tons
Sihanouk Ville 15 tons
Siem Reap 17 tons
Banteay Meanchey 12 m3
Kampong Speu 30 tons
Pursat 21 m3
Kampong Chhnang 10 m3
Kampong Cham 15 m3
Kampot 16 m3
Preah Vihear 5 m3
Kep (Kampot) 6 m3
Svay Rieng 1 ton
Prey Veng 30-50 m3
Table 4.2-2: Collection Amount of Waste in Phnom Penh (t/day)
Collection amount 2007 2008 2009 2010 2011 2012 2013 2014 2015
Household 91.6 103.0 115.7 129.4 140.5 171.5 183.8 196.8 224.1
Commercial-Restaurants
7.6 8.4 9.2 10.3 11.1 12.1 13.0 13.9 15.0
Commercial-Others 19.3 21.8 24.8 27.9 30.8 34.2 37.4 40.9 44.9
Market 12.6 14.1 15.7 17.6 19.3 21.2 22.9 24.7 27.0
Hotel 0.4 0.4 0.6 0.6 0.6 0.6 0.7 0.8 0.8
Office 0.2 0.2 0.1 0.2 0.2 0.3 0.3 0.3 0.3
Schools 1.3 1.4 1.6 1.8 1.9 2.1 2.2 2.4 2.6
Factories 15.1 16.3 17.7 19.1 20.1 21.1 22.2 23.3 24.5
Hospitals 0.6 0.8 1.0 1.1 1.4 1.5 1.8 2.0 2.3
Slaughter House 3.9 4.3 4.6 4.9 5.2 5.4 5.7 6.1 6.3
Unidentified source 8.4 9.2 10.0 10.9 11.8 12.7 13.7 15.0 16.2
Street Sweeping 0.4 0.5 0.6 0.6 0.7 0.7 0.7 0.8 0.9
TOTAL 161.4 180.4 201.6 224.4 243.6 283.4 304.4 327.0 364.9
4.2.2 Sewage Sludge
Sewage systems in Cambodia, especially Cin cities and urban areas, are still in bad conditions. Standing water in the streets around housing settlements and market places remains a problem, due to the lack of drainage system and environmental infrastructure and facilities. Where they are available, the lack of maintenance is apparent (MPP and ADB, 2006). Residents throw their garbage on streets, clogging the sewage system and when it rains, many areas in cities are flooded (Kham, 2008). Sewage, on the other hand, is discharged into lakes without treatment. Edible aquatic plants, especially water spinach, are grown on the untreated water, the safety of which has been questioned by many researchers.
4.2.3 Industrial waste
Industrial solid waste in Cambodia, as elsewhere, encompasses a wide range of materials of varying environmental toxicity. Typically this range would include paper, packaging materials, waste from food processing, oils, solvents, resins, paints and sludge, glass, ceramics, stones, metals, plastics, rubber, leather, wood, cloth, straw, abrasives, etc. As with municipal solid waste, the absence of a regularly up-dated and systematic database on industrial solid waste ensures that the exact rates of

IV Waste Quantities and Characteristics 3
generation are largely unknown.
Figure 4.2-1: Discharge site of sewage system in Phnom Penh
Table 4.2-3: Industrial Waste Flow in Phnom Penh City in 2003 [Kakusai Kogyo Co., Ltd, 2005]
Waste Flow Component Discharge Ratio (g/employee/day)
Waste Amount (tons/day)
No. of Generation Sources
Waste Generation Amount 334.8 58.2 173,942
Recycling --- 0.1 ---
Final Disposal Amount --- 58.1 ---
In Phnom Penh, the textile and garment industries account for 80% and 97% of the total number of factories and employees respectively and 82% of the total amount of IW is discharged by these industries. Almost all factories separate HIW from non-HIW. Few factories conduct reuse, recycling or treatment of waste on-site. CINTRI and Sarom Trading Company each collect half of the waste discharged from industries. Because there are no clear standards or regulations for IW treatment and disposal, some factories have been reported to discharge HIW mixed with non-HIW (Kakusai Kogyo Co., Ltd., 2005).
4.2.4 Factors influencing quantity and composition of waste
There are several factors influencing quantity and composition of waste in Cambodia, including:
1. Generation source– household waste tends to produce the largest amount of waste (Table 4.2-4).
2. Household incomes– The average household waste generation ratio in Phnom Penh is found to be 487 g/person/day, which is similar to that of other developing countries. The increase in the generation ratio by level is proportionate to the household income level, with high household incomes producing larger amount of waste than do middle and low ones (Table 4.2-5).
3. Season–with few exceptional cases, larger amount of waste is produced in dry season than that of rainy season (Table 4.2-6).
Table 4.2-4: Daily waste discharge amount in Phnom Penh City in 2003 [Kokusai Kogyo CO., Ltd., 2005]
Generation Ratio Daily Generation Amount (Ton/day)
Generation Source
Unit
Number of generation sources Dry season Rainy
season Average Dry season Rainy
season Average
Household Waste
g/person/day
1,199,414 498 476 487 597.3 570.9 584.1
Commercial Waste (restaurant)
g/table/ day
27,808 1,940 1,387 1,664 54.0 38.6 46.3
Commercial waste (Other Shop)
g/shop/ day
33,524 4,566 4,437 4,502 153.1 148.8 151.0
Market Waste g/stall/ day
51.766 1,700 1,945 1,823 88.0 100.7 94.4
School Waste g/student/d 385,013 18 21 20 6,9 8.1 7.5

IV Waste Quantities and Characteristics 4
ay
Street Sweeping Waste
g/km/d 56 47,235 59,510 53,373 2.6 3.3 3.0
Hotel Waste g/room/ day
13,385 199 263 231 2.7 3.5 3.1
Office Waste g/office/ day
368 2,946 4,174 3,560 1.1 1.5 1.3
Total 905.7 875.4 890.6
Table 4.2-5: Household waste discharge ratio as classified by household incomes [Kokusai Kogyo CO., Ltd.,
2005]
Generation Ratio (g/person/day)
Household characteristics Average monthly
income (riel)
Population by Income level
Dry season Rainy season
High Income Household 3,708,000 10% 668.5 646.2
Middle Income Household 1,291,000 30% 545.3 501.4
Low Income Household 636,000 60% 445.9 435.2
Weight Average --- --- 489.0 476.1
Note: 1 US$ = 4000 Riels
Table 4.2-6: Waste composition in Phnom Penh [Kokusai Kogyo CO., Ltd., 2005]
Total Classification
dry season
rainy season
average
Apparent Specific Gravity kg/l 0.25 0.24 0.25
Paper Rubber and Leather Kitchen Waste Textile Plastic Grass and Wood
% % % % % %
6.3 0.0
65.8 2.3
17.1 3.0
6.5 0.1
61.2 2.7
13.8 10.5
6.4 0.1
63.3 2.5
15.5 6.8
Combustible Waste
Sub- Total % 94.5 94.8 94.6
Metal Bottle and Glass Ceramic and Stone Others
% % % %
0.3 1.3 2.1 1.8
0.9 1.1 0.9 2.3
0.6 1.2 1.5 2.1
Incombustible
Waste
Sub-Total % 5.5 5.2 5.4
Physical Composition (WET Base)
Total % 100.0 100.0 100.0
4.3 Waste Characteristics in Thailand
4.3.1 Quantity, Generation and Composition
This section describes wastes based on the renewable energy generated (i.e., bio-ethanol, biodiesel, biogas, and municipal solid waste).
4.3.1.1 Ethanol Production

IV Waste Quantities and Characteristics 5
In Thailand, the three major types of feedstock and/or energy crops available for bio-ethanol production are sugarcane, molasses and cassava. Table 4.3-1 and Table 4.3-2 shows the estimation of ethanol production from sugar cane and molasses and cassava, respectively. Table 4.3-3 describes potential agricultural products that can be used for bio-ethanol production and its price and method of current utilization.
Table 4.3-1: Estimated Sugar Cane and Molasses Production
year
Sugar cane production from
survey
(million tons/year)
Sugar cane production
(million tons/year)
molasses (tons/year)
Ethanol production (L/year)
From molasses
2006 45.9 47.92 2,396,000 349,000,000 2007 58.69 57.02 2,851,200 462,800,000
2008 66.52 59.90 2,995,200 498,800,000
Table 4.3-2: Estimation of cassava root production, its utilization in various industries and the amount of ethanol produced between 2007-2017
Amount of fresh cassava roots (million tons) Year Cassava root
production (millions
tons)*
For starch production
For chip/pellet production
For ethanol production
Ethanol
production (million
liters/day)
Ethanol
production (million
liters/year)
2007 23.28 12 9 2.28 1.08 387.6
2008 27.45 12 9 6.45 3.05 1,096.5
2009 29.7 12 9 8.7 4.11 1,479.0
2010 29.7 12 9 8.7 4.11 1,479.0
2011 29.7 12 9 8.7 4.11 1,479.0
Table 4.3-3: Price of agricultural by-products
By-products Price Utilization
Rice straw variable Animal feed, soil coverage
Rice husk 1,200 Bath/ton Burning for energy Broken rice 14 Bath/kilogram Rice flour production, animal feed
Corn husk and cob - Animal feed, compost, etc.
Palm empty bunches 350 Bath/ton Mushroom cultivation, burning for energy Palm shell 1,550 Bath/ton Burning for energy
Palm kernel cake - Burning for energy Palm fiber - Burning for energy
Source: Field study survey (2006)
4.3.1.2 Bio-Diesel Production
Table 4.3-4 and Table 4.3-5 estimate the quantity of palm oil and used vegetable oil that can be used for bio-diesel production.
Table 4.3-4: palm oil amount for biodisel production
B100 B10 Year
Planted Area
M rai1
CPO2
M liter M liter/year M liter/day M liter/year M liter/day
2550 2.74 107.42 107.42 0.29 1,074.30 2.94
2551 2.89 167.67 167.67 0.45 1,676.71 4.59
Table 4.3-5: Accessibility of provision of used vegetable oil (UVO).
Sources Amount m litre accessibility
household 47.2 limited Food caterer & restaurants 22.5 accessible large factories 3.4 highly accessible
1 1 hectare = 6.25 rai
2 CPO: Crude Palm Oil

IV Waste Quantities and Characteristics 6
vendors 1.3 limited
4.3.1.3 Biogas Production
Biogas is a high effective source for renewable energy. Currently, approximately 2,300 biogas systems exist in Thailand. Various wastes, such as wastewater from agro-industries and animal manure, are available as the sources of biogas. Two major sources for biogas production are wastewaters from cassava starch factories and pig farms. Table 4.3-6 to Table 4.3-18 present waste composition and quantiy of each type of biomass for biogas production.
Table 4.3-6: Waste Composition from Pig Farm
Data from field survey Type
COD (mg/kg)
BOD (mg/kg)
TS (mg/kg)
VS (mg/kg)
TKN (mg/kg)
Swines 230,130 121,150 390,350 266,550 7,593
hogs 163,740 67,801 250,000 180,000 8,000
Table 4.3-7: Quantity of Waste Generated from Cattle/Dairy Cow
Type Unit Amount
Dairy cow Kg/head/day 15
Cattle Kg/head/day 5
Table 4.3-8: Waste Composition from cattle/dairy cow
Data from field survey Type
COD (mg/kg)
BOD (mg/kg)
TS (mg/kg)
VS (mg/kg)
TKN (mg/kg)
Dairy Cow 160,977 120,630 197,000 170,420 3,750
Cattle 124,550 105,260 205,600 165,220 4,360
Table 4.3-9: Waste Composition from Cassava Starch Factory
Type
pH COD (mg/L)
BOD (mg/L)
TS (mg/L)
SS (mg/L)
TKN (mg/L)
TDS (mg/L)
WW from Separator
5.54-6.48 10,540-19,048
5,074-12,165
7,410-18,885
1,475-11,330
197-292 4,730-8,875
Combined WW
4.99-6.33 12,996-19,278
6,465-12,646
12,549-19,844
5,790-7,965
228-512 5,583-12,851
Table 4.3-10: Waste Composition from Crude Palm Oil Factory
Source pH Temp
(oC)
COD
(mg/L)
BOD
(mg/L)
TS
(mg/L)
TVS
(mg/L)
SS
(mg/L)
Oil
(mg/L)
Min 4.21 50 30,424 10,475 53,030 45,275 11,625 1,880
Max 4.86 76 94,053 56,900 97,420 80,100 40,725 8,580
KMUTT 2007
Aver 4.64 65 62,032 29,172 65,674 56,148 23,179 5,010
Puetpaiboon U. and
Chotwattanasak J., 2005
Aver 4.69
-4.85
40-45 21,560-39,200
16,950 24,600
ND ND ND ND

IV Waste Quantities and Characteristics 7
Min 4.5 58,750 17,000 9,233
Max 5.38 64,883 21,000 12,260
Itroj,2004
Aver 5.05
ND
61,816 19,000
ND ND
10,746
ND
Factory Dept, 1997 Aver 4-5 75-90 90,000 30,000 ND ND 34,000 8,000
Najafpour., et al., 2006 Aver
3.8-4.4
ND 42,500-62,032
23,000-
24,500 ND ND
16,500-
18,000
4,900-5,300
Peram M Ch Prasada Rao, 1999
Aver 3.98 75.8 98,484 36,246 ND ND 47,940 ND
Ma Ah Ngan, 1987 Aver 4.2 ND 50,000 25,000 ND ND 18,000 ND
DEDE 2000
ND ND ND 52,000 ND ND ND ND ND
ND : No Data
Table 4.3-11: Waste Composition from Frozen Seafood Factory
Source COD
(mg/L) BOD
(mg/L) TKN
(mg/L)
Total Solids
(mg/L)
Total Volatile
Solids (mg/L)
Suspended Solids
(mg/L)
Oil & Grease
(mg/L)
Min 1,900 1,069 123 3,525 1,370 730 6,383
Max
4,800 4,013 519 7,715 3,345 1,355 23,250
KMUTT 2007
Aver
3,513 2,110 319 5,585 2,582 1,034 17,346 Usara ,2005
2,840 925 ND ND ND 937 ND
Nair,1990
1,950 1,300 ND ND ND 520 300
7,047 5,302 ND 4,533 ND ND
6,085
4,574 2,480 ND 2,527 ND ND
7,178
Factory Dept+GTZ+PDTI
1994
2,721 1,852 ND 1,138 ND ND
1,024 DEDE 2000
6,801 ND ND ND ND ND ND
ND : No Data
Table 4.3-12: Quantity of Wastewater Canned Pineapple Factory
Source Combined WW
(cu.m./tons fresh pineapple)
Combined WW
(cu.m./tons canned pineapple)
Min 0.32 4.57
Max 1 14.3
KMUTT 2007
Aver. 0.66 9.42
Koottatep ,2002 1 14.28 Min 0.69 9.8
Max 0.71 10.2
The Division of Pollution Prevention and Environmental Assistance
Aver. 1 14.4
DEDE 2000 0.35 4.98

IV Waste Quantities and Characteristics 8
Table 4.3-13: Waste Composition from Canned Pineapple Factory
Source
pH
COD (mg/L)
BOD (mg/L)
TKN (mg/L)
Total Solids (mg/L)
Total Volatile Solids (mg/L)
Suspended Solids (mg/L)
Min 3.81 1,320 573 9 1,837 3,655 205
Max
4.02 9,128 4,100 36 8,397 6,192
617
KMUTT 2007
Aver
3.9 5,477 2,563 23 5,070 4,580 452
DEDE 2000 ND 16,486
ND ND ND ND ND
ND : No Data
Table 4.3-14: Waste Composition from Sugar Factory
Source COD
(mg/L)
BOD
(mg/L)
Total
Solids (mg/L)
Total
Volatile Solids (mg/L)
Suspended
Solids (mg/L)
TKN
(mg/L) pH
Min 2,430 787 2,476 2,032 4 133 5.30
Max
3,805 2,175 8,985 3,505 28 3,754 7.83
KMUTT 2007
Aver
3,129 1,421 4,408 2,596 16.8 1,050 6.26
Chang , et al., 1990
7,000 2,800 ND ND ND ND 6.5-7.6
Kusum Lata., et al., 2002
1,800-3,200
720-1500 3500 ND ND ND 4-7
Lembaga Rendidikan, 2001
540-6,746
254-3,341 ND ND 80-1,440 ND ND
DEDE 2000 2,932 ND ND ND ND ND ND
ND : NO DATA
Table 4.3-15: Waste Composition from Pig Slaughterhouse
Source COD
(mg/L) BOD
(mg/L)
TKN (mg/L
)
TS (mg/L)
Total-N (mg/L)
Total-P (mg/L)
Total Volatile Solids (mg/L)
Suspended Solids (mg/L)
Oil & Grease (mg/L)
pH
Min 1,460 569 112 2,245 ND ND 1,363 308 156 7.26
Max 2,770 948 227 3,008 ND ND 2,096 1,050 950 7.83
KMUTT 2007
Aver. 1,988 717 169 2,650 ND ND 1,738 602 466 7.50 Factory Dept 1998
3,480 2500 ND ND 520 34 ND ND 20 ND
Effe, 2548 2000-2500
1,000 – 1,500
300 – 600
ND ND ND ND 700-800 10-20 6.5 – 7.5
Hansen and Mortensen, 1992
2,500 1,250 ND ND 150 25 ND 700 150 7.20
DEDE 2000 2,284 ND ND ND ND ND ND ND ND ND
Table 4.3-16: Waste Composition from Cattle Slaughterhouse
Source COD
(mg/L)
BOD
(mg/L) Total-N
(mg/L)
Total-P
(mg/L)
Suspended
Solids (mg/L)
Oil &
Grease (mg/L) pH
Factory Dept 1998 7,080 2,950 588 3 660 14 ND
Hansen and Mortensen, 1992
4,000 2,000 180 27 1,600 270 7.2
Tritt, 1992 1000-6000
1000-4000
250-700 80-120 ND ND ND
DEDE 2000 2,284 ND ND ND ND ND ND
Table 4.3-17: Waste Composition from animal farm
Biomass Amount Unit COD TVS

IV Waste Quantities and Characteristics 9
(mg/kg) (mg/kg)
Pig manure - Swine 2 kg/head/day 230,000 267,000 - Hog 1.2 kg/head/day 164,000 180,000 - Piglet 0.5 kg/head/day 164,000 180,000 - Native breed 1.2 kg/head/day 164,000 180,000 Cattle manure - Cattle 15 kg/head/day 161,000 171,000 - Dairy Cow 5 kg/head/day 125,000 165,000
Table 4.3-18: Characteristics of Biomass Potential for Biogas Production from industries
Biomass Amount Unit COD (mg/L)
TVS (mg/L)
WW – cassava starch 15 cu.m./ton starch 20,000 -
Cassava pulp 1.7 cu.m./ton starch 234,000 (mg/kg) - WW – palm oil 0.5 cu.m./ton CPO 60,000 56,000
WW – frozen seafood 30 cu.m./ton canned tuna 4,000 2,500 WW – canned pineapple 10 cu.m./ton canned
pineapple 5,500 4,500
WW – sugar 1.7 cu.m./ton sugar 3,100 2,600
WW – pig slaughtherhouse
3 cu.m./ton pig 2,000 -
WW – cattle slaughterhouse
2.5 cu.m./ton cattle 3,000 -
WW – ethanol 20 L/ton ethanol 100,000 60,000
The availability of major wastes in the livestock sector is from pig and cow manures. In 2006, with 6.28 million heads of pigs, 1.3 million tons of manure was collected. The total biogas potential from pig manures was estimated to be 237 millions m
3, with an equivalent energy content of 120 kilo-tons
of oil equivalent (ktoe). This could replace 285 GWh (33 MWe) of electricity or 109 million liters of fuel oil. With 8.2 million heads of cattles/cows, 9.2 million tons of manure was collected (i.e., 2.09 million tons from dairy cows and 7.11 million tons from cattles). The total biogas potential from cattle/cow manure was estimated to be 822 million m
3 that was 595 and 226 million m
3 from cattles and dairy
cows, respectively. With an equivalent energy content of 430 ktoe, this could replace 986 GWh (115 MWe) of electricity or 378 million liters of fuel oil.
Currently, the biogas systems are the most popular in the pig farms, producing approximately 30 - 40% of the total biogas potential in the year 2006 or equivalent 145 million m
3 biogas a year. The
equivalent energy content was 76 ktoe, which could replace 174 GWh (20 MWe) of electricity or 67 million liters of fuel oil.
Table 4.3-19: Potential Biogas Production from animal farm
Biomass Quantity
(million ton/yr) biogas
(million m3/yr) KTOE MW Eq. fuel oil (million L)
Pig 1.30 237 120 33 109
Cattle/cow 9.2 822 430 115 378
Total 11 1,059 550 148 477
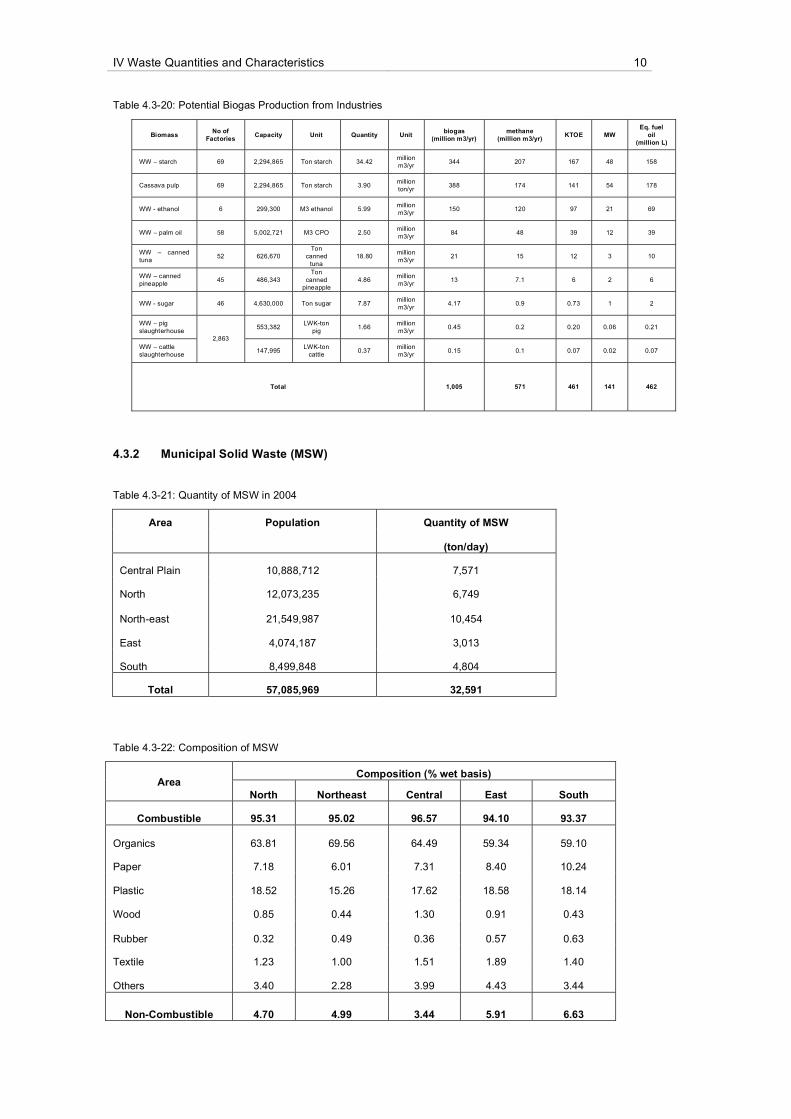
Table 4.3-20 presents the biogas potential from ten agro- and food industrial wastewaters. The ten industries were cassava starch, sugar, palm oil, canning/frozen seafood, slaughter house, canning pineapple, and cassava pulp. Cassava starch wastewater has the highest potential for biogas production of 344 million m
3 (2006), with an equivalent energy content of 167 ktoe. or 413 GWh (18
MWe, PCF=82%), or 158 million liters of fuel oil. Then, the ethanol-distillery spent wash, palm oil mill wastewater, tuna canning wastewater, pineapple canning wastewater, slaughterhouse wastewater, and sugar mill wastewater have the biogas potential from high to low, respectively. The overall potential for biogas production from the industrial wastewaters is 461 ktoe a year.
IV Waste Quantities and Characteristics 10
Table 4.3-20: Potential Biogas Production from Industries
Biomass No of
Factories Capacity Unit Quantity Unit
biogas
(million m3/yr)
methane
(million m3/yr) KTOE MW
Eq. fuel
oil
(million L)
WW – starch 69 2,294,865 Ton starch 34.42 million m3/yr
344 207 167 48 158
Cassava pulp 69 2,294,865 Ton starch 3.90 million ton/yr
388 174 141 54 178
WW - ethanol 6 299,300 M3 ethanol 5.99 million m3/yr
150 120 97 21 69
WW – palm oil 58 5,002,721 M3 CPO 2.50 million m3/yr
84 48 39 12 39
WW – canned tuna
52 626,670 Ton
canned tuna
18.80 million m3/yr
21 15 12 3 10
WW – canned pineapple
45 486,343 Ton
canned pineapple
4.86 million m3/yr
13 7.1 6 2 6
WW - sugar 46 4,630,000 Ton sugar 7.87 million m3/yr
4.17 0.9 0.73 1 2
WW – pig slaughterhouse
553,382 LWK-ton
pig 1.66
million m3/yr
0.45 0.2 0.20 0.06 0.21
WW – cattle slaughterhouse
2,863
147,995 LWK-ton
cattle 0.37
million m3/yr
0.15 0.1 0.07 0.02 0.07
Total 1,005 571 461 141 462
4.3.2 Municipal Solid Waste (MSW)
Table 4.3-21: Quantity of MSW in 2004
Area Population Quantity of MSW
(ton/day)
Central Plain 10,888,712 7,571
North 12,073,235 6,749
North-east 21,549,987 10,454
East 4,074,187 3,013
South 8,499,848 4,804
Total 57,085,969 32,591
Table 4.3-22: Composition of MSW
Composition (% wet basis) Area
North Northeast Central East South
Combustible 95.31 95.02 96.57 94.10 93.37
Organics 63.81 69.56 64.49 59.34 59.10
Paper 7.18 6.01 7.31 8.40 10.24
Plastic 18.52 15.26 17.62 18.58 18.14
Wood 0.85 0.44 1.30 0.91 0.43
Rubber 0.32 0.49 0.36 0.57 0.63
Textile 1.23 1.00 1.51 1.89 1.40
Others 3.40 2.28 3.99 4.43 3.44
Non-Combustible 4.70 4.99 3.44 5.91 6.63

IV Waste Quantities and Characteristics 11
Glass 3.11 3.19 1.90 3.31 4.37
Metal 1.59 1.81 1.54 2.60 2.27
Table 4.3-23: Chemical composition of MSW
Chemical Composition Bangkok Area Municipality
%MC 61.33 67.11
%TS 38.67 32.89
%VS 86.16 88.12
%C 47.87 48.82
%H 5.39 5.51
%O 32.54 32.53
%N 0.20 0.88
%P 0.17 0.34
%S 0.00 0.03
Heat of combustion, cal/g by bomb calory meter 7,674
6,237
Table 4.3-24: Properties of MSW
Municipality Moisture(%) Organic(%) Heat Value (kcal/kg)
Metropolitan 66.42 65.17 6,066.44
District 67.33 64.09 6,533.47
Sub-district 68.30 64.36 6,039.92
4.4 Waste Quantities and Characteristics in Vietnam
4.4.1.1 Waste Quantity, Generation and Composition
Solid waste generation in Vietnam is over 15 million tons per year. From it 80 % is classified as municipal solid waste, 17 % industry and 1% hazardous waste (industrial hazardous, healthcare residues and herbicides). The solid waste generation is about 1kg/head/day (Figure 4.4-1) [2].

IV Waste Quantities and Characteristics 12
2.86
17
0.14
80
Municipal w aste Hazardous, healthcare w aste
Industrial w aste Others
Figure 4.4-1: Ratio of waste quantities
Table 4.4-1: The amount of solid waste generation perday in some cities of Vietnam

IV Waste Quantities and Characteristics 13
The generation rates of solid waste depend on the category of urban area. Hanoi and Ho Chi Minh city produce a large amount of waste in comparison with the others (Figure 4.4-2):
- HCM city: 2,300,000 ton/year
- Hanoi: 720,000 ton/year
- Others: 3,380,000 ton/year
Figure 4.4-2: Waste generation in urban areas
In 2003 the generation of municipal solid waste in Hanoi is about 2000 ton / day, from this about 1368 ton/day are from the inner city. Main components are organic waste: 49 - 60 %: rest of food, vegetable, fruit, …; recycable material 22 29 %: rest of plastic, paper, metall, galss, ...; others 18 - 22 %: rest of wood, gumi, leather, artificial leather, hazardous, ... Collection rate is about 70% (Figure 4.4-3) [3].
49%
29%
22%
1. Organic w aste
2. Recyclable w aste
3. Ohters
Figure 4.4-3: Components of waste generation in Hanoi
In 2004 however the waste generation in Hanoi has increased to 3855 ton/day. Components are as follows: municipal solid waste (58,97 %); industrial waste (13,40 %); C&D waste (21,60 %); hazardous health care waste (0,045%); sewage sludge (5,95 %) and others (0,035 %) (Figure 4.4-4) [4].

IV Waste Quantities and Characteristics 14
0.035%
58.97%13.40%
21.60%
5.95%
0.045%
1. municipal solid w aste
2. industrial w aste
3. C&D w aste
4. hazardous health care w aste
5. sew age sludge
6. 0ther
Figure 4.4-4: Components of waste generation in Hanoi in 2004
Household waste amount has changed rapidly from 2002 to 2004 as shows in Figure 4.4-5[5].
0
2000000
4000000
6000000
8000000
10000000
12000000
14000000
16000000
18000000
2002 2003 2004 year
Ge
ne
rati
on
am
ou
nt
(t/y
ea
r)
whole country
urban areas
rural areas
Figure 4.4-5: Household waste amount from 2002 - 2004
Waste generation increases over 10 %/head/year. If there is no suitable policy on waste management the waste amount to 2010 increase by 50 - 60% (about 23 million tons / year) and an over threefold increase in hazardous waste generation, mostly attributable to industrial sources. Considering the high cost of safe collection and disposal, initiatives to reduce waste such as promoting public awareness and cleaner production, and introducing economic incentives based on the Polluters Pay Principle could result in significant savings. For example, a 10% reduction in waste generation could result in an annual disposal savings of approximately VND 200 billion and VND 130 billion for municipal and hazardous healthcare waste, respectively.
Specific gravity of solid waste ranges from 400 - 580 kg/m3 such as in Ha Noi, 420 kg/m
3 in Da Nang;
580 kg/m3 in Hai Phong and 500 kg/m
3 in Ho Chi Minh City.
Table 4.4-2 summerized the generation of municipal solid waste in some cities in 2002 [6].
Table 4.4-2: Municipal solid waste generation rate in some urban areas in 2002
Waste volume per
capita % Compared to total
waste volume % Organic
composition
Urban areas (nationwide)
0,71 50 55

IV Waste Quantities and Characteristics 15
Ho Chi Minh City 1,3 9
Ha Noi 1,0 6
Da Nang 0,9 2
Rural areas (nationwide)
0,3 50 60 - 65
The big picture of Solid Waste Generation in Vietnam, 2003 is described in Table 4.4-3[7]. It is to noticed that the urban areas contain 25% of the country’s population but produce about 50% municipal waste. Waste is concentrated in urban areas. This is due to the more affluent lifestyles, larger quantity of commercial activities, and more intense industrialization found in urban areas. These activities also increase the proportion of hazardous waste (such as batteries and household solvents) and non-degradable waste (such as plastic, metal, and glass) found in urban waste. In contrast, people in rural areas produce municipal waste at less than half of the rate of those in urban areas (0.3 kg/person/day vs. 0.7 kg/person/day), and most of the waste (99 % of cultivation waste and 65 % of domestic waste vs. 50 % for urban domestic waste) is easily degradable organic waste (Figure 4.4-6).
Table 4.4-3: The big picture of Solid Waste Generation in Vietnam, 2003

IV Waste Quantities and Characteristics 16
Waste generation (by type)
Domestic waste
76%
Industrial&medical
hazardous waste
11%
Construction waste
9%
Sewer sludge
4%
Figure 4.4-6: Waste generation by type
4.4.2 Municipal solid waste
Composition of urban solid waste is very diverse and is characteristic for each town. Generally there are some common characteristics as composition of organic origin accounts for high rate (50.27% - 62.22%) it contains however a lot of soil, sand and fragment of brick, stone, etc; It has typically high moisture content, low specific heat energy (900 Kcal/Kg). Figure 4.4-7 presented composition of household waste in Hanoi [8].

IV Waste Quantities and Characteristics 17
Figure 4.4-7: Composition of household waste in Hanoi, 2005
The composition of domestic solid waste in some areas in the North Vietnam presented in Table 4.4-4and in other cities in Table 4.4-5[9].
Table 4.4-4: Composition of domestic solid waste in some areas in the North Vietnam 2003
IV Waste Quantities and Characteristics 18
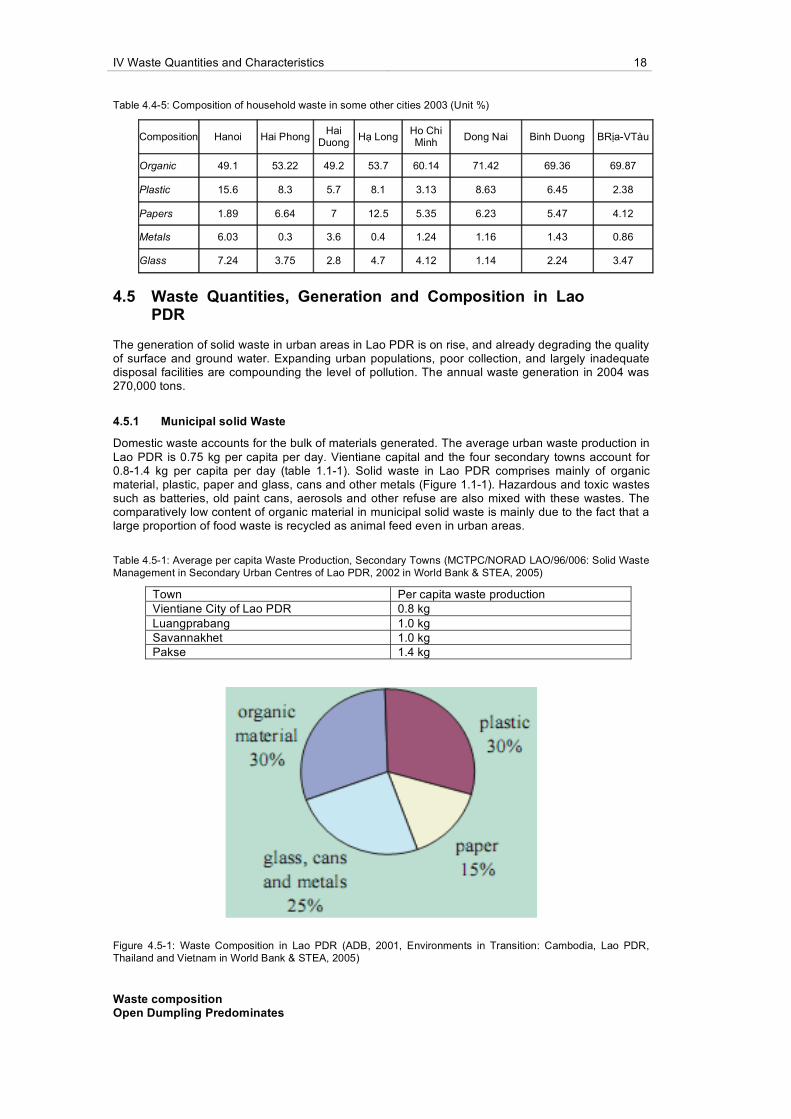
Table 4.4-5: Composition of household waste in some other cities 2003 (Unit %)
Composition Hanoi Hai Phong Hai
Duong H Long
Ho Chi Minh
Dong Nai Binh Duong BR a-VTàu
Organic 49.1 53.22 49.2 53.7 60.14 71.42 69.36 69.87
Plastic 15.6 8.3 5.7 8.1 3.13 8.63 6.45 2.38
Papers 1.89 6.64 7 12.5 5.35 6.23 5.47 4.12
Metals 6.03 0.3 3.6 0.4 1.24 1.16 1.43 0.86
Glass 7.24 3.75 2.8 4.7 4.12 1.14 2.24 3.47
4.5 Waste Quantities, Generation and Composition in Lao PDR
The generation of solid waste in urban areas in Lao PDR is on rise, and already degrading the quality of surface and ground water. Expanding urban populations, poor collection, and largely inadequate disposal facilities are compounding the level of pollution. The annual waste generation in 2004 was 270,000 tons.
4.5.1 Municipal solid Waste
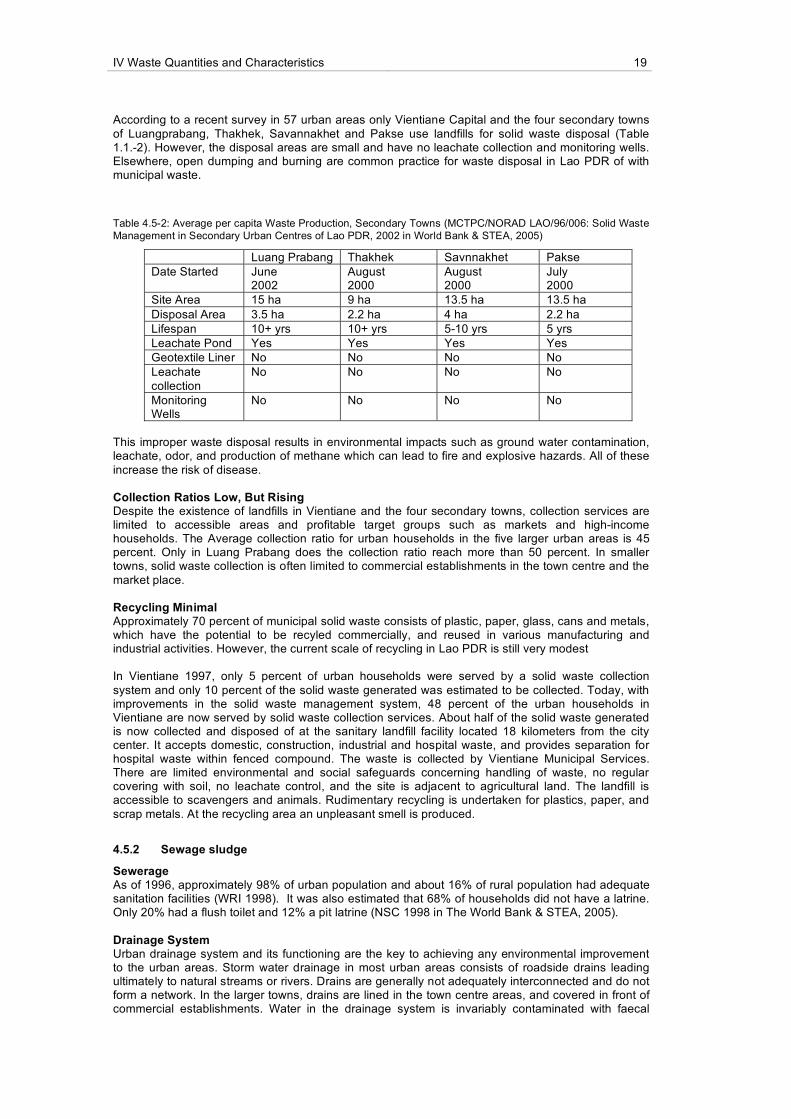
Domestic waste accounts for the bulk of materials generated. The average urban waste production in Lao PDR is 0.75 kg per capita per day. Vientiane capital and the four secondary towns account for 0.8-1.4 kg per capita per day (table 1.1-1). Solid waste in Lao PDR comprises mainly of organic material, plastic, paper and glass, cans and other metals (Figure 1.1-1). Hazardous and toxic wastes such as batteries, old paint cans, aerosols and other refuse are also mixed with these wastes. The comparatively low content of organic material in municipal solid waste is mainly due to the fact that a large proportion of food waste is recycled as animal feed even in urban areas.
Table 4.5-1: Average per capita Waste Production, Secondary Towns (MCTPC/NORAD LAO/96/006: Solid Waste Management in Secondary Urban Centres of Lao PDR, 2002 in World Bank & STEA, 2005)
Town Per capita waste production Vientiane City of Lao PDR 0.8 kg
Luangprabang 1.0 kg Savannakhet 1.0 kg Pakse 1.4 kg
Figure 4.5-1: Waste Composition in Lao PDR (ADB, 2001, Environments in Transition: Cambodia, Lao PDR, Thailand and Vietnam in World Bank & STEA, 2005)
Waste composition Open Dumpling Predominates
IV Waste Quantities and Characteristics 19
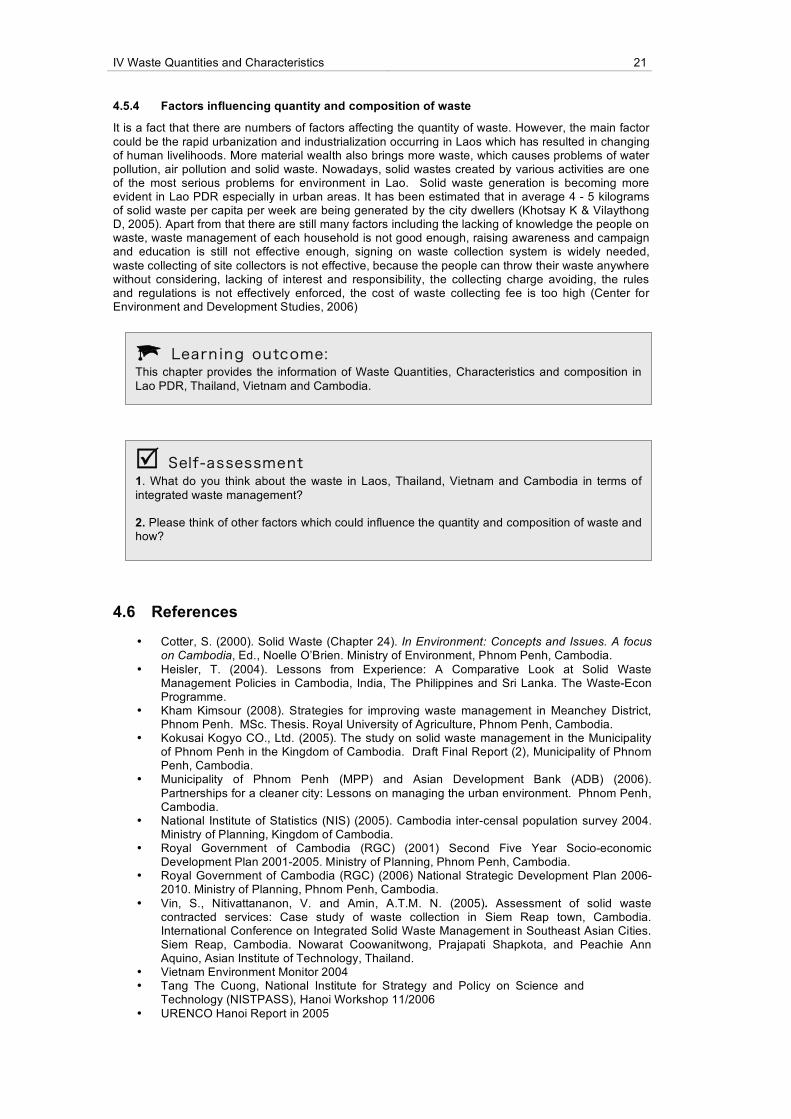
According to a recent survey in 57 urban areas only Vientiane Capital and the four secondary towns of Luangprabang, Thakhek, Savannakhet and Pakse use landfills for solid waste disposal (Table 1.1.-2). However, the disposal areas are small and have no leachate collection and monitoring wells. Elsewhere, open dumping and burning are common practice for waste disposal in Lao PDR of with municipal waste.
Table 4.5-2: Average per capita Waste Production, Secondary Towns (MCTPC/NORAD LAO/96/006: Solid Waste Management in Secondary Urban Centres of Lao PDR, 2002 in World Bank & STEA, 2005)
Luang Prabang Thakhek Savnnakhet Pakse Date Started June
2002 August 2000
August 2000
July 2000
Site Area 15 ha 9 ha 13.5 ha 13.5 ha
Disposal Area 3.5 ha 2.2 ha 4 ha 2.2 ha Lifespan 10+ yrs 10+ yrs 5-10 yrs 5 yrs Leachate Pond Yes Yes Yes Yes Geotextile Liner No No No No Leachate collection
No No No No
Monitoring Wells
No No No No
This improper waste disposal results in environmental impacts such as ground water contamination, leachate, odor, and production of methane which can lead to fire and explosive hazards. All of these increase the risk of disease. Collection Ratios Low, But Rising Despite the existence of landfills in Vientiane and the four secondary towns, collection services are limited to accessible areas and profitable target groups such as markets and high-income households. The Average collection ratio for urban households in the five larger urban areas is 45 percent. Only in Luang Prabang does the collection ratio reach more than 50 percent. In smaller towns, solid waste collection is often limited to commercial establishments in the town centre and the market place. Recycling Minimal Approximately 70 percent of municipal solid waste consists of plastic, paper, glass, cans and metals, which have the potential to be recyled commercially, and reused in various manufacturing and industrial activities. However, the current scale of recycling in Lao PDR is still very modest In Vientiane 1997, only 5 percent of urban households were served by a solid waste collection system and only 10 percent of the solid waste generated was estimated to be collected. Today, with improvements in the solid waste management system, 48 percent of the urban households in Vientiane are now served by solid waste collection services. About half of the solid waste generated is now collected and disposed of at the sanitary landfill facility located 18 kilometers from the city center. It accepts domestic, construction, industrial and hospital waste, and provides separation for hospital waste within fenced compound. The waste is collected by Vientiane Municipal Services. There are limited environmental and social safeguards concerning handling of waste, no regular covering with soil, no leachate control, and the site is adjacent to agricultural land. The landfill is accessible to scavengers and animals. Rudimentary recycling is undertaken for plastics, paper, and scrap metals. At the recycling area an unpleasant smell is produced.
4.5.2 Sewage sludge
Sewerage As of 1996, approximately 98% of urban population and about 16% of rural population had adequate sanitation facilities (WRI 1998). It was also estimated that 68% of households did not have a latrine. Only 20% had a flush toilet and 12% a pit latrine (NSC 1998 in The World Bank & STEA, 2005). Drainage System Urban drainage system and its functioning are the key to achieving any environmental improvement to the urban areas. Storm water drainage in most urban areas consists of roadside drains leading ultimately to natural streams or rivers. Drains are generally not adequately interconnected and do not form a network. In the larger towns, drains are lined in the town centre areas, and covered in front of commercial establishments. Water in the drainage system is invariably contaminated with faecal

IV Waste Quantities and Characteristics 20
matter from latrines and coliform septic tank effluent, presenting a very direct health risk (STEA 2000c in The World Bank & STEA, 2005). The absence of overall urban drainage plans with a functioning integrated network combined with the lack of clear arrangements for maintenance cause flooding and stagnant water pools over large parts of the urban centers. Investment on infrastructure improvements, as well as efforts to strengthen local resources for operation and maintenance, is not sufficiently aimed at the drainage networks in Lao PDR (STEA 2000c in The World Bank & STEA, 2005). In addition, technical support in the preparation of catchment area based drainage plans, with identification of final point of discharge, for the main urban centres have been lacking (STEA 2000c). Sewerage System None of the urban centers are serviced with a sewerage facility. All disposal of human waste occurs on-site. Except for some public facilities at markets and temple grounds, there are no public toilets in existence (STEA 2000c in The World Bank & STEA, 2005). Larger and more modern properties have septic tanks, with septic tank effluents (or overflow) often draining to roadside drains. Small private companies are known possessing vacuum desludging vehicles for the periodic cleaning of septic tanks in the larger urban centres, but operating data indicate very little usage made of such service. Older and lower-income houses use pit-latrines of various improvised types. In some of the traditional villages, households might not have any form of latrine (STEA 2000c in The World Bank & STEA, 2005). Sludge generally ends up in the open roadside drains, or infiltrates on site in the low-density areas. Table 5.1b presents census data on sanitation. Ground water contamination by wastewater from on-site sanitation systems such as septic tanks is often quoted as “becoming a serious issue”. There is no scientific evidence to support such claims (STEA 2000c in The World Bank & STEA, 2005), due to the lack of studies conducted for such purpose. Therefore, policies on urban wastewater management do not take such claims into consideration. Moreover, at the national level, no strategies have been formulated to outline the conditions under which a full or partial sewerage system should be considered for urban areas. In essence, no guidelines have been promulgated to assign responsibility or create manadatory conditions for the construction, operation and maintenance of sewerage systems in urban areas (STEA 2000c in The World Bank & STEA, 2005).
4.5.3 Industrial waste
As it is the fact that Lao PDR relies mainly on agriculture while only quite small faction on industries, the industrial waste produced seems to be inadequately concerned. However, there are some hazardous chemicals from industries the government have been taking into consideration Hazardous chemicals waste Hazardous chemicals of concern include heavy metals such as mercury, lead, cadmium, arsenic, chromium, copper, and zinc as well as persistent organic pollutants (POPs) such as dioxins and furans, polychlorinated biphenyls (PCBs), and various pesticides and herbicides that are now banned globally. At present their environmental impact is still poorly understood in Lao PDR. STEA initiated an inventory of hazardous chemicals in December 2003, and the National Hazardous Chemicals Strategy and Action Plan is currently being revised. Heavy Metal contamination results primarily from industrial activities, which are increasing significantly as the country develops. Of particular concern is lead production and rudimentary metal smelting facilities in the country, as well as releases of mercury, cyanide, copper, cadmium and other heavy metals from mining activities. Surface water quality in areas downstream of industrial and mining activities therefore needs to be carefully monitored to avoid potential human impacts. Persistent Organic Pollutants Presently, herbicides and pesticides are used only in moderate levels in Lao PDR, mostly as a result of low per-capita incomes and traditional agricultural practices in rural areas. However, there is evidence of banned pesticides and herbicides still being imported into Laos from neighboring countries, and dumping of empty barrels in landfills has been recorded in Vientiane Capital City and other major cites. There is a lack of baseline information on the extent of the problem in the country, and its potential effects on human health. PCBs are still found in old transformers throughout Lao PDR, but these are being phased out. PCB oils are now being adequately stored in the country, but there are concerns related to historical spills and dumping sites. Dioxin and furan contamination in Lao PDR occurs mainly from combustion of solid and industrial waste, burning of wood and oil for fuel, and forest fires. However, significant quantities of dioxin were also released during the Indochina War from the use of Agent Orange and other toxic herbicides. Dioxin residues many occur near the Vietnam border and along the former Ho Chi Minh Trail.
IV Waste Quantities and Characteristics 21
4.5.4 Factors influencing quantity and composition of waste
It is a fact that there are numbers of factors affecting the quantity of waste. However, the main factor could be the rapid urbanization and industrialization occurring in Laos which has resulted in changing of human livelihoods. More material wealth also brings more waste, which causes problems of water pollution, air pollution and solid waste. Nowadays, solid wastes created by various activities are one of the most serious problems for environment in Lao. Solid waste generation is becoming more evident in Lao PDR especially in urban areas. It has been estimated that in average 4 - 5 kilograms of solid waste per capita per week are being generated by the city dwellers (Khotsay K & Vilaythong D, 2005). Apart from that there are still many factors including the lacking of knowledge the people on waste, waste management of each household is not good enough, raising awareness and campaign and education is still not effective enough, signing on waste collection system is widely needed, waste collecting of site collectors is not effective, because the people can throw their waste anywhere without considering, lacking of interest and responsibility, the collecting charge avoiding, the rules and regulations is not effectively enforced, the cost of waste collecting fee is too high (Center for Environment and Development Studies, 2006)
4.6 References
• Cotter, S. (2000). Solid Waste (Chapter 24). In Environment: Concepts and Issues. A focus on Cambodia, Ed., Noelle O’Brien. Ministry of Environment, Phnom Penh, Cambodia.
• Heisler, T. (2004). Lessons from Experience: A Comparative Look at Solid Waste Management Policies in Cambodia, India, The Philippines and Sri Lanka. The Waste-Econ Programme.
• Kham Kimsour (2008). Strategies for improving waste management in Meanchey District, Phnom Penh. MSc. Thesis. Royal University of Agriculture, Phnom Penh, Cambodia.
• Kokusai Kogyo CO., Ltd. (2005). The study on solid waste management in the Municipality of Phnom Penh in the Kingdom of Cambodia. Draft Final Report (2), Municipality of Phnom Penh, Cambodia.
• Municipality of Phnom Penh (MPP) and Asian Development Bank (ADB) (2006). Partnerships for a cleaner city: Lessons on managing the urban environment. Phnom Penh, Cambodia.
• National Institute of Statistics (NIS) (2005). Cambodia inter-censal population survey 2004. Ministry of Planning, Kingdom of Cambodia.
• Royal Government of Cambodia (RGC) (2001) Second Five Year Socio-economic Development Plan 2001-2005. Ministry of Planning, Phnom Penh, Cambodia.
• Royal Government of Cambodia (RGC) (2006) National Strategic Development Plan 2006-2010. Ministry of Planning, Phnom Penh, Cambodia.
• Vin, S., Nitivattananon, V. and Amin, A.T.M. N. (2005). Assessment of solid waste contracted services: Case study of waste collection in Siem Reap town, Cambodia. International Conference on Integrated Solid Waste Management in Southeast Asian Cities. Siem Reap, Cambodia. Nowarat Coowanitwong, Prajapati Shapkota, and Peachie Ann Aquino, Asian Institute of Technology, Thailand.
• Vietnam Environment Monitor 2004 • Tang The Cuong, National Institute for Strategy and Policy on Science and
Technology (NISTPASS), Hanoi Workshop 11/2006 • URENCO Hanoi Report in 2005
Self-assessment 1. What do you think about the waste in Laos, Thailand, Vietnam and Cambodia in terms of integrated waste management? 2. Please think of other factors which could influence the quantity and composition of waste and how?
Learn ing outcome: This chapter provides the information of Waste Quantities, Characteristics and composition in Lao PDR, Thailand, Vietnam and Cambodia.

IV Waste Quantities and Characteristics 22
• Annual Environmental State Reports of DONREs 2005 • National Environment Agency Vietnam (NEA) and University of Agriculture
report, 1/2003 • World Bank Report 2003 • Information from practical training, 1
st Master Course at HUS, 2005
• CEETIA & Annual Environmental State Reports of DONREs 2003 • URENCOs Report in 2003 • Department of Transportation, Hanoi People Committee 2007 • National Environment Agency Vietnam Report, 2004 • Institute for Science and Environmental Technology, program KC 08-09 • The World Bank & STEA, 2005, Lao PDR Environment Monitor, pps 38,39,40 • Center for Environment and Development Studies, 2006, the study on the participation of
Nongtha Tai villagers in households waste management • Khotsay K & Vilaythong D, 2005, Regional training workshop on the inventory of
Hazardous Waste URL: www.basel.int/stratplan/oewg1/projdocs/indonesia/rpt-laos.doc -