4. The Y-12 National Security Complex - Energy.gov · the Central Training Facility, Uranium...
106
Y-12 National Security Complex 4-1 4. The Y-12 National Security Complex The Y-12 National Security Complex (Y-12 Complex), a premier manufacturing facility operated by Consolidated Nuclear Security, LLC (CNS), for the National Nuclear Security Administration (NNSA), plays a vital role in the U.S. Department of Energy (DOE) Nuclear Security Enterprise. Drawing on more than 70 years of manufacturing excellence, the Y-12 Complex helps ensure a safe and reliable United States nuclear weapons deterrent. The Y-12 Complex also retrieves and stores nuclear materials, fuels the nation’s naval reactors, and performs complementary work for other government and private-sector entities. Today’s environment requires that the Y-12 Complex has a new level of flexibility and versatility, so while continuing its key role, the Y-12 Complex has evolved to become the resource that the nation looks to for support in protecting America’s future by developing innovative solutions in manufacturing technologies, prototyping, safeguards and security, technical computing, and environmental stewardship. Because of differing permit-reporting requirements and instrument capabilities, various units of measurement are used in this chapter. The information found in “Units of Measure and Conversion Factors” is intended to help readers convert numeric values presented here as needed for specific calculations and comparisons. 4.1 Description of Site and Operations 4.1.1 Mission CNS manages and operates the Pantex Plant and the Y-12 Complex on behalf of NNSA. Together, these two sites are a core element of a sustainable and robust national nuclear deterrent. Charged with maintaining the safety, security, and effectiveness of the United States nuclear weapons stockpile, the Y-12 Complex is a one-of-a-kind manufacturing facility that plays an important role in United States national security. The Y-12 Complex’s core mission is to ensure a safe, secure, and reliable United States nuclear deterrent, which is essential to national security. Every weapon in the United States nuclear stockpile has components manufactured, maintained, or ultimately dismantled by the Y-12 Complex. Through life extension program activities, the Y-12 Complex produces refurbished, replaced, and/or upgraded weapons components to modernize the enduring stockpile. As the nation reduces the size of its arsenal, the Y-12 Complex has a central role in decommissioning weapons systems and providing weapons material for non-explosive, peaceful uses. The Y-12 Complex provides the expertise to secure highly enriched uranium (HEU), store it with the highest security, and make material available for non-weapons uses (e.g., in research reactors that produce cancer-fighting medical isotopes and in commercial power reactors). The Y-12 Complex also processes HEU from weapons removed from the nation’s nuclear weapons stockpile for use by the Naval Reactors program to fuel nuclear-powered submarines and aircraft carriers. Located within the city limits of Oak Ridge, Tennessee, the Y-12 Complex covers more than 328 ha (810 acres) in the Bear Creek Valley, stretching 4.0 km (2.5 mi) in length down the valley and nearly 2.4 km (1.5 mi) in width across it. NNSA-related facilities located offsite from the Y-12 Complex include
Transcript of 4. The Y-12 National Security Complex - Energy.gov · the Central Training Facility, Uranium...

Y-12 National Security Complex 4-1
4. The Y-12 National Security Complex
The Y-12 National Security Complex (Y-12 Complex), a premier manufacturing facility operated by Consolidated Nuclear Security, LLC (CNS), for the National Nuclear Security Administration (NNSA), plays a vital role in the U.S. Department of Energy (DOE) Nuclear Security Enterprise. Drawing on more than 70 years of manufacturing excellence, the Y-12 Complex helps ensure a safe and reliable United States nuclear weapons deterrent.
The Y-12 Complex also retrieves and stores nuclear materials, fuels the nation’s naval reactors, and performs complementary work for other government and private-sector entities.
Today’s environment requires that the Y-12 Complex has a new level of flexibility and versatility, so while continuing its key role, the Y-12 Complex has evolved to become the resource that the nation looks to for support in protecting America’s future by developing innovative solutions in manufacturing technologies, prototyping, safeguards and security, technical computing, and environmental stewardship.
Because of differing permit-reporting requirements and instrument capabilities, various units of measurement are used in this chapter. The information found in “Units of Measure and Conversion Factors” is intended to help readers convert numeric values presented here as needed for specific calculations and comparisons.
4.1 Description of Site and Operations
4.1.1 Mission
CNS manages and operates the Pantex Plant and the Y-12 Complex on behalf of NNSA. Together, these two sites are a core element of a sustainable and robust national nuclear deterrent.
Charged with maintaining the safety, security, and effectiveness of the United States nuclear weapons stockpile, the Y-12 Complex is a one-of-a-kind manufacturing facility that plays an important role in United States national security. The Y-12 Complex’s core mission is to ensure a safe, secure, and reliable United States nuclear deterrent, which is essential to national security. Every weapon in the United States nuclear stockpile has components manufactured, maintained, or ultimately dismantled by the Y-12 Complex. Through life extension program activities, the Y-12 Complex produces refurbished, replaced, and/or upgraded weapons components to modernize the enduring stockpile. As the nation reduces the size of its arsenal, the Y-12 Complex has a central role in decommissioning weapons systems and providing weapons material for non-explosive, peaceful uses. The Y-12 Complex provides the expertise to secure highly enriched uranium (HEU), store it with the highest security, and make material available for non-weapons uses (e.g., in research reactors that produce cancer-fighting medical isotopes and in commercial power reactors). The Y-12 Complex also processes HEU from weapons removed from the nation’s nuclear weapons stockpile for use by the Naval Reactors program to fuel nuclear-powered submarines and aircraft carriers.
Located within the city limits of Oak Ridge, Tennessee, the Y-12 Complex covers more than 328 ha (810 acres) in the Bear Creek Valley, stretching 4.0 km (2.5 mi) in length down the valley and nearly 2.4 km (1.5 mi) in width across it. NNSA-related facilities located offsite from the Y-12 Complex include

Oak Ridge Reservation Annual Site Environmental Report—2017
Y-12 National Security Complex 4-2
the Central Training Facility, Uranium Processing Facility (UPF) project offices, Y-12 Complex Shipping and Receiving, and the Union Valley Sample Prep Facility.
4.1.2 Modernization
Government-owned facilities and operations are becoming smaller, more efficient, and more responsive to changing national and global challenges. NNSA’s vision for a smaller, safer, more-secure, and less-expensive nuclear weapons complex must leverage the scientific and technical capabilities of its workforce while continuing to meet national security requirements. Nowhere in the National Security Enterprise is this more important than at the Y-12 Complex.
More than 60% of the Y-12 Complex mission-critical facilities are over 70 years old (Figure 4.1). To address this situation, the Y-12 Complex has been consolidating operations, modernizing facilities and infrastructure, and reducing the legacy footprint for more than a decade. These actions are consistent with and supportive of NNSA enterprise transformation planning. Through continued infrastructure projects, new construction, and the disposition of excess facilities, the Y-12 Complex will continue to strive toward becoming a more responsive, sustainable enterprise. As evidenced by the performance achievements presented in this chapter, the Y-12 Complex continues to meet the challenges of declining budgets through enhanced security measures, enhanced technology, and innovative business practices.
Figure 4.1. Age of mission-critical facilities at the Y-12 National Security Complex
Replacement and revitalization are key elements of the modernization strategy at the Y-12 Complex. A significant number of facilities at the Y-12 Complex are at or beyond design life. Construction at UPF continues to make good progress, and replacement projects for several additional facilities are in the critical design process.
4.1.3 Enriched Uranium Operations
The Y-12 Complex’s core manufacturing and processing operations are housed in decades-old buildings that are near or past the end of their expected life spans.
UPF will be an integral part of the Y-12 Complex transformation efforts and a key component of the NNSA Uranium Center of Excellence. UPF will be a modern manufacturing facility designed and constructed for health, safety, security, and operations efficiency. In Fiscal Year (FY) 2014, NNSA

Oak Ridge Reservation Annual Site Environmental Report—2017
Y-12 National Security Complex 4-3
commissioned a Project Peer Review Team to assess the progress and opportunities for the UPF project. This evaluation produced a number of recommendations to refocus the project to a smaller footprint and to relocate various processes to existing facilities.
When the current UPF construction is complete, it will replace a portion of HEU production functions. The remaining HEU production capability will be transitioned to Bldgs. 9215 and 9204-02E, which must be sustained to achieve the HEU mission strategy. The strategy includes the following:
• accelerating transition out of Bldg. 9212 by 2025 to reduce nuclear safety and operational risk while maintaining enriched uranium capabilities;
• integrating evaluation of alternatives for delivery of UPF that prioritizes replacement capabilities according to risk to nuclear safety, security, and mission continuity;
• substantially improving the needed Y-12 Complex infrastructure over the next decade at a risk-based annual funding level that supports safe and secure operations; and
• prioritizing replacement capabilities by risk-to-mission continuity, nuclear safety, and security.
4.1.4 Lithium Production Capability
The lithium production equipment and facilities at the Y-12 Complex have degraded to the point that repair is no longer an option. Thus, to ensure continued mission availability and to reduce annual operating costs, the lithium capability must be replaced. Production work for lithium and related non-nuclear special material vital to production of canned subassemblies is performed in Bldg. 9204-2, built in 1944. The facility (at approximately 325,000 ft2) is oversized for today’s mission, and for decades, concrete on the inside and outside of the building has deteriorated. The roof, walls, and ceilings have been exposed to corrosive liquids and processing fumes, which have caused significant deterioration to the concrete. Separation of the concrete and rebar poses a realized risk of falling concrete, which requires administrative controls, including restricted access and protective equipment in many areas. The facility, currently carrying approximately $31million (M) in deferred maintenance, could be replaced by a new facility less than one fourth its size. Site production risk assessments rate two of the lithium processes as the highest equipment risks at the Y-12 Complex. Critical process equipment (hydraulic press) failures caused “code blue,” or immediate, repair efforts to minimize the negative impact on delivery schedules of directed stockpile work (DSW) components. The inability to control humidity due to aged and inoperable heating, ventilating, and air-conditioning (HVAC) equipment has caused recurrent lost work days, negatively affecting DSW costs and life extension program schedules. Construction and replacement activities are underway for the HVAC equipment.
4.1.5 Support Facilities
Emergency response capabilities at the Y-12 Complex reside in five primary facilities: four located onsite (Bldgs. 9706-2, 9105, 2005, and 9710-2), and one (Bldg. K-1650) located at the East Tennessee Technology Park (ETTP). Building 9706-2 houses the Plant Shift Superintendent (PSS) and the Emergency Control Center. The Technical Support Center (TSC) was relocated to Bldg. 9105 due to a flood event in Bldg. 9706-02 in 2014. Building 9710-2 is the principal facility housing Fire Protection Operations, with a back-up facility (2005) located on the west end. Building K-1650 houses the Command Center/alternate Emergency Operations Center (EOC). A line-item project for construction of a new EOC, scheduled to begin in 2018, includes the replacement of the PSS, TSC, and Emergency Response Center. The proposed EOC will more effectively and efficiently support the Y-12 Complex missions by consolidating emergency-response capabilities into a habitable, survivable facility that also provides space for a technical support team.
Oak Ridge Reservation Annual Site Environmental Report—2017
Y-12 National Security Complex 4-4
Built in 1948, Bldg. 9710-2 houses the Fire Station and the Fire Department Alarm Room. The overflow station for the fire department is located in Bldg. 2005, at the far west end of the plant.
Building 9710-02 is located within the most highly protected area of the plant and close to the Y-12 Complex’s most hazardous operations. Seismic, tornado, hazardous material release, and security events could render the fire station inaccessible. Off-duty personnel augment the duty staff, and thus, their access to the facility is critical. Although upgrades have been performed over the years, the Fire Protection Operations facility has exceeded its useful life and needs to be replaced.
Building 2005 was constructed in 1980 and was originally occupied by the Oak Ridge Reservation (ORR) roads and grounds crew. The fire department assumed occupancy of the facility in 2014 and renovated portions for crew support and vehicle staging. Relocation of the fire station away from Y-12 Complex hazardous material facilities is necessary to ensure that the fire department can respond safely and effectively to all emergencies at the Y-12 Complex. A proposed new fire station is planned for construction beginning in 2019. The new facility will be located on the east end of the plant and is designed to meet current codes and functional requirements.
Over the next 20-year horizon, the Y-12 Complex will continue to consolidate personnel and processes in support of the vision for long-range footprint reduction and modernization. The planned construction at the Y-12 Complex would eliminate many of the World War II-vintage buildings that currently house the nuclear operations. The following projects are currently under construction or are being initiated during the Future Year Nuclear Security Plan period:
• UPF, • New 13.8kV Substation, • EOC, • West End Protected Area Reduction, • Fire Station, • Lithium Production Capability, • Bridging Strategy for Bldgs. 9215 and 9204-02E, and • West End Change House.
The following projects are planned for completion beyond the Future Year Nuclear Security Plan period:
• Applied Technologies Laboratory, • Security Support Complex, • Consolidated Manufacturing Capability, • Maintenance Complex, • Non-Special Nuclear Material Storage and Staging Facility, • Waste Management Complex, • Bldg. 9215 Replacement Capability, and • Bldg. 9204-02E Replacement Capability.

Oak Ridge Reservation Annual Site Environmental Report—2017
Y-12 National Security Complex 4-5
4.1.6 Excess Facility Disposition
Since 2002, the Y-12 Complex has demolished more than 1.4M ft2 of excess facilities. Currently, more than 80 excess DOE facilities are located on the Y-12 Complex site. The excess facilities are owned by NNSA and the DOE Office of Environmental Management (OREM), Office of Science, and Office of Nuclear Energy. Process-contaminated excess facilities contain radiological or chemical contamination resulting from their mission operations during the Manhattan Project or the Cold War.
OREM, through its contractors, is responsible for decommissioning and demolishing the legacy contaminated facilities.
Non-process-contaminated excess facilities generally do not contain radiological or chemical contamination from mission operations but may contain hazardous industrial materials associated with their construction materials (e.g., asbestos insulation, paint containing lead, or oil contaminated with polychlorinated biphenyls [PCBs]). The non-process-contaminated excess facilities will be deactivated by NNSA and decommissioned by NNSA or OREM, depending on the cost and complexity.
The NNSA Facilities Disposition Program will continue to evaluate facilities, prioritize their disposition, develop cost and schedule, and communicate requirements for disposal of excess facilities. Without a defined program to eliminate excess facilities, the Y-12 Complex will continue to use limited resources to safely maintain those facilities that no longer have a mission or enduring use.
4.2 Environmental Management System As part of CNS’s commitment to environmentally responsible operations, the Y-12 Complex has implemented an Environmental Management System (EMS) based on the rigorous requirements of the globally recognized International Organization of Standardization (ISO) 14001:2004 standard to plan, implement, control, and continually improve environmental performance at the Y-12 Complex.
DOE Order (O) 436.1, Departmental Sustainability (DOE 2011a), provides requirements and responsibilities for managing sustainability within DOE in accordance with applicable Executive Orders (EOs). DOE O 436.1 further requires implementation of an EMS that is either registered to the requirements of ISO 14001 by an accredited ISO 14001 registrar or self-declared to be in conformance to the standard in accordance with instructions issued by the Office of the Federal Environmental Executive, a chartered task force under the White House Council on Environmental Quality. The Y-12 Complex has maintained an EMS with self-declared conformance to ISO 14001 since 2006.
The EMS requirements taken from DOE O 436.1 have been incorporated into the Environmental Protection functional area of the Y-12 Complex Contractor Assurance System.
4.2.1 Integration with Integrated Safety Management System
The Y-12 Complex Integrated Safety Management System (ISMS) is the basis for planning and implementing environment, safety, and health (ES&H) programs and systems that provide the necessary structure for any work activity that could affect the public, a worker, or the environment. At the Y-12 Complex, the elements of the ISO 14001 EMS are incorporated in and are consistent with the ISMS to achieve environmental compliance, pollution prevention, waste minimization, resource conservation, and sustainability. Both the ISMS and EMS are based on an internationally recognized cycle of continual improvement commonly known as the “plan-do-check-act” cycle, as depicted in Figure 4.2, which shows the relationship between the ISMS and the integrated EMS.

Oak Ridge Reservation Annual Site Environmental Report—2017
Y-12 National Security Complex 4-6
Figure 4.2. Relationship between the Y-12 National Security Complex Environmental Management
System and the Integrated Safety Management System depicted in a “plan-do-check-act” cycle
4.2.2 Policy
The Y-12 Complex environmental policy and commitment to providing sound environmental stewardship practices through the implementation of an EMS have been defined, are endorsed by top management, and have been made available to the public via company-sponsored forums and public documents such as this one. The Y-12 Complex ES&H policy is presented in Figure 4.3.

Oak Ridge Reservation Annual Site Environmental Report—2017
Y-12 National Security Complex 4-7
Figure 4.3. Y-12 National Security Complex environment, safety, and health policy
The Y-12 Complex ES&H policy has been communicated to all employees and is incorporated into mandatory training for every employee; it is available for viewing on the Y-12 Complex external website and on the internal Y-12 Complex website. Y-12 Complex personnel are made aware of the commitments stated in the policies and how the commitments relate to Y-12 Complex work activities.
4.2.3 Planning
4.2.3.1 Y-12 National Security Complex Environmental Aspects Environmental aspects may be thought of as potential environmental hazards associated with a facility operation, maintenance job, or work activity. The environmental aspects and their impacts (potential effects on the environment) are evaluated to ensure that the significant aspects of Y-12 Complex activities that are identified continue to reflect stakeholder concerns and changes in regulatory requirements. The EMS provides the system to ensure that environmental aspects are systematically identified, monitored, and controlled to mitigate or eliminate potential impacts to the environment.

Oak Ridge Reservation Annual Site Environmental Report—2017
Y-12 National Security Complex 4-8
The analysis identified the following as significant environmental aspects in 2017:
• air emissions; • greenhouse gas (GHG) emissions
(scopes 1 and 3);
• surface water and storm water; • aging infrastructure and equipment;
• wastewater/groundwater; • legacy contamination and disturbance; • excess facilities and unneeded materials and
chemicals; • universal waste and other recycled streams;
• hazardous or mixed wastes; • energy consumption (Scope 2 GHGs); and • radiological waste; • potable water use;
• clearing, grading, or excavation (non-quarantined soil).
4.2.3.2 Legal and Other Requirements To implement the compliance commitments of the ES&H policy and to meet legal requirements, systems are in place to review changes in Federal, State, or local environmental regulations and to communicate those changes to affected staff. The environmental compliance status is documented each year in this report (see Section 4.3).
4.2.3.3 Objectives, Targets, and Environmental Action Plans CNS responds to change and pursues sustainability initiatives at the Y-12 Complex by establishing and maintaining environmental objectives, targets (goals), and action plans. Goals and commitments are established annually. They are consistent with the Y-12 Complex’s mission, budget guidance, ES&H work scope, DOE sustainability goals, site incentive plans, and continuous improvement goals. Targets and action plans are established for broad objectives to pursue improvement in environmental performance in five areas: clean air; energy efficiency; hazardous materials; stewardship of land and water resources; and waste reduction, recycling, and buying green. Highlights of the 2017 environmental targets achieved at the Y-12 Complex are presented in Section 4.2.6.1.
4.2.3.4 Programs NNSA has developed and funded several important programs to integrate environmental stewardship into all facets of Y-12 Complex missions. The programs also address the requirements in DOE Orders for protecting various environmental media, reducing pollution, conserving resources, and helping to promote compliance with all applicable environmental regulatory requirements and permits.
Environmental Compliance The Y-12 Complex Environmental Compliance Department (ECD) provides environmental technical support services and oversight for Y-12 Complex line organizations to ensure that site operations are conducted in a manner that is protective of workers, the public, and the environment; in compliance with applicable standards, DOE Orders, environmental laws, and regulations; and consistent with CNS environmental policy and Y-12 Complex site procedures. ECD serves as the Y-12 Complex interpretive authority for environmental compliance requirements and as the primary point of contact between the Y-12 Complex and external environmental compliance regulatory agencies such as the City of Oak Ridge, the Tennessee Department of Environment and Conservation (TDEC), and the U.S. Environmental Protection Agency (EPA). ECD administers compliance programs aligned with the major environmental legislation that affects Y-12 Complex activities. Compliance status and results of monitoring and measurements conducted for these compliance programs are presented in this document.

Oak Ridge Reservation Annual Site Environmental Report—2017
Y-12 National Security Complex 4-9
ECD also maintains and ensures implementation of the Y-12 Complex EMS and spearheads initiatives to proactively address environmental concerns, to continually improve environmental performance, and to exceed compliance requirements.
Waste Management The Y-12 Complex Waste Management Program supports the full life cycle of all waste streams within the Y-12 Complex. While ensuring compliance with Federal and State regulations, DOE Orders, waste acceptance criteria, and Y-12 Complex procedures and policies, the Waste Management Program provides services for day-to-day solid and liquid waste operations, including collection and transport, storage, on-site treatment operations, and shipment to off-site treatment/disposal. The program also provides technical support to Y-12 Complex operations for waste planning, characterization, packaging, tracking, reporting, and managing waste treatment/disposal subcontracts.
Sustainability and Stewardship The Sustainability and Stewardship Program has two major missions. The first is to establish and maintain companywide programs and services to support sustainable material management operations. These sustainable operations include pollution prevention and recycling programs, excess materials programs, generator services programs, and facility destruction and recycling operations. The Y-12 Complex has implemented continuous improvement activities, such as a “Stuff I Want to Get Rid of” website and a central telephone number (574-JUNK), to provide employees easy access to information and assistance related to the proper methods for disposing of excess materials.
The second mission is stewardship practices, the programs that manage legacy issues and assist in preventing the development of new problematic issues. Stewardship programs include Clean Sweep and Unneeded Materials and Chemicals (UMC). The Clean Sweep Program provides turnkey services to material generators, including segregation, staging, and pickup of materials for excess, recycle, and disposal. “Sustain” areas have been established across the site to improve housekeeping through efficient material disposition. Customers place unneeded items into the transition portion of each Sustain area and Clean Sweep Program personnel take care of the rest.
Combining these programs under a single umbrella improves overall compliance with EOs, DOE Orders, State and Federal regulations, and NNSA expectations and eliminates duplication of efforts while providing an overall improved appearance at the Y-12 Complex.
Additionally, the implementation of these programs directly supports EMS objectives and targets to disposition UMC, continually improve recycle programs by adding new recycle streams as applicable, improve sustainable acquisition (i.e., promote the purchase of products made with recycled content and biobased products, including alternative fuels such as E85), meet sustainable design requirements, and adhere to pollution prevention reporting requirements.
Energy Management The mission of the Y-12 Complex Energy Management Program is to incorporate energy-efficient technologies site-wide and to position the Y-12 Complex to meet NNSA energy requirement needs. The program identifies improvements in energy efficiency in facilities, coordinates energy-related efforts across the site, and promotes employee awareness of energy conservation programs and opportunities. The Y-12 Complex is committed to achieving the sustainable energy and transportation goals established in EO 13693.
Sustainability goals, goal performance, and goal achievement are defined and tracked within the DOE Sustainability Dashboard.

Oak Ridge Reservation Annual Site Environmental Report—2017
Y-12 National Security Complex 4-10
4.2.4 Implementation and Operation
4.2.4.1 Roles, Responsibility, and Authority The safe, secure, efficient, and environmentally responsible operation of the Y-12 Complex requires the commitment of all personnel. All personnel share the responsibility for successful day-to-day accomplishment of work and the environmentally responsible operation of the Y-12 Complex.
Environmental and Waste Management technical support personnel assist the line organizations with identifying and carrying out their environmental responsibilities. Additionally, the Environmental Officer Program is in place to facilitate communication of environmental regulatory requirements and to promote EMS as a tool to drive continual environmental improvement at the Y-12 Complex. Environmental officers coordinate their organizations’ efforts to maintain environmental regulatory compliance and to promote other proactive improvement activities.
4.2.4.2 Communication and Community Involvement The Y-12 Complex is committed to keeping the community informed on operations, environmental concerns, safety, and emergency preparedness. The Community Relations Council, composed of 20 members from a cross-section of the community, including environmental advocates, neighborhood residents, Y-12 Complex retirees, and business and government leaders, serves to facilitate communication between the Y-12 Complex and the community. The council provides feedback to the Y-12 Complex regarding its operations and ways to enhance community and public communications. The Y-12 Complex sponsored the Great Smoky Mountains National Park and the East Tennessee Foundation, and supported the expansion of a Girls, Inc., program that promotes science, technology, engineering, and mathematics.
As part of the Y-12 Complex America Recycles Day activities, four local charities received $200 donations from funds raised by the Y-12 Complex employee aluminum beverage can recycling efforts. Since the program began in 1994, more than $86,400 raised by the collection of aluminum beverage cans has been donated to various local charities.
The Y-12 Complex continues to promote sustainable behaviors for environmental improvements at the site and within the community. As a part of Earth Day activities, LiveWise personnel again collected gently used athletic shoes to support the Modular Organic Regenerative Environments Foundation Group. Personal eye glasses were also collected for donation. A United Way Coat and Toiletries Drive is conducted annually to provide coats and other needed items for the Volunteer Ministry Center for the Homeless. These activities reflect Y-12 Complex employees’ commitment to reduce landfill waste and to support community outreach.
4.2.4.3 Emergency Preparedness and Response Local, State, and Federal emergency response organizations are fully involved in the Y-12 Complex emergency drill and exercise program. The annual drill and exercise schedule is coordinated with all organizations to ensure maximum possible participation. At a minimum, the Tennessee Emergency Management Agency (TEMA) Operations Office and the DOE Headquarters Watch Office participate in all Y-12 Complex emergency response exercises.
Three exercises, 1 performance drill, and 17 training drills were conducted at the Y-12 Complex during FY 2017. The drills and exercises focused on topics such as responding to a hazardous chemical release, natural disaster, radiological fire and release, active shooter event, and a criticality event. Seven building evacuation and accountability drills were also conducted.

Oak Ridge Reservation Annual Site Environmental Report—2017
Y-12 National Security Complex 4-11
Y-12 Complex expertise in emergency management continues to be recognized within DOE. Members of the Emergency Management Program Office staff participated in the DOE Emergency Management Issues Special Interest Group Conference, held in Las Vegas, Nevada, in May 2016. The Y-12 Complex staff made presentations, participated in steering committee meetings, and distributed Y-12 Complex Emergency Management Program information to other DOE facility’s emergency management professionals.
4.2.5 Checking
4.2.5.1 Monitoring and Measurement The Y-12 Complex maintains procedures to monitor overall environmental performance and to monitor and measure key characteristics of its operations and activities that can have a significant environmental impact. Environmental effluent and surveillance monitoring programs are well established, and results of 2017 program activities are described throughout this chapter. Progress in achieving environmental goals is reported as a monthly metric on Performance Track, the senior management web portal that consolidates and maintains Y-12 Complex site-level performance. Progress is reviewed in periodic meetings with senior management and the NNSA Production Office (NPO).
4.2.5.2 Environmental Management System Assessments To periodically verify that EMS is operating as intended, assessments are conducted as part of the Y-12 Complex internal assessment program. The assessments are designed to ensure that nonconformities with ISO 14001 are identified and addressed.
The Environmental Assessment Program comprises several types of assessments, each type serving a distinct but complementary purpose. Assessments range from informal observations of specific activities to rigorous audits of site-level programs.
To self-declare conformance to ISO 14001 in accordance with instructions issued by the Federal Environmental Executive and adhere to DOE O 436.1 (DOE 2011a) requirements, EMS must be audited at least every 3 years by a qualified party outside of the control or scope of EMS. To fulfill this requirement, a four-person audit team from The University of Tennessee Center for Industrial Services evaluated the Y-12 Complex EMS during May 11 through 14, 2015. The Y-12 Complex EMS was found to fully conform, and no issues were identified. The next external verification audit is scheduled for spring 2018.
4.2.6 Performance
The EMS objectives and targets and other plans, initiatives, and successes that work together to accomplish DOE goals and reduce environmental impacts are discussed in this section. The Y-12 Complex used a number of DOE reporting systems, including the following, to report performance:
• Federal Automotive Statistical Tool, which collects fleet inventory and fuel use. • The DOE Sustainability Dashboard, which collects data on metering requirements, water use,
renewable energy generation and purchases, GHG generation, and sustainable buildings. Pollution prevention waste reduction and recycling data, sustainable acquisition product purchases, electronic stewardship, and best practices data are also collected in this Dashboard system.

Oak Ridge Reservation Annual Site Environmental Report—2017
Y-12 National Security Complex 4-12
The DOE Office of Health, Safety, and Security annual environmental progress reports on implementation of EMS requirements and sustainability goals driven by EOs and the Office of Management and Budget’s (OMB’s) Environmental Stewardship Scorecard gave the Y-12 Complex an EMS scorecard rating for FY 2017 of green, indicating full implementation of EMS requirements.
4.2.6.1 Environmental Management System Objectives and Targets At the end of FY 2017, the Y-12 Complex had achieved 7 of 14 targets that had been established; the remaining targets were carried into future years. Overall, 17 actions were completed through September 2017. Highlights include the following, with additional details and successes presented in other sections of this report:
• Clean Air—The Y-12 Complex finalized the evaluation of its uranium monitored-stack infrastructure to identify refurbishment needs for continued safe and compliant operations. Significant progress in obtaining a new Title V air permit was made.
• Energy Efficiency—Implementation of five Energy Savings Performance Contract (ESPC) energy conservation measures (ECMs) began in FY 2014 for projects to improve lighting, chilled water, air compressors, and the Y-12 Complex steam system. The five projects were completed in 2017. Significant progress was made on the effort to obtain Leadership in Energy and Environmental Design (LEED) certification on the UPF Construction Support Building. LEED awarded a Silver Certification, with the additional credit points required for obtaining a Gold Certification pending occupancy.
• Hazardous Materials—A project to improve controls for SeaLand storage containers was substantially implemented in 2017, with the contents of more than one-half of the 128 excess Sealand containers dispositioned or disposed. A project to disposition and ship nine items of legacy mixed waste per Site Treatment Plan milestones was completed in 2017.
• Reduce/Reuse/Recycle/Buy Green—The Y-12 Complex completed a project to strengthen the site-wide procedure for handling of universal waste in 2017 and began a project to install a drum crusher in one facility to greatly reduce the quantity of empty drum waste.
4.2.6.2 Sustainability and Stewardship Numerous efforts at the Y-12 Complex have reduced its impact on the environment. Efforts include increased use of environmentally friendly products and processes and reductions in waste and emissions. During the past few years, these efforts have been recognized by our customers, our community, and other stakeholders (see Section 4.2.7). Pollution prevention efforts at the Y-12 Complex have not only benefited the environment but have also resulted in cost efficiencies (Figure 4.4).

Oak Ridge Reservation Annual Site Environmental Report—2017
Y-12 National Security Complex 4-13
Figure 4.4. Cost efficiencies from Y-12 National Security Complex pollution prevention activities
In FY 2017, the Y-12 Complex implemented 101 pollution prevention initiatives (Figure 4.5), with a reduction of more than 32.8M lb of waste and cost efficiencies of more than $1.5M. The completed projects include the activities described below.
Figure 4.5. Y-12 National Security Complex pollution prevention initiatives
Pollution Prevention/Source Reduction Sustainable initiatives have been embraced across the Y-12 Complex to reduce the impact of pollution on the environment and to increase operational efficiency. Many of the Y-12 Complex sustainable initiatives have pollution prevention benefits or targets eliminating the source of pollution, including the 2017 activities highlighted in this section.
01234567
2002 2003 2004 2005 2006 2007 2008 2009 2010 2011 2012 2013 2014 2015 2016 2017
Mill
ions
of D
olla
rs
Fiscal Year
0
20
40
60
80
100
120
2002200320042005200620072008200920102011201220132014201520162017
Num
ber o
f Act
iviti
es C
ompl
eted
Fiscal Year

Oak Ridge Reservation Annual Site Environmental Report—2017
Y-12 National Security Complex 4-14
Sustainable Acquisition—Environmentally Preferable Purchasing Sustainable products, including recycled-content materials, are procured for use across the Y-12 Complex. In 2017, the Y-12 Complex procured recycled-content materials valued at more than $14.2M for use at the site.
Solid Waste Reduction At the Y-12 Complex, unneeded materials are not automatically assumed to be wastes requiring disposal. The Y-12 Complex uses a systematic disposition evaluation process. The first step in the disposition process is to determine if the items can be reused at the Y-12 Complex. Items that cannot be reused at the Y-12 Complex are evaluated for use at other DOE facilities or government agencies. Items are then evaluated for potential sale; recycle; or, as a last resort, disposal as waste. There is not a waste-to-energy facility for non-hazardous solid municipal or construction and demolition waste in Tennessee.
In 2017, the Y-12 Complex diverted 47.6% of municipal and 89.5% of construction and demolition waste from landfill disposal through reuse and recycle. The Y-12 Complex diverted more than 1.9M lb of municipal materials from landfill disposal through source reduction, reuse, and recycling in FY 2017. More than 29.4M lb of construction and demolition materials were diverted from landfill disposal in FY 2017. UPF added concrete as a new recycle stream for the site in FY 2017 to further waste diversion efforts.
Hazardous Chemical Minimization The Generator Services Group provides a material disposition management service for generators at the Y-12 Complex, which includes the technical support aspect to assist generators with a determination of whether or not the materials can be recycled, excessed, or reused rather than determining that all materials received must be declared as a waste. Generator Services Group can be used by any department or generator at the Y-12 Complex. During FY 2017, Generator Services Group personnel, rather than declaring materials as waste, reused or disseminated to other Y-12 Complex organizations for reuse, various excess materials and chemicals. In FY 2017, Generator Services Group prevented the generation of more than 1,800 lb of waste by transferring materials for on-site reuse.
Recycling The Y-12 Complex has a well-established recycling program and continues to identify new material streams and expand the types of materials that can be recycled by finding new markets and outlets for the materials. As shown in Figure 4.6, more than 2.65M lb of materials was diverted from landfills and into viable recycle processes during 2017. Currently, recycled materials range from office-related materials to operations-related materials, such as scrap metal, tires, and batteries. The Y-12 Complex adds at least one new recycle stream to the Recycle Program each year to continue to increase the waste diversion rate. Three-dimensional printer cartridges were added in FY 2017 to broaden waste diversion efforts.

Oak Ridge Reservation Annual Site Environmental Report—2017
Y-12 National Security Complex 4-15
Figure 4.6. Y-12 National Security Complex recycling results
4.2.6.3 Energy Management The mission of the Y-12 Complex Energy Management Program is to incorporate energy-efficient technologies site-wide and to position the Y-12 Complex to meet NNSA energy requirement needs through 2025 and beyond. The program identifies improvements in energy efficiency in facilities, coordinates energy-related efforts across the site, and promotes employee awareness of energy conservation programs and opportunities. The Y-12 Complex is committed to achieving the sustainable energy and transportation goals established in EO 13693, Planning for Federal Sustainability in the Next Decade.
EO 13693 established a goal of reducing building energy intensity by 25% by 2025 from a FY 2015 baseline. The Y-12 Complex exceeded the FY 2017 goal by achieving an 8% reduction in energy intensity (Figure 4.7).
Figure 4.7. Y-12 National Security Complex has achieved an 8% reduction in energy intensity from the Fiscal Year 2015 baseline
00.5
11.5
22.5
33.5
44.5
2003 2004 2005 2006 2007 2008 2009 2010 2011 2012 2013 2014 2015 2016 2017Mill
ions
of P
ound
s
Fiscal Year

Oak Ridge Reservation Annual Site Environmental Report—2017
Y-12 National Security Complex 4-16
Significant reductions have been noted with the implementation of ESPCs at the Y-12 Complex. Specific ESPC initiatives that aided in the reduction of energy consumption at the Y-12 Complex during FY 2017 included:
• Completing the new Air Compressor Plant at the end of FY 2016. This plant saves electricity and maintenance by better matching the demand load for instrument air with the amount of air being produced.
• Continuing to upgrade light fixtures with light-emitting diode and T-8 fluorescent lighting. • Replacing steam with natural gas. • Upgrading chillers with new high-efficiency variable speed modes, retrofitting existing chillers
with efficient controls, replacing constant-speed chilled water pumps with a variable-speed type, replacing tower pumps, steam controls, and control valves.
• Replacing Cooling Towers.
Additional energy reductions will be required in numerous areas to fully reduce energy use across the plant. Both facility management and utilities management are focusing on improvements to achieve the goal. Efforts that are fully incorporated into planning activities for facilities include the following:
• Energy Independence and Securities Act (EISA) assessments are included in annual reporting; • ECMs from both EISA and the ESPC process are included in budgeting reviews; and • Low-cost/no-cost efforts, including component replacements, are incorporated into routine
activities. These include upgrades such as new control valves, leak repairs, and new faucets.
Future reductions may be challenging due to a projected increase in the site’s energy intensity. Current projections indicate increases once UPF goes on line, but they may be partially offset by an accelerated demolition program.
The following efforts are planned to ensure continued site success for energy reduction:
• Complete implementation of ESPC Delivery Order 3 (construction phase of ESPC throughout FY 2017), including lighting upgrades.
• Consolidate data centers, per OMB’s definition, and install electric meters. • Continue installation of advanced metering as funding becomes available. • Continue facility upgrades for high-performance sustainable building (HPSB) compliance and
implement building retro-commissioning. • Continue implementation of cool roof applications. • Encourage energy reduction through tenant awareness, including training and monthly meter
reporting.
Energy Monitoring Comprehensive water and energy audits at the Y-12 Complex are performed to meet EISA Section 432. The audits evaluate energy and water use and identify opportunities to reduce use. The audits are performed by a certified energy auditor. The implementation costs for the ECMs are developed using the Condition Assessment Information System database. Energy projects are included in out-year planning for the site, and with adequate return on investment, will be funded. Specific examples include HVAC replacements and lighting upgrades in HPSB candidate facilities.
Oak Ridge Reservation Annual Site Environmental Report—2017
Y-12 National Security Complex 4-17
The Y-12 Complex currently has numerous standard and advanced electrical meters located on various facilities throughout the site. The actual electricity costs for the Y-12 Complex are based on total energy consumption, as defined by the Tennessee Valley Authority (TVA) revenue meters in the ELZA 1 substation. The Y-12 Complex does not use a space chargeback system, and individual building metering is not currently used for such purposes. Monitoring of the ELZA 1 substation electricity usage is used to ensure accurate billing from TVA and to develop the annual utilities budget.
Efforts to read meters and monitor commodity information have been hindered during FY 2017 by communication issues with the Utilities Management System. Additionally, approximately 20 meters have been identified as needing maintenance. Where meter data are available, it is entered into the Portfolio Manager for benchmarking and reporting purposes. The Y-12 Complex began entering facilities into the EPA Portfolio Manager in FY 2011. During FY 2017, metering data continued to be included in the Portfolio Manager as new meter data became available. At present, 114 facilities have been entered and are being tracked for compliance. Data from the Portfolio Manager are shared with NNSA sustainability contacts and are migrated to the Compliance Tracking System annually. These data are also published in metrics and shared with the infrastructure organization on a monthly basis.
In FY 2017, Johnson Controls, Inc., completed installation of electric and gas meters on approximately 17 buildings. These meters were installed with the completion of ESPC projects. In addition to the new meters, work has been performed on the energy management system for it to work properly. As these connections have progressed, data are being migrated to the energy management module for eventual use in site metrics, data reporting, and energy conservation measures.
Energy Savings Performance Contracts The Y-12 Complex utilizes several mechanisms to integrate long-term sustainability goals into the budget planning process. The Y-12 Site Modernization Plan includes many elements that will reduce the number of operating facilities and utility infrastructure which will, in turn, reduce the electricity demand and GHG emissions. Both the Utilities Migration Plan and the Balance of Plant Facilities Plan include initiatives to improve the overall energy posture of the site. Accomplishment of smaller-scale energy reduction projects is included within internal baseline budgets. Although funding for specific projects is limited, the site recognizes that significant contributions to the goals can be achieved by including energy, water, and sustainability efficiencies within ongoing maintenance work. When appropriate and feasible, modifications to facilities include both energy and sustainable elements. Specific examples of this integration include HVAC replacements, lighting replacements, and energy-efficient utility modifications.
Dedicated funding for large-scale energy and water projects is provided via the ESPC mechanism. The Y-12 Complex has taken advantage of the energy saving opportunities provided by the ESPCs. ESPC Delivery Order 2 is in the sixth period of performance at the Y-12 Complex. This contract included chiller plant improvements, steam condensate return system modifications, steam trap improvements, and demineralized water production facility replacement. Efforts from Delivery Order 2 have greatly contributed toward both energy reduction and efficiency gains for the projects implemented. All guaranteed savings for ESPC Delivery Order 2 have been realized up to the present time. The Y-12 Complex entered into its third ESPC contract in September 2013. Delivery Order 3 was in the construction phase throughout FY 2017. Delivery Order 3 will result in an estimated annual energy and water cost savings of $2,874,696 and an estimated energy-related operations and maintenance (O&M) annual energy and water cost savings of $2,381,304. ECMs included in Delivery Order 3 include the following:
• Steam System Decentralization, • Chiller Plant Upgrades,
Oak Ridge Reservation Annual Site Environmental Report—2017
Y-12 National Security Complex 4-18
• Energy Efficient Lighting Upgrades, • Steam and Condensate System Improvements, and • Compressed Air System Upgrades.
Τhe Y-12 Complex entered into its first modification to Delivery Order 3 in September 2014. Delivery Order 3, Modification #1 was also in the construction phase throughout FY 2017. It will result in an estimated annual energy and water cost savings of $243,443 and an estimated energy-related O&M annual energy and water cost savings of $100,000. ECMs included in Delivery Order 3, Modification #1 consist of Chiller Plant Upgrades and Energy Efficient Lighting Upgrades. The Y-12 Complex entered into its second modification to Delivery Order 3 in September 2015. Modification #2 added additional scope to existing lighting, steam decentralization, and cooling tower replacement projects. This modification added 160 buildings to the lighting scope, added 9 additional buildings to the steam decentralization scope, and replaced an additional cooling tower. Delivery Order 3, Modification #2 was also in the construction phase throughout FY 2017 and will result in an estimated annual energy and water cost savings of $242,800 with no other energy-related O&M annual energy and water cost savings.
4.2.6.4 Dashboard Reporting and the Y-12 National Security Complex Site Sustainability Plan
DOE is required to meet sustainability goals mandated by statute and related EOs, including goals for GHG emissions, energy and water use, fleet optimization, green buildings, and renewable energy. Each year, DOE tracks performance and reports progress towards these goals by providing the annual GHG Inventory, Annual Energy Report, Strategic Sustainability Performance Plan, and related reports to OMB, the White House Council for Environmental Quality, and Congress. Since 2009, the Sustainability Performance Office (SPO) has utilized the Consolidated Energy Data Report (CEDR) in Microsoft Excel to collect DOE site-level sustainability data and consolidate these data sets on behalf of the Department. In October 2014, the SPO launched the web-based DOE Sustainability Dashboard to serve the same functions as the CEDR and to add analysis capabilities for DOE sustainability data reporting. Beginning in FY 2016, CNS has completed required sustainability reporting through the DOE Sustainability Dashboard, the Department’s official sustainability reporting tool.
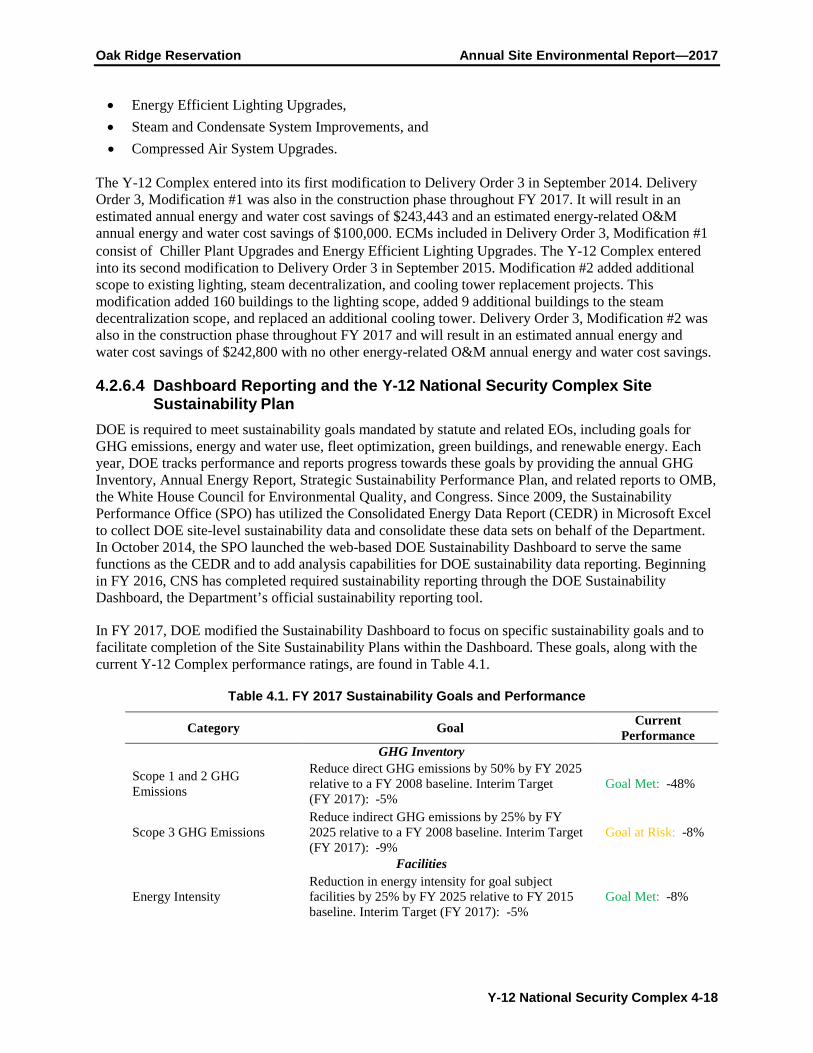
In FY 2017, DOE modified the Sustainability Dashboard to focus on specific sustainability goals and to facilitate completion of the Site Sustainability Plans within the Dashboard. These goals, along with the current Y-12 Complex performance ratings, are found in Table 4.1.
Table 4.1. FY 2017 Sustainability Goals and Performance
Category Goal Current Performance
GHG Inventory
Scope 1 and 2 GHG Emissions
Reduce direct GHG emissions by 50% by FY 2025 relative to a FY 2008 baseline. Interim Target (FY 2017): -5%
Goal Met: -48%
Scope 3 GHG Emissions Reduce indirect GHG emissions by 25% by FY 2025 relative to a FY 2008 baseline. Interim Target (FY 2017): -9%
Goal at Risk: -8%
Facilities
Energy Intensity Reduction in energy intensity for goal subject facilities by 25% by FY 2025 relative to FY 2015 baseline. Interim Target (FY 2017): -5%
Goal Met: -8%

Oak Ridge Reservation Annual Site Environmental Report—2017
Y-12 National Security Complex 4-19
Table 4.1. FY 2017 Sustainability Goals and Performance (continued)
Category Goal Current Performance
Clean Energy By FY 2025, use 25% renewable energy as a percentage of overall facility electric and thermal energy use. Interim Target (FY 2017): 10%
Goal Met: 10%
Renewable Electricity By FY 2025, use 30% renewable energy as a percentage of overall facility electricity use. Interim Target (FY 2017): 10%
Goal Met: 22.7%
Potable Water Intensity Reduce potable water intensity by 36% by FY 2025 relative to FY 2007 baseline. Interim Target (FY 2017): -20%
Goal Met: -65%
Industrial, Landscaping, Agricultural Water
Reduce industrial, landscaping, and agricultural water use by 30% by FY 2025 relative to FY 2010 baseline. Interim Target (FY 2017): -14.0%
Not Applicable for Y-12
HPSBs Ensure 17% by building count comply with the Guiding Principles for sustainable buildings by FY 2025. Interim Target (FY 2017): 15.0%
Goal at Risk: 0%
Fleet
Fleet GHG Emissions/Mile Reduce per-mile GHG emissions by 30% by FY 2025 relative to FY 2014 baseline. Interim Target (FY 2017): -4%
Goal at Risk: 96%
Fleet Petroleum Reduce fleet petroleum use by 20% by FY 2015 and thereafter relative to FY 2005 baseline. Interim Target (FY 2017): -20%
Goal Met: -26%
Fleet Alternative Fuel Increase fleet alternative fuel use by 10% by FY 2015 and thereafter relative to FY 2005 baseline. Interim Target (FY 2017): 10%
Goal Not Met: 99%
Waste
Municipal Solid Waste Diversion
Divert at least 50% of non-hazardous solid waste (excluding construction and demolition debris). Interim Target (FY 2017): 50%
Goal Not Met: 48%
Construction and Demolition Diversion
Divert at least 50% of construction and demolition materials and debris. Interim Target (FY 2017): 50%
Goal Met: 90%
Electronics
Electronics Acquisition 100% of eligible electronics procurements must be environmentally sustainable (e.g., EPEAT). Interim Target (FY 2017): 95%
Goal Met: 96%
Electronics Recycling Dispose of 100% of electronics through government programs and certified recyclers. Interim Target (FY 2017): 100%
Goal Not Met: 96%
Power Management
Implement and actively use power management features on 100% of eligible computers (personal computers and laptops) and monitors. Interim Target (FY 2017): 100%
Goal Met: 100%
Duplex Printing Implement and actively use duplex printing features of 100% of eligible printers. Interim Target (FY 2017): 100%
Goal Not Met: 22%

Oak Ridge Reservation Annual Site Environmental Report—2017
Y-12 National Security Complex 4-20
Table 4.1. FY 2017 Sustainability Goals and Performance (continued)
Category Goal Current Performance
Acquisition
Sustainable Acquisition Ensure 95% of new contract actions for products and services meet sustainable acquisition requirements. Interim Target (FY 2017): 95%
Goal Met: 100%
EPEAT = Electronic Product Environmental Assessment Tool GHG = greenhouse gas FY = Fiscal Year HPSB = high performance sustainable building
4.2.6.5 Water Conservation In FY 2017, the Y-12 Complex achieved a 65% water intensity reduction from the baseline, surpassing the 2025 goal of 36% (Figure 4.8). The Y-12 Complex is currently meeting the water intensity reduction goals and storm water initiatives. All potable water consumed at the Y-12 Complex originates from Melton Hill Lake as raw water and is pumped across the ridge to the City of Oak Ridge water treatment plant, which is located within the Y-12 Complex boundary. The Y-12 Complex purchases potable water from the city for all domestic and industrial applications. Raw water purchased for creek augmentation was discontinued in FY 2014. Actions that have contributed to the overall reduction in potable water use include:
• steam trap repairs and improvements; • condensate return installations, repairs, and reroutes; • replacement of once-through air handling units; • low-flow fixture installation; • chiller replacements; • cooling tower replacements; and • replacing steam with natural gas in buildings.
Figure 4.8. Y-12 National Security Complex water intensity goals
(gal = gallons, gsf = gross square foot)

Oak Ridge Reservation Annual Site Environmental Report—2017
Y-12 National Security Complex 4-21
Most potable water is not metered at the point of use at the Y-12 Complex, but an evaluation based on known data, facility usage, and other factors provides an estimated assessment of the usage by type. Cooling towers, production facilities, and maintenance-related activities comprise the largest consumers on the Y-12 Complex site. Through the various ESPC and utility efficiency improvement initiatives, the site is seeing significant improvement in most of these areas. As future projects are implemented, additional savings will be realized. In FY 2017, the Steam Decentralization ESPC, a project that replaced steam with point of use natural gas in 17 buildings, was completed. These buildings previously used steam for space heating and domestic water heating. The steam condensate is then dumped into the storm drain instead of being returned to the steam plant. By switching from steam to natural gas in these situations, it saves energy and water. This replacement of worn-out steam equipment reduces the risk of failure and eliminates deferred maintenance.
In FY 2018, the Y-12 Complex expects an increase in water use attributed to construction projects. The UPF, EOC, and Mercury Treatment facility are all expected to have increasing water needs in FY 2018.
Internal EISA audits are conducted on covered facilities on a 4-year rotating schedule. Additionally, in FY 2016, Pacific Northwest National Laboratory conducted a water assessment of the Y-12 Complex site through the Federal Energy Management Program. These assessments have identified a number of water conservation projects that could be implemented should funding be allocated. These projects include domestic plumbing retrofits, kitchen equipment upgrades, process system upgrades, cooling tower upgrades, and steam plant upgrades. Continued reductions in water usage will be incorporated into ongoing facility repairs and renovations as funding becomes available. These efforts will include the following:
• Upgrading toilets and urinals to low-flow, hands-free units. • Installing flow restrictors on faucets and shower heads. • Repairing condenser loop connections so all condenser water is returned to the cooling towers. • Replacing existing once-through, water-cooled air conditioning system with air-cooled equivalents. • Installing advanced potable water meters. • Repairing systems to allow Bldg. 9212 condensate to be returned to the steam plant. The
condensate return was repaired in October 2014, but several additional repairs are needed to the system. When the system is fully repaired, an estimated return of 16,848,000 gal of condensate per year back to the steam plant will be realized.
Many of the domestic upgrades are identified in the Balance of Plant Facilities Plan for implementation on a building-by-building basis as funding allows. Similarly, many of the cooling tower upgrades are prioritized in the Utilities Migration Plan and will be evaluated accordingly for implementation as funding permits. Specific goals include the following:
• There are several HVAC units in Bldg. 9201-3 that require once-through cooling water to cool the condenser. These units are old, and the controls do not work properly. These were submitted as a project to the Asset Management Program. Goal one is to replace these units.
• There are several very old, underground laterals that go from the water main to the building that need to be replaced. Because these are very old, they are suspected to leak water. Replacement of these laterals is a goal.
• There are several vacuum pumps in the Y-12 Complex that require once-through cooling water. It is a goal to replace these with air-cooled pumps or to cool them with a circulating tower water; therefore, omitting wasting the cooling water required for this equipment and increasing efficiency.

Oak Ridge Reservation Annual Site Environmental Report—2017
Y-12 National Security Complex 4-22
4.2.6.6 Fleet Management The Y-12 Complex fleet is comprised of agency- and Government Services Administration (GSA)-owned sedans, light-duty trucks/vans, medium-duty trucks/vans, and heavy-duty trucks. During the last quarter of FY 2015, 240 sedans and light- and medium-duty vehicles from the Y-12 Complex agency-owned fleet were transferred to GSA. Throughout FY 2016, GSA replaced 240 of those vehicles, with 177 of the replacements being alternative fuel (E85) vehicles. The Y-12 Complex additionally acquired 31 Flex Fuel vehicles during FY 2017 and completed an assessment of the heavy-duty vehicle inventory. As a result of the assessment, multiple heavy-duty vehicle reassignments were made to better utilize the heavy-duty fleet. This revitalization of the existing fleet has decreased the average age of the Y-12 Complex’s vehicles from 15 years to 2 years of age for light- and medium-duty vehicles. By replacing the older, less fuel efficient vehicles with newer, alternative fuel vehicles, the Y-12 Complex will reduce its consumption of petroleum fuels and its GHG emissions and increase its potential capacity for the use of alternative fuels. The Y-12 Complex continues to operate a taxi service as one of the strategies for fleet optimization.
The Y-12 Complex currently does not utilize alternative fuel and continues to operate under an exception from DOE. The only available on-site fuel station was placed out of service in 2015 after the rupture of an on-site fuel tank. In FY 2017, the Y-12 Complex continued to implement an interim refueling process using mobile tanker trucks to perform all vehicle and equipment refueling operations until a new fueling capability can be established. The mobile tanker trucks have only enough capacity to provide diesel and gasoline.
The Y-12 Complex anticipates having E-85 fuel available by the end of FY 2018. The Y-12 Complex is actively pursuing the restoration of the dismantled fueling station on the west end of the plant and the transfer of the ownership of that facility from the Office of Science to NNSA. This fueling station will include E-85 fueling capabilities and is slated for operation during FY 2018.
The Y-12 Complex has ordered one new heavy-duty vehicle, which will replace two of the older units. Two other older, heavy-duty vehicles will be replaced during FY 2018 as well. The Y-12 Complex will be planning and ordering new replacement vehicles for approximately 26 of our older passenger-carrying vehicles, along with consolidating 22 of older government-owned vehicles into GSA-owned units, and then ordering new replacements for them as well. The vast majority of those 22 older vehicles that will be dispositioned are not Flex Fuel vehicles, but will be replaced with new vehicles, thus increasing the potential capacity for using alternative fuel once it becomes available.
4.2.6.7 Electronic Stewardship The Y-12 Complex has implemented a variety of electronic stewardship activities, including server virtualization, virtual desktop infrastructure, procurement of energy-efficient computing equipment, reuse and recycle of computing equipment, replacement of aging computing equipment with more energy-efficient equipment, and reconfiguration of data centers to achieve more energy-efficient operations. More than 98% of desktop computers, laptops, monitors, and thin clients purchased or leased during FY 2017 were registered Electronic Product Environmental Assessment Tool (EPEAT) products. The Y-12 Complex’s standard desktop configuration specifies the procurement of EPEAT-registered and Energy Star-qualified products.
4.2.6.8 Greenhouse Gases Table 4.2 summarizes the Y-12 Complex GHG emissions for FY 2008 (the baseline year as required by EO 13693) and FY 2017. The Y-12 Complex has reduced Scopes 1 and 2 GHG emissions by 48% since the 2008 baseline year, primarily due to decreased Scope 1 emissions from steam generation and decreased Scope 2 emissions from energy efficiency projects. Scope 3 GHG emissions have decreased by 7.5% since the 2008 baseline year.

Oak Ridge Reservation Annual Site Environmental Report—2017
Y-12 National Security Complex 4-23
Table 4.2. Y-12 National Security Complex greenhouse gas emissions summary
GHG emissions are classified as Scope 1, 2, or 3. Scope 1 includes GHG emissions occurring directly onsite, such as heating or air conditioning in DOE buildings or the combustion of fuel in vehicles owned or operated by DOE. Scope 2 includes indirect emissions that are produced by an outside source as part of the productions process, such as electricity consumed in DOE buildings. Scope 3 includes air and ground business travel, commuting, municipal solid waste, and electricity transmission and distribution losses. CO2e = CO2 (carbon dioxide) equivalent DOE = U.S. Department of Energy FY = Fiscal Year GHG = greenhouse gas N/A = not applicable Non-Fleet V&E Fuel = non-fleet vehicle and equipment fuel
Off-Site MSW = Off-site municipal solid waste Off-Site WWT = Off-site waste water treatment REC = renewable energy credit T&D = transmission and distribution
4.2.6.9 Storm Water Management and the Energy Independence and Security Act of 2007
EISA Section 438 requires Federal agencies to reduce storm water runoff from development and redevelopment projects to protect water resources. The Y-12 Complex complies with these requirements using a variety of storm water management practices, often referred to as “green infrastructure” or

Oak Ridge Reservation Annual Site Environmental Report—2017
Y-12 National Security Complex 4-25
“low-impact development” practices. During the last few years, several green infrastructure initiatives have been implemented to reduce the size and number of impervious surfaces through the use of sustainable vegetative practices and porous pavements. Actions that have contributed to the overall prevention of storm water runoff during FY 2017 include the following.
• UPF continued transferring portions of soil; there has not been a significant change (up or down) in green space during FY 2017 due to UPF site readiness activities. The new paved areas for UPF should be offset by the constructed sediment ponds with the Faircloth skimmers that mitigate the rate of the storm water leaving the area.
• UPF establishes vegetative cover (grass) at excess soil placement areas, such as the West Borrow Area and Wet Spoils Area, consistent with the Storm Water Control Plan.
• The Y-12 Complex evaluates and incorporates, as feasible, the principles of low-impact development in the design of new construction projects, such as the EOC project, which will replace the existing PSS facility. The use of low-impact development techniques, such as landscape rock gardens and permeable pavers to reduce storm water runoff, are being incorporated in the design of the project.
In all, about 3.5 acres have been added to the green bank to offset future projects within the Y-12 Complex.
4.2.7 Awards and Recognition
Since November 2000, the commitment to environmentally responsible operations at the Y-12 Complex has been recognized with more than 138 external environmental awards from local, state, and national agencies. The awards received in 2017 are summarized in the following sections.
4.2.7.1 Federal Energy and Water Management Award The Y-12 Complex received a Federal Energy and Water Management Award for “Y-12 Lights up to Lock-In Savings.”
4.2.7.2 Federal Green Challenge Award The Y-12 Complex received a 2017 EPA Federal Green Challenge (FGC) Regional Award – Southeast (Region 4) for Electronics. The Y-12 Complex was selected from the 264 Federal agencies that took steps to improve efficiency, save resources, and reduce costs as part of the FGC. This is the first time that the Y-12 Complex has received an FGC award. The Y-12 Complex was recognized for sending 67.24 tons (134,470 lb) of electronics (i.e., central processing units, printers, scanners, fax machines, monitors, servers, etc.) to a Responsible Recycling© certified recycler during FY 2016.
4.3 Compliance Status
4.3.1 Environmental Permits
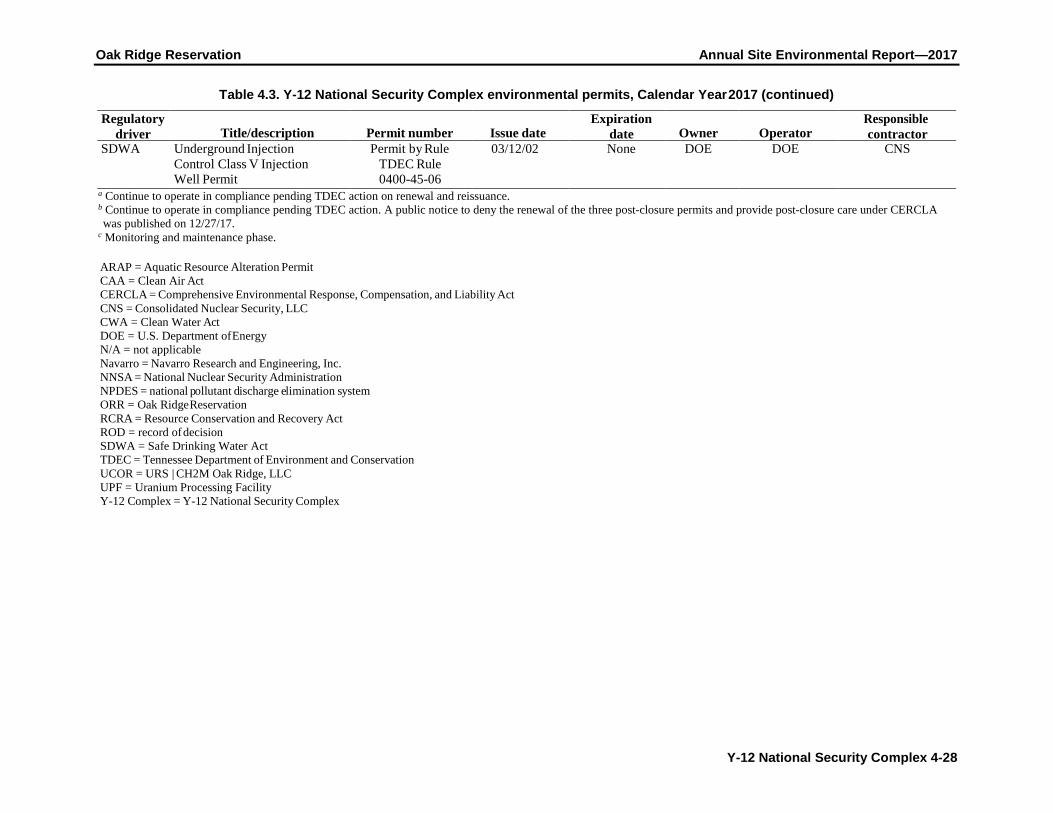
Table 4.3 lists environmental permits in force at the Y-12 Complex during 2017. More detailed information can be found in the following sections.

Oak Ridge Reservation Annual Site Environmental Report—2017
Y-12 National Security Complex 4-26
Table 4.3. Y-12 National Security Complex environmental permits, Calendar Year 2017
Regulatory driver Title/description Permit number Issue date
Expiration date Owner Operator
Responsible contractor
CAA Title V Major Source Operating Permit
571832 12/01/17 11/30/22 DOE DOE CNS
CWA Industrial and Commercial User Wastewater Discharge (Sanitary Sewer) Permit
1-91 07/01/17 03/31/21 DOE DOE CNS
CWA NPDES Permit TN0002968 10/31/11 11/30/16a DOE DOE CNS
CWA UPF 401 Water Quality Certification/ ARAP Access/Haul Road
NRS10.083 06/10/10 06/09/15c DOE DOE CNS
CWA UPF Department of Army Sect. 404 CWA Permit
2010-00366 09/02/10 09/02/20 DOE DOE CNS
CWA UPF General Storm Water Permit Y-12 Complex (41.7 ha/ 103 acres)
TNR 134022 10/27/11 09/30/21 DOE CNS CNS
CWA No Discharge Portal 20 Pump and Haul Permit
SOP-170-14 07/08/17 07/01/22 DOE DOE CNS
CWA No Discharge Portal 23 Pump and Haul Permit
SOP-170-15 07/08/17 07/01/22 DOE DOE CNS
CWA No Discharge Portal 19 Pump and Haul Permit
SOP-130-31 05/31/14 05/30/18 DOE DOE CNS
RCRA Hazardous Waste Transporter Permit
TN3890090001 12/14/17 01/31/19 DOE DOE CNS
RCRA Hazardous Waste Corrective Action Permit
TNHW-164 09/15/15 09/15/25 DOE DOE, NNSA, and all ORR
co-operators of hazardous waste
permits
UCOR
RCRA Hazardous Waste Container Storage Units
TNHW-122 08/31/05 08/31/15 a DOE DOE/CNS CNS/ Navarro co-operator

Oak Ridge Reservation Annual Site Environmental Report—2017
Y-12 National Security Complex 4-27
Table 4.3. Y-12 National Security Complex environmental permits, Calendar Year 2017 (continued)
Regulatory driver Title/description Permit number Issue date
Expiration date Owner Operator
Responsible contractor
RCRA Hazardous Waste Container Storage and Treatment Units
TNHW-127 10/06/05 10/06/15 a DOE DOE/CNS CNS co-operator
RCRA RCRA Post-closure Permit for the Chestnut Ridge Hydrogeologic Regime
TNHW-128 09/29/06 Permit reapplication submitted to TDEC
on 03/02/16
09/29/16 b DOE DOE/UCOR UCOR
RCRA RCRA Post-closure Permit for the Bear Creek Hydrogeologic Regime
TNHW-116 12/10/03 Permit reapplication submitted to TDEC
on 01/31/13
12/10/13b DOE DOE/UCOR UCOR
RCRA RCRA Post-closure Permit for the Upper East Fork Poplar Creek Hydrogeologic Regime
TNHW-113 09/23/03 Permit reapplication submitted to TDEC
on 01/31/13
09/23/13b DOE DOE/UCOR UCOR
Solid waste
Industrial Landfill IV (Operating, Class II)
L-01-103- 0075 Permitted in 1988— most recent modification
approved 01/13/94
N/A DOE DOE/UCOR UCOR
Solid waste
Industrial Landfill V (Operating, Class II)
L-01-103- 0083 Initial permit 04/26/93
N/A DOE DOE/UCOR UCOR
Solid waste
Construction and Demolition Landfill (Overfilled, Class IV subject to CERCLA ROD)
ML-01-103- 0012 Initial permit 01/15/86
N/A DOE DOE/UCOR UCOR
Solid waste
Construction and Demolition Landfill VI (Post-closure care and maintenance)
ML-01-103- 0036 Permit terminated by TDEC
03/15/07
N/A DOE DOE/UCOR UCOR
Solid waste
Construction and Demolition Landfill VII (Operating, Class IV)
ML-01-103- 0045 Initial permit 12/13/93
N/A DOE DOE/UCOR UCOR
Solid waste
Centralized Industrial Landfill II (Post-closure care and maintenance)
L-01-103- 0189 Most recent modification
approved 05/08/92
N/A DOE DOE/UCOR UCOR
Oak Ridge Reservation Annual Site Environmental Report—2017
Y-12 National Security Complex 4-28
Table 4.3. Y-12 National Security Complex environmental permits, Calendar Year 2017 (continued)
Regulatory driver Title/description Permit number Issue date
Expiration date Owner Operator
Responsible contractor
SDWA Underground Injection Control Class V Injection Well Permit
Permit by Rule TDEC Rule 0400-45-06
03/12/02 None DOE DOE CNS
a Continue to operate in compliance pending TDEC action on renewal and reissuance. b Continue to operate in compliance pending TDEC action. A public notice to deny the renewal of the three post-closure permits and provide post-closure care under CERCLA was published on 12/27/17.
c Monitoring and maintenance phase.
ARAP = Aquatic Resource Alteration Permit CAA = Clean Air Act CERCLA = Comprehensive Environmental Response, Compensation, and Liability Act CNS = Consolidated Nuclear Security, LLC CWA = Clean Water Act DOE = U.S. Department of Energy N/A = not applicable Navarro = Navarro Research and Engineering, Inc. NNSA = National Nuclear Security Administration NPDES = national pollutant discharge elimination system ORR = Oak Ridge Reservation RCRA = Resource Conservation and Recovery Act ROD = record of decision SDWA = Safe Drinking Water Act TDEC = Tennessee Department of Environment and Conservation UCOR = URS | CH2M Oak Ridge, LLC UPF = Uranium Processing Facility Y-12 Complex = Y-12 National Security Complex

Oak Ridge Reservation Annual Site Environmental Report—2017
Y-12 National Security Complex 4-29
4.3.2 National Environmental Policy Act/National Historic Preservation Act
As Federal agencies, DOE and NNSA comply with National Environmental Policy Act (NEPA) requirements (procedural provisions, 40 Code of Federal Regulations [CFR] 1500 through 1508), as outlined in DOE’s Implementing Procedures for NEPA (Title 10 CFR 1021). CNS fully supports NNSA’s commitment to NEPA through evaluating the potential impacts of proposed Federal actions that affect the quality of the environment at the Y-12 Complex. CNS ensures that reasonable alternatives for implementing such actions have been considered in the decision-making process and that such decisions are documented in accordance with DOE/NNSA and the Council on Environmental Quality regulations. Such a prescribed evaluation process ensures that the proper level of environmental review is performed before an irreversible commitment of resources is made.
The Final Site-Wide Environmental Impact Statement for the Y-12 National Security Complex (DOE 2011b) was issued in March 2011. The Site-Wide Environmental Impact Statement (SWEIS) and the Notice of Availability were published on March 4, 2011, and are available here. NNSA issued a Record of Decision (ROD) in July 2011 for the continued operation of the Y-12 Complex, based on the SWEIS. Since the ROD, NNSA has updated the strategy and design approach for the UPF. NNSA would use a hybrid approach of upgrading existing Y-12 Complex facilities and building multiple UPF facilities, which was consistent with recommendations from a project peer review of the UPF, Final Report of the Committee to Recommend Alternatives to the Uranium Processing Facility Plan in Meeting the Nation’s Enriched Uranium Strategy (ORNL 2014). The updated UPF strategy was addressed in detail in a Supplement Analysis (SA) Final SWEIS (DOE 2016a; EIS-0387-SA-01), and NNSA amended the ROD (DOE 2016b) on July 22, 2017 as shown here.
In accordance with 10 CFR 1021.330, DOE/NNSA shall evaluate site-wide environmental impact statements (EISs) by means of an SA at least every 5 years. The SA determines if there are substantial changes to the SWEIS, if there are significant new circumstances at the site, or if there is information that is relevant to environmental concerns as discussed in 40 CFR 1502.9(c)(1). The SA determines whether: (1) the SWEIS is sufficient, (2) a supplement EIS is required, or (3) if a new SWEIS document is required. The SA discussed above (EIS-0387-SA-01) addressed UPF’s change in strategy and did not address or evaluate the remainder of operations and activities at the Y-12 Complex since the 2011 document. Starting in 2016, CNS began the development of a second SA (EIS-0387-SA-02) for the continued operations of the Y-12 Complex. This document is currently in draft.
During 2017, CNS completed environmental evaluations for 48 proposed actions at the Y-12 Complex, and 45 such actions were categorically excluded, as allowed by Y/TS-2312, National Environmental Policy Act General Categorical Exclusion, Appendix B to Subpart D of Part 1021 (March 2012). The majority of the proposed actions involved the sustainment of enduring facilities and bridging strategies for facilities identified with an out-year replacement. As many facilities have, or are, approaching the end of design life, substantial investment is required to ensure that they remain viable for the near future. The following projects were evaluated for the Extended Life Program (for existing enriched uranium facilities): the Nuclear Facility Electrical Maintenance Project (electrical improvements to Bldgs. 9215 and 9204-2E), the Fire Suppression Upgrade Project (wet pipe sprinkler head replacements), milling and lathe machine replacement, removal of five legacy machine tooling equipment, and a new chip melt furnace. The following projects were evaluated for enduring facilities: (1) the bridging and sustainment of lithium production capabilities (equipment and facilities)—replacement and refurbishment of the humidity control system, the Material Conversion Equipment Project, and Lithium Purification – parts cleaning station, upgrades to Bldg. 9204-2, and the Lithium Salvage Reclamation Project; (2) the replacement of elevator hydraulic jacks for two buildings; (3) multiple machining tool and controller equipment upgrades; and (4) upgrades to sensor systems of the Perimeter Intrusion Detection Alarm System. Other projects include the closure of two sulfuric acid tanks, the isolation of utilities to the three

Oak Ridge Reservation Annual Site Environmental Report—2017
Y-12 National Security Complex 4-30
Biology Complex buildings (preparation for demolition), and the replacement of the Bldg. 9202 mop water tank. The Roof Asset Management Project and planning and design of the Y-12 Complex EOC and the Y-12 Complex Fire Station continued this year.
During 2017, the following categorically excluded determination forms were approved by the NPO and posted on the public website:
• NEPA #4782 and #4783 revision 1, Demolition of Bldgs. 9111, 9112 and 9616-10; and • NEPA #4822, Demolition of Bldg. 9201-05 Annex.
An environmental assessment determination for the Lithium Production Capability (LPC; NEPA #4810) was sent to NNSA for review and approval. A new LPC facility will provide administrative and manufacturing space for the production of lithium components. The new facility will ensure the Y-12 Complex maintains the required lithium production capabilities, reduces the annual operating cost, and increases processing efficiencies—using safer, more-modern, -agile, and -responsive processes. The construction footprint is located within the Biology Complex, located on the east end of the Y-12 Complex. This facility is anticipated to be a non-nuclear, hazardous material facility.
The LPC project will encompass site preparations; building design and construction; and design, installation, and testing of lithium capability processes and systems. The new LPC building will be approximately 75,000 ft2 in size with 10,000 ft2 of outside storage. DOE OREM has committed to the demolition of several of the Biology Complex buildings, removing slabs and/or footings, and the remediation any contaminated soil. DOE OREM will need to gain regulatory concurrence that no further action will be required to address soil contamination (within the defined construction footprint), for NNSA to proceed. NNSA will conduct a geotechnical investigation in addition to DOE OREM’s characterization of possible soil contamination. The Geotechnical Report will describe the soil, rock, and groundwater conditions and make appropriate recommendations so that a satisfactory and economical foundation may be designed. Re-routing of utilities will be required, including re-routing or abandoning storm, sanitary sewer, and water lines and re-routing the steam lines as required.
In accordance with the National Historic Preservation Act of 1966, NNSA is committed to identifying, preserving, enhancing, and protecting its cultural resources. The prescribed evaluation process ensures that the proper level of environmental review is performed before an irreversible commitment of resources is made. Compliance activities in 2017 included completing Sect. 106 reviews of ongoing and new projects, collecting and storing historic artifacts, conducting tours, maintaining the Y-12 Complex History Center, and participating in various outreach projects with local organizations and schools.
Forty-eight proposed projects were evaluated to determine whether any historic properties eligible for inclusion in the National Register of Historic Places would be adversely impacted. It was determined that none of the 48 projects would have an adverse effect on historic properties eligible for listing in the National Register and that no further Sect. 106 documentation was required. The Y-12 Complex Oral History Program continues efforts to identify leads to conduct oral interviews and to document the knowledge and experience of those who worked at the Y-12 Complex during World War II and the Cold War era. The interviews also provide information on day-to-day operations of the Y-12 Complex, the use and operation of significant components and machinery, and how technological innovations occurred over time. Some of the information collected from past interviews is available in various media, including DVDs shown in the Y-12 Complex History Center.
The Y-12 Complex History Center, located in The New Hope Center, continues to be a work in progress. The Y-12 Complex History Center features many historical photographs and artifacts, a history library, and a video viewing area. More interactive and video-based exhibits are planned for the future. The

Oak Ridge Reservation Annual Site Environmental Report—2017
Y-12 National Security Complex 4-31
Y-12 Complex History Center is open to the public Monday through Thursday from 8:00 a.m. to 5:00 p.m. and on Fridays by special request. A selection of materials, including documentary DVDs, books, pamphlets, postcards, and fact sheets, is available free to the public.
The Y-12 Complex partnered with the National Park Service during the annual Earth Day events on April 18, 2017. These events were held in the Y-12 Complex’s Jack Case Center cafeteria lobby area. The DOE Earth Day Theme was “Earth Day—There is No Planet B.” Information was made available to help individuals take action on behalf of the environment.
Congress passed the National Defense Authorization Act of 2015, which included provisions authorizing a park to be located at three sites: Oak Ridge, Tennessee; Hanford, Washington; and Los Alamos, New Mexico. A foundational document has been completed. This document will establish a baseline for park planning and interpretive activities and provide basic guidance for planning and management decisions. President Obama signed the National Defense Authorization Act into law on December 19, 2014.
On November 10, 2015, the Secretary of the Interior and the Secretary of Energy signed a Memorandum of Agreement between the two agencies defining the respective roles in creating and managing the park. The agreement included provisions for enhanced public access, management, interpretation, and historic preservation. With the signing, the Manhattan Project National Historical Park officially was established.
Outreach activities in 2017 consisted of partnering with the City of Oak Ridge, the Oak Ridge Convention and Visitor’s Bureau, and the Arts Council of Oak Ridge, which sponsor the annual Secret City Festival.
In June 2017, the Secret City Festival promoted the history of the Manhattan Project by providing information to visitors regarding the history of the Y-12 Complex and directions for them to visit the Y-12 Complex History Center. The Y-12 Complex provided visitors with windshield tours of the perimeter of the Y-12 Complex and a more in-depth tour inside Bldg. 9731, also known as the “Pilot Plant.”
The Y-12 Complex also continues to partner with the American Museum of Science and Energy by providing guided public tours of the Y-12 Complex History Center from March through November. Other outreach activities to local and visiting schools, agencies, and organizations included tours and presentations on the rich and significant history of the Y- 12 Complex and Oak Ridge.
4.3.3 Clean Air Act Compliance Status
Permits issued by the State of Tennessee are the primary vehicle used to convey the clean air requirements that are applicable to the Y-12 Complex. New projects are governed by construction permits and modifications to the Title V operating air permit, and eventually the requirements are incorporated into the site-wide Title V operating permit. The Y-12 Complex is currently governed by Title V Major Source Operating Permit 571832.
The permit requires annual and semiannual reports. More than 2,000 data points are obtained and reported each year. All reporting requirements were met during Calendar Year (CY) 2017, and there were no permit violations or exceedances during the report period.
The TDEC–Knoxville Office, Clean Air Compliance, completed two Clean Air Compliance inspections for CY 2017. Compliance inspections on April 25 and 27, 2017, and November 16 and 30, 2017, resulted in no findings or deficiencies.
Ambient air monitoring, while not specifically required by any permit condition, is conducted at the Y-12 Complex to satisfy DOE O 458.1, Radiation Protection of the Public and the Environment

Oak Ridge Reservation Annual Site Environmental Report—2017
Y-12 National Security Complex 4-32
(DOE 2011d) requirements, as a best management practice and/or to provide evidence of sufficient programmatic control of certain emissions. Ambient air monitoring conducted specifically for the Y-12 Complex (i.e., mercury monitoring) is supplemented by additional monitoring conducted for ORR and by both on- and off-site monitoring conducted by TDEC.
Section 4.4 provides detailed information on 2017 activities conducted at the Y-12 Complex in support of the Clean Air Act (CAA).
4.3.4 Clean Water Act Compliance Status
During 2017, the Y-12 Complex continued its excellent record for compliance with the national pollutant discharge elimination system (NPDES) water discharge permit. Data obtained as part of the NPDES program are provided in a monthly report to TDEC. The percentage of compliance with permit discharge limits for 2017 was 100%.
Approximately 2,300 data points were obtained from sampling required by the NPDES permit; no non-compliances were reported. The Y-12 Complex NPDES permit in effect during 2015 (TN0002968) was issued on October 31, 2011, and became effective on December 1, 2011. A modification was effective in May 2014. It expired on November 30, 2016.
An application for a new permit was prepared and submitted to TDEC in May 2016.
4.3.5 Safe Drinking Water Act Compliance Status
The City of Oak Ridge supplies potable water to the Y-12 Complex and meets all Federal, State, and local standards for drinking water. The water treatment plant, located north of the Y-12 Complex, is operated by the City of Oak Ridge. The Y-12 Complex potable water distribution is operated by a State-certified distribution system operator. The distribution system is regulated by TDEC as a public water system, with public water distribution system identification number 0001068.
Tennessee Regulations for Public Water Systems and Drinking Water Quality, Chap. 0400-45-01, sets limits for biological contaminants, chemical activities, and chemical contaminants. Sampling for total coliform, chlorine residuals, lead, copper, and disinfectant byproducts are conducted by the Y-12 Complex ECD, with oversite by a State-certified operator.
In 2016, the Y-12 Complex potable water system received a sanitary survey score of 98 out of a possible 100 points and, thus, retained its approved status as a public water system in good standing with TDEC. The next sanitary survey is scheduled for 2018. All total coliform samples collected during 2017 were analyzed by the State of Tennessee laboratory, and all results were negative. Analytical results for disinfectant byproducts (total trihalomethanes and haloacetic acids) for the Y-12 Complex water distribution system were within allowable TDEC and Safe Drinking Water Act (SDWA) limits for the yearly average. The Y-12 Complex potable water system is currently sampled triennially for lead and copper. The system sampling was last completed in 2017. These results were below TDEC and SDWA limits and met the established requirements.
4.3.6 Resource Conservation and Recovery Act Compliance Status
The Resource Conservation and Recovery Act (RCRA) regulates hazardous wastes that, if mismanaged, could present risks to human health or the environment. The regulations are designed to ensure that hazardous wastes are managed from the point of generation to final disposal. In Tennessee, EPA delegates the RCRA program to TDEC, but EPA retains an oversight role. The Y-12 Complex is considered a

Oak Ridge Reservation Annual Site Environmental Report—2017
Y-12 National Security Complex 4-33
large-quantity generator because it may generate more than 1,000 kg of hazardous waste in a month and because it has RCRA permits to store hazardous wastes for up to 1 year before shipping offsite to licensed treatment and disposal facilities. The Y-12 Complex also has a number of satellite accumulation areas and 90-day waste storage areas.
Mixed wastes are materials that are both hazardous (under RCRA guidelines) and radioactive. The Federal Facilities Compliance Act of 1992 requires that DOE work with local regulators to develop a Site Treatment Plan to manage mixed waste. Development of the plan has two purposes: to identify available treatment technologies and disposal facilities (Federal or commercial) that can manage mixed waste produced at federal facilities, and to develop a schedule for treating and disposing of the waste streams.
The ORR Site Treatment Plan is updated annually and submitted to TDEC for review. The current plan (TDEC 2017) documents the mixed-waste inventory and describes efforts undertaken to seek new commercial treatment and disposal outlets for various waste streams. NNSA has developed a disposition schedule for the mixed waste in storage and will continue to maintain and update the plan as a reporting mechanism as progress is made. The Y-12 Complex has developed new disposition milestones to address its remaining inventory of legacy mixed waste. Disposition milestones for the final inventory are FYs from 2013 through 2018 (see Figure 4.9). In 2017, Y-12 Complex staff completed disposition of 36% of the inventory of legacy mixed waste listed on the ORR Site Treatment Plan.
Figure 4.9. Y-12 National Security Complex path to elimination of its inventory of legacy mixed waste
as part of the Oak Ridge Reservation Site Treatment Plan
9%
36%
0%0%
20%
40%
60%
80%
100%
2016 2017 2018 2019 2020 2021 2022 2023 2024 2025 2026
Actual Disposition Annual Dispostion Targets Final Disposition Milestone

Oak Ridge Reservation Annual Site Environmental Report—2017
Y-12 National Security Complex 4-34
The quantity of hazardous and mixed wastes generated by the Y-12 Complex increased in 2017 (Figure 4.10). The increase was primarily due to an increase in contaminated leachate from legacy operations, which made up 95% of the total hazardous and mixed waste generated in 2017. The Y-12 Complex currently reports waste on 74 active waste streams. The Y-12 Complex is a State-permitted treatment, storage, and disposal facility. Under its permits, the Y-12 Complex received 871 kg of hazardous and mixed waste from the off-site Union Valley analytical chemistry laboratory and the Central Training Facility in 2017.
Figure 4.10. Hazardous waste generation, 2013–2017
In addition, 249,086 kg of hazardous and mixed waste was shipped to DOE-owned and commercial treatment, storage, and disposal facilities. More than 9M kg of hazardous and mixed wastewater was treated at on-site wastewater treatment facilities.
4.3.6.1 Resource Conservation and Recovery Act Underground Storage Tanks TDEC regulates active petroleum underground storage tanks (USTs). Existing UST systems that remain in service must comply with performance requirements described in TDEC UST regulations (TN 0400-18-01).
Closure and removal of the last two petroleum USTs at the East End Fuel Station were completed in August 2012. There are no petroleum USTs remaining at the Y-12 Complex.
4.3.6.2 Resource Conservation and Recovery Act Subtitle D Solid Waste The ORR landfills operated by the DOE environmental management program are located within the boundary of the Y-12 Complex. The facilities include two Class II operating industrial solid waste disposal landfills and one operating Class IV construction demolition landfill. The facilities are permitted by TDEC and accept solid waste from DOE operations on the ORR. In addition, one Class IV facility (Spoil Area 1) is overfilled by 8,945 m3 and has been the subject of a Comprehensive Environmental Response, Compensation, and Liability Act (CERCLA) remedial investigation/feasibility study (RI). A CERCLA ROD for Spoil Area 1 was signed in 1997. One Class II facility (Landfill II) has been closed and is subject to post-closure care and maintenance. Associated TDEC permit numbers are noted in Table 4.3. Additional information about the operation of these landfills is addressed in Section 4.8.4, “Waste Management.”
6
7
8
9
10
11
2013 2014 2015 2016 2017
Millions of kilograms

Oak Ridge Reservation Annual Site Environmental Report—2017
Y-12 National Security Complex 4-35
4.3.7 Resource Conservation and Recovery Act–Comprehensive Environmental Response, Compensation, and Liability Act Coordination
The ORR Federal Facility Agreement (FFA) (DOE 2017a) is intended to coordinate the corrective action processes of RCRA required under the Hazardous Waste Corrective Action document (formerly known as the Hazardous and Solid Waste Amendments permit) with CERCLA response actions.
During CY 2015, the renewal of ORR Corrective Action document TNHW-164 was issued for the 10-year period from September 15, 2015, through September 15, 2025. As required in TNHW-164, the annual update of solid waste management units and areas of concern was submitted to TDEC in January 2017 as an update of the previous CY 2016 activities.
Three RCRA post-closure permits, one for each of the three hydrogeologic regimes at the Y-12 Complex, have been issued to address the eight major closed waste disposal areas at the Y-12 Complex. Because it falls under the jurisdiction of two post-closure permits, the S-3 Pond site is described as having two parts, eastern and former S-3 (Table 4.4). RCRA groundwater monitoring data were reported to TDEC and EPA in the Annual Groundwater Monitoring Report for the Y-12 Complex (UCOR 2017a).
Table 4.4. Y-12 National Security Complex Resource Conservation and Recovery Act post-closure status for former treatment, storage, and disposal units on the Oak Ridge Reservation
Unit Major components of closure Major post-closure requirements Upper EFPC Hydrogeologic Regime (RCRA Post-closure Permit TNHW-113)
New Hope Pond Engineered cap, upper EFPC distribution channel
Cap inspection and maintenance. No current groundwater monitoring requirements in lieu of ongoing CERCLA actions in the eastern portion of the Y-12 Complex
Eastern S-3 Ponds groundwater plume
None for groundwater plume; see former S-3 Ponds (S-3 Site) for source area closure
Post-closure corrective action monitoring. Inspection and maintenance of monitoring network
Chestnut Ridge Hydrogeologic Regime (RCRA Post-closure Permit TNHW-128) Chestnut Ridge security pits
Engineered cap Cap inspection and maintenance. Post-closure corrective action monitoring. Inspection and maintenance of monitoring network and survey benchmarks
Kerr Hollow Quarry
Waste removal, access controls Access controls inspection and maintenance. Post- closure detection monitoring. Inspection and maintenance of monitoring network and survey benchmarks
Chestnut Ridge sediment disposal basin
Engineered cap Cap inspection and maintenance. Post-closure detection monitoring. Inspection and maintenance of monitoring network and survey benchmarks
East Chestnut Ridge Waste Pile
Engineered cap Cap inspection and maintenance. Post-closure detection monitoring. Inspection and maintenance of monitoring network, leachate collection sump, and survey benchmarks. Management of leachate

Oak Ridge Reservation Annual Site Environmental Report—2017
Y-12 National Security Complex 4-36
Table 4.4. Y-12 National Security Complex Resource Conservation and Recovery Act post-closure status for former treatment, storage, and disposal units on the Oak Ridge Reservation (continued)
Unit Major components of closure Major post-closure requirements Chestnut Ridge Hydrogeologic Regime (RCRA Post-closure Permit TNHW-128)
Former S-3 Ponds (S-3 pond site)
Neutralization and stabilization of wastes, engineered cap, asphalt cover
Cap inspection and maintenance. Post-closure corrective action monitoring. Inspection and maintenance of monitoring network and survey benchmarks
Oil landfarm Engineered cap Cap inspection and maintenance. Post-closure corrective action monitoring. Inspection and maintenance of monitoring network and survey benchmarks
Bear Creek Burial Grounds: A-North, A-South, and C-West and the walk-in pits
Engineered cap, seep collection system specific to the burial grounds
Cap inspection and maintenance. Post-closure corrective action monitoring. Inspection and maintenance of monitoring network and survey benchmarks
CERCLA = Comprehensive Environmental Response, Compensation, and Liability Act EFPC = East Fork Poplar Creek RCRA = Resource Conservation and Recovery Act Y-12 Complex = Y-12 National Security Complex
Permit renewal applications had been previously submitted to TDEC, Division of Solid Waste Management for the three RCRA post-closure permits. On December 27, 2017, TDEC issued a Public Notice of their intent to deny the renewal of the three permits. The proposed denial was initiated by DOE’s request to withdraw the permit renewal applications in coordination in advance with TDEC. Pursuant to the ORR FFA, this denial allows DOE to provide post-closure care for the permitted hazardous waste management units under the existing CERCLA remedial program. The public comment period for this notice ends on February 12, 2018.
4.3.8 Toxic Substances Control Act Compliance Status
The storage, handling, and use of PCBs are regulated under the Toxic Substances Control Act (TSCA). Capacitors manufactured before 1970 that are believed to be oil-filled are handled as though they contain PCBs, even when that cannot be verified from manufacturer records. Certain equipment containing PCBs and PCB waste containers must be inventoried and labeled. The inventory is updated by July 1 of each year and was last submitted on June 7, 2017.
Given the widespread historical uses of PCBs at the Y-12 Complex and fissionable material requirements that must be met, an agreement between EPA and DOE was negotiated to assist ORR facilities in becoming compliant with TSCA regulations. This agreement, the ORR PCB Federal Facility Compliance Agreement (FFCA), which became effective in 1996, provides a forum with which to address PCB compliance issues that are truly unique to these facilities. Y-12 Complex operations involving TSCA-regulated materials were conducted in accordance with TSCA regulations and the ORR PCB FFCA.
The removal of legacy PCB waste, some of which had been stored since 1997, in accordance with the terms of the ORR PCB FFCA, was completed in 2011.

Oak Ridge Reservation Annual Site Environmental Report—2017
Y-12 National Security Complex 4-37
4.3.9 Emergency Planning and Community Right-to-Know Act Compliance Status
The Emergency Planning and Community Right-to-Know Act (EPCRA) requires that facilities report inventories (i.e., Tier II report sent to State and local emergency responders) and releases (i.e., toxic release inventory report submitted to State and Federal environmental agencies) of certain chemicals that exceed specified thresholds. The Y-12 Complex submitted reports in 2017 in accordance with requirements under EPCRA Sections 302, 303, 311, 312, and 313.
The Y-12 Complex had no unplanned release of a hazardous substance that required notification of the regulatory agencies (see Sect. 4.3.11 for more information). Section 311 notifications were sent to TEMA and local emergency responders in 2017 because chemicals newly exceeded the reporting thresholds or new information was identified about previously reported chemicals. Those chemicals included bromo-chloro 5,5-dimethyl hydantoin (Chemical Abstract Service [CAS] No. 32718-18-6) and sodium bisulfite (CAS No. 7631-90-5) used in water treatment; Stoddard solvent (CAS No. 8052-41-3) from roofing projects; and Pine Bluff Natural Sand from construction activities. Inventories, locations, and associated hazards of over-threshold hazardous and extremely hazardous chemicals were submitted to TEMA and local emergency responders in the annual Tier II Report required by Section 312. Data submittal was through the E-Plan web-based reporting system, as requested by TEMA. Some local emergency responders also accepted data through the E-Plan system, but others require that electronic copies of the Tier II Reports be submitted via email. The Y-12 Complex reported 48 chemicals that were over Section 312 inventory thresholds in 2017.
Y-12 Complex operations are evaluated annually to determine the applicability for submittal of a toxic release inventory report to TEMA and EPA in accordance with EPCRA Section 313 requirements. The amounts of certain chemicals manufactured, processed, or otherwise used are calculated to identify those that exceed reporting thresholds. After threshold determinations are made, releases and off-site transfers are calculated for each chemical that exceeds a threshold. Submittal of the data to TEMA and EPA is made through the Toxics Release Inventory-Made Easy (i.e., TRI-ME) web-based reporting system operated by EPA. Total 2017 reportable toxic releases to air, water, and land and waste transferred offsite for treatment, disposal, and recycling were 27666 kg (60,994 lb). Table 4.5 lists the reported chemicals for the Y-12 Complex for 2016 and 2017 and summarizes releases and off-site waste transfers for those chemicals.
Table 4.5. Emergency Planning and Community Right-to-Know Act Section 313 toxic chemical release and off-site transfer summary for the Y-12 National Security Complex, 2016 and 2017
Chemical Year Quantitya (lb)b Chromium 2016 7,006 2017 5,853 Copper 2016 2,747 2017 2,809 Diisocyanate compounds c 568 2017 --- Lead compounds 2016 10,013 2017 9,948 Manganese 2016 6,038 2017 --- Mercury 2016 25 2017 5,263 Methanol 2016 37,554 Methanol 2017 29,207

Oak Ridge Reservation Annual Site Environmental Report—2017
Y-12 National Security Complex 4-38
Table 4.5. Emergency Planning and Community Right-to-Know Act Section 313 toxic chemical release and off-site transfer summary for the Y-12 National Security Complex, 2016 and 2017
(continued) Chemical Year Quantitya (lb)b Nickel 2016 8,728 2017 7,914 Silver 2016 Form Ad 2017 --- Total 2016 72,679 2017 60,994 aRepresents total releases to air, land, and water and includes off-site waste transfers. Also includes quantities released to the environment as a result of remedial actions, catastrophic events, or one-time events not associated with production processes.
b1 lb = 0.4536 kg. cNot reported in previous year. dForm A - less than 500 lb released.
4.3.10 Spill Prevention, Control, and Countermeasures
The Clean Water Act, Sect. 311, regulates the discharge of oils or petroleum products to waters of the United States and requires the development and implementation of spill prevention, control, and countermeasures (SPCC) plans to minimize the potential for oil discharges. The major requirements for SPCC plans are contained in Title 40 CFR Part 112. These regulations require that SPCC plans be reviewed, evaluated, and amended at least once every 5 years or earlier if significant changes occur. The SPCC rule includes requirements for oil spill prevention, preparedness, and response to prevent oil discharges to navigable waters and adjoining shorelines. The rule requires specific facilities to prepare, amend, and implement SPCC plans.
The Y-12 Complex SPCC Plan (CNS 2015b) was revised in September 2015 to update general Y-12 Complex changing site infrastructure. This plan presents the SPCC to be implemented by the Y-12 Complex to prevent spills of oil and hazardous constituents and the countermeasures to be invoked should a spill occur. In general, the first response of an individual discovering a spill is to call the PSS. Spill response materials and equipment are stored near tanks and drum storage areas and other strategic areas of the Y-12 Complex to facilitate spill response. All Y-12 Complex personnel and subcontractors are required to have initial spill and emergency response training before they can work on the site.
SPCC-related improvements have been made at the Y-12 Complex by reducing the amount of oil stored onsite, particularly electrical transformer oil. The revised Y-12 Complex SPCC Plan (CNS 2015b) was completed in September 2015, meeting the regulatory requirement to review and update the SPCC Plan every 5 years.
4.3.11 Unplanned Releases
The Y-12 Complex has procedures for notifying off-site authorities for categorized events at the Y-12 Complex. Off-site notifications are required for specified events according to Federal statutes, DOE Orders, and the Tennessee Oversight Agreement. As an example, any observable oil sheen on East Fork Poplar Creek (EFPC) and any release impacting surface water must be reported to the EPA National Response Center in addition to other reporting requirements. Spills of CERCLA reportable quantity limits must be reported to the EPA National Response Center, DOE, TEMA, and the Anderson County Local Emergency Planning Committee.
In addition, the Y-12 Complex occurrence reporting program provides timely notification to the DOE community of Y-12 Complex events and site conditions that could adversely affect the public or worker

Oak Ridge Reservation Annual Site Environmental Report—2017
Y-12 National Security Complex 4-39
health and safety, the environment, national security, DOE safeguards and security interests, functioning of DOE facilities, or the reputation of DOE.
Y-12 Complex occurrences are categorized and reported through the Occurrence Reporting and Processing System, which provides NNSA and the DOE community with a readily accessible database of information about occurrences at DOE facilities, causes of those occurrences, and corrective actions to prevent recurrence of the events. DOE analyzes aggregate occurrence information for generic implications and operational improvements.
There were no reportable releases to the environment in 2017. During 2017, there were no unplanned radiological air emission releases for the Y-12 Complex.
4.3.12 Audits and Oversight
A number of Federal, State, and local agencies oversee Y-12 Complex activities. In 2017, the Y-12 Complex was inspected by Federal, State, or local regulators on seven occasions. Table 4.6 summarizes the results, and additional details follow.
Table 4.6. Summary of external regulatory audits and reviews, 2017
Date Reviewer Subject Issues February 21 COR Semiannual Industrial Pretreatment Compliance Inspection 0 April 25, 27 TDEC Annual CAA Inspection 0 June 20-21 TDEC Underground Injection Control Program Compliance
Inspection 0
July 19-24 TDEC Annual RCRA Hazardous Waste Compliance Inspection 2 September 26-27 TDEC NPDES Compliance Evaluation Inspection 0 November 16, 30 TDEC Annual CAA Inspection 0 October 3 COR Semiannual Industrial Pretreatment Compliance Inspection 0 CAA = Clean Air Act COR = City of Oak Ridge NPDES = national pollutant discharge elimination system RCRA = Resource Conservation and Recovery Act TDEC = Tennessee Department of Environment and Conservation
As part of the City of Oak Ridge’s pretreatment program, City personnel collect samples from the Y-12 Complex monitoring station to conduct compliance monitoring as required by the pretreatment regulations. City personnel also conduct compliance inspections twice yearly. No issues were identified in 2017.
The TDEC Underground Injection Control Coordinator visited the Y-12 Complex and the Central Training Facility in June 2017 to review Class V injection wells. The inspection covered 156 steam condensate discharge French drains and a large-capacity septic system that meets the definition of an injection well. There were no findings identified.
Personnel from the TDEC–Knoxville Office conducted two CAA compliance inspections in 2017. The inspections covered 25 emissions sources and records reviews. No issues were identified.
Personnel from the TDEC–Knoxville Office conducted an NPDES compliance evaluation inspection on September 26 and 27, 2017. The inspection included 4 wastewater treatment facilities, 6 outdoor storage areas, and 15 outfalls. No violations were identified.
Personnel from the TDEC–Knoxville Office conducted a RCRA hazardous waste compliance inspection July 19–24, 2017. The inspections covered 45 waste storage areas and records reviews. The report identified two findings involving a container of used batteries (universal waste) and two containers of

Oak Ridge Reservation Annual Site Environmental Report—2017
Y-12 National Security Complex 4-40
hazardous waste. The containers were not dated and labeled as required. These issues were immediately corrected.
4.3.13 Radiological Release of Property
Clearance of property from the Y-12 Complex is conducted in accordance with approved procedures that comply with DOE O 458.1, Radiation Protection of the Public and the Environment (DOE 2011d). Property consists of real property (i.e., land and structures), personal property, and material and equipment (M&E). At the Y-12 Complex, there are three paths for releasing property to the public based on the potential for radiological contamination:
• Survey and release of property potentially contaminated on the surface (using pre-approved authorized limits for releasing property).
• Evaluation of materials with a potential to be contaminated in volume (volumetric contamination) to ensure that no radioactivity has been added.
• Evaluation using process knowledge (surface and volumetric).
These three release paths are discussed in the following sections. Table 4.7 summarizes some examples of the quantities of property released in 2017. During FY 2017, the Y-12 Complex recycled more than 2.65M lb of materials offsite for reuse, including but not limited to computers, electronic office equipment, used oil, scrap metal, tires, batteries, lamps, and pallets.
Table 4.7. Summary of materials released in 2017
Category Amount released Real property (land and structures) None Computer equipment recycle –Computers, monitors, printers, and mainframes
69,078 lb
Recycling examples –Used oils 4,855 gal –Used tires 11,840 lb –Scrap metal 1,196,265 lb –Lead acid batteries 31,622 lb
Public/negotiated salesa
–Copper and brass 17,165 lb –Miscellaneous furniture 230,810 lb –Vehicles and miscellaneous equipment 209,154 lb
External transfersb 50,786 lb
aSales during Fiscal Year 2017.
bVehicles; miscellaneous equipment; and materials transferred to various Federal, State, and local agencies for reuse during Fiscal Year 2017.
4.3.13.1 Property Potentially Contaminated on the Surface Property that is potentially contaminated on the surface is subject to a complete survey unless it can be released based on process knowledge or via a survey plan that provides survey instructions along with technical justification (process knowledge) for the survey plan based on the Multi-Agency Radiation Survey and Site Investigation Manual (MARSSIM) (NRC 2000) and the Multi-Agency Radiation Survey
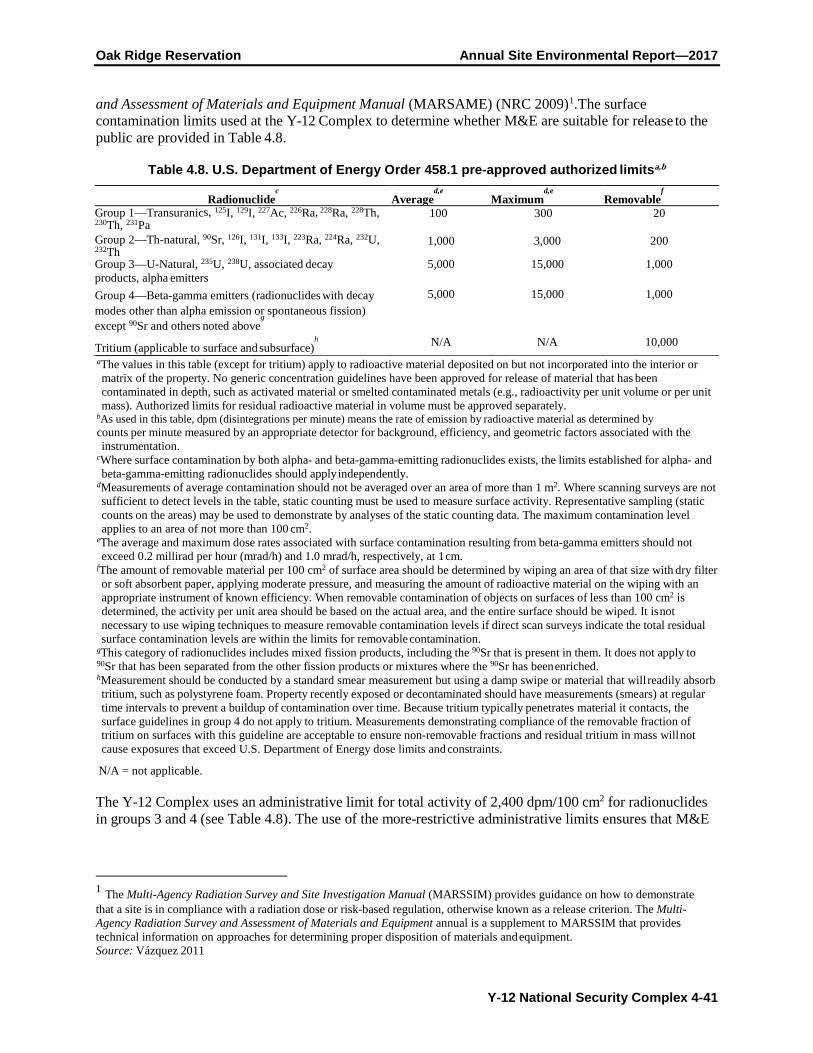
Oak Ridge Reservation Annual Site Environmental Report—2017
Y-12 National Security Complex 4-41
and Assessment of Materials and Equipment Manual (MARSAME) (NRC 2009)1.The surface contamination limits used at the Y-12 Complex to determine whether M&E are suitable for release to the public are provided in Table 4.8.
Table 4.8. U.S. Department of Energy Order 458.1 pre-approved authorized limitsa,b
Radionuclidec Average
d,e Maximum
d,e Removable
f
Group 1—Transuranics, 125I, 129I, 227Ac, 226Ra, 228Ra, 228Th, 230Th, 231Pa
100 300 20
Group 2—Th-natural, 90Sr, 126I, 131I, 133I, 223Ra, 224Ra, 232U, 232Th
1,000 3,000 200
Group 3—U-Natural, 235U, 238U, associated decay products, alpha emitters
5,000 15,000 1,000
Group 4—Beta-gamma emitters (radionuclides with decay modes other than alpha emission or spontaneous fission) except 90Sr and others noted above
g
5,000 15,000 1,000
Tritium (applicable to surface and subsurface)h N/A N/A 10,000
aThe values in this table (except for tritium) apply to radioactive material deposited on but not incorporated into the interior or matrix of the property. No generic concentration guidelines have been approved for release of material that has been contaminated in depth, such as activated material or smelted contaminated metals (e.g., radioactivity per unit volume or per unit mass). Authorized limits for residual radioactive material in volume must be approved separately.
bAs used in this table, dpm (disintegrations per minute) means the rate of emission by radioactive material as determined by counts per minute measured by an appropriate detector for background, efficiency, and geometric factors associated with the instrumentation.
cWhere surface contamination by both alpha- and beta-gamma-emitting radionuclides exists, the limits established for alpha- and beta-gamma-emitting radionuclides should apply independently.
dMeasurements of average contamination should not be averaged over an area of more than 1 m2. Where scanning surveys are not sufficient to detect levels in the table, static counting must be used to measure surface activity. Representative sampling (static counts on the areas) may be used to demonstrate by analyses of the static counting data. The maximum contamination level applies to an area of not more than 100 cm2.
eThe average and maximum dose rates associated with surface contamination resulting from beta-gamma emitters should not exceed 0.2 millirad per hour (mrad/h) and 1.0 mrad/h, respectively, at 1 cm.
fThe amount of removable material per 100 cm2 of surface area should be determined by wiping an area of that size with dry filter or soft absorbent paper, applying moderate pressure, and measuring the amount of radioactive material on the wiping with an appropriate instrument of known efficiency. When removable contamination of objects on surfaces of less than 100 cm2 is determined, the activity per unit area should be based on the actual area, and the entire surface should be wiped. It is not necessary to use wiping techniques to measure removable contamination levels if direct scan surveys indicate the total residual surface contamination levels are within the limits for removable contamination.
gThis category of radionuclides includes mixed fission products, including the 90Sr that is present in them. It does not apply to 90Sr that has been separated from the other fission products or mixtures where the 90Sr has been enriched. hMeasurement should be conducted by a standard smear measurement but using a damp swipe or material that will readily absorb tritium, such as polystyrene foam. Property recently exposed or decontaminated should have measurements (smears) at regular time intervals to prevent a buildup of contamination over time. Because tritium typically penetrates material it contacts, the surface guidelines in group 4 do not apply to tritium. Measurements demonstrating compliance of the removable fraction of tritium on surfaces with this guideline are acceptable to ensure non-removable fractions and residual tritium in mass will not cause exposures that exceed U.S. Department of Energy dose limits and constraints.
N/A = not applicable.
The Y-12 Complex uses an administrative limit for total activity of 2,400 dpm/100 cm2 for radionuclides in groups 3 and 4 (see Table 4.8). The use of the more-restrictive administrative limits ensures that M&E
1 The Multi-Agency Radiation Survey and Site Investigation Manual (MARSSIM) provides guidance on how to demonstrate that a site is in compliance with a radiation dose or risk-based regulation, otherwise known as a release criterion. The Multi-Agency Radiation Survey and Assessment of Materials and Equipment annual is a supplement to MARSSIM that provides technical information on approaches for determining proper disposition of materials and equipment. Source: Vázquez 2011

Oak Ridge Reservation Annual Site Environmental Report—2017
Y-12 National Security Complex 4-42
do not enter into commerce exceeding the definition of contamination found in 49 CFR 173, “Shippers—General Requirements for Shipments and Packagings.”
4.3.13.2 Property Potentially Contaminated in Volume (Volumetric Contamination)
Materials, such as activated materials smelted-contaminated metals, liquids, and powders, are subject to volumetric contamination (e.g., radioactivity per unit volume or per unit mass) and are treated separately from surface-contaminated objects. No authorized volumetric contamination limits have been approved for material released from the Y-12 Complex. Materials that are subject to volumetric contamination are evaluated for release by the following three methods.
1. Unopened, Sealed Containers—Material is still in an original commercial manufacturer’s sealed, unopened container. A seal can be a visible manufacturer’s seal (i.e., lock tabs, heat shrink) or a manufacturer’s seal that cannot be seen (e.g., unbroken fluorescent bulbs, sealed capacitors) as long as the container remains unopened once received from the manufacturer.
2. Process Knowledge—If it can be determined that there is no likelihood of contamination being able to enter a system, then this is documented and used to justify release; then the basis for release is documented. Often this is accompanied by confirmatory surveys.
3. Analytical—The material is sampled, and the analytical results are evaluated against measurement-method critical levels or background levels from materials that have not been impacted by Y-12 Complex activities. If the results meet defined criteria, then they are documented and the material is released.
4.3.13.3 Process Knowledge Process knowledge is used to release property from the Y-12 Complex without monitoring or analytical data and to implement a graded approach (less than 100% monitoring) for monitoring of some M&E (MARSAME Classes II and III) (NRC 2009). A conservative approach (nearly 100% monitoring) is used to release older M&E for which a complete and accurate history is difficult to compile and verify (MARSAME Class I). The process knowledge evaluation processes are described in Y-12 Complex procedures.
The following M&E are released without monitoring based on process knowledge; this does not preclude conducting verification monitoring, for example, before sale:
• All M&E from buildings evaluated and designated as “RAD-Free Zones.” • Pallets generated from administrative buildings. • Pallets that are returned to shipping during the same delivery trip. • Lamps from administrative buildings. • Drinking water filters. • M&E approved for release by Radiological Engineering Technical Review. • Portable restrooms used in non-radiological areas. • Documents, mail, diskettes, compact disks, and other office media; personal M&E; paper, plastic
products, water bottles, aluminum beverage cans, and toner cartridges; office trash, house-keeping materials, and associated waste; breakroom, cafeteria, and medical wastes; and medical and bioassay samples generated in non-radiological areas.

Oak Ridge Reservation Annual Site Environmental Report—2017
Y-12 National Security Complex 4-43
• Subcontractor/vendor/privately owned vehicles, tools, and equipment used in non-radiological areas.
• M&E that are administratively released. • M&E that were delivered to stores in error and that have not been distributed to other Y-12
Complex locations. • New computer equipment distributed from Bldg. 9103. • Subcontractor/vendor/privately owned vehicles, tools, and equipment that have not been used in
contaminated areas or for excavation activities.
4.4 Air Quality Program Sections of the Y-12 Complex’s Title V Permit 571832 contain requirements that are generally applicable to most industrial sites. Examples include requirements associated with asbestos controls, control of stratospheric ozone-depleting chemicals, control of fugitive emissions, and general administration of the permit. The Title V permit also contains a section of specific requirements directly applicable to individual sources of air emissions at the Y-12 Complex. Major requirements in that section include the Radiological National Emission Standards for Hazardous Air Pollutants (Rad-NESHAPs) (40 CFR 61) requirements and the numerous requirements associated with emissions of criteria pollutants and other, non-radiological hazardous air pollutants (HAPs). In addition, a number of sources that are exempt from permitting requirements under State rules but subject to listing on the Title V permit application are documented, and information about them is available upon request from the State of Tennessee.
4.4.1 Construction and Operating Permits
In 2017, the Y-12 Complex received an extension to the construction air permit for UPF, amended by TDEC on February 14, 2017. The UPF permit application was included in the Y-12 Complex’s Title V (Major Source) Operating Air Permit Renewal Application in CY 2016. TDEC issued the Y-12 Complex their Title V (Major Source) renewal air permit on December 1, 2017, which included the UPF emission sources. The new Title V air permit expires on November 30, 2022. The Clean Air Program met with the owners and/or operators of their respective emission sources and discussed and explained each source’s conditions and its compliance method. An operational flexibility request to replace five old, existing swaging machines and associated components with one new, similar machine located in the Foundry Operations in Bldg. 9998 was submitted on May 4, 2017, to TDEC, Division of Air Pollution Control for their review and approval. TDEC approved the request on June 1, 2017.
Permit administration fees are paid to TDEC annually in support of the Title V program.
CNS has chosen to pay the fees based on a combination of actual emissions (steam plant, methanol, solvent 140/142, volatile organic compounds [VOCs]) and allowable emissions (balance of plant). In 2017, emissions categorized as actual emissions totaled 37,032 kg, and emissions calculated by the allowable method totaled 590,342 kg. The total emissions fee paid was $22,994.84.
Demonstrating compliance with the conditions of air permits is a significant effort at the Y-12 Complex. Key elements of maintaining compliance are maintenance and operation of control devices, monitoring, record keeping, and reporting. High-efficiency particulate air (HEPA) filters and scrubbers are control devices used at the Y-12 Complex. HEPA filters are found throughout the complex, and in-place testing of HEPA filters to verify the integrity of the filters is routinely performed. Scrubbers are operated and maintained in accordance with source-specific procedures. Monitoring tasks consist of continuous stack sampling, one-time stack sampling, and monitoring the operation of control devices. Examples of

Oak Ridge Reservation Annual Site Environmental Report—2017
Y-12 National Security Complex 4-44
continuous stack sampling are the radiological stack monitoring systems on numerous sources throughout the Y-12 Complex.
The Y-12 Complex site-wide permit requires annual and semiannual reports. One report is the overall Annual ORR Rad-NESHAPs Report, which includes specific information regarding Y-12 Complex radiological emissions; another is an Annual Title V Compliance Certification Report, which indicates compliance status with all conditions of the permit. A third is a Title V Semiannual Report, which covers a 6-month period for some specific emission sources and consists of monitoring and record-keeping requirements for the sources. Table 4.9 gives the actual emissions versus allowable emissions for the Y-12 Complex steam plant.
Table 4.9. Actual versus allowable air emissions from the Y-12 National Security Complex steam plant, 2017
Emissions (tons/year)a
Pollutant Actual Allowable Percentage of allowable Particulate 3.32 41 8.1 Sulfur dioxide 0.26 39 0.7
Nitrogen oxidesb 13.97 81 17.2
VOCsb 2.40 9.4 25.5
Carbon monoxideb 36.67 139 26.4
NOTE: The emissions are based on fuel usage data for January through December 2017. The volatile organic compound (VOC) emissions include VOC hazard air pollutant emissions.
a1 ton = 907.2 kg.
bWhen there is no applicable standard or enforceable permit condition for a pollutant, the allowable emissions are based on the maximum actual emissions calculation, as defined in Tennessee Department of Environment and Conservation Rule 1200-3-26-.02(2)(d)3 (maximum design capacity for 8,760 hr/year). Both actual and allowable emissions were calculated based on the latest U.S. Environmental Protection Agency compilation of air pollutant emission factors (EPA 1995 and 1998).
4.4.1.1 Generally Applicable Permit Requirements The Y-12 Complex, like many industrial sites, has a number of generally applicable requirements that require management and control. Asbestos, ozone-depleting substances (ODSs), and fugitive particulate emissions are notable examples.
Control of Asbestos The Y-12 Complex has numerous buildings and equipment that contain asbestos-containing materials (ACMs). The compliance program for management of removal and disposal of ACMs includes demolition and renovation notifications to TDEC and inspections, monitoring, and prescribed work practices for abatement and disposal of asbestos materials. There was no reportable release of asbestos in 2017. There were three notifications of asbestos demolition or renovation, one revision of notification of asbestos demolition or renovation, and one annual estimate for CY 2017. There was one notification sent to TDEC in March 2017 by URS|CH2M Oak Ridge LLC (UCOR). The 2018 annual estimates of friable asbestos were also submitted to TDEC in November 2017 for their records.
An internal surveillance of the asbestos National Emission Standards for Hazardous Air Pollutant (NESHAP) reporting process was conducted on December 6, 2017. The scope of the surveillance was focused on compliance with applicable State and Federal environmental regulations, specifically reporting and record-keeping requirements for on-site demolition and renovation activities for buildings. There were no findings or deficiencies identified as a result of this surveillance.

Oak Ridge Reservation Annual Site Environmental Report—2017
Y-12 National Security Complex 4-45
Stratospheric Ozone Protection The Y-12 Complex Ozone Depleting Substances (ODS) Phase-Out and Management Plan (B&W Y-12 2014) provides a complete discussion of requirements and compliance activities at the Y-12 Complex. Past ODS-reduction initiatives that began in the early 1980s focused on elimination of Class I ODS use in refrigerants and in cleaning operations involving solvents. In 2012, the last remaining chiller system at the Y-12 Complex with Class I ODSs was taken out of service. The refrigerant from that system was sent to the Defense Logistics Agency.
Y-12 Complex initiatives have also involved elimination of ODS solvents in cleaning processes. Operations personnel developed and implemented changes in one process that eliminated ODS solvents from that process. Evaluation of ODS reduction opportunities continue for another solvent-based cleaning operation. Future actions related to this process will be dependent on ongoing efforts to identify a safe and viable replacement chemical or to identify practical and cost-effective modifications to process equipment.
All Class I and Class II substitutions are made in accordance with EPA’s Significant New Alternatives Program. Y-12 Complex personnel are notified as EPA issues regulations detailing Significant New Alternatives Program replacement chemicals that may be applicable to Y-12 Complex operations. To prevent ODSs from coming onsite, procurement documents are written to ensure that no additional equipment or processes using Class I ODSs are brought onsite, and Class II ODS use is limited wherever possible.
Site procedures are in place for disposition of excess refrigerant or refrigerant-containing equipment. Recovered refrigerant is recycled/reused in equipment at the Y-12 Complex whenever feasible.
Refrigerant is recovered from refrigerant-containing equipment before disposal of the equipment. Class I ODSs that cannot be used onsite are first made available to Defense Logistics Agency. Remaining refrigerants, including Class I and Class II ODSs, are sold to refrigerant reclamation facilities or properly disposed of.
Fugitive Particulate Emissions As modernization and infrastructure reduction efforts increase at the Y-12 Complex, the need also increases for good work practices and controls to minimize fugitive dust emissions from construction and demolition activities. Y-12 Complex personnel continue to use a mature project-planning process to review, recommend, and implement appropriate work practices and controls to minimize fugitive dust emissions. Precautions used to prevent particulate matter from becoming airborne include but are not be limited to: (1) use, where possible, of water or chemicals for control of dust in demolition of existing buildings or structures, construction operations, grading of roads, or the clearing of land; (2) application of asphalt, water, or suitable chemicals on dirt roads, material stockpiles, and other surfaces that can create airborne dusts; and (3) installation and use of hoods, fans, and fabric filters to enclose and vent dusty materials.
4.4.1.2 National Emission Standards for Hazardous Air Pollutants for Radionuclides
The release of radiological contaminants, primarily uranium, into the atmosphere at the Y-12 Complex occurs almost exclusively as a result of plant production, maintenance, and waste management activities. The major radionuclide emissions contributing to the dose from the Y-12 Complex are 234U, 235U, 236U, and 238U, which are emitted as particulates (Figure 4.11). The particle size and solubility class of the emissions are determined based on review of the operations and processes served by the exhaust systems

Oak Ridge Reservation Annual Site Environmental Report—2017
Y-12 National Security Complex 4-46
Figure 4.11. Total curies of uranium discharged from the Y-12 National Security Complex to the atmosphere, 2013 through 2017
to determine the quantity of uranium handled in the operation or process, the physical form of the uranium, and the nature of the operation or process. The four categories of processes or operations that are considered when calculating the total uranium emissions are:
• those that exhaust through monitored stacks; • unmonitored processes for which calculations are performed per Appendix D of 40 CFR 61; • processes or operations exhausting through laboratory hoods, also involving 40 CFR 61Appendix D
calculations; and • emissions from room ventilation exhausts (calculated using radiological control monitoring data
from the work area).
Continuous sampling systems are used to monitor emissions from a number of process exhaust stacks at the Y-12 Complex. In addition, a probe-cleaning program is in place, and the results from the probe cleaning at each source are incorporated into the respective emission point source terms. In 2017, 32 process exhaust stacks were continuously monitored, 25 of which were major sources; the remaining 7 were minor sources. The sampling systems on the stacks have been approved by EPA Region 4.
During 2017, unmonitored uranium emissions at the Y-12 Complex occurred from 38 emission points associated with on-site, unmonitored processes and laboratories operated by CNS. Emission estimates for the processes and laboratory stacks were made using inventory data with emission factors provided in 40 CFR Part 61, Appendix D. The Y-12 Complex source term includes an estimate of these emissions.
The Y-12 Analytical Chemistry Organization (ACO) operates out of two main laboratories. One is located onsite in Bldg. 9995. The other is located in a leased facility on Union Valley Road, about 0.3 miles east of the Y-12 Complex, and is not within the ORR boundary. In 2017, there were no radionuclide emission points (or sources) in the off-site laboratory facility.
Additionally, estimates from room ventilation systems are considered using radiological control data on airborne radioactivity concentrations in the work areas. Where applicable, exhausts from any area where the monthly concentration average exceeds 10% of the derived air concentration, as defined in the ORR Radionuclide Compliance Plan (DOE 2013), are included in the annual source term. Annual average concentrations and design ventilation rates are used to arrive at the annual emission estimate for those areas. Three emission points from room ventilation exhausts were identified in 2017 where emissions exceeded 10% of derived air concentration. These emission points feed to monitored stacks, and any radionuclide emissions are accounted for as noted for monitored emission points.
The Y-12 Complex Title V (Major Source) Operating Permits contain a site-wide, streamlined alternate emission limit for enriched and depleted uranium process emission units. A limit of 907 kg/year of particulate was set for the sources for the purposes of paying fees. The compliance method requires the

Oak Ridge Reservation Annual Site Environmental Report—2017
Y-12 National Security Complex 4-47
annual actual mass emission particulate emissions to be generated using the same monitoring methods required for Rad-NESHAPs compliance. An estimated 0.0268 Ci (3.43 kg) of uranium was released into the atmosphere in 2017 as a result of Y-12 Complex process and operational activities.
A UPF, presently being designed, is intended to house some of the processes that are currently in existing production buildings. The UPF project was initially issued Construction Air Permit 967550P. In 2017, the UPF was included in Y-12 Complex’s Title V Operating Permit 571832. The facility will be maintained on the permit as inactive until operations commence in about 2025.
The calculated radiation dose to the maximally exposed off-site individual from airborne radiological release points at the Y-12 Complex during 2017 was 0.24 millirem (mrem). This dose is well below the NESHAP standard of 10 mrem and is less than 0.08% of the roughly 300 mrem that the average individual receives from natural sources of radiation. See Chapter 7 for an explanation of how the airborne radionuclide dose was determined.
4.4.1.3 Quality Assurance Quality assurance (QA) activities for the Rad-NESHAPs program are documented in the Y-12 National Security Complex Quality Assurance Project Plan for National Emission Standards for Hazardous Air Pollutants for Radionuclide Emission Measurements (B&W Y-12 2010). The plan satisfies the QA requirements in 40 CFR Part 61, Method 114, for ensuring that the radionuclide air emission measurements from the Y-12 Complex are representative to known levels of precision and accuracy and that administrative controls are in place to ensure prompt response when emission measurements indicate an increase over normal radionuclide emissions. The requirements are also referenced in TDEC Regulation 1200-3-11-.08. The plan ensures the quality of the Y-12 Complex radionuclide emission measurements data from the continuous samplers, breakthrough monitors, and minor radionuclide release points. It specifies the procedures for managing activities affecting the quality of data. QA objectives for completeness, sensitivity, accuracy, and precision are discussed. Major programmatic elements addressed in the QA plan are the sampling and monitoring program, emissions characterization, analytical program, and minor source emission estimates.
4.4.1.4 Source-Specific Criteria Pollutants Proper maintenance and operation of a number of control devices (e.g., HEPA filters and scrubbers) are key to controlling emissions of criteria pollutants. The primary source of criteria pollutants at the Y-12 Complex is the steam plant, where only natural gas and Number 2 fuel oil are permitted to be burned. Information regarding actual versus allowable emissions from the steam plant is provided in Table 4.9.
Particulate emissions from point sources result from many operations throughout the Y-12 Complex. Compliance demonstration is achieved via several activities, including monitoring the operations of control devices, limiting process input materials, and using certified readers to conduct stack-visible emission evaluations.
Use of solvent 140/142 and methanol throughout the complex and use of acetonitrile at a single source are primary sources of VOC emissions. Material mass balances and engineering calculations are used to determine annual emissions. The calculated amounts of solvent 140/142 and methanol emitted for CY 2017 are 1,149.98 lb (0.575 tons) and 27,225 lb (13.61 tons), respectively. The highest calculated amount of acetonitrile and isopropyl alcohol (VOCs) emitted to the atmosphere for CY 2017 was 5.239 tons, which was less than the permitted value of 9 tons/year.

Oak Ridge Reservation Annual Site Environmental Report—2017
Y-12 National Security Complex 4-48
4.4.1.5 Mandatory Reporting of Greenhouse Gas Emissions under 40 Code of Federal Regulations 98
Title 40 of CFR Part 98, Mandatory Greenhouse Gas Reporting (EPA 2010), establishes mandatory GHG reporting requirements for owners and operators of certain facilities that directly emit GHGs and for certain fossil fuel suppliers and industrial GHG suppliers. The purpose of the rule is to collect accurate and timely data on GHG emissions that can be used to inform future policy decisions.
The mandatory reporting of GHGs rule requires reporting of annual emissions of carbon dioxide, methane, nitrous oxide, sulfur hexafluoride, hydrofluorocarbons, perfluorochemicals, and other fluorinated gases (e.g., nitrogen trifluoride and hydrofluorinated ethers). These gases are often expressed in metric tons of carbon dioxide equivalent (CO2e).
The Y-12 Complex is subject only to the Subpart A general provisions and reporting from stationary fuel combustion sources covered in 40 CFR 98, Subpart C, General Stationary Fuel Combustion. Currently, the rule does not require control of GHGs; rather, it requires only that sources emitting above the 25,000-CO2e threshold level monitor and report emissions.
The Y-12 Complex steam plant is subjected to this rule. The steam plant consists of four boilers. The maximum heat input capacity of each boiler shall not exceed 99 MM British thermal unit per hour (Btu/hr). Natural gas is the primary fuel source for the boilers; Number 2 fuel oil is a backup source of fuel. Other limited, stationary combustion sources are metal-forming operations and production furnaces that use natural gas. In Bldg. 9212, a gas-fired furnace used for drying wet residues and burning solids in a recovery process has a maximum heat input of 700,000 Btu/hr. In Bldg. 9215, 10 natural gas torches, each at 300 standard ft3/hr, are used to preheat tooling associated with a forging and forming press. In Bldg. 9204-2, natural gas is used to heat two electrolytic cells. The maximum rated heat input to the burners on each cell is 550,000 Btu/hr.
All of the combustion units burning natural gas are served through the fuel supply and distribution system and are reported as combined emissions consistent with the provisions of 40 CFR 98.36(c)(3). The Tier 1 Calculation Method was used to calculate GHGs from the Y-12 Complex. The amount of natural gas supplied to the site, along with the fuel use logs, provides the basic information for calculation of the GHG emissions.
The emissions report is submitted electronically in a format specified by the EPA administrator. Each report is signed by a designated representative of the owner or operator, certifying under penalty of law that the report has been prepared in accordance with the requirements of the rule. The total amount of GHGs, subject to the mandatory reporting rule, emitted from the Y-12 Complex is shown in Table 4.10. The decrease in emissions from 2010 to 2017 is associated with the fact that coal is no longer burned since the natural-gas-fired steam plant came on line.
4.4.1.6 Hazardous Air Pollutants (Non-radiological) Beryllium emissions from machine shops are regulated under a State-issued permit and are subject to a limit of 10 g/24 hr. Compliance is demonstrated through a one-time stack test and through monitoring of control device operations. Hydrogen fluoride is used at one emission source, and emissions are controlled through the use of scrubber systems. The beryllium control devices and the scrubber systems were monitored during 2016 and were found to be operating properly.
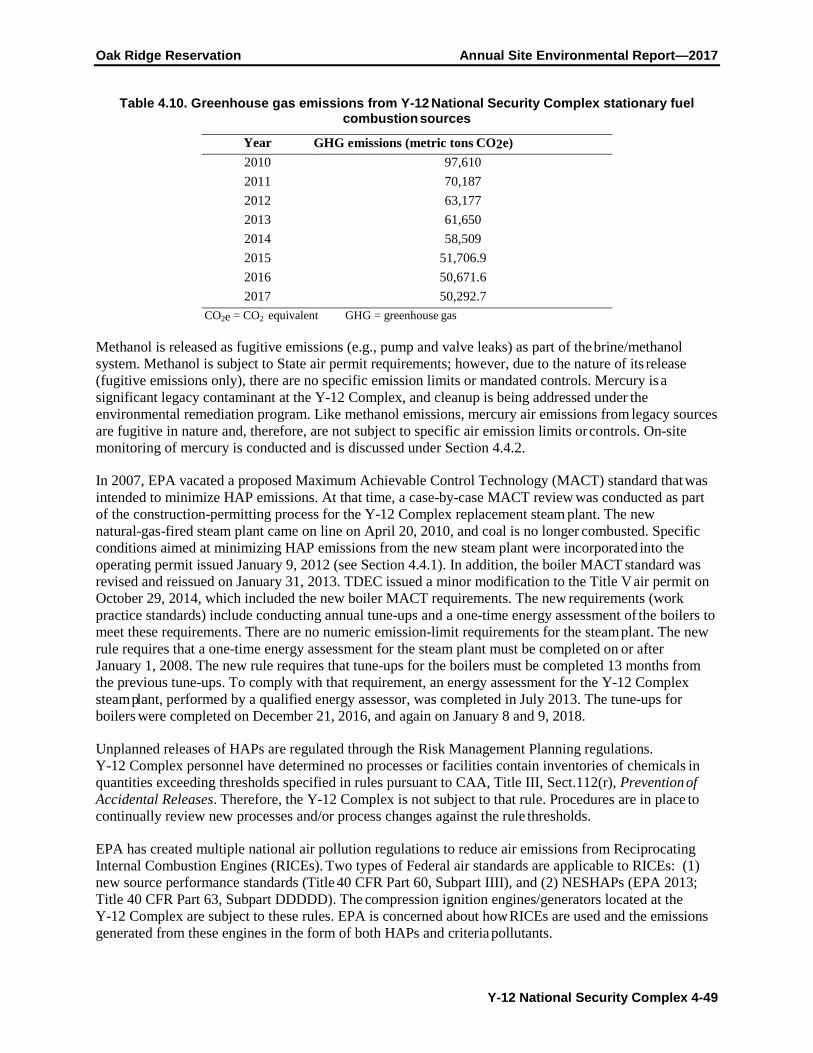
Oak Ridge Reservation Annual Site Environmental Report—2017
Y-12 National Security Complex 4-49
Table 4.10. Greenhouse gas emissions from Y-12 National Security Complex stationary fuel combustion sources
Year GHG emissions (metric tons CO2e) 2010 97,610 2011 70,187 2012 63,177 2013 61,650 2014 58,509 2015 51,706.9 2016 50,671.6 2017 50,292.7
CO2e = CO2 equivalent GHG = greenhouse gas
Methanol is released as fugitive emissions (e.g., pump and valve leaks) as part of the brine/methanol system. Methanol is subject to State air permit requirements; however, due to the nature of its release (fugitive emissions only), there are no specific emission limits or mandated controls. Mercury is a significant legacy contaminant at the Y-12 Complex, and cleanup is being addressed under the environmental remediation program. Like methanol emissions, mercury air emissions from legacy sources are fugitive in nature and, therefore, are not subject to specific air emission limits or controls. On-site monitoring of mercury is conducted and is discussed under Section 4.4.2.
In 2007, EPA vacated a proposed Maximum Achievable Control Technology (MACT) standard that was intended to minimize HAP emissions. At that time, a case-by-case MACT review was conducted as part of the construction-permitting process for the Y-12 Complex replacement steam plant. The new natural-gas-fired steam plant came on line on April 20, 2010, and coal is no longer combusted. Specific conditions aimed at minimizing HAP emissions from the new steam plant were incorporated into the operating permit issued January 9, 2012 (see Section 4.4.1). In addition, the boiler MACT standard was revised and reissued on January 31, 2013. TDEC issued a minor modification to the Title V air permit on October 29, 2014, which included the new boiler MACT requirements. The new requirements (work practice standards) include conducting annual tune-ups and a one-time energy assessment of the boilers to meet these requirements. There are no numeric emission-limit requirements for the steam plant. The new rule requires that a one-time energy assessment for the steam plant must be completed on or after January 1, 2008. The new rule requires that tune-ups for the boilers must be completed 13 months from the previous tune-ups. To comply with that requirement, an energy assessment for the Y-12 Complex steam plant, performed by a qualified energy assessor, was completed in July 2013. The tune-ups for boilers were completed on December 21, 2016, and again on January 8 and 9, 2018.
Unplanned releases of HAPs are regulated through the Risk Management Planning regulations. Y-12 Complex personnel have determined no processes or facilities contain inventories of chemicals in quantities exceeding thresholds specified in rules pursuant to CAA, Title III, Sect.112(r), Prevention of Accidental Releases. Therefore, the Y-12 Complex is not subject to that rule. Procedures are in place to continually review new processes and/or process changes against the rule thresholds.
EPA has created multiple national air pollution regulations to reduce air emissions from Reciprocating Internal Combustion Engines (RICEs). Two types of Federal air standards are applicable to RICEs: (1) new source performance standards (Title 40 CFR Part 60, Subpart IIII), and (2) NESHAPs (EPA 2013; Title 40 CFR Part 63, Subpart DDDDD). The compression ignition engines/generators located at the Y-12 Complex are subject to these rules. EPA is concerned about how RICEs are used and the emissions generated from these engines in the form of both HAPs and criteria pollutants.

Oak Ridge Reservation Annual Site Environmental Report—2017
Y-12 National Security Complex 4-50
All previous stationary emergency engines/generators were listed in the Y-12 Complex Title V air permit application as “insignificant activities.” However, on January 16, 2013, EPA finalized revisions to standards to reduce air pollution from stationary engines that generate electricity and power equipment at sites of major sources of HAPs. Regardless of engine size, the rules apply to any existing, new, or reconstructed stationary RICE located at a major source of HAP emissions.
To comply with the rules, the Y-12 Complex prepared a significant permit modification to the Y-12 Complex Title V (Major Source) Operating Air Permit to add numerous stationary, emergency-use engines/generators located throughout the Y-12 Complex. The permit application was submitted to TDEC on May 6, 2013, for review and approval. TDEC downgraded the significant modification to a minor modification per EPA’s review and request. In a prior, updated permit application for renewal of the Y-12 Complex Title V (Major Source) Operating Air Permit dated March 9, 2011, Y-12 Complex staff identified Title 40 CFR, Part 60, Subpart IIII, and “Standards of Performance for Stationary Compression Ignition Internal Combustion Engines,” as requirements applicable to the stationary emergency use engines located at the Y-12 Complex. TDEC issued the Y-12 Complex a minor permit modification to the Title V air permit on March 3, 2014, for the emergency engines/generators. Compliance for the engines/generators is determined through monthly records of the operation of the engines/generators that are recorded through a non-resettable hour meter on each engine/generator. Documentation must be maintained of how many hours are spent for: (1) emergency operation, (2) maintenance checks and readiness testing, and (3) non-emergency operation. Each engine/generator must use only diesel fuel with low sulfur content (15 parts per million) and a cetane index of 40.
4.4.2 Ambient Air
To understand the complete picture of ambient air monitoring in and around the Y-12 Complex, data from on- and off-site monitoring conducted specifically for the Y-12 Complex, reservation-wide surveillance monitoring, and on- and off-site monitoring conducted by EPA and TDEC personnel must be considered. No Federal regulations, State regulations, or DOE Orders require ambient air monitoring within the Y-12 Complex boundary; however, on-site ambient air monitoring for mercury and radionuclides is conducted as a best management practice. With the reduction of plant operations and improved emission and administrative controls, levels of measured pollutants have decreased significantly during the past several years. In addition, major processes that result in emission of enriched and depleted uranium are equipped with stack samplers that have been reviewed and approved by EPA to meet requirements of the NESHAP regulations.
4.4.2.1 Mercury The Y-12 Complex ambient air monitoring program for mercury was established in 1986 as a best management practice. The objectives of the program have been to maintain a database of mercury concentrations in ambient air, to track long-term spatial and temporal trends in ambient mercury vapor, and to demonstrate protection of the environment and human health from releases of mercury to the atmosphere at the Y-12 Complex. The two atmospheric mercury monitoring stations currently operating at the Y-12 Complex, ambient air (monitoring) station (AAS)2 and AAS8, are located near the east and west boundaries of the Y-12 Complex, respectively (Figure 4.12). Since their establishment in 1986, AAS2 and AAS8 have monitored mercury in ambient air continuously, with the exception of short intervals of downtime because of electrical or equipment outages. In addition to the monitoring stations located at the Y-12 Complex, two additional monitoring sites were operated—a reference site (rain gauge 2) was operated on Chestnut Ridge in the Walker Branch Watershed for a 20-month period in 1988 and 1989 to establish a reference concentration, and a site was operated at New Hope Pond for a 25-month period from August 1987 to September 1989.

Oak Ridge Reservation Annual Site Environmental Report—2017
Y-12 National Security Complex 4-51
Figure 4.12. Locations of ambient air monitoring stations at the Y-12 National Security Complex EPA = U.S. Environmental Protection Agency (sampler) TDEC = Tennessee Department of Environment and Conservation JCC = Jack Case Center
To determine mercury concentrations in ambient air, airborne mercury vapor is collected by pulling ambient air through a sampling train consisting of a Teflon filter and an iodinated-charcoal sampling trap. A flow-limiting orifice upstream of the sampling trap restricts airflow through the sampling train to approximately 1 L/min. Actual flows are measured bi-weekly with a calibrated Gilmont flow meter in conjunction with the bi-weekly change-out of the sampling trap. The charcoal in each trap is analyzed for total mercury using cold vapor atomic fluorescence spectrometry after acid digestion. The average concentration of mercury vapor in ambient air for each 14-day sampling period is then calculated by dividing the total mercury per trap by the volume of air pulled through the trap during the corresponding 14-day sampling period.
As reported previously, average mercury concentration at the ambient air monitoring sites has declined significantly since the late 1980s. Recent average annual concentrations at the two boundary stations are comparable to concentrations measured in 1988 and 1989 at the Chestnut Ridge reference site (Table 4.11). Average mercury concentration at the AAS2 site for 2017 is 0.0030 µg/m3 (N = 24), comparable to averages measured since 2003. After an increase in average concentration at the AAS8 site for the period 2005 through 2007, thought to be possibly due to increased decontamination and decommissioning work on the west end, the average concentration at AAS8 for 2017 was 0.0037 µg/m3 (N = 24), similar to levels reported for 2008 and the early 2000s.

Oak Ridge Reservation Annual Site Environmental Report—2017
Y-12 National Security Complex 4-52
Table 4.11. Summary of data for the Y-12 National Security Complex ambient air monitoring program for mercury for Calendar Year 2017
Ambient air monitoring stations
Mercury vapor concentration (µg/m3) 2017
Minimum 2017
Maximum 2017
Average 1986–1988a
Average AAS2 (east end of the Y-12 Complex) 0.0017 0.0054 0.0030 0.010 AAS8 (west end of the Y-12 Complex) 0.0021 0.0071 0.0037 0.033 Reference site, rain gauge 2 (1988b) N/A N/A N/A 0.006 Reference site, rain gauge 2 (1989c) N/A N/A N/A 0.005 aPeriod in late 1980s with elevated ambient air mercury levels; shown for comparison. bData for period from February 9 through December 31, 1988. cData for period from January 1 through October 31, 1989.
AAS = ambient air (monitoring) station CY = Calendar Year N/A = not applicable Y-12 Complex = Y-12 National Security Complex
Table 4.11 summarizes the 2017 mercury results, with results from the 1986 through 1988 period included for comparison. Figure 4.13 illustrates temporal trends in mercury concentration for the two active mercury monitoring sites for the period since the inception of the program in 1986 through 2017 (parts [a] and [b]) and seasonal trends at AAS8 from 1994 through 2017 (part [c]). The dashed line superimposed on the plots in Figures 4.13(a) and (b) is the EPA reference concentration of 0.3 µg/m3 for chronic inhalation exposure. The large increase in mercury concentration at AAS8 observed in the late 1980s (part [b]) was thought to be related to disturbances of mercury-contaminated soils and sediments during the Perimeter Intrusion Detection Assessment System installation and storm drain restoration projects under way at that time. In Figure 4.13(c), a monthly moving average has been superimposed over the AAS8 data to highlight seasonal trends in mercury at AAS8 from January 1994 through 2017.
The dashed lines superimposed on parts (a) and (b) represent the EPA reference concentration of 0.3 µg/m3 for chronic inhalation exposure. In part (c) (note the different concentration scale), a monthly moving average has been superimposed over the data to highlight seasonal trends in mercury at AAS8 from January 1993 to December 2017, with higher concentrations generally measured during the warm weather months.
In conclusion, 2017 average mercury concentrations at the two mercury monitoring sites were comparable to reference levels measured for the Chestnut Ridge reference site in 1988 and 1989. More importantly, measured concentrations continue to be well below current environmental and occupational health standards for inhalation exposure to mercury vapor (i.e., the National Institute for Occupational Safety and Health-recommended exposure limit of 50 µg/m3, time-weighted average for up to a 10-hr workday, 40-hr workweek; the American Conference of Governmental Industrial Hygienists workplace threshold limit value of 25 µg/m3 as a time-weighted average for a normal 8-hr workday and 40-hr workweek; and the current EPA reference concentration of 0.3 µg/m3 for elemental mercury for a continuous inhalation exposure to the human population without appreciable risk of harmful effects during a lifetime).
4.4.2.2 Quality Control A number of QA/quality control (QC) steps are taken to ensure the quality of the data for Y-12 Complex mercury in the ambient air monitoring program.
An hour meter records the actual operating hours between sample changes. This allows for correction of total flow in the event of power outages during the weekly sampling interval.

Oak Ridge Reservation Annual Site Environmental Report—2017
Y-12 National Security Complex 4-53
Figure 4.13. Temporal trends in mercury vapor concentration for the boundary monitoring stations at
the Y-12 National Security Complex, July 1986 to January 2017 ([a] and [b]) and January 1994 to January 2017 for ambient air station 8 ([c])
The Gilmont correlated flow meter, used for measuring flows through the sampling train, is purchased annually or, if not new, shipped back to the manufacturer annually for calibration in accordance with standards set by the National Institute of Standards and Technology (NIST).
A minimum of 5% of the samples in each batch submitted to the analytical laboratory are blank samples. The blank sample traps are submitted “blind” to verify trap blank values and to serve as a field blank for diffusion of mercury vapor into used sample traps during storage before analysis.
To verify the absence of mercury breakthrough, 5% to 10% of the field samples have the front (upstream) and back segments of the charcoal sample trap analyzed separately. The absence of mercury above blank values on the back segment confirms the absence of breakthrough.
Chain-of-custody forms track the transfer of sample traps from the field technicians all the way to the analytical laboratory.

Oak Ridge Reservation Annual Site Environmental Report—2017
Y-12 National Security Complex 4-54
A field performance evaluation is conducted annually by the project manager to ensure that proper procedures are followed by the sampling technicians. No issues were identified in the last evaluation conducted on August 10, 2017.
Analytical QA/QC requirements include the following:
• use of prescreened and/or laboratory purified reagents, • analysis of at least two method blanks per batch, • analysis of standard reference materials, • analysis of laboratory duplicates (1 per 10 samples; any laboratory duplicates differing by more
than 10% at 5 or more times the detection limit are to be rerun [third duplicate] to resolve the discrepancy), and
• archiving all primary laboratory records for at least 1 year.
4.4.2.3 Ambient Air Monitoring Complementary to the Y-12 National Security Complex Ambient Air Monitoring
Ambient air monitoring is conducted at multiple locations near ORR to measure radiological and other selected parameters directly in the ambient air. These monitors are operated in accordance with DOE Orders. Their locations were selected so that areas of potentially high exposure to the public are monitored continuously for parameters of concern. This monitoring provides direct measurement of airborne concentrations of radionuclides and other HAPs, allows facility personnel to determine the relative level of contaminants at the monitoring locations during an emergency, verifies that the contributions of fugitive and diffuse sources are insignificant, and serves as a check on dose-modeling calculations. As part of the ORR network, an AAS located in the Scarboro Community of Oak Ridge (Station 46) measures off-site impacts of Y-12 Complex operations. This station is located near the theoretical area of maximum public pollutant concentrations, as calculated by air-quality modeling. ORR network stations are also located at the east end of the Y-12 Complex (Station 40) and just south of the Country Club Estates neighborhood (Station 37).
In addition to the monitoring described above, the State of Tennessee (TDEC) and EPA perform ambient air monitoring to characterize the region in general and to characterize and monitor DOE operations locally. Specific to Y-12 Complex operations, there are three uranium ambient air monitors within the Y-12 Complex boundary that, since 1999, have been used by TDEC personnel in their environmental monitoring program. Each of the monitors uses 47-mm borosilicate glass-fiber filters to collect particulates as air is pulled through the units. The monitors control airflow with a pump and rotometer set to average about 2 standard ft3/min. During 2012, these uranium monitors at Stations 4, 5, and 8 were phased out of service, and two additional high-volume samplers (Figure 4.14) are now being used by TDEC to provide isotopic uranium monitoring capability. These are located on the east side of the Jack Case Center and on the south side of the Bldg. 9723-28 change house. EPA performs ambient air monitoring on the east end of the plant near the intersection of Scarboro Road and Bear Creek Road and on the west end of the plant near the intersection of Bear Creek Road and Old Bear Creek Road.
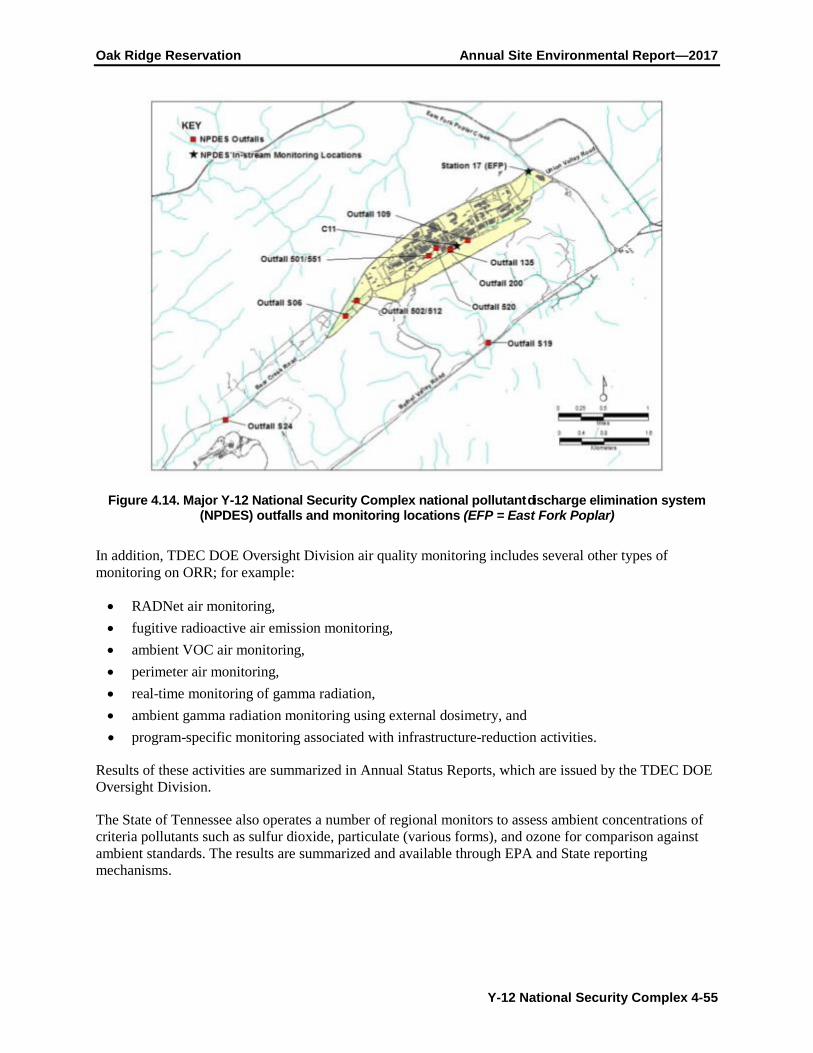
Oak Ridge Reservation Annual Site Environmental Report—2017
Y-12 National Security Complex 4-55
Figure 4.14. Major Y-12 National Security Complex national pollutant discharge elimination system (NPDES) outfalls and monitoring locations (EFP = East Fork Poplar)
In addition, TDEC DOE Oversight Division air quality monitoring includes several other types of monitoring on ORR; for example:
• RADNet air monitoring, • fugitive radioactive air emission monitoring, • ambient VOC air monitoring, • perimeter air monitoring, • real-time monitoring of gamma radiation, • ambient gamma radiation monitoring using external dosimetry, and • program-specific monitoring associated with infrastructure-reduction activities.
Results of these activities are summarized in Annual Status Reports, which are issued by the TDEC DOE Oversight Division.
The State of Tennessee also operates a number of regional monitors to assess ambient concentrations of criteria pollutants such as sulfur dioxide, particulate (various forms), and ozone for comparison against ambient standards. The results are summarized and available through EPA and State reporting mechanisms.
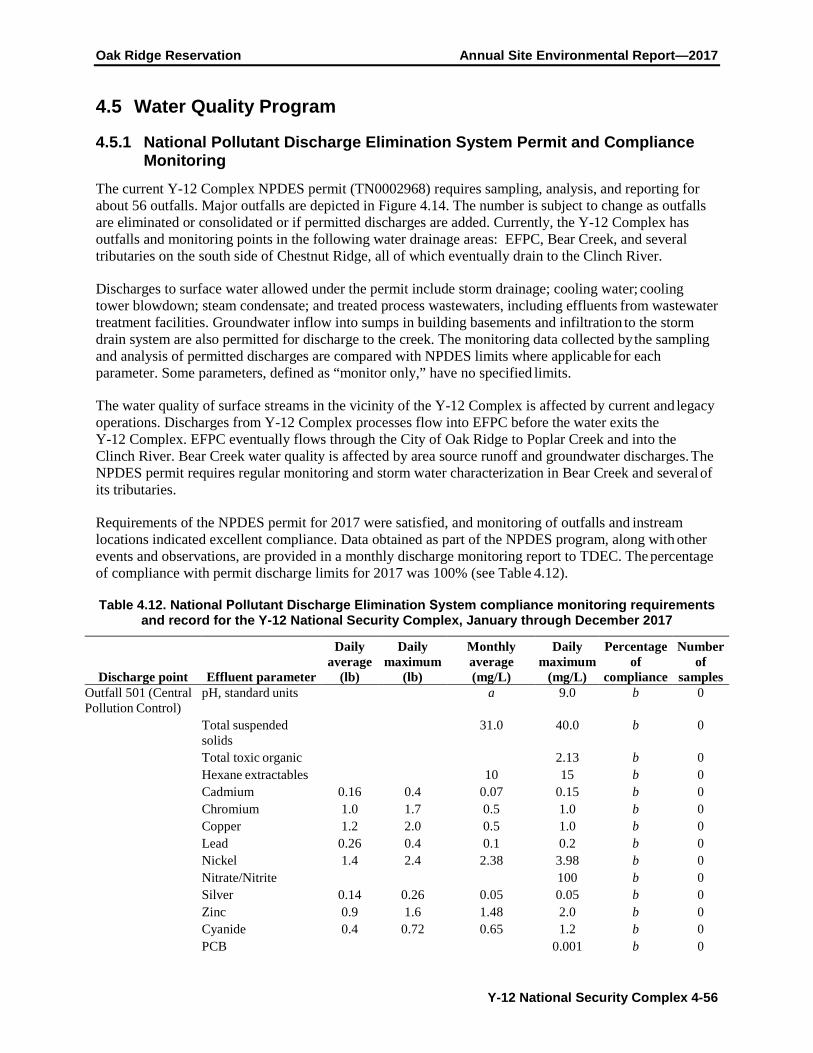
Oak Ridge Reservation Annual Site Environmental Report—2017
Y-12 National Security Complex 4-56
4.5 Water Quality Program
4.5.1 National Pollutant Discharge Elimination System Permit and Compliance Monitoring
The current Y-12 Complex NPDES permit (TN0002968) requires sampling, analysis, and reporting for about 56 outfalls. Major outfalls are depicted in Figure 4.14. The number is subject to change as outfalls are eliminated or consolidated or if permitted discharges are added. Currently, the Y-12 Complex has outfalls and monitoring points in the following water drainage areas: EFPC, Bear Creek, and several tributaries on the south side of Chestnut Ridge, all of which eventually drain to the Clinch River.
Discharges to surface water allowed under the permit include storm drainage; cooling water; cooling tower blowdown; steam condensate; and treated process wastewaters, including effluents from wastewater treatment facilities. Groundwater inflow into sumps in building basements and infiltration to the storm drain system are also permitted for discharge to the creek. The monitoring data collected by the sampling and analysis of permitted discharges are compared with NPDES limits where applicable for each parameter. Some parameters, defined as “monitor only,” have no specified limits.
The water quality of surface streams in the vicinity of the Y-12 Complex is affected by current and legacy operations. Discharges from Y-12 Complex processes flow into EFPC before the water exits the Y-12 Complex. EFPC eventually flows through the City of Oak Ridge to Poplar Creek and into the Clinch River. Bear Creek water quality is affected by area source runoff and groundwater discharges. The NPDES permit requires regular monitoring and storm water characterization in Bear Creek and several of its tributaries.
Requirements of the NPDES permit for 2017 were satisfied, and monitoring of outfalls and instream locations indicated excellent compliance. Data obtained as part of the NPDES program, along with other events and observations, are provided in a monthly discharge monitoring report to TDEC. The percentage of compliance with permit discharge limits for 2017 was 100% (see Table 4.12).
Table 4.12. National Pollutant Discharge Elimination System compliance monitoring requirements and record for the Y-12 National Security Complex, January through December 2017
Discharge point Effluent parameter
Daily average
(lb)
Daily maximum
(lb)
Monthly average (mg/L)
Daily maximum
(mg/L)
Percentage of
compliance
Number of
samples Outfall 501 (Central Pollution Control)
pH, standard units a 9.0 b 0
Total suspended solids
31.0 40.0 b 0
Total toxic organic 2.13 b 0 Hexane extractables 10 15 b 0 Cadmium 0.16 0.4 0.07 0.15 b 0 Chromium 1.0 1.7 0.5 1.0 b 0 Copper 1.2 2.0 0.5 1.0 b 0 Lead 0.26 0.4 0.1 0.2 b 0 Nickel 1.4 2.4 2.38 3.98 b 0 Nitrate/Nitrite 100 b 0 Silver 0.14 0.26 0.05 0.05 b 0 Zinc 0.9 1.6 1.48 2.0 b 0 Cyanide 0.4 0.72 0.65 1.2 b 0 PCB 0.001 b 0
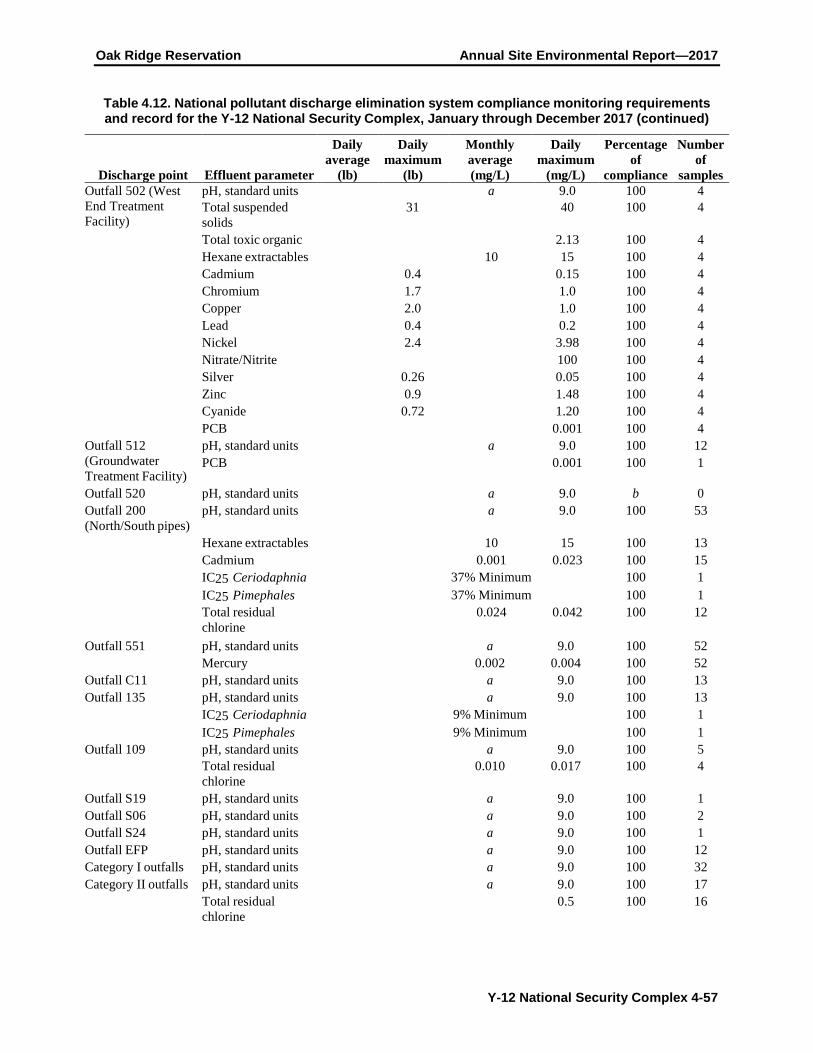
Oak Ridge Reservation Annual Site Environmental Report—2017
Y-12 National Security Complex 4-57
Table 4.12. National pollutant discharge elimination system compliance monitoring requirements and record for the Y-12 National Security Complex, January through December 2017 (continued)
Discharge point Effluent parameter
Daily average
(lb)
Daily maximum
(lb)
Monthly average (mg/L)
Daily maximum
(mg/L)
Percentage of
compliance
Number of
samples Outfall 502 (West End Treatment Facility)
pH, standard units a 9.0 100 4 Total suspended solids
31 40 100 4
Total toxic organic 2.13 100 4 Hexane extractables 10 15 100 4 Cadmium 0.4 0.15 100 4 Chromium 1.7 1.0 100 4 Copper 2.0 1.0 100 4 Lead 0.4 0.2 100 4 Nickel 2.4 3.98 100 4 Nitrate/Nitrite 100 100 4 Silver 0.26 0.05 100 4 Zinc 0.9 1.48 100 4 Cyanide 0.72 1.20 100 4 PCB 0.001 100 4 Outfall 512 (Groundwater Treatment Facility)
pH, standard units a 9.0 100 12 PCB 0.001 100 1
Outfall 520 pH, standard units a 9.0 b 0 Outfall 200 (North/South pipes)
pH, standard units a 9.0 100 53
Hexane extractables 10 15 100 13 Cadmium 0.001 0.023 100 15 IC25 Ceriodaphnia 37% Minimum 100 1 IC25 Pimephales 37% Minimum 100 1 Total residual
chlorine 0.024 0.042 100 12
Outfall 551 pH, standard units a 9.0 100 52 Mercury 0.002 0.004 100 52 Outfall C11 pH, standard units a 9.0 100 13 Outfall 135 pH, standard units a 9.0 100 13 IC25 Ceriodaphnia 9% Minimum 100 1 IC25 Pimephales 9% Minimum 100 1 Outfall 109 pH, standard units a 9.0 100 5 Total residual
chlorine 0.010 0.017 100 4
Outfall S19 pH, standard units a 9.0 100 1 Outfall S06 pH, standard units a 9.0 100 2 Outfall S24 pH, standard units a 9.0 100 1 Outfall EFP pH, standard units a 9.0 100 12 Category I outfalls pH, standard units a 9.0 100 32 Category II outfalls pH, standard units a 9.0 100 17 Total residual
chlorine 0.5 100 16

Oak Ridge Reservation Annual Site Environmental Report—2017
Y-12 National Security Complex 4-58
Table 4.12. National pollutant discharge elimination system compliance monitoring requirements and record for the Y-12 National Security Complex, January through December 2017 (continued)
Discharge point Effluent parameter
Daily average
(lb)
Daily maximum
(lb)
Monthly average (mg/L)
Daily maximum
(mg/L)
Percentage of
compliance
Number of
samples Category III outfalls pH, standard units a 9.0 100 7 Total residual
chlorine a 0.5 100 6
aNot applicable. bNo discharge.
IC25 = 25% inhibition concentration PCB = polychlorinated biphenyl
4.5.2 Radiological Monitoring Plan and Results
A radiological monitoring plan is in place at the Y-12 Complex to address compliance with DOE Orders and NPDES permit TN0002968. The permit requires the Y-12 Complex to submit results from the radiological monitoring plan quarterly as an addendum to the NPDES Discharge Monitoring Report. There were no discharge limits set by the NPDES permit for radionuclides; the requirement is to monitor and report. The radiological monitoring plan was developed based on an analysis of operational history, expected chemical and physical relationships, and historical monitoring results. Under the existing plan, effluent monitoring is conducted at three types of locations: (1) treatment facilities, (2) other point-source and area-source discharges, and (3) instream locations. Operational history and past monitoring results provide a basis for parameters routinely monitored under the plan (Table 4.13). The current Radiological Monitoring Plan for the Y-12 Complex (B&W Y-12 2012) was last revised and reissued in January 2012.
Radiological monitoring during storm water events is accomplished as part of the storm water monitoring program. Uranium is monitored at three major EFPC storm water outfalls, two instream monitoring locations, and an outfall on Bear Creek. In addition, the monthly 7-day composite sample for radiological parameters taken at Station 17 on EFPC likely includes rain events.
Table 4.13. Radiological parameters monitored at the Y-12 National Security Complex, 2017
Parameters Specific isotopes Rationale for monitoring Uranium isotopes 238U, 235U, 234U, total U,
weight % 235U
These parameters reflect the major activity, uranium processing, throughout the history of the Y-12 Complex and are the dominant detectable radiological parameters in surface water
Fission and activation products
90Sr, 3H, 99Tc, 137Cs These parameters reflect a minor activity at the Y-12 Complex, processing recycled uranium from reactor fuel elements from the early 1960s to the late 1980s, and will continue to be monitored as tracers for beta and gamma radionuclides, although their concentrations in surface water are low
Transuranium isotopes 241Am, 237Np, 238Pu, 239/240Pu
These parameters are related to recycle uranium processing. Monitoring has continued because of their half-lives and presence in groundwater
Other isotopes of interest 232Th, 230Th, 228Th, 226Ra, 228Ra
These parameters reflect historical thorium processing and natural radionuclides necessary to characterize background radioisotopes
Y-12 Complex = Y-12 National Security Complex

Oak Ridge Reservation Annual Site Environmental Report—2017
Y-12 National Security Complex 4-59
Radiological monitoring plan locations sampled in 2017 are noted on Figure 4.15. Table 4.14 identifies the monitored locations, the frequency of monitoring, and the sum of the percentages of the derived concentration standards for radionuclides measured in 2017. Radiological data were well below the allowable derived concentration standards.
Figure 4.15. Surface water and sanitary sewer radiological sampling locations at the Y-12 National Security Complex
Table 4.14. Summary of Y-12 National Security Complex radiological monitoring plan sample requirements and 2017 results
Location Sample frequency Sample type Sum of DCS percentages Y-12 Complex wastewater treatment facilities
Central Pollution Control Facility 1/batch Composite during batch operation
No flow
West End Treatment Facility 1/batch 24-hr composite 2.6 Groundwater Treatment Facility 4/year 24-hr composite 3.3 Steam condensate 1/year Grab No flow Central Mercury Treatment Facility 4/year 24-hr composite 0.8
Other Y-12 Complex point- and area-source discharges Outfall 135 4/year 24-hr composite 0.99 Kerr Hollow Quarry 1/year 24-hr composite 0.82 Rogers Quarry 1/year 24-hr composite 4.2
Y-12 Complex instream locations Outfall S24 1/year 7-day composite 6.4 East Fork Poplar Creek, complex exit (east) 1/month 7-day composite 1.9 North/south pipes 1/month 24-hr composite 5.2
Y-12 Complex Sanitary Sewer East End Sanitary Sewer Monitoring Station 1/year 7-day composite 28 DCS = derived concentration standard Y-12 Complex = Y-12 National Security Complex

Oak Ridge Reservation Annual Site Environmental Report—2017
Y-12 National Security Complex 4-60
In 2017, the total mass of uranium and associated curies released from the Y-12 Complex at the easternmost monitoring station, station 17 on upper EFPC, was 154 kg or 0.080 Ci (Table 4.15).
Table 4.15. Release of uranium from the Y-12 National Security Complex to the off-site environment as a liquid effluent, 2011–2017
Year Quantity released
Cia kg Station 17
2013 0.055 140 2014 0.061 90 2015 0.068 116 2016 0.045 88 2017 0.080 154
a1 Ci = 3.7E+10 Bq.
Figure 4.16 illustrates a 5-year trend of these releases. The total release is calculated by multiplying the average concentration (g/L) by the average flow (million gallons per day [mgd]). Converting units and multiplying by 365 days per year yields the calculated discharge.
The Y-12 Complex is permitted to discharge domestic wastewater to the City of Oak Ridge’s publicly owned treatment works. Radiological monitoring of the sanitary sewer system discharge is conducted and reported to the City of Oak Ridge, although there are no city-established radiological limits. Alpha and beta levels are measured weekly, and subsequent uranium analyses are performed if the alpha or beta levels are above prescribed levels. Potential sources of radionuclides discharging to the sanitary sewer have been identified in previous studies at the Y-12 Complex as part of an initiative to meet goals to keep levels as low as reasonably achievable. Results of radiological monitoring were reported to the City of Oak Ridge in 2017 quarterly monitoring reports.
Figure 4.16. Five-year trend of Y-12 National Security Complex releases of uranium to East Fork Poplar Creek

Oak Ridge Reservation Annual Site Environmental Report—2017
Y-12 National Security Complex 4-61
4.5.3 Storm Water Pollution Prevention
The Storm Water Pollution Prevention Plan (SWPPP) at the Y-12 Complex is designed to minimize the discharge of pollutants in storm water runoff. The plan identifies areas that can reasonably be expected to contribute contaminants to surface water bodies via storm water runoff and describes the development and implementation of storm water management controls to reduce or eliminate the discharge of such pollutants. This plan requires: (1) characterization of storm water by sampling during storm events, (2) implementation of measures to reduce storm water pollution, (3) facility inspections, and (4) employee training.
The Y-12 Complex SWPPP underwent a significant rewrite in September 2012 in response to issuance of a modified NPDES permit in November 2011. Significant changes included the elimination of two instream monitoring locations (C05 and C08) and the removal of the requirement to perform instream base-load sediment sampling. Other requirements remained essentially the same, with the exception of the lowering of a few benchmark values for certain sector outfalls. The NPDES permit defines the primary function of the Y-12 Complex to be a fabricated metal products industry. However, it also requires that storm water monitoring be conducted for three additional sectors: scrap/waste recycling activities; landfill and land application activities; and discharges associated with treatment, storage, and disposal facilities as they are defined in the Tennessee Storm Water Multi Sector General Permit for Industrial Activities (TNR050000). Each sector has prescribed benchmark values, and some have defined sector mean values. The “rationale” portion of the NPDES permit for the Y-12 Complex states “These benchmark values were developed by the EPA and the State of Tennessee and are based on data submitted by similar industries for the development of the multi-sector general storm water permit. The benchmark concentrations are target values and should not be construed to represent permit limits.”
Storm water sampling was conducted in 2017 during rain events that occurred on April 3, May 4, July 27, and September 5. Results were published in the Annual Storm Water Report (CNS 2017a), which was submitted to the TDEC, Division of Water Pollution Control in December 2017. Consistent with permit requirements, storm water monitoring is performed each year for sector outfalls, three major outfalls that drain large areas of the Y-12 Complex, and two instream monitoring locations on EFPC (Figure 4.17).
The permit no longer calls for sampling of stream base-load sediment that is being transported as a result of the heavy flow.
A significant change from 2013 to 2014 was the elimination of flow augmentation in EFPC. This discharge of raw water into EFPC was discontinued on April 30, 2014; thus, raw water is no longer required to be sampled. The discontinuation of flow augmentation has reduced the flow in EFPC by a significant amount (about 3.3 mgd, or about 60%).
In general, the quality of storm water exiting the Y-12 Complex via EFPC remained relatively stable from 2016 to 2017. One area of concern continues to be the concentration of mercury being measured in the discharge from Outfall 014. Since the first unexpected elevated result in 2013 (7.12 µg/L), this sector outfall has been on an annual monitoring schedule. Subsequent concentrations are listed in Table 4.16. These elevated and sporadic changes in mercury concentrations at this location have garnered the attention of TDEC, Division of Water Resources personnel. Some discussion was given to routing the discharge from this outfall through the new mercury treatment facility. However, at this time, there are no plans to implement this change.
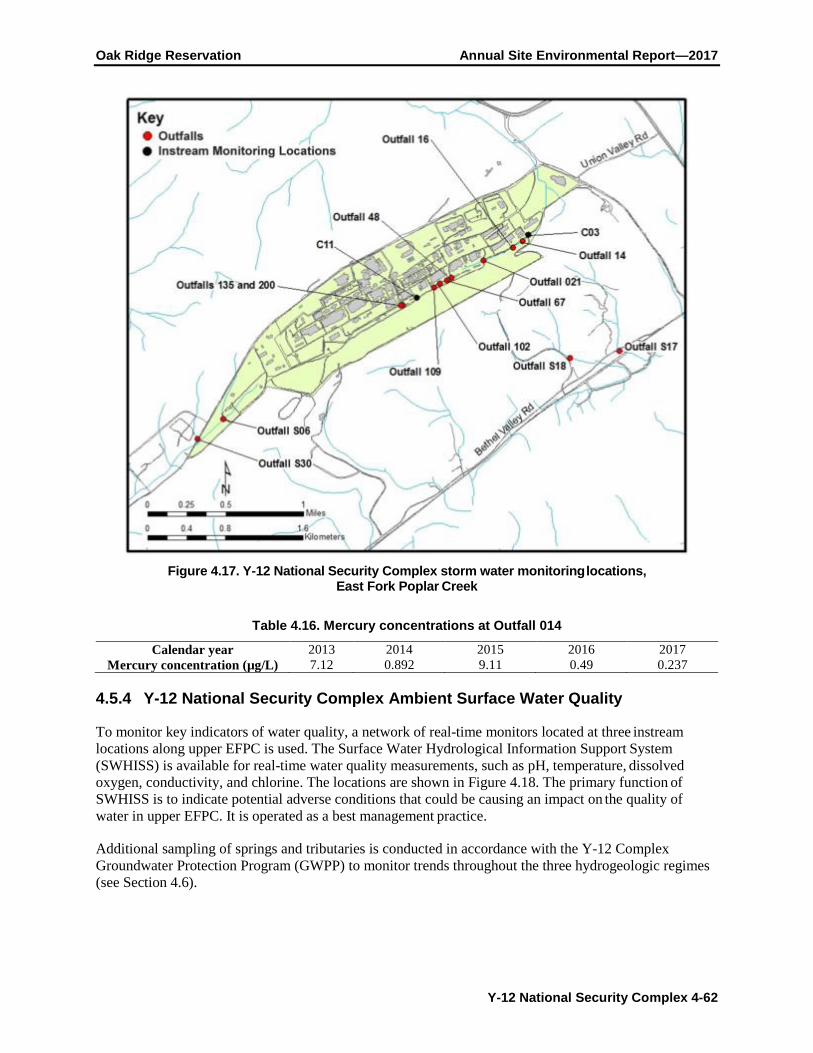
Oak Ridge Reservation Annual Site Environmental Report—2017
Y-12 National Security Complex 4-62
Figure 4.17. Y-12 National Security Complex storm water monitoring locations, East Fork Poplar Creek
Table 4.16. Mercury concentrations at Outfall 014
Calendar year 2013 2014 2015 2016 2017 Mercury concentration (µg/L) 7.12 0.892 9.11 0.49 0.237
4.5.4 Y-12 National Security Complex Ambient Surface Water Quality
To monitor key indicators of water quality, a network of real-time monitors located at three instream locations along upper EFPC is used. The Surface Water Hydrological Information Support System (SWHISS) is available for real-time water quality measurements, such as pH, temperature, dissolved oxygen, conductivity, and chlorine. The locations are shown in Figure 4.18. The primary function of SWHISS is to indicate potential adverse conditions that could be causing an impact on the quality of water in upper EFPC. It is operated as a best management practice.
Additional sampling of springs and tributaries is conducted in accordance with the Y-12 Complex Groundwater Protection Program (GWPP) to monitor trends throughout the three hydrogeologic regimes (see Section 4.6).

Oak Ridge Reservation Annual Site Environmental Report—2017
Y-12 National Security Complex 4-63
Figure 4.18. Surface Water Hydrological Information Support System (SWHISS) monitoring locations
4.5.5 Industrial Wastewater Discharge Permit
Industrial and Commercial User Wastewater Discharge Permit 1-91 defines requirements for the discharge of wastewaters to the sanitary sewer system as well as prohibitions for certain types of wastewaters. It prescribes requirements for monitoring certain parameters at the East End Sanitary Sewer Monitoring Station. The permit sets limits for most parameters. Samples for gross alpha, gross beta, and uranium are taken in a weekly 24-hr composite sample. The sample is analyzed for uranium if the alpha and beta values exceed certain levels. Other parameters (including metals, oil and grease, solids, and biological oxygen demand) are monitored on a monthly basis. Organic parameters are monitored once per quarter. Results of compliance sampling are reported quarterly. Flow is measured continuously at the monitoring station.
As part of the City of Oak Ridge’s pretreatment program, city personnel also use the east end monitoring station (also known as SS6, see Figure 4.18) to conduct compliance monitoring as required by the pretreatment regulations. City personnel also conduct twice-yearly compliance inspections.

Oak Ridge Reservation Annual Site Environmental Report—2017
Y-12 National Security Complex 4-64
During 2016 and the first part of 2017, the City of Oak Ridge and Y-12 Complex personnel negotiated a new permit for the Y-12 Complex. This new permit became effective July 1, 2017. Significant changes between the two permits are as follows:
• The previous permit contained a flow limit of 1.4M mgd. The revised permit contains two flow limits; a maximum instantaneous flow rate of 2,100 gallons per minute (gpm) and a maximum average total daily flow of 500,000 gal (computed on a quarterly basis).
• The revised permit eliminated daily maximum permit limits for metals and other parameters. • The revised limit for cyanide is significantly lower than that stated in the previous permit. • The revised permit contains a requirement to sample for hexavalent chromium, ammonia, and
methanol. Only hexavalent chromium has a permit limit and the other two parameters only have required detection limits.
Monitoring results from 2017 are contained in Table 4.17 (January through June 2017) and Table 4.18 (July through December 2017). There were five exceedances of permit limits in 2017; two exceedances of the 1.4-mgd limit under the previous permit and three exceedances of the 2,100-gpm limit under the revised permit.
Table 4.17. Y-12 National Security Complex Plant discharge point SS6, Sanitary Sewer Station 6, January through June 2017 (all units are mg/L unless noted otherwise)
Effluent parameter Number of
samples Average
value Daily maximum (effluent limit)a
Monthly average (effluent limit)a
Number of limit exceedances
Flow (kgal/day) 181 412 1,400 N/A 2 pH (standard units) 7 N/A 9/6b 9/6b 0 Biochemical oxygen demand 7 70.4 300 200 0
Kjeldhal nitrogen 7 21.3 90 45 0 Phenols—total recoverable 7 <0.039 0.3 0.15 0 Oil and grease 7 <7.6 50 25 0 Suspended solids 7 114 300 200 0 Cyanide 7 <0.0041 0.062 0.041 0 Arsenic 7 <0.003 0.025 0.010 0 Cadmium 7 <0.0003 0.005 0.0033 0 Chromium 7 <0.003 0.075 0.05 0 Copper 7 0.0257 0.21 0.14 0 Iron 7 0.52 30 10 0 Lead 7 <0.002 0.074 0.049 0 Mercury 11 0.002 0.035 0.023 0 Nickel 7 <0.003 0.032 0.021 0 Silver 7 <0.002 0.10 0.05 0 Zinc 7 0.110 0.75 0.35 0 Molybdenum 7 0.0423 0.05c 0.05c N/A Selenium 7 <0.007 0.01c 0.01c N/A Toluene 2 0.005U 0.005c 0.005c N/A Benzene 2 0.005U 0.005c 0.005c N/A 1,1,1-trichloroethane 2 0.005U 0.005c 0.005c N/A Ethylbenzene 2 0.005U 0.005c 0.005c N/A

Oak Ridge Reservation Annual Site Environmental Report—2017
Y-12 National Security Complex 4-65
Table 4.17. Y-12 National Security Complex Plant discharge point SS6, Sanitary Sewer Station 6, January through June 2017 (all units are mg/L unless noted otherwise) (continued)
Effluent parameter Number of
samples Average
value Daily maximum (effluent limit)a
Monthly average (effluent limit)a
Number of limit exceedances
Carbon tetrachloride 2 0.005U 0.005c 0.005c N/A Chloroform 2 0.006 0.005c 0.005c N/A Tetrachloroethylene 2 0.003J 0.005c 0.005c N/A Trichloroethene 2 0.005U 0.005c 0.005c N/A Trans-1,2-dichloroethylene 2 0.005U 0.005c 0.005c N/A Methylene chloride 4 0.003JU 0.005c 0.005c N/A aIndustrial and commercial users wastewater permit limits. bMaximum value/minimum value. cThere is not a permit limit for this parameter. This value is the required detection limit. N/A = not applicable
Table 4.18. Y-12 National Security Complex Plant discharge point SS6, Sanitary Sewer Station 6, July through December 2017 (all units are mg/L unless noted otherwise)
Effluent parameter Number of
samples Average
value Daily maximum
(gpm)a Monthly average (effluent limit)a
Number of limit exceedances
Max flow rate (gpm) 184 435 2,100 N/A 3 Flow (average kgpd) July through September
92 377 N/A 500 0
Flow (average kgpd) October through December
92 321 N/A 500 0
pH (standard units) 7 N/A N/A 9/6b 0 Biochemical oxygen demand 7 83.4 N/A 200 0
Kjeldhal nitrogen 7 23.7 N/A 45 0 Phenols—total recoverable 7 <0.028 N/A 0.15 0 Oil and grease 7 <6.97 N/A 25 0 Suspended solids 7 105 N/A 200 0 Cyanide 7 <0.0033 N/A 0.005 0 Arsenic 7 <0.005 N/A 0.010 0 Cadmium 7 <0.0005 N/A 0.0033 0 Chromium, hexavalent 7 0.005U N/A 0.053 0 Copper 7 0.033 N/A 0.14 0 Iron 7 0.619 N/A 10 0 Lead 7 <0.002 N/A 0.049 0 Mercury (lb/day) 7 0.00281 N/A 0.035 0 Nickel 7 <0.005 N/A 0.021 0 Silver 7 <0.0008 N/A 0.05 0 Zinc 7 0.13 N/A 0.35 0 Molybdenum 7 0.047 N/A 0.05c N/A Selenium 7 <0.009 N/A 0.01c N/A Toluene 2 0.005U N/A 0.005c N/A
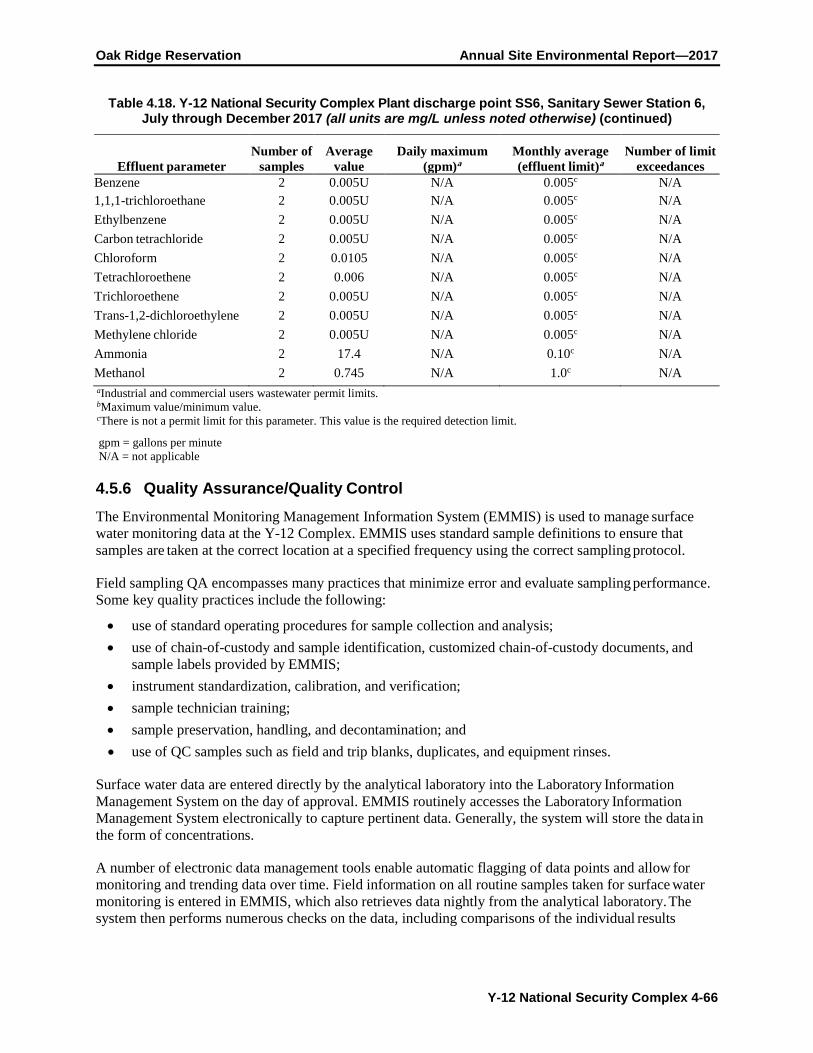
Oak Ridge Reservation Annual Site Environmental Report—2017
Y-12 National Security Complex 4-66
Table 4.18. Y-12 National Security Complex Plant discharge point SS6, Sanitary Sewer Station 6, July through December 2017 (all units are mg/L unless noted otherwise) (continued)
Effluent parameter Number of
samples Average
value Daily maximum
(gpm)a Monthly average (effluent limit)a
Number of limit exceedances
Benzene 2 0.005U N/A 0.005c N/A 1,1,1-trichloroethane 2 0.005U N/A 0.005c N/A Ethylbenzene 2 0.005U N/A 0.005c N/A Carbon tetrachloride 2 0.005U N/A 0.005c N/A Chloroform 2 0.0105 N/A 0.005c N/A Tetrachloroethene 2 0.006 N/A 0.005c N/A Trichloroethene 2 0.005U N/A 0.005c N/A Trans-1,2-dichloroethylene 2 0.005U N/A 0.005c N/A Methylene chloride 2 0.005U N/A 0.005c N/A Ammonia 2 17.4 N/A 0.10c N/A Methanol 2 0.745 N/A 1.0c N/A aIndustrial and commercial users wastewater permit limits. bMaximum value/minimum value. cThere is not a permit limit for this parameter. This value is the required detection limit.
gpm = gallons per minute N/A = not applicable
4.5.6 Quality Assurance/Quality Control The Environmental Monitoring Management Information System (EMMIS) is used to manage surface water monitoring data at the Y-12 Complex. EMMIS uses standard sample definitions to ensure that samples are taken at the correct location at a specified frequency using the correct sampling protocol.
Field sampling QA encompasses many practices that minimize error and evaluate sampling performance. Some key quality practices include the following:
• use of standard operating procedures for sample collection and analysis; • use of chain-of-custody and sample identification, customized chain-of-custody documents, and
sample labels provided by EMMIS; • instrument standardization, calibration, and verification; • sample technician training; • sample preservation, handling, and decontamination; and • use of QC samples such as field and trip blanks, duplicates, and equipment rinses.
Surface water data are entered directly by the analytical laboratory into the Laboratory Information Management System on the day of approval. EMMIS routinely accesses the Laboratory Information Management System electronically to capture pertinent data. Generally, the system will store the data in the form of concentrations.
A number of electronic data management tools enable automatic flagging of data points and allow for monitoring and trending data over time. Field information on all routine samples taken for surface water monitoring is entered in EMMIS, which also retrieves data nightly from the analytical laboratory. The system then performs numerous checks on the data, including comparisons of the individual results

Oak Ridge Reservation Annual Site Environmental Report—2017
Y-12 National Security Complex 4-67
against any applicable screening criteria, regulatory thresholds, compliance limits, best management practices, or other water quality indicators, and produces required reports.
4.5.7 Biomonitoring Program
In accordance with the requirements of the NPDES permit effective December 1, 2011, Part III-E, p. 31, two outfalls that discharge to the headwaters of EFPC (Outfalls 200 and 135) were evaluated for toxicity during 2017 using fathead minnow (Pimephales promelas) larvae and water fleas (Ceriodaphnia dubia). A third discharge once evaluated for toxicity, Outfall 125, no longer has sufficient base flows for toxicity to be evaluated. Table 4.19 summarizes the results of the 2017 outfall biomonitoring tests in terms of the 25% inhibition concentration (IC25), the concentration (i.e., a percentage of full-strength effluent diluted with laboratory control water) of each outfall effluent that causes a 25% reduction in water fleas (Ceriodaphnia dubia) survival or reproduction or fathead minnow (Pimephales promelas) survival or growth. The lower the value of the IC25, the more toxic the effluent.
Table 4.19. Y-12 National Security Complex Biomonitoring Program summary information for Outfalls 200 and 135 in 2017a
Site Test start date Species IC25b (%) Outfall 200 07/19/17 Ceriodaphnia dubia >100 Outfall 200 07/19/17 Pimephales promelas >100 Outfall 135 07/19/17 Ceriodaphnia dubia >36 Outfall 135 07/19/17 Pimephales promelas >36 aIC25 is summarized for the discharge monitoring locations, Outfalls 200 and 135. bIC25 as a percentage of full-strength effluent from Outfalls 200 and 135 diluted with laboratory control water. IC25 is the concentration that causes a 25% reduction in water fleas (Ceriodaphnia dubia) survival or reproduction or fathead minnow (Pimephales promelas) survival or growth; 36% is the highest concentration of Outfall 135 tested.
IC25 = 25% inhibition concentration (IC25)
Effluent from Outfall 135 did not reduce fathead minnow (Pimephales promelas) survival or growth or water fleas (Ceriodaphnia dubia) survival or reproduction by 25% or more at any of the tested concentrations. For both species, the IC25 for survival, growth, or reproduction was >36% (the highest concentration of this effluent that was tested). Toxicity is demonstrated according to the NPDES permit if the IC25 is less than or equal to the permit limit (9% whole effluent for Outfall 135).
Effluent from Outfall 200 also did not reduce fathead minnow (Pimephales promelas) survival or growth or water fleas (Ceriodaphnia dubia) survival or reproduction by 25% or more at any of the tested concentrations. Therefore, the fathead minnow IC25 for survival, growth, or reproduction was >100% (the highest concentration of this effluent that was tested). For this outfall, toxicity is demonstrated according to the NPDES permit if the IC25 is less than or equal to the permit limit (37% whole effluent for Outfall 200).
4.5.8 Biological Monitoring and Abatement Program
The NPDES permit issued for the Y-12 Complex mandates a Biological Monitoring and Abatement Program (BMAP) with the objective of demonstrating that the effluent limitations established for the facility protect the classified uses of the receiving stream, EFPC. The 2017 BMAP sampling efforts reported in this chapter follow the NPDES-required Y-12 Complex BMAP Plan (Peterson et al. 2013). The Y-12 Complex BMAP, which has been monitoring the ecological health of EFPC since 1985, currently consists of three major tasks that reflect complementary approaches to evaluating the effects of the Y-12 Complex discharges on the aquatic integrity of EFPC. These tasks include: (1) bioaccumulation monitoring, (2) benthic macroinvertebrate community monitoring, and (3) fish community monitoring. Data collected on contaminant bioaccumulation and the composition and abundance of communities of

Oak Ridge Reservation Annual Site Environmental Report—2017
Y-12 National Security Complex 4-68
aquatic organisms provide a direct evaluation of the effectiveness of abatement and remedial measures in improving ecological conditions in the stream.
Monitoring is currently being conducted at five primary EFPC sites, although sites may be excluded or added depending on the specific objectives of the various tasks. The primary sampling sites include upper EFPC at EFPC kilometers (EFKs) 24.4 and 23.4 (upstream and downstream of Lake Reality, respectively); EFK 18.7 and EFK 18.2, located off ORR and below an area of intensive commercial and light industrial development; EFK 13.8 and EFK 13.0, located upstream and downstream of the Oak Ridge Wastewater Treatment Facility; and EFK 6.3, located about 1.4 km downstream of the ORR boundary (Figure 4.19). Brushy Fork at Brushy Fork kilometer (BFK) 7.6 is used as a reference stream in two BMAP tasks. Additional sites off ORR are also occasionally used for reference, including Beaver Creek, Bull Run, Cox Creek, Hinds Creek, Paint Rock Creek, and Emory River in the Watts Bar Reservoir (Figure 4.20).
Figure 4.19. Locations of biological monitoring sites on East Fork Poplar Creek in relation to the Y-12 National Security Complex (EFK = East Fork Poplar Creek kilometer and ORWTP = Oak Ridge Water
Treatment Plant)
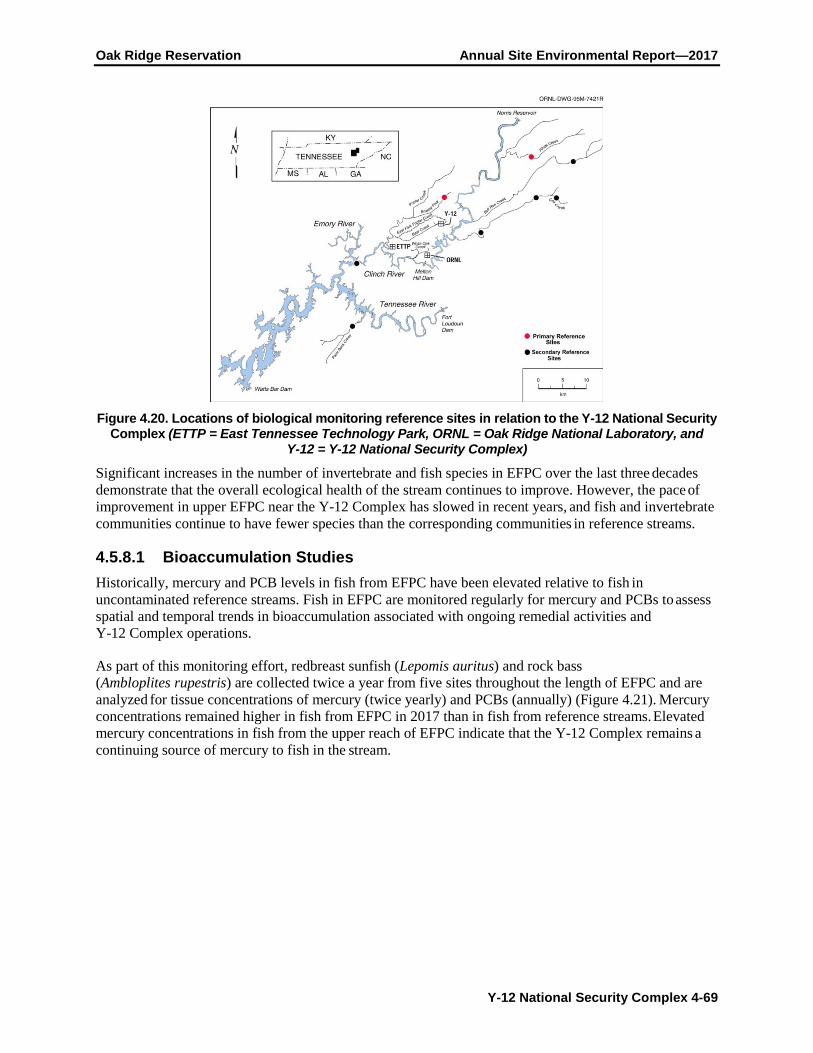
Oak Ridge Reservation Annual Site Environmental Report—2017
Y-12 National Security Complex 4-69
Figure 4.20. Locations of biological monitoring reference sites in relation to the Y-12 National Security Complex (ETTP = East Tennessee Technology Park, ORNL = Oak Ridge National Laboratory, and
Y-12 = Y-12 National Security Complex)
Significant increases in the number of invertebrate and fish species in EFPC over the last three decades demonstrate that the overall ecological health of the stream continues to improve. However, the pace of improvement in upper EFPC near the Y-12 Complex has slowed in recent years, and fish and invertebrate communities continue to have fewer species than the corresponding communities in reference streams.
4.5.8.1 Bioaccumulation Studies Historically, mercury and PCB levels in fish from EFPC have been elevated relative to fish in uncontaminated reference streams. Fish in EFPC are monitored regularly for mercury and PCBs to assess spatial and temporal trends in bioaccumulation associated with ongoing remedial activities and Y-12 Complex operations.
As part of this monitoring effort, redbreast sunfish (Lepomis auritus) and rock bass (Ambloplites rupestris) are collected twice a year from five sites throughout the length of EFPC and are analyzed for tissue concentrations of mercury (twice yearly) and PCBs (annually) (Figure 4.21). Mercury concentrations remained higher in fish from EFPC in 2017 than in fish from reference streams. Elevated mercury concentrations in fish from the upper reach of EFPC indicate that the Y-12 Complex remains a continuing source of mercury to fish in the stream.

Oak Ridge Reservation Annual Site Environmental Report—2017
Y-12 National Security Complex 4-70
Figure 4.21. Semiannual average mercury concentration in muscle fillets of redbreast sunfish and water from East Fork Poplar Creek (EFPC) at EFPC km 23.4 (water) and 24.4 (fish), Fiscal Year 2017 (Dashed grey line represents the ambient water quality criterion for methylmercury in fish fillets [0.3
mg/kg])
Figure 4.21 shows temporal trends for mercury concentrations in water collected from EFK 23.4 (Station 17) and in fish collected just upstream of this monitoring station at EFK 24.4. Waterborne mercury concentrations in the upper reach of EFPC have decreased substantially over the years in response to various remedial actions, first over the 1990s time period and then again in response to the Big Springs Treatment System in 2006. Although mercury concentrations in fish over time have not decreased commensurate with mercury levels in water in the lower sections of EFPC, mercury concentrations in fish at the uppermost sampling site (EFK 24.4) decreased steadily in the 1990s, consistent with decreased concentrations in water (Figure 4.21). Significant fluctuations in aqueous mercury concentrations (thought to be the result of storm drain relining and cleanout) have been seen at EFK 23.4 since 2009. Redbreast sunfish collected from the EFK 24.4 sampling site, about 1 km upstream of Station 17, appear to have responded to the recent peak and decline in aqueous mercury concentrations. Mean concentrations at EFK 24.4 increased from approximately 0.6 µg/g in 2011 to above 1 µg/g in 2012 and dropped back down in 2013 through 2017 (approximately 0.6 µg/g). These concentrations are above the EPA ambient water quality criterion for mercury (0.3 µg/g mercury as methylmercury in fish fillet). That this species appears to have responded to changes in water mercury concentrations in the upper reaches of the creek is interesting, given it has not responded to decreases in aqueous total mercury concentrations at downstream sites throughout EFPC in the past 20 years. The relationship between aqueous total mercury concentrations and fish tissue concentrations is complex. Aqueous mercury concentrations vary by orders of magnitude throughout the various watersheds across ORR, but fish tissue concentrations tend not to vary greatly (twofold to threefold). Multiple ongoing investigations are being conducted to better understand mercury bioaccumulation dynamics in EFPC and to better predict how remedial changes may impact mercury concentrations in fish in the future.
Year
1988 1990 1992 1994 1996 1998 2000 2002 2004 2006 2008 2010 2012 2014 2016 2018
Aver
age
Mer
cury
Con
cent
ratio
n(n
g/L
in w
ater
; g/
g w
et w
t. in
fish
)
0.0
0.5
1.0
1.5
2.0
2.5
water

Oak Ridge Reservation Annual Site Environmental Report—2017
Y-12 National Security Complex 4-71
The mean total PCB concentration in sunfish fillets at EFK 23.4 was 0.58 µg/g in FY 2017, which was comparable to the concentration in FY 2016 (0.60 µg/g) (Figure 4.22). Regulatory guidance and human health risk levels have varied widely for PCBs, depending on the regulatory program and the assumptions used in the risk analysis. The Tennessee water quality criteria for individual Aroclors and total PCBs are both 0.00064 µg/L under the recreation designated-use classification and are the targets for PCB-focused total maximum daily loads, including for local reservoirs (Melton Hill, Watts Bar, and Fort Loudoun; TDEC 2010a, 2010b, 2010c).
In the state of Tennessee, assessments of impairment for water body segments, as well as public fishing advisories, are based on fish tissue concentrations. Historically, the U.S. Food and Drug Administration threshold limit of 2 µg/g PCBs in fish fillets was used for advisories, and then for many years, an approximate range of 0.8 to 1 µg/g was used, depending on the data available and factors such as the fish species and size. The remediation goal for fish fillets at ETTP K-1007-P1 pond on ORR is 1 µg/g PCBs. Most recently, the water quality criterion has been used to calculate the fish tissue concentration triggering impairment and a total maximum daily load (TDEC 2007). This concentration is 0.02 µg/g PCBs in fish fillets (TDEC 2010a, 2010b, and 2010c). The mean fish PCB concentration in upper EFPC, 0.60 µg/g in fish fillets, is well above this concentration.
4.5.8.2 Benthic Invertebrate Surveys Monitoring of the benthic macroinvertebrate community continued in the spring of 2017 at three sites in EFPC and at two reference streams. The numbers of pollution-intolerant taxa (Ephemeroptera, Plecoptera, and Tricoptera, or EPT taxa) increased at EFK 23.4, remained the same at EFK 24.4, and decreased at EFK 13.8 (Figure 4.23a). The densities of these pollution-intolerant taxa increased at the two sites nearest the Y-12 Complex (EFK 23.4 and EFK 24.4), but decreased at the reference sites and at EFK 13.8 (Figure 4.23b). Of particular significance, the mean densities of the pollution-intolerant taxa at EFK 13.8 have continued to exceed the upper bound of the reference site confidence limits since 2012. However, at EFK 23.4 and EFK 24.4, mean densities for pollution-intolerant taxa remain at typical low levels, indicative of degraded conditions after exceeding densities at reference sites in 2015 for the first time since monitoring began in 1985. Considered together, these results suggest that the actual long-term effects on the invertebrate community of ending flow management in EFPC will only become evident as conditions stabilize and additional data become available.

Oak Ridge Reservation Annual Site Environmental Report—2017
Y-12 National Security Complex 4-72
Figure 4.22. Annual mean concentrations of polychlorinated biphenyls (PCBs) in rock bass muscle
fillets at East Fork Poplar Creek kilometer 23.4, Fiscal Year 2017
Year
1984 1988 1992 1996 2000 2004 2008 2012 2016
Mea
n PC
B C
once
ntra
tion
(g/
g)
0.0
0.5
1.0
1.5
2.0
2.5

Oak Ridge Reservation Annual Site Environmental Report—2017
Y-12 National Security Complex 4-73
Reference 95% CI
Year1987 1989 1991 1993 1995 1997 1999 2001 2003 2005 2007 2009 2011 2013 2015 2017
Num
ber o
f EPT
taxa
/sam
ple
0
5
10
15
20
25
EFK 24.4EFK 23.4EFK 13.8
Density of Pollution-Intolerant Taxa
Year1987 1989 1991 1993 1995 1997 1999 2001 2003 2005 2007 2009 2011 2013 2015 2017
EPT
dens
ity (n
o./0
.1 m
2 )
0
100
200
300
400
500
600
700
New HopePond
Replaced DechlorinationFlow Manage.
BeginsFlow Manage.
Ends
(a)
(b)
Figure 4.23. (a) Taxonomic richness (mean number of taxa per sample), and (b) density (mean
number of taxa per square meter) of the Ephemeroptera, Plecoptera, and Tricoptera (EPT) in the benthic macroinvertebrate communities sampled in the spring from East Fork Poplar Creek and two
nearby reference streams (Brushy Fork and Hinds Creek), 1986 through 2017 (EFK = East Fork Poplar Creek kilometer)
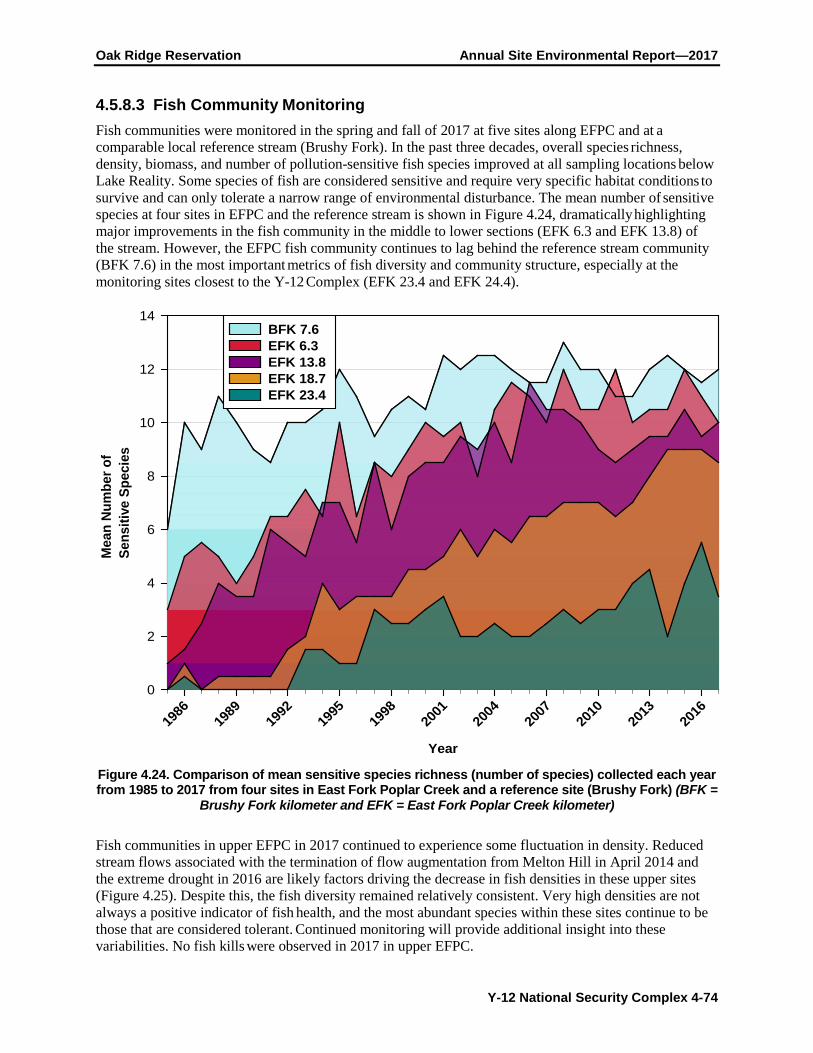
Oak Ridge Reservation Annual Site Environmental Report—2017
Y-12 National Security Complex 4-74
4.5.8.3 Fish Community Monitoring Fish communities were monitored in the spring and fall of 2017 at five sites along EFPC and at a comparable local reference stream (Brushy Fork). In the past three decades, overall species richness, density, biomass, and number of pollution-sensitive fish species improved at all sampling locations below Lake Reality. Some species of fish are considered sensitive and require very specific habitat conditions to survive and can only tolerate a narrow range of environmental disturbance. The mean number of sensitive species at four sites in EFPC and the reference stream is shown in Figure 4.24, dramatically highlighting major improvements in the fish community in the middle to lower sections (EFK 6.3 and EFK 13.8) of the stream. However, the EFPC fish community continues to lag behind the reference stream community (BFK 7.6) in the most important metrics of fish diversity and community structure, especially at the monitoring sites closest to the Y-12 Complex (EFK 23.4 and EFK 24.4).
Figure 4.24. Comparison of mean sensitive species richness (number of species) collected each year from 1985 to 2017 from four sites in East Fork Poplar Creek and a reference site (Brushy Fork) (BFK =
Brushy Fork kilometer and EFK = East Fork Poplar Creek kilometer)
Fish communities in upper EFPC in 2017 continued to experience some fluctuation in density. Reduced stream flows associated with the termination of flow augmentation from Melton Hill in April 2014 and the extreme drought in 2016 are likely factors driving the decrease in fish densities in these upper sites (Figure 4.25). Despite this, the fish diversity remained relatively consistent. Very high densities are not always a positive indicator of fish health, and the most abundant species within these sites continue to be those that are considered tolerant. Continued monitoring will provide additional insight into these variabilities. No fish kills were observed in 2017 in upper EFPC.
Year
1986
1989
1992
1995
1998
2001
2004
2007
2010
2013
2016
Mea
n Nu
mbe
r of
Sens
itive
Spe
cies
0
2
4
6
8
10
12
14BFK 7.6 EFK 6.3 EFK 13.8 EFK 18.7 EFK 23.4

Oak Ridge Reservation Annual Site Environmental Report—2017
Y-12 National Security Complex 4-75
Figure 4.25. Fish density (number of fish per square meter) for two sites in upper East Fork Poplar
Creek and a reference site (Brushy Fork) from 1996 to 2017. (BFK = Brushy Fork kilometer and EFK = East Fork Poplar Creek kilometer) (The interval of time between the dashed lines represents the
period of flow management in East Fork Poplar Creek.)
4.5.8.4 Upper Bear Creek Remediation As part of the construction of the UPF inside the Y-12 Complex, a haul road was constructed in 2013 and 2014, and several wetlands were lost or negatively affected. This resulted in the need for mitigation, including the creation and expansion of wetlands in the Bear Creek watershed. All wetland mitigation sites were constructed during the haul road expansion except one, which will be completed in the future. Wetland soils available after road construction, with their associated wetland plant seed banks, was used to support the establishment of hydric soils and wetland plant species in the mitigation areas. In all, 3.51 acres of wetlands will be constructed to compensate for the removal of 1 acre. The compensation ratios are intended to ensure that there is no net loss of wetland resource value.
As part of haul road construction, it was also necessary to culvert two sections of north tributary streams to Bear Creek. To mitigate the loss of natural streams, a previously impacted section of Bear Creek was identified for restoration to more natural conditions. Approximately 300 ft of upper Bear Creek was remediated in 2014 by diverting the stream out of a channelized section and back into its original channel. This remediated section was lined extensively with erosion matting along both banks, and various-size river rocks were added to the channel to create pool/riffle complexes throughout the site. The natural meander of the channel was kept, and only slight modifications were made. All disturbed soils were seeded, and native plants were added to the site to stabilize sediments and to re-establish the stream’s riparian zone following the construction.
Annual monitoring of the remediated wetland sites through 2017 revealed that, in general, the wetlands are responding as intended and have shown remarkable wetland plant coverage over the past couple of years. The wetland soil bank was undoubtedly key to the restoration effort. There are some wetlands with extensive open water areas, and there are some areas with somewhat less wet conditions. However, this is not unusual at this stage of wetland restoration projects. It will be important to carefully monitor hydrologic conditions and wetland plant growth with time and to understand responses to annual precipitation patterns. Keeping invasive plants in check is also important because invasive species can be aggressive shortly after soil disturbance.
Year
1997
1999
2001
2003
2005
2007
2009
2011
2013
2015
2017
Den
sity
(fis
h/m
2 )
0
2
4
6
8
10
12
14 BFK 7.6 EFK 23.4 EFK 24.4

Oak Ridge Reservation Annual Site Environmental Report—2017
Y-12 National Security Complex 4-76
The stream remediation site in upper Bear Creek continues to show signs of stability as well. After some issues with drainage in the new channel, the old channel was backfilled to prevent this issue, and now flows appear to be much more stable. The riparian plantings are establishing, and native flora is abundant in the area adjacent to the stream. The fish and aquatic invertebrate communities was slightly impacted by the drought in summer 2016 but appeared to be recovering in 2017 samples.
4.6 Groundwater at the Y-12 National Security Complex Groundwater monitoring at the Y-12 Complex is performed to comply with Federal, State, and local requirements and DOE Orders to determine the degree of environmental impact from legacy and current operations. More than 150 known or potential sources of environmental contamination have been identified at the Y-12 Complex, some from plant operations and some from former waste management practices (DOE 2017b). Monitoring provides information on the nature and extent of contamination of groundwater, which is then used to determine what actions must be taken to protect the worker, public, and environment. Figure 4.26 depicts the major facilities or areas of the Y-12 Complex and known and potential groundwater contaminant sources for which groundwater monitoring is performed.
4.6.1 Hydrogeologic Setting
The Y-12 Complex is divided into three hydrogeologic regimes (Bear Creek, upper EFPC, and Chestnut Ridge), which are delineated by surface water drainage patterns, topography, and groundwater flow characteristics (Figure 4.27). Most of the Bear Creek and upper EFPC regimes are underlain by the shales, siltstones, and sandstones with a subordinate and locally variable amount of carbonate bedrock, mentioned in Section 1.3.5, and are hydrostratigraphically referred to as aquitards. Aquitards are rock units that contain water but do not readily yield significant water to pumping wells. However, geologic units that are considered aquitards can often yield water in quantities sufficient for domestic or small farm use (Domenico and Schwartz 1990). The southern portion of the two regimes is underlain by the Maynardville Limestone, which is part of the Knox aquifer. The Chestnut Ridge regime is almost entirely underlain by the Knox aquifer. The southernmost portion near Bethel Valley Road consists of the lowest members of the Chickamauga Group. In general, groundwater flow in the water table interval follows the topography (Figure 4.28). Shallow groundwater flow in the Bear Creek and upper EFPC regimes is divergent from the topographic and groundwater divide located near the western end of the Y-12 Complex that defines the boundary between the two. In addition, flow converges on the primary surface streams (Bear Creek and upper EFPC) from Pine Ridge and Chestnut Ridge. In the Chestnut Ridge regime, a groundwater divide exists that nearly coincides with the crest of the ridge. Shallow groundwater flow tends to be toward either flank of the ridge, with discharge primarily to surface streams and springs located in Bethel Valley to the south and Bear Creek Valley to the north.
In Bear Creek Valley, groundwater in the intermediate and deep intervals moves predominantly through fractures in the aquitard, converging on and then moving through fractures and solution conduits in the Maynardville Limestone (Figure 4.27). Karst development in the Maynardville Limestone has a significant impact on groundwater flow paths in the water table and intermediate intervals. In general, groundwater flow parallels the valley and geologic strike. Groundwater flow rates in Bear Creek Valley vary widely; they are very slow within the deep interval of the fractured non-carbonate rock (less than 10 ft/year) but can be quite rapid within solution conduits in the Maynardville Limestone (10 to 5000 ft/day). The rate of groundwater flow perpendicular to geologic strike from the aquitard units of the lower Conasauga Group to the Maynardville Limestone is typically even slower below the water table interval.

Oak Ridge Reservation Annual Site Environmental Report—2017
Y-12 National Security Complex 4-77
Figure 4.26. Known or potential contaminant sources for which groundwater monitoring is performed at the Y-12 National Security Complex

Oak Ridge Reservation Annual Site Environmental Report—2017
Y-12 National Security Complex 4-78
Figure 4.27. Hydrogeologic regimes at the Y-12 National Security Complex and the position of the Maynardville Limestone in Bear Creek Valley

Oak Ridge Reservation Annual Site Environmental Report—2017
Y-12 National Security Complex 4-79
Figure 4.28. Groundwater elevation contours and flow directions at the Y-12 National Security Complex

Oak Ridge Reservation Annual Site Environmental Report—2017
Y-12 National Security Complex 4-80
Contaminant migration is primarily advective (contaminants are transported along with flowing groundwater through the pore spaces, fractures, or conduits of the hydrogeologic system). Strike-parallel transport of some contaminants can occur within the aquitard units for significant distances, where they discharge to surface water tributaries or underground utility and storm water distribution systems in industrial areas. Continuous elevated levels of nitrate (a groundwater contaminant from legacy waste disposals) within the fractured bedrock of the aquitards are known to extend east and west from the S-2 and S-3 sites for thousands of feet. VOCs (e.g., petroleum products, coolants, and solvents) at source units over or in the fractured clastic dominated bedrock can remain close to source areas because they tend to adsorb to the bedrock matrix, diffuse into pore spaces within the matrix, and degrade before migrating to exit pathways, where more rapid transport occurs for longer distances. However, extensive VOC contamination from multiple sources is observable throughout the groundwater system in both the Bear Creek and upper EFPC regimes, and to a lesser extent in the Chestnut Ridge regime.
Groundwater flow in the Chestnut Ridge regime is through fractures and solution conduits in the Knox Group. Discharge points for intermediate and deep flow are not well known. Groundwater is currently presumed to flow toward Bear Creek Valley to the north and Bethel Valley to the south (Figure 4.28). Groundwater from intermediate and deep zones may discharge at certain spring locations along the flanks of Chestnut Ridge. Following the crest of the ridge, water table elevations decrease from west to east, demonstrating an overall easterly trend in groundwater flow.
4.6.2 Well Installation and Plugging and Abandonment Activities
A number of monitoring devices have been used for groundwater data collection at the Y-12 Complex. Monitoring wells are permanent devices used for the collection of groundwater samples; they are installed according to established regulatory and industry standards. Figure 4.29 shows a cross-section of a typical groundwater monitoring well. Other devices or techniques (e.g., drive points and direct-push installations) are sometimes used to gather groundwater data.
In CY 2017, at the Environmental Management Waste Management Facility (EMWMF) (see Figure 4.26), a total of nine wells (three clusters of three wells each in the shallow, intermediate, and deep intervals) were installed upgradient of waste cells 1, 2, and 3 (along the EMWMF North Perimeter Road). These wells were installed to support a hydrologic investigation.
No wells were plugged and abandoned in CY 2017.
4.6.3 Calendar Year 2017 Groundwater Monitoring
Groundwater monitoring in CY 2017 was performed to comply with DOE Orders and regulations as part of the Y-12 Complex GWPP, DOE Environmental Management programs such as the Water Resources Restoration Program, and other projects. Compliance requirements were met by monitoring 193 wells and 52 surface water locations and springs (Table 4.20). Figure 4.30 shows the locations of Y-12 Complex perimeter/exit pathway groundwater monitoring stations.
Most of the conventional monitoring wells at the Y-12 Complex were sampled using industry standard methods approved by TDEC and EPA (Figure 4.31).
Comprehensive water quality results of groundwater monitoring activities at the Y-12 Complex in CY 2017 are presented in the Calendar Year 2017 Groundwater Monitoring Report (CNS 2018).

Oak Ridge Reservation Annual Site Environmental Report—2017
Y-12 National Security Complex 4-81
Figure 4.29. Cross-section of a typical groundwater monitoring well

Oak Ridge Reservation Annual Site Environmental Report—2017
Y-12 National Security Complex 4-82
Table 4.20. Summary of groundwater monitoring at the Y-12 National Security Complex, 2017
Purpose for which monitoring was performed Restorationa
Waste managementb
Surveillancec
Otherd Total
Number of active wells 63 33 97 27 220 Number of other monitoring stations (e.g., springs, seeps, and surface water)
30 6 16 0 52
Number of samples takene 185 115 119 266 685
Number of analyses performed 9,357 7,860 9,138 4,947 31,302 Percentage of analyses that are non- detects
67.2 90.4 82.9 13.0 69.0
Ranges of results for positive detections, VOCs (µg/L)f
Chloroethenes 0.22-5,500 3.94-7.17 1-39,000 NA
Chloroethanes 0.38-400 5.38-77.4 0.91-1,200 NA Chloromethanes 0.34-1,100 ND 1-870 NA Petroleum hydrocarbons 0.32-7,400 ND 1-2,200 NA Uranium (mg/L) 0.0005-0.49 0.0227-0.0227 0.0005-0.516 NA Nitrates (mg/L) 0.005-6,400 0.543-1.82 0.0554-36,100 0.19-25.13
Ranges of results for positive detections, radiological parameters (pCi/L)g
Gross-alpha activity 2.04-299 1.22-5.84 4.7-130 NA Gross-beta activity 3.53-10,200 2.88-16.6 8.8-940 NA
a Monitoring to comply with Comprehensive Environmental Response, Compensation, and Liability Act (CERCLA) requirements and with Resource Conservation and Recovery Act (RCRA) post-closure detection and corrective action monitoring.
b Solid waste landfill detection monitoring and CERCLA landfill detection monitoring. c U.S. Department of Energy (DOE) Order surveillance monitoring. d Research-related groundwater monitoring associated with activities of the DOE Oak Ridge Field Research Center and Ecosystems and Networks Integrated with Genes and Molecular Assemblies.
e The number of unfiltered samples, excluding duplicates, determined for unique location/date combinations. f These ranges reflect concentrations of individual contaminants (not summed VOC concentrations): Chloroethenes—includes tetrachloroethene; trichloroethene; 1,2-dichloroethene (cis- and trans-); 1,1-dichloroethene; and vinyl chloride. Chloroethanes—includes 1,1,1-trichloroethane; 1,2-dichloroethane; and 1,1-dichloroethane. Chloromethanes—includes carbon tetrachloride, chloroform, and methylene chloride. Petroleum hydrocarbon—includes benzene, toluene, ethylbenzene, and xylene.
g pCi = 3.7 × 10² Bq
Bq = becquerel NA = not analyzed ND = not detected pCi/L = picocurries per liter VOC = volatile organic compound

Oak Ridge Reservation Annual Site Environmental Report—2017
Y-12 National Security Complex 4-83
Figure 4.30. Location of Y-12 National Security Complex perimeter/exit pathway well, spring, and surface water monitoring stations (MCK = McCoy Branch kilometer)

Oak Ridge Reservation Annual Site Environmental Report—2017
Y-12 National Security Complex 4-84
Figure 4.31. Groundwater monitoring well sampling at the Y-12 National Security Complex [Source: Kathryn Fahey, Y-12 National Security Complex photographer]
Details of monitoring efforts performed specifically for CERCLA baseline and remediation evaluation are published in the FY 2017 and FY 2018 Water Resources Restoration Program Sampling and Analysis Plans (UCOR 2016b, 2017b, respectively) and the Annual CERCLA Remediation Effectiveness Report (DOE 2018).
Groundwater monitoring compliance reporting to meet RCRA post-closure permit requirements can be found in the Annual RCRA Groundwater Monitoring Report (UCOR 2018). The associated post-closure permits were terminated effective February 23, 2018, and future data will be reported in the annual CERCLA remediation effectiveness reports.
4.6.4 Y-12 National Security Complex Groundwater Quality
Historical monitoring efforts show that four primary contaminants impact groundwater quality at the Y-12 Complex: nitrate, VOCs, metals, and radionuclides. Of those, VOCs are the most widespread as a result of their common use and disposal at the site. Uranium and technetium-99 (99Tc) are the radionuclides of greatest concern. Trace metals (e.g., arsenic, barium, cadmium, chromium, and mercury), the least extensive groundwater contaminants, generally occur close to source areas because of their generally high adsorption characteristics. Historical data show that plumes from multiple-source units have mixed with one another and that contaminants are not always easily associated with a single source.

Oak Ridge Reservation Annual Site Environmental Report—2017
Y-12 National Security Complex 4-85
4.6.4.1 Upper East Fork Poplar Creek Hydrogeologic Regime Among the three hydrogeologic regimes underlying the Y-12 Complex, the upper EFPC regime encompasses most of the known and potential sources of surface water and groundwater contamination. A brief description of waste management sites is given in Table 4.21. Chemical constituents from the S-3 site (primarily nitrate and 99Tc) and VOCs from multiple source areas are observed in the groundwater in the western portion of the upper EFPC regime; groundwater in the eastern portion is predominantly contaminated with VOCs.
Table 4.21. Description of waste management units and underground storage tanks included in groundwater monitoring activities, upper East Fork Poplar Creek hydrogeologic regime, 2017
Site Description New Hope Pond Built in 1963 and closed in 1988. Regulated flow of water in upper East Fork Poplar Creek
before exiting the Y-12 Complex. Sediments include PCBs, mercury, and uranium. An oil skimmer basin was built as part of the pond when constructed. This basin collected oil and floating debris from upper East Fork Poplar Creek before discharging into the pond. A minor source of uranium in groundwater, the basin was closed under RCRA in 1990
Salvage Yard Scrap Metal Storage Area
Used from 1950 to 1999 for scrap metal storage. Some metals contaminated with low levels of uranium. In 2011, a CERCLA action to characterize and remove the scrap was completed. Soil characterization and analysis performed in 2010 and 2011 determined that this facility is not a significant risk to groundwater
Salvage Yard Oil/Solvent Drum Storage Area
Operated from 1976 to 1989. Primary wastes included waste oils, solvents, uranium, and beryllium. Closed under RCRA with all drums removed. Soil characterization and analysis performed in 2010 and 2011 determined that this facility is not a significant risk to groundwater
Salvage Yard Oil Storage Tanks
Used from 1978 to 1986. Two tanks used to store PCB-contaminated oil, both within a diked area. Tanks were removed after 1993. Soil characterization and analysis performed in 2010 and 2011 determined that this facility is not a significant risk to groundwater
Salvage Yard Drum Deheader
Used from 1959 to 1989. Sump tanks 2063-U, 2328-U, and 2329-U received residual drum contents. Tanks removed in 1989. Sump leakage was a likely release mechanism to groundwater. The facility was demolished and removed, and the soils beneath this facility were excavated and replaced with clean fill and gravel to remediate the site in 2011
Building 81-10 Area
Mercury recovery facility operated from 1957 to 1962. Historical releases to soil, groundwater, and surface water from leaks and spills of liquid wastes or mercury. The building structure was demolished in 1995
Rust Garage Area Former vehicle and equipment maintenance area, including four former petroleum USTs. All tanks were removed by 1990. Petroleum product releases to groundwater are documented
Building 9418-3 Uranium Oxide Vault
Originally contained an oil storage tank. Used from 1960 to 1964 to dispose of non-enriched uranium oxide. Leakage from the vault to groundwater is the likely release mechanism
Fire Training Facility
Used for hands-on firefighting training. Sources of contamination to soil include flammable liquids and chlorinated solvents. Infiltration is the primary release mechanism to groundwater
Beta-4 Security Pits
Used from 1968 to 1972 for disposal of classified materials, scrap metals, and liquid wastes. Site is closed and capped. Primary release mechanism to groundwater is infiltration
S-2 site Used from 1945 to 1951. An unlined reservoir received liquid wastes. Infiltration is the primary release mechanism to groundwater
Waste Coolant Processing Area
Used from 1977 to 1985. Former biodegradation facility used to treat waste coolants from various machining processes. Closed under RCRA in 1988
East End Garage Used from 1945 to 1989 as a vehicle fueling station. Five USTs used for petroleum fuel storage were excavated, 1989 to 1993. Petroleum releases to the groundwater are documented. The Bldg. 9754 Fuel Station transfer lines and dispenser tanks were removed in October 1993

Oak Ridge Reservation Annual Site Environmental Report—2017
Y-12 National Security Complex 4-86
Table 4.21. Description of waste management units and underground storage tanks included in groundwater monitoring activities, upper East Fork Poplar Creek hydrogeologic regime, 2017
(continued)
Site Description Coal Pile Trench Located beneath the former steam plant coal pile. Disposals included solid materials (primarily
alloys). Trench leachate is a potential release mechanism to groundwater. In 2011, the coal pile overlying the coal pile trench was removed and the area resurfaced with gravel
CERCLA = Comprehensive Environmental Response, Compensation, and Liability Act PCB = polychlorinated biphenyl RCRA = Resource Conservation and Recovery Act UST = underground storage tank Y-12 Complex = Y-12 National Security Complex
Plume Delineation Sources of groundwater contaminants monitored during CY 2017 include the S-2 site, the Fire Training Facility, the S-3 site, the Waste Coolant Processing Facility, former petroleum UST sites, New Hope Pond, the Beta-4 Security Pits, the Salvage Yard, and process/production buildings throughout the Y-12 Complex. Although the S-3 site, now closed under RCRA, is located west of the current hydrologic divide that separates the upper EFPC regime from the Bear Creek regime, it has contributed to groundwater contamination in the western part of the upper EFPC regime. Contaminant plumes in the upper EFPC regime are elongated in shape as a result of preferential transport of the contaminants parallel to strike (parallel to the valley axis) in both the Knox aquifer and the fractured bedrock of the aquitard units.
The plumes depicted in this section reflect the average concentrations and radioactivity in groundwater between CYs 2008 and 2012. The circular icons presented on the plume maps (Figures 4.32 through 4.35) represent CY 2017 monitoring results.
In CY 2013, the Y-12 Complex GWPP evaluated the extent of current groundwater contamination and updated the plume maps for a number of contaminants of concern, including the primary contaminants (B&W 2013). In CY 2015, the document was revised to graphically depict areas of increasing and decreasing trends based on statistical methods (CNS 2015). Plume maps in previous Annual Site Environmental Reports (ASERs) were developed from those presented in CERCLA RIs that took place in the late 1990s (DOE 1997, 1998). The RI plume maps were determined to be representative of groundwater contamination at the Y-12 Complex during the years subsequent to publication and were considered relevant for presentation in the ASERs. The updated maps are based on the more-extensive and more-recent sampling and analysis results, which include data not available for the RIs (e.g., existing or new wells being sampled subsequent to the RIs). These results were used to capture current groundwater conditions, and in some areas, reflect substantially different (higher or lower) contaminant concentrations than the data used during the RIs. These changes are due to improved data availability and/or changes within the hydrogeologic system (i.e., plume migration and/or degradation processes) either related to time and natural processes or as a result of actions taken to mitigate groundwater contamination (i.e., the east end VOC plume capture system, see VOCs discussion below).

Oak Ridge Reservation Annual Site Environmental Report—2017
Y-12 National Security Complex 4-87
Figure 4.32. Nitrate observed in groundwater at the Y-12 National Security Complex, 2017

Oak Ridge Reservation Annual Site Environmental Report—2017
Y-12 National Security Complex 4-88
Figure 4.33. Summed volatile organic compounds observed in groundwater at the Y-12 National Security Complex, 2017 (EEVOC = east end volatile organic compound.)

Oak Ridge Reservation Annual Site Environmental Report—2017
Y-12 National Security Complex 4-89
Figure 4.34. Gross-alpha activity observed in groundwater at the Y-12 National Security Complex, 2017

Oak Ridge Reservation Annual Site Environmental Report—2017
Y-12 National Security Complex 4-90
Figure 4.35. Gross-beta activity observed in groundwater at the Y-12 National Security Complex, 2017

Oak Ridge Reservation Annual Site Environmental Report—2017
Y-12 National Security Complex 4-91
Nitrate Unlike many groundwater contaminants, nitrate is highly soluble and moves easily with groundwater. Nitrate concentrations in groundwater at the Y-12 Complex exceed the 10-mg/L drinking water standard (a complete list of national drinking water standards is presented in Appendix C) in part of the western portion of the upper EFPC regime in the aquitard units and in the Maynardville Limestone unit of the Knox aquifer. The two primary sources of nitrate contamination are the S-2 and S-3 sites. The extent of the nitrate plume is essentially defined in the unconsolidated and shallow bedrock zones. In CY 2017, groundwater concentrations of nitrate as high as 36,100 mg/L (well GW-275) were observed in the shallow–intermediate bedrock intervals about 20 m (65 ft) below ground surface and about 396 m (1,300 ft) east of the S-3 site (Figure 4.32). This result was anomalously high (even an historic high) compared with previous years. The laboratory QC batch file was reviewed, and nothing was noted to point to an analytical problem or a calculation error. Therefore, the well was resampled the following quarter with a result of 9,700 mg/L. This result is consistent with results from previous years. The spike is unexplained and is considered an outlier.
Trace Metals Concentrations of barium, beryllium, cadmium, chromium, copper, lead, nickel, thallium, and uranium exceeded drinking water standards during CY 2017 in samples collected from various groundwater monitoring locations throughout the complex, specifically at and downgradient of the S-2 and S-3 sites. Trace metal concentrations above standards tend to occur only adjacent to source areas due to their low solubility in natural water systems and high adsorption to the clay-rich soils and bedrock underlying the Y-12 Complex.
Concentrations of uranium exceed the standard (0.03 mg/L) in a number of source areas (e.g., the S-3 site, the Uranium Oxide Vault, New Hope Pond, and the former oil skimmer basin) and contribute to the uranium concentration in the upper EFPC.
Volatile Organic Compounds Because of the many legacy source areas, VOCs are the most widespread groundwater contaminants in the upper EFPC regime. VOC contaminants in the regime primarily consist of chlorinated and petroleum hydrocarbons. In CY 2017, the highest summed concentration of dissolved chlorinated hydrocarbons (46,268 µg/L) was again found in groundwater at well 55-3B in the western portion of the Y-12 Complex, adjacent to currently inactive manufacturing facilities. The highest dissolved concentration of petroleum hydrocarbons (16,380 µg/L) was obtained from well GW-658 at the closed East End Garage.
These monitoring results are consistent with data from the previous years of monitoring. A continuous dissolved plume of VOCs in groundwater in the bedrock zone extends eastward from the S-3 site over the entire length of the regime (Figure 4.33). The primary sources are the Waste Coolant Processing Facility, fuel facilities (Rust Garage and East End Garage), and other waste-disposal and production areas throughout the Y-12 Complex. Chloroethene compounds (tetrachloroethene [PCE], trichloroethene [TCE], dichloroethene [DCE], and vinyl chloride) tend to dominate the volatile organic plume composition in the western and central portions of the Y-12 Complex. However, PCE is almost ubiquitous throughout the extent of the plume, indicating many source areas. Chloromethane compounds (carbon tetrachloride, chloroform, and methylene chloride) are the predominant VOCs in the eastern portion of the Y-12 Complex.
Variability in concentration trends of chlorinated and petroleum VOCs near source areas is seen within the upper EFPC regime. As seen in previous years, data from most of the monitoring wells have remained relatively constant (i.e., stable concentration trends) or have decreased since 1988. However, increasing trends have been observed in monitoring wells associated with the Rust Garage, Old Salvage Yard, and

Oak Ridge Reservation Annual Site Environmental Report—2017
Y-12 National Security Complex 4-92
S-3 site in the western part of the Y-12 Complex; some legacy sources at production/process facilities in central areas; and the east end VOC plume, indicating that some portions of the plume are still showing activity.
Within the exit pathway (the Maynardville Limestone underlying EFPC), the general trends are also stable or decreasing. However, one shallow well (GW-605) exhibits an increasing trend in chloroethenes, indicating active transport in that region of the groundwater plume. The well is west and upgradient of the pumping well (GW-845) operated to capture the east end VOC plume before it migrates off ORR into Union Valley. The pumping well may be influencing plume stability, causing mobilization in the region of well GW-605. Other than well GW-605, the decreasing and stable trends west of New Hope Pond are indicators that the contaminants from source areas are attenuating due to factors such as: (1) dilution by surrounding uncontaminated groundwater, (2) dispersion through a complex network of fractures and conduits, (3) degradation by chemical or biological means, and/or (4) adsorption by surrounding bedrock and soil media. Wells to the southwest and southeast of New Hope Pond are displaying the effects of pumping well GW-845.
Wells east of New Hope Pond and north of well GW-845 exhibit stable to increasing trends in VOC concentrations, indicating that little impact or attenuation from the plume capture system is apparent across lithologic units (perpendicular to strike). However, no subsequent downgradient detection of these compounds is apparent; therefore, either migration is limited, or some downgradient across-strike influence by the plume capture system is occurring.
Radionuclides The primary alpha-emitting radionuclides found in the upper EFPC regime during CY 2017 are isotopes of uranium. These radionuclides are not as widely occurring in groundwater as VOCs. Exceedances of the drinking water standard for gross alpha (15 pCi/L) have been observed in the western portion of the Y-12 Complex near the S-3 site, the Salvage Yard, and other source areas; in the central areas near production facilities and the Uranium Oxide Vault; and also in the east end near the former oil skimmer basin at the former inlet to the New Hope Pond, which was capped in 1988. In CY 2017, the maximum occurrence of gross-alpha activity in groundwater in the upper EFPC regime was 299 pCi/L at well GW-154 on the east end (Figure 4.34).
The primary beta-emitting radionuclides observed in the upper EFPC regime are 99Tc and isotopes of uranium. Elevated gross-beta activity in groundwater in the upper EFPC regime shows a pattern similar to that observed for historical gross-alpha activity on the west end of the Y-12 Complex.
Technetium-99 is the primary contaminant exceeding the screening level of 50 pCi/L; the source is the S-3 site (Figure 4.35). The highest gross-beta activity in groundwater was observed during CY 2017 from well GW-108 (10,200 pCi/L), east of the S-3 site.
Exit Pathway and Perimeter Monitoring Data collected to date indicate that VOCs are the primary class of contaminants migrating through the exit pathways in the upper EFPC regime. Historically, the compounds have been observed at depths of up to 500 ft below ground surface in the Maynardville Limestone, the primary exit pathway for groundwater on the east end of the Y-12 Complex. The deep fractures and solution channels that constitute flow paths within the Maynardville Limestone appear to be well connected, resulting in contaminant migration for substantial distances off ORR into Union Valley to the east of the Y-12 Complex.
In addition to the intermediate-to-deep pathways within the Maynardville Limestone, shallow groundwater within the water table interval near New Hope Pond, Lake Reality, and upper EFPC is also

Oak Ridge Reservation Annual Site Environmental Report—2017
Y-12 National Security Complex 4-93
monitored. Historically, VOCs have been observed near Lake Reality from monitoring wells, a dewatering sump, and the New Hope Pond distribution channel underdrain (GW-832). In that area, shallow groundwater flows north-northeast through the water table interval east of New Hope Pond and Lake Reality, following the path of the distribution channel for upper EFPC.
During CY 2017, the observed concentrations of VOCs at the New Hope Pond distribution channel underdrain remained low (28.6 µg/L). This may be because the continued operation of the groundwater plume capture system in well GW-845 southeast of New Hope Pond is effectively reducing the levels of VOCs in the area. The installation of the plume capture system (the East End VOC Treatment System [EEVOCTS]) was completed in June 2000. This system pumps groundwater from the intermediate bedrock 48 to 134 m (157 to 438 ft) below ground surface to mitigate off-site migration of VOCs. Groundwater is continuously pumped from the Maynardville Limestone at about 95 L/min (25 gal/min), passes through a treatment system to remove the VOCs, and then discharges to upper EFPC.
Monitoring wells near well GW-845 continue to show an encouraging response to the EEVOCTS operations. The Westbay™ multiport system installed in well GW-722 in 1991, about 153 m (500 ft) east and downgradient of well GW-845, permits sampling of vertically discrete zones within the Maynardville Limestone between 27 and 130 m (87 and 425 ft) below ground surface (Figure 4.33). This well has been instrumental in characterizing the vertical extent of the east-end plume of VOCs and is critical in the evaluation of the effectiveness of the plume capture system. Monitoring results from the sampled zones in well GW-722 indicate reductions in VOCs due to groundwater pumping upgradient at well GW-845, as shown in sample zone GW-722-17 (385 ft below ground surface) in Figure 4.36. Other wells also show decreases that may be attributable to the EEVOCTS operation. These indicators demonstrate that operation of the plume capture system is decreasing VOCs upgradient and downgradient of well GW-845, minimizing exposure to the public and the environment.
Figure 4.36. Decreasing summed volatile organic compounds observed in exit pathway well
GW-722-17 near New Hope Pond, 2017
Ten zones of monitoring well GW-722 were sampled in CY 2017, with 8 of the 10 zones showing summed VOCs greater than 5 µg/L. Only four zones exceeded individual drinking standards (from elevated detections of carbon tetrachloride, PCE, and TCE, the highest of which was 24 µg/L of carbon tetrachloride). Other (atypical) VOCs observed in these zones were acetone; acrylonitrile; chloroform; cis-1,2-DCE; ethylbenzene; styrene; and toluene.
0
200
400
600
800
1000
1200
1400
1997 1999 2001 2003 2005 2007 2009 2011 2013 2015 2017
Sum
med
VO
Cs
(mg/
L)
YEAR
Note: Continuous pumping from well GW-845 began in October 2000.

Oak Ridge Reservation Annual Site Environmental Report—2017
Y-12 National Security Complex 4-94
The atypical VOCs were present for four reasons: (1) acetone was detected in 8 of 10 zones sampled and is likely a sampling artifact and not from groundwater; (2) acrylonitrile and styrene were detected in 7 of the 10 zones (according to the manufacturer, older Westbay™ sampling systems contain components made with acrylonitrile and styrene, and detection of those compounds is often an artifact from sampling ports in low-permeability zones); (3) five zone samples yielded chloroform and cis-1,2-DCE results, common degradation product of carbon tetrachloride, PCE, and TCE; and (4) t races of petroleum hydrocarbons (ethylbenzene and toluene) were detected in 7 of the 10 zones (traces of petroleum hydrocarbons naturally present at depth in the low-permeability bedrock may explain the detection of those compounds). Natural hydrocarbons have been observed in groundwater samples from other deep wells installed in carbonate units (limestone and dolomite) on the ORR.
Upper EFPC flows north from the Y-12 Complex through a large gap in Pine Ridge. Shallow groundwater moves through that exit pathway, and very strong upward vertical flow gradients exist. Continued monitoring of the wells in this pathway gap since about 1990 has shown no indication of any contaminants moving via that exit pathway (Figure 4.30.) One shallow well was monitored in CY 2017, and no groundwater contaminants were observed above primary drinking water standards.
Sampling locations continue to be monitored north and northwest of the Y-12 Complex to evaluate possible contaminant transport from the ORR. Those locations are considered unlikely groundwater or surface water contaminant exit pathways. Monitoring continues to be performed to demonstrate no impact from Y-12 Complex activities. One of the stations monitored is a tributary that drains the north slope of Pine Ridge on the perimeter of the ORR and discharges into the adjacent Scarboro Community. One location monitors an upper reach of Mill Branch, which discharges into the residential areas along Wiltshire Drive. The remaining location monitors Gum Hollow Branch as it discharges from the perimeter of the ORR and flows adjacent to the Country Club Estates community. Samples were obtained and analyzed for metals, inorganic parameters, VOCs, and gross-alpha and gross-beta activities. No results exceeded a primary drinking water standard, and there were no indications that contaminants were being discharged from the ORR into those communities.
Union Valley Monitoring Groundwater monitoring data obtained during the early 1990s provided the first strong indication that VOCs were being transported off ORR through the deep Maynardville Limestone exit pathway. The upper EFPC RI (DOE 1998) discussed the nature and extent of the VOCs.
In CY 2017, monitoring of locations in Union Valley continued, showing overall decreasing or very low concentration stable trends (less than primary drinking water standards) in the individual concentrations of contaminants forming the groundwater contaminant plume in Union Valley.
Under the terms of an Interim ROD, administrative controls such as restrictions on potential future groundwater use have been established and maintained. Additionally, the previously discussed EEVOCTS (well GW-845) was installed, and operations were initiated to mitigate the migration of groundwater contaminated with VOCs into Union Valley (DOE 2018).
In July 2006, the Agency for Toxic Substances and Diseases Registry, the principal Federal public health agency charged with evaluating the human health effects of exposure to hazardous substances in the environment, published a report in which groundwater contamination across the ORR was evaluated (ATSDR 2006). In the report, it was acknowledged that extensive groundwater contamination exists throughout the ORR, but the authors concluded that there is no public health hazard from exposure to contaminated groundwater originating on the ORR. The Y-12 Complex east end VOC groundwater contaminant plume was acknowledged as the only confirmed off-site contaminant plume migrating across the ORR boundary. The report recognized that the institutional and administrative controls established in

Oak Ridge Reservation Annual Site Environmental Report—2017
Y-12 National Security Complex 4-95
the ROD do not provide for reduction in toxicity, mobility, or volume of contaminants of concern, but it concluded that the controls are protective of public health to the extent that they limit or prevent community exposure to contaminated groundwater in Union Valley.
4.6.4.2 Bear Creek Hydrogeologic Regime Located west of the Y-12 Complex in Bear Creek Valley, the Bear Creek regime is bounded to the north by Pine Ridge and to the south by Chestnut Ridge. The regime encompasses the portion of Bear Creek Valley extending from the west end of the Y-12 Complex to State Highway 95. Table 4.22 describes each of the waste management sites within the Bear Creek regime.
Table 4.22. Description of waste management units included in 2017 groundwater monitoring activities, Bear Creek hydrogeologic regime
Site Description S-3 site Four unlined surface impoundments constructed in 1951. Received liquid nitric
acid/uranium-bearing wastes via the nitric acid pipeline until 1983. Other disposals included 99Tc. Closed and capped under RCRA in 1988. Infiltration was the primary release mechanism to groundwater
Oil Landfarm Operated from 1973 to 1982. Received waste oils and coolants tainted with metals and PCBs. Closed and capped under RCRA in 1989. Infiltration was the primary release mechanism to groundwater
Boneyard Used from 1943 to 1970. Unlined shallow trenches used to dispose of construction debris and to burn magnesium chips and wood. Excavated and restored in 2002 and 2003 as part of Boneyard-Burnyard remedial activities
Burnyard Used from 1943 to 1968. Wastes, metal shavings, solvents, oils, and laboratory chemicals were burned in two unlined trenches. Excavated and restored in 2002 and 2003 as part of the Boneyard-Burnyard remedial activities
Hazardous Chemical Disposal Area
Used from 1975 to 1981. Built over the Burnyard. Handled compressed gas cylinders and reactive chemicals. Residues placed in a small, unlined pit. The northwest portion was excavated and restored in 2002 and 2003 as part of Boneyard-Burnyard remedial activities
Sanitary Landfill I Used from 1968 to 1982. Non-hazardous industrial landfill. May be a source of certain contaminants to groundwater. Closed and capped under TDEC requirements in 1985. Evaluation under CERCLA determined that no further action was need
Bear Creek Burial Grounds A and C and Walk-In Pits
Burial grounds A and C received waste oils, coolants, beryllium, uranium, various metallic wastes, and asbestos into unlined trenches and standpipes. The walk-in pits received chemical wastes, shock-sensitive reagents, and uranium saw fines. Activities ceased in 1981. Final closure was certified for A (1989), C (1993), and the walk-in pits (1995). Infiltration is the primary release mechanism to groundwater
Bear Creek Burial Grounds B, D, E, and J and Oil Retention Ponds 1 and 2
Burial grounds B, D, E, and J consisted of unlined trenches. These burial grounds received uranium chip, metal, and oxide wastes and uranium-contaminated debris. Ponds 1 and 2, built in 1971 and 1972, respectively, captured waste oils seeping into two Bear Creek tributaries. The ponds were closed and capped under RCRA in 1989. Certification of closure and capping of Burial Ground B and part of C was granted in February 1995
Rust Spoil Area Used from 1975 to 1983 for disposal of construction debris but may have included materials bearing solvents, asbestos, mercury, and uranium. Closed under RCRA in 1984. Site is a source of VOCs to shallow groundwater according to CERCLA remedial investigation and current surveillance monitoring

Oak Ridge Reservation Annual Site Environmental Report—2017
Y-12 National Security Complex 4-96
Table 4.22. Description of waste management units included in 2017 groundwater monitoring activities, Bear Creek hydrogeologic regime (continued)
Site Description Spoil Area I Used from 1980 to 1988 for disposal of construction debris and other stable,
non-radioactive wastes. Permitted under TDEC solid waste management regulations in 1986; closure began shortly thereafter. Soil contamination is of primary concern. CERCLA ROD issued in 1997
SY-200 Yard Used from 1950 to 1986 for equipment and materials storage. No documented waste disposal at the site occurred. Leaks, spills, and soil contamination are concerns. CERCLA ROD issued in 1996
Environmental Management Waste Management Facility
A CERCLA ROD defines the construction, operation, and closure of this on-site facility for disposal of radioactive, hazardous, and mixed wastes generated from CERCLA cleanup projects conducted on the ORR and associated sites. The facility began accepting wastes in 2002 with full capacity estimated to be reached in FY 2023
CERCLA = Comprehensive Environmental Response, Compensation, and Liability Act FY = Fiscal Year ORR = Oak Ridge Reservation PCB = polychlorinated biphenyl RCRA = Resource Conservation and Recovery Act ROD = Record of Decision 99TC = technetium-99 TDEC = Tennessee Department of Environment and Conservation VOC = volatile organic compound
Plume Delineation The primary groundwater contaminants in the Bear Creek regime are nitrate, trace metals, VOCs, and radionuclides. The S-3 site is a source of all four contaminants. The Bear Creek Burial Grounds and the Oil Landfarm waste management areas are significant sources of uranium, other trace metals, and VOCs. High concentrations of chlorinated hydrocarbons and PCBs have been observed as deep as 82 m (270 ft) below the Bear Creek Burial Grounds (MMES 1990).
Contaminant plume boundaries are essentially defined by the bedrock formations that directly underlie many waste disposal areas in the Bear Creek regime, particularly the Nolichucky Shale. This fractured aquitard unit is positioned north of and adjacent to the exit pathway unit, the Maynardville Limestone. The elongated shape of the contaminant plumes in the Bear Creek regime is the result of preferential transport of the contaminants parallel to strike (parallel to the valley axis) in the Maynardville Limestone and the aquitard units.
The plumes depicted in this section reflect the average concentrations and radioactivity in groundwater between CYs 2008 and 2012. The circular icons presented on the plume maps (Figures 4.32 through 4.35) represent CY 2017 monitoring results. (See Section 4.6.4.1 for more details.)
Nitrate The limits of the nitrate plume probably define the maximum extent of groundwater contamination in the Bear Creek regime. The horizontal extent of the nitrate plume is defined in groundwater in the upper to intermediate bedrock intervals of the aquitard units and Knox aquifer (less than 92 m [300 ft] below ground surface).
Data obtained during CY 2017 indicate that nitrate concentrations in groundwater continue to exceed the drinking water standard (10 mg/L) in an area that extends west from the source area at the S-3 site. The highest nitrate concentration (12,400 mg/L) was observed at well GW-615 adjacent to the S-3 site at a

Oak Ridge Reservation Annual Site Environmental Report—2017
Y-12 National Security Complex 4-97
depth of 75 m (247 ft) below ground surface (Figure 4.37). Samples drawn from multiport monitoring well GW-134 in CY 2011 showed elevated concentrations of nitrate (1,420 mg/L) as deep as 226 m (740 ft) below ground surface near the S-3 site source area. Concentrations exceeding the drinking water standard in CY 2017 were observed in groundwater as far as 2,438 m (8,000 ft) west of the S-3 site, discharging natural spring SS-4.
Figure 4.37. Volatile organic compounds observed in groundwater at wells GW-071 and GW-291 at the Bear Creek Burial Grounds and GW-229 at the Oil Landfarm, 2017
Trace Metals During CY 2017, barium, cadmium, nickel, and uranium were identified from groundwater monitoring as the trace metal contaminants in the Bear Creek regime that exceeded drinking water standards. Historically, elevated concentrations of many of the trace metals were observed at shallow depths near the S-3 site. In the Bear Creek regime, where natural geochemical conditions prevail, the trace metals may occur sporadically and in close association with source areas because conditions are typically not favorable for dissolution and migration. Disposal of acidic liquid wastes at the S-3 site reduced the pH of the groundwater, which allows the metals to remain in solution longer and migrate further from the source area.

Oak Ridge Reservation Annual Site Environmental Report—2017
Y-12 National Security Complex 4-98
The most prevalent trace metal contaminant observed within the Bear Creek regime is uranium. Early characterization indicated that the Boneyard-Burnyard site was the primary source of uranium contamination of surface water and groundwater. Historically, uranium has been observed at concentrations exceeding the drinking water standard of 0.03 mg/L in shallow monitoring wells, springs, and surface water locations downgradient from many of the waste areas. In 2003, the final remedial actions at the Boneyard-Burnyard were performed with the objective of removing materials contributing to surface water and groundwater contamination to meet existing ROD goals. About 65,752 m3
(86,000 yd3) of waste materials were excavated and placed in the EMWMF (DOE 2007). There were significant decreases in uranium concentration and flux in the surface water tributary immediately downstream of the Boneyard-Burnyard (NT-3), which indicate that remedial actions performed from 2002 to 2003 were successful in removing much of a primary source of uranium in Bear Creek Valley. There has been an overall decrease in uranium concentrations in Bear Creek since 1990 (Table 4.23); however, concentrations of uranium in the upper reaches of Bear Creek have been fairly stable, indicating that this contaminant still presents a significant impact in surface water and groundwater.
Table 4.23. Nitrate and uranium concentrations in Bear Creek
Bear Creek Average concentrationa (mg/L) Monitoring Station (distance from S-3 site)
Contaminant 1990– 1994
1995– 2000– 2005– 1999 2004 2009
2010– 2014
2015− 2017
BCKb-11.84 to 11.97 Nitrate 116 65.7 89.5 43.3 53.3 28.2 (approximately 0.5 miles downstream)
Uranium 0.203 0.112 0.129 0.112 0.172 0.214
BCK-09.20 to 09.47 Nitrate 16.1 7.8 12.1 8.4 4.4 4.7 (approximately 2 miles downstream)
Uranium 0.098 0.093 0.135 0.060 0.051 0.063
BCK-04.55 Nitrate 4.7 2.3 3.5 1.1 0.8 0.7 (approximately 5 miles downstream)
Uranium 0.034 0.030 0.033 0.020 0.016 0.018
aExcludes results that do not meet data quality objectives. bBCK = Bear Creek kilometer.
Additional monitoring is ongoing in an attempt to determine uranium inputs to the stream from source areas and the karst groundwater system underlying Bear Creek. Other trace metals historically observed in the groundwater of the Bear Creek regime are arsenic, beryllium, boron, chromium, copper, lead, mercury, selenium, strontium, thallium, and zinc. Concentrations have commonly exceeded background values in groundwater near contaminant source areas.
Volatile Organic Compounds VOCs are widespread in groundwater in the Bear Creek regime. The primary compounds are PCE; TCE; cis-1,2-DCE; vinyl chloride; and 1,1-dichoroethane. In most areas, they are dissolved in the groundwater and can occur in bedrock at depths up to 92 m (300 ft) below ground surface. Groundwater in the fractured bedrock of the aquitard units that contain detectable levels of VOCs occurs within about 305 m (1,000 ft) laterally of the source areas. The highest concentrations observed in CY 2017 in the Bear Creek regime occurred in the Nolichucky shale bedrock unit (an aquitard) at the Bear Creek Burial Ground waste management area, with a maximum summed VOC concentration of 8,484 µg/L in well GW-046 (Figure 4.33).
Near contaminant source areas, such as the Bear Creek Burial Grounds and the Oil Landfarm waste management areas, a variety of elevated concentration trends is observed. These trends are dependent

Oak Ridge Reservation Annual Site Environmental Report—2017
Y-12 National Security Complex 4-99
upon proximity to sources and hydrogeologic conditions. Decreasing and stable VOC trends dominate, as observed in wells GW-071 and GW-291, but there are observable increasing trends, such as vinyl chloride in well GW-229 (Figure 4.37). In well GW-229, the VOCs cis-1,2-DCE and vinyl chloride are likely degradation products of TCE (not shown on the figure).
Significant transport of VOCs has occurred in the Maynardville Limestone. Historical data obtained from monitoring well GW-729-44 shows that, in the intermediate-deep groundwater interval (98 m [320 ft] below ground surface), an apparently continuous dissolved plume extends at least 2,591 m (8,500 ft) westward from the S-3 site to just south of the Bear Creek Burial Ground waste management area. CY 2017 samples obtained from wells at exit pathway transect W (Figure 4.30) showed qualitatively detectable trace concentrations of VOCs (below drinking water standards), thus indicating migration (periodic or sporadic extensions) of contaminants through the Maynardville Limestones a distance of 4,785 m (15,700 ft) from the S-3 Ponds (DOE 2018).
Radionuclides As in the East Fork Regime, the primary radionuclides identified in the Bear Creek regime are isotopes of uranium and 99Tc. Neptunium, americium, radium, strontium, thorium, plutonium, and tritium are secondary and less-widespread radionuclides that historically have been observed in groundwater near the S-3 site.
Evaluations of the extents of radionuclides in groundwater in the Bear Creek regime during CY 2017 were based primarily on measurements of gross-alpha and gross-beta activity. If the annual average gross-alpha activity in groundwater samples from a well exceeded 15 pCi/L (the drinking water standard for gross-alpha activity), then one (or more) of the alpha-emitting radionuclides (e.g., uranium) is assumed to be present at elevated levels in the groundwater monitored by the well and, at certain monitoring locations, is evaluated isotopically. A similar rationale is used for annual average gross-beta activity that exceeds 50 pCi/L. Technetium-99, a more volatile radionuclide, is qualitatively screened by gross-beta activity analysis.
Groundwater in the Bear Creek regime with elevated levels of gross-alpha activity occurs near the S-3 site and the Oil Landfarm waste management area. In the bedrock interval, gross-alpha activity has historically exceeded 15 pCi/L in groundwater in the fractured bedrock of the aquitard units only near source areas (Figure 4.34).
Data obtained from exit pathway monitoring stations during CY 2017 show that gross-alpha activity in groundwater in the Maynardville Limestone and in the surface waters of Bear Creek exceeds the drinking water standard for over 3,353 m (11,000 ft) west of the S-3 site (SS-5, 31 pCi/L). The highest gross-alpha activity observed in the Bear Creek regime in groundwater was located adjacent to the S-3 site in CY 2017 (121 pCi/L in well GW-276, Figure 4.34).
In CY 2017, the highest gross-beta activity in groundwater in the Bear Creek regime was also observed at well GW-276 (150 pCi/L, Figure 4.35).
Exit Pathway and Perimeter Monitoring Exit pathway monitoring began in 1990 to provide data on the quality of groundwater and surface water exiting the Bear Creek regime. Bear Creek, which flows across the Maynardville Limestone (the primary exit pathway for groundwater) in much of the Bear Creek regime, is the principal exit pathway for surface water. Various studies have shown that the surface water in Bear Creek, the springs along the valley floor, and the groundwater in the Maynardville Limestone are hydraulically connected. Surveys have been performed that identify gaining (groundwater discharging into surface waters) and losing (surface water

Oak Ridge Reservation Annual Site Environmental Report—2017
Y-12 National Security Complex 4-100
discharging into a groundwater system) reaches of Bear Creek. The western exit pathway well transect (Picket W) serves as the perimeter well location for the Bear Creek regime (Figure 4.30).
Exit pathway monitoring consists of continued monitoring at four well transects (pickets) and selected springs and surface water stations. Groundwater quality data obtained during CY 2017 from the exit pathway monitoring wells indicate that groundwater is contaminated above drinking water standards in the Maynardville Limestone between Pickets A and C. Trends continue to be generally stable to decreasing (Figure 4.38).
Figure 4.38. Calendar Year 2017 concentrations of selected contaminants in exit pathway monitoring wells in the Bear Creek hydrogeologic regime
Surface water samples collected during CY 2017 indicate that water in Bear Creek contains many of the compounds found in the groundwater. Uranium concentrations exceeding the drinking water standard have been observed in surface water west of the Burial Grounds as far as Picket W. The concentrations in the creek generally decrease with distance downstream of the waste disposal sites (Table 4.23; see Section 4.6.4.2).

Oak Ridge Reservation Annual Site Environmental Report—2017
Y-12 National Security Complex 4-101
4.6.4.3 Chestnut Ridge Hydrogeologic Regime The Chestnut Ridge hydrogeologic regime is flanked to the north by Bear Creek Valley and to the south by Bethel Valley Road (Figure 4.27). The regime encompasses the portion of Chestnut Ridge extending from Scarboro Road, east of the complex, to Dunaway Branch, located just west of Industrial Landfill II.
The Chestnut Ridge Security Pits area is the primary source of groundwater contamination in the regime. Contamination from the security pits is distinct and does not mingle with plumes from other sources. Table 4.24 summarizes the operational history of waste management units in the regime.
Table 4.24. Description of waste management units included in groundwater monitoring activities, Chestnut Ridge hydrogeologic regime, 2017
Site Description Chestnut Ridge Sediment Disposal Basin
Operated from 1973 to 1989. Received soil and sediment from New Hope Pond and mercury-contaminated soils from the Y-12 Complex. Site was closed under RCRA in 1989. Not a documented source of groundwater contamination
Kerr Hollow Quarry Operated from 1940s to 1988. Used for the disposal of reactive materials, compressed gas cylinders, and various debris. RCRA closure (waste removal) was conducted between 1990 and 1993. Certification of closure with some wastes remaining in place was approved by TDEC in February 1995
Chestnut Ridge Security Pits
Operated from 1973 to 1988. Series of trenches for disposal of classified materials, liquid wastes, thorium, uranium, heavy metals, and various debris. Closed under RCRA in 1989. Infiltration is the primary release mechanism to groundwater
United Nuclear Corporation Site
Received about 29,000 drums of cement-fixed sludges and soils, demolition materials, and low-level radioactive contaminated soils. CERCLA ROD issued in 1991.
Industrial Landfill II Operated from 1983 to 1995. During operations, this was the central sanitary landfill for ORR. Detection monitoring under post-closure plan has been ongoing since 1996
Industrial Landfill IV Opened for operations in 1989. Permitted to receive only non-hazardous industrial solid wastes. Detection monitoring under TDEC solid waste management regulations has been ongoing since 1988. Assessment monitoring began in 2008 because of consistent exceedance of the TDEC groundwater protection standard for 1,1-dichloroethene
Industrial Landfill V Initiated operations in April 1994, replacing Industrial Landfill II. Currently under TDEC solid waste management detection monitoring
Construction/Demolition Landfill VI
Operated from December 1993 to November 2003. The post-closure period ended, and the permit was terminated in March 2007
Construction/Demolition Landfill VII
Facility construction completed in December 1994. TDEC granted approval to operate in January 1995. Permit-required detection monitoring per TDEC was temporarily suspended in October 1997 pending closure of construction/demolition Landfill VI. Reopened and began waste disposal operations in April 2001
Filled Coal Ash Pond Site received Y-12 Complex Steam Plant coal ash slurries from 1955 to 1968. A CERCLA ROD was issued in 1996. Remedial action complete. Monitoring under the ROD is ongoing
East Chestnut Ridge Waste Pile
Operated from 1987 to 1989 to store contaminated soil and spoil material generated from environmental restoration activities at the Y-12 Complex. Closed under RCRA in 2005 and incorporated into RCRA post-closure permit issued by TDEC in 2006
CERCLA = Comprehensive Environmental Response, Compensation, and Liability Act ORR = Oak Ridge Reservation RCRA = Resource Conservation and Recovery Act ROD = Record of Decision TDEC = Tennessee Department of Environment and Conservation Y-12 Complex = Y-12 National Security Complex

Oak Ridge Reservation Annual Site Environmental Report—2017
Y-12 National Security Complex 4-102
Plume Delineation Through extensive monitoring of the wells on Chestnut Ridge, the horizontal extent of the VOC plume at the Chestnut Ridge Security Pits (CRSP) seems to be reasonably well defined in the water table and shallow bedrock zones. With two possible exceptions, historical monitoring indicates that the VOC plume from the CRSP has not migrated very far in any direction (<305 m [<1,000 ft]).
Groundwater quality data obtained during CY 2017 indicate that the western lateral extent of the plume of VOCs at the site has not changed significantly from previous years. However, the continued observation of VOC contaminants over the past several years at a well about 458 m (1,500 ft) southeast and downgradient of the CRSP (well GW-798; Figure 4.33) shows that some migration of the eastern plume has occurred. Additionally, dye tracer test results and the intermittent detection of trace concentrations of VOCs (similar to those found in wells adjacent to the CRSP) at a natural spring about 2,745 m (9,000 ft) to the east and along geologic strike may suggest that CRSP groundwater contaminants have migrated much further than the monitoring well network indicates.
The plumes depicted in this section reflect the average concentrations and radioactivity in groundwater between CYs 2008 and 2012. The circular icons presented on the plume maps (Figures 4.32 through 4.35) represent CY 2017 monitoring results. (See Section 4.6.4.1 for more details.)
Nitrate Nitrate concentrations were below the drinking water standard at all monitoring stations in the Chestnut Ridge hydrogeologic regime.
Trace Metals Elevated concentrations of arsenic were observed in two surface water monitoring locations downstream from the Filled Coal Ash Pond, which is monitored under a CERCLA ROD (DOE 2018). Under the ROD, migration of contaminated effluent from the Filled Coal Ash Pond is being reduced by a constructed wetland area. During CY 2017, elevated arsenic levels were detected both upgradient (McCoy Branch kilometer [MCK] 2.05) and downgradient (MCK 2.0) of this wetland area (Figure 4.30). The passive wetland treatment area reduces total arsenic concentrations by about 59%, with associated reductions of dissolved arsenic of about 45% in the wet-season sample and about 73% for total arsenic and 64% for dissolved arsenic during the dry-season sample (DOE 2018). A surface water monitoring location (MCK 1.4) about 1,021 m (3,900 ft) downstream from the Filled Coal Ash Pond was also sampled during CY 2017; arsenic was detected below drinking water standards.
Volatile Organic Compounds Monitoring VOCs in groundwater attributable to the CRSP has been in progress since 1987. A review of historical data indicates that concentrations of VOCs in groundwater at the site have generally decreased since 1988. However, stable to very shallow increasing trends in VOCs in groundwater samples from monitoring well GW-798 (Figure 4.33) have been developing since CY 2000. The maximum summed VOC concentration observed at well GW-798 during CY 2017 was 10.36 µg/L. The VOCs detected in well GW-798 continue to be characteristic of the CRSP plume. However, in CY 2017, the highest summed VOC in the Chestnut Ridge regime was in another well at the CRSP, GW-322 with 159 µg/L (Figure 4.33).
At Industrial Landfill IV, a number of VOCs have been observed since 1992. Monitoring well GW-305, located immediately to the southeast of the facility, has historically displayed concentrations of compounds below applicable drinking water standards, but the concentrations have exhibited shallow increasing trends; and in CY 2017 this well had a summed VOC concentration of (90.49 µg/L). In

Oak Ridge Reservation Annual Site Environmental Report—2017
Y-12 National Security Complex 4-103
CY 2015, samples from this well continued to exceed the drinking water standard for 1,1-DCE (7 µg/L). That finding led to quarterly monitoring to further evaluate the trend. The CY 2015 samples had concentrations of 5.8 to 9.8 µg/L, but in CY 2016, only one quarterly sample exceed the drinking water standard for 1,1-DCE at a concentration of 7.43 µg/L. And again in CY 2017, only one quarterly sample exceeded the drinking water standard for 1,1-DCE at a concentration of 7.17 µg/L.
In CY 2014, a VOC, carbon tetrachloride, was consistently detected at low concentrations in groundwater samples from well GW-144 at Kerr Hollow Quarry (Figure 4.33). This well is sampled as part of a RCRA post-closure permit with TDEC managed by UCOR, a DOE environmental manager contractor. Three consecutive samples (all below 4 µg/L) confirmed the presence of carbon tetrachloride. Additional sampling at this well and at a downgradient surface water location was implemented in CY 2015 to more-closely monitor this VOC. The CY 2015 samples yielded only one detection of carbon tetrachloride at well GW-144 (1.1 µg/L). In CYs 2016 and 2017, carbon tetrachloride was not detected at either location.
Radionuclides In CY 2017, no gross-alpha or gross-beta activity above the drinking water standard of 15 and 50 pCi/L, respectively, was observed in any groundwater samples collected in the Chestnut Ridge hydrogeologic regime.
Exit Pathway and Perimeter Monitoring Contaminant and groundwater flow paths in the karst bedrock underlying the Chestnut Ridge regime have not been well characterized by conventional monitoring techniques. A number of tracer studies have been conducted that show groundwater from Chestnut Ridge discharging into Scarboro Creek and other tributaries that feed into Melton Hill Lake. However, no springs or surface streams that represent discharge points for groundwater have been conclusively correlated to a waste management unit or operation at the Y-12 Complex that is a known or potential groundwater contaminant source. Water quality from springs along Scarboro Creek are monitored, and trace concentrations of VOCs are intermittently detected. The detected VOCs are suspected to originate from the CRSP; however, this has not been confirmed.
Monitoring natural groundwater exit pathways is a basic monitoring strategy in a karst regime such as that of Chestnut Ridge. Perimeter springs and surface water tributaries were monitored to determine whether contaminants are exiting the downgradient (southern) side of the regime. Six springs and four surface water monitoring locations were sampled during CY 2017. No contaminants at any of these monitoring stations were detected at levels above primary drinking water standards.
4.7 Quality Assurance Program The Y-12 Complex QA Program establishes a quality policy and requirements for the overall QA Program for the Y-12 Complex site. Management requirement E-SD-0002, Quality Assurance Program Description, details the methods used to carry out work processes safely and securely and in accordance with established procedures (CNS. 2017c). It also describes mechanisms in place to seek continuous improvements by identifying and correcting findings and preventing recurrences.
Many factors can potentially affect the results of environmental data collection activities, including sampling personnel, methods, and procedures; field conditions; sample handling, preservation, and transport; personnel training; analytical methods; data reporting; and record keeping. QA programs are designed to minimize these sources of variability and to control all phases of the monitoring process.

Oak Ridge Reservation Annual Site Environmental Report—2017
Y-12 National Security Complex 4-104
Field sampling QA encompasses many practices that minimize error and evaluate sampling performance. Some key quality practices include the following:
• use of work control processes and standard operating procedures for sample collection and analysis; • use of chain-of-custody and sample identification procedures; • instrument standardization, calibration, and verification; • sample technician and laboratory analyst training; • sample preservation, handling, and decontamination; and • use of QC samples, such as field and trip blanks, duplicates, and equipment rinses.
The Y-12 Complex Environmental Sampling Services performs field sampling, sample preservation and handling, and chain-of-custody and takes field control (QC) samples in accordance with the Y-12 Complex Environmental Compliance’s internal procedures. Environmental Sampling Services developed a standards and calibration program that conforms to ISO/International Electrotechnical Commission (IEC) 17025, General Requirements for Competence of Testing and Calibration Laboratories (ISO 2005), and provides a process for uniform standardization, calibration, and verification of measurement and test equipment (M&TE). The standards and calibration program ensures measurements are made using appropriate, documented methods; traceable standards; appropriate M&TE of known accuracy; trained personnel; and technical best practices.
Analytical results may be affected by a large number of factors inherent to the measurement process. Laboratories that support the Y-12 Complex environmental monitoring programs use internal QA/QC programs to ensure the early detection of problems that may arise from contamination, inadequate calibrations, calculation errors, or improper procedure performance. Internal laboratory QA/QC programs include routine calibrations of counting instruments, yield determinations, frequent use of check sources and background counts, replicate and spiked sample analyses, matrix and reagent blanks, and maintenance of control charts to indicate analytical deficiencies. These activities are supported by the use of standard materials or reference materials (e.g., materials of known composition that are used in the calibration of instruments, methods standardization, spike additions for recovery tests, and other practices). Certified standards traceable to NIST, DOE sources, or EPA are used (when available) for such work.
The Y-12 Complex ACO QA Manual describes QA program elements that are based on the Y-12 Complex QA Program; customer-specific requirements; certification program requirements; ISO/IEC 17025, General Requirements for Competence of Testing and Calibration Laboratories; Federal, State, and local regulations; and waste acceptance criteria. As a government-owned, contractor-operated laboratory that performs work for DOE, the ACO laboratory operates in accordance with DOE O 414.1D, Quality Assurance (DOE 2011c).
Other internal practices used to ensure that laboratory results are representative of actual conditions include training and managing staff; maintaining adequacy of the laboratory environment; safety; controlling the storage, integrity, and identity of samples; record keeping; maintaining and calibrating instruments; and using technically validated and properly documented methods.
The Y-12 Complex ACO participated in both Mixed Analyte Performance Evaluation Program studies conducted in 2016 for water, soil, and air filter matrices for metals, organics, and radionuclides. The overall acceptability rating from both studies was greater than 96%.
Verification and validation of environmental data are performed as components of the data collection process, which includes planning, sampling, analysis, and data review. Some level of verification and

Oak Ridge Reservation Annual Site Environmental Report—2017
Y-12 National Security Complex 4-105
validation of field and analytical data collected for environmental monitoring and restoration programs is necessary to ensure that data conform to applicable regulatory and contractual requirements. Validation of field and analytical data is a technical review performed to compare data with established quality criteria to ensure that data are adequate for the intended use. The extent of project data verification and validation activities is based on project-specific requirements.
For routine environmental effluent monitoring and surveillance monitoring, data verification activities may include processes of checking whether (1) data have been accurately transcribed and recorded, (2) appropriate procedures have been followed, (3) electronic and hard-copy data show one-to-one correspondence, and (4) data are consistent with expected trends. Typically, routine data verification actions alone are sufficient to document the validity and accuracy of environmental reports. For restoration projects, routine verification activities are more contractually oriented and include checks for data completeness, consistency, and compliance with a predetermined standard or contract.
Certain projects may require a more thorough technical validation of the data as mandated by the project’s data quality objectives. Sampling and analyses conducted as part of an RI to support the CERCLA process may generate data that are needed to evaluate risk to human health and the environment, to document that no further remediation is necessary, or to support a multimillion-dollar construction activity and treatment alternative. In these cases, the data quality objectives of the project may mandate a thorough technical evaluation of the data against rigorous predetermined criteria. The validation process may result in the identification of data that do not meet predetermined QC criteria or in the ultimate rejection of data for their intended use. Typical criteria evaluated in the validation of contract laboratory program data include the percentage of surrogate recoveries, spike recoveries, method blanks, instrument tuning, instrument calibration, continuing calibration verifications, internal standard response, comparison of duplicate samples, and sample holding times.
4.8 Environmental Management and Waste Management Activities
4.8.1 Mercury Technology Development Activities for the Y-12 National Security Complex, East Fork Poplar Creek
Mercury remediation in the Oak Ridge, Tennessee, area is a high priority for DOE. Releases of mercury during Y-12 Complex operations during the 1950s and early 1960s resulted in contamination of surrounding soil, groundwater, and biota. Subsequent transport from the facility resulted in off-site contamination of the lower EFPC. Starting in late 2014, mercury research and technology development activities have been conducted in an effort to develop potential remedial alternatives for lower EFPC.
Research and technology development activities to date have focused on understanding mercury transport and fate in the EFPC system. Monitoring sites from upstream to downstream EFPC were established to measure flow, water chemistry, groundwater, and biota. Field studies have pointed to the importance of bank soil erosion as a source of mercury to the creek, especially in the upstream section. Instream factors such as water chemistry and flow characteristics also influence mercury concentration, including the production of methylmercury. Research studies have also highlighted the importance of methylmercury and its bioaccumulation in the food chain. The early efforts to understand the watershed have added significantly to our understanding of key mercury sources areas and mercury transformations and processes. The watershed-scale mercury information is informing conceptual and dynamic models that can be used for future technology development and remedial decision-making in lower EFPC.
In FY 2017, technology development activities centered on developing strategies and technologies that may influence the major factors controlling mercury bioaccumulation in fish—the amount of mercury to the system, the conversion of inorganic mercury to methylmercury, and the uptake of mercury in the food

Oak Ridge Reservation Annual Site Environmental Report—2017
Y-12 National Security Complex 4-106
chain. Field and laboratory studies have focused on developing sorbents that might be effective in sequestering mercury, using alternative dechlorination chemicals at the Y-12 Complex that might help reduce mercury flux, and adding filtering organisms such as mussels that might help change instream chemistry to limit mercury transport on particles or algae.
The multi-year research and technology development effort in Lower EFPC is providing detailed and valuable information that will inform remedial alternatives evaluation currently scheduled for the mid-2020s.
4.8.2 Excess Facilities
In 2017, the Oak Ridge Office of Environmental Management’s (OREM’s) Excess Contaminated Facilities initiative continued to remove risks by stabilizing excess facilities, performing characterization, removing mercury from deteriorating equipment, and developing required plans for future cleanup and demolition activities.
OREM efforts on the column exchange system located outside the Alpha-4 building at the Y-12 Complex resulted in recovery of a significant quantity of mercury at risk of release from the deteriorating equipment, supporting equipment removal in 2018.
Characterization of nine facilities, comprising the Y-12 Biology Complex, was completed in accordance with the regulator-approved Waste Handling Plan to support future demolition waste disposal. The characterization effort, which included collection of more than 300 samples from various structural components and equipment, required special attention to personnel protection due to deteriorated conditions in and around the facilities. Critical decision documentation was prepared to support planning for future demolition. Preparations began for demolition in 2018 of two of the nine facilities (9743-2 and 9770-2), as well as more extensive planning for deactivation of the 9207 and ancillary facilities.
4.8.3 Mercury Treatment Facility
OREM continued progress on the Outfall 200 Mercury Treatment Facility to reduce mercury concentrations in water exiting the Y-12 Complex and to support future large-scale demolition of mercury-contaminated facilities. Outfall 200 is the point where the west end Y-12 Complex storm drain system discharges to upper EFPC and is a documented source of mercury discharge to the creek.
Water will be collected at the Outfall 200 discharge point (headworks site) and transferred by pipeline to the treatment plant located at the eastern end of the Y-12 Complex. The water will be treated to reduce mercury using chemical precipitation, clarification, and media filtration and discharged back into upper EFPC (UCOR.2016a).
In 2017, OREM completed design of the facility, with the capability to treat 3,000 gpm and including a 2M-gal storage tank to collect storm water during peak flow conditions. Responsibility for the headworks and treatment plant site footprints was transferred from NNSA to OREM. Early site preparation was initiated at the headworks and treatment plant sites. Procurement of a construction contract for the balance of construction was initiated to support award of the contract in 2018.
Oak Ridge Reservation Annual Site Environmental Report—2017
Y-12 National Security Complex 4-107
4.8.4 Waste Management
4.8.4.1 Comprehensive Environmental Response, Compensation, and Liability Act Waste Disposal
During FY 2017, the EMWMF received 5,309 waste shipments, accounting for 34,757 tons, primarily from soil remediation activities and several smaller cleanup projects at ETTP and the Y-12 Complex. The EMWMF, an engineered landfill, consists of six disposal cells that only accept low-level radioactive and hazardous CERCLA waste that meets specific waste acceptance criteria. Waste types that qualify for disposal include soil, dried sludge and sediment, solidified waste, stabilized waste, building debris, scrap equipment, personal protective equipment, and classified waste.
In FY 2017, EMWMF operations collected, analyzed, and dispositioned approximately 4.5M gal of leachate at the Oak Ridge National Laboratory (ORNL) Liquid and Gaseous Waste Operations facility. No contact water (water that comes in contact with waste but does not enter the leachate collection system) required treatment at ORNL. However, 9.3M gal of contact water were collected, analyzed, and released to the storm water retention basin after laboratory analyses verified the water met all discharge standards.
4.8.4.2 Solid Waste Disposal DOE operates and maintains solid waste disposal facilities called the ORR Landfills, three of which are active. In FY 2017, approximately 54,771 yd3 of waste were disposed in the landfills, which marks a 62% increase from FY 2016 volumes. Clean spoils receipts in FY 2017 were approximately 424 yd3. Clean spoils have the potential for being reused and are segregated to avoid taking up valuable landfill space. Several projects are planning large spoils campaigns for FY 2018 construction of phase two of three phases of the classified landfill.
Operation of the ORR Landfills generated approximately 2.5M gal of leachate that was collected, monitored, and discharged into the Y-12 Complex sanitary sewer system.
4.8.4.3 Wastewater Treatment NNSA at the Y-12 Complex treats wastewater generated from both production activities and environmental cleanup activities. Safe and compliant treatment of more than 119M gal of wastewater was provided at various facilities during the year:
• The West End Treatment Facility and the Central Pollution Control Facility at the Y-12 Complex processed more than 1.1M gal of wastewater, primarily in support of NNSA operational activities.
• The Big Springs Water Treatment System treated more than 102M gal of mercury-contaminated groundwater. The EEVOCTS treated 11.8M gal of VOC-contaminated groundwater.
• The Liquid Storage Facility and Groundwater Treatment Facility treated more than 2.5M gal of leachate from burial grounds and well purge waters from remediation areas.
• The Central Mercury Treatment System treated approximately 1.8M gal of mercury-contaminated sump waters from the Alpha-4 building.