4. STATISTICAL METHODS
9
4. STATISTICAL METHODS 1. a ii) - Relatively more difficult to draw/time consuming. - Long bar not easy to compare. - Number of components to be represented is limited - Fluctuation in production over a period of time are not easy to see at a glance 2. (a) ii) - A better impression of totality and individual contribution. - Differences in quantities are easier to see. - Easy to read the bars as they start from a common baseline. - The value of each bar is easily determined. b) - Kenya is not self sufficient in the commodities due to the high population. - Frequent drought which lead to crop failure cause food shortage thus importation to supplement local produce - Increased cost of farm inputs leading to low production hence the need to import. - Occasional illegal imports/smuggling /hoarding of the commodities creates artificial shortage hence the need to import these commodities. - Pests and diseases reduce the amount of grain harvested thus the need for importation. - The requirements to maintain the trading quotas among the countries African trading blocks that Kenya imports some of the commodities in exchange of her own imports 3. a i) DISTRICT / YEAR 1982 CT 1992 CT 2002 CT TRANS NZOIA KIAMBU MERU BUNGOMA 24 23 25 12 24 47 72 84 26 25 27 14 26 51 78 92 40 31 32 20 40 71 103 123 Milk production in 000 units in selected Districts in Kenya 4. a i) - The year 2009 recorded the highest network coverage in the country - The year 2007 held the lowest network coverage and uncovered areas respectively since 2009 - Safaricom network has been the leading in terms of network coverage since 2007 to 2009 - YU network has been the least in terms of network coverage ii) - Suitable for absolute totals in different periods - Gives a good visual impression of the totality - Easy to interpret 5. a ii) – It’s easy to compare the various components within a circle. - They are simple to construct after angles have been calculated. - Give clear visual impression of individual components. - It’s easy to determine the value of each component since the size, the sector is proportional to the value it represent. b) = 130,000 – 70,000 = 60,000 √1 mk % increase = 60,000 x 100 = 600 70,000 = 85 5 / 7 % √1 mk 6. a) Gold = 26 / 100 x 360 = 93.6 = 94 0 1 Fluorspar = 14 / 100 x 360 = 50.4 = 50 0 1 Soda Ash= 32 / 100 x 360 =115.2 =115 0 1 Zinc= 28 / 100 x 360 = 100.8 = 101 0 1 b) - Good in showing variant types of data - Easy to draw - Easy to interpret - Easy to make comparisons
Transcript of 4. STATISTICAL METHODS

4. STATISTICAL METHODS 1. a ii) - Relatively more difficult to draw/time consuming.
- Long bar not easy to compare. - Number of components to be represented is limited - Fluctuation in production over a period of time are not easy to see at a glance
2. (a) ii) - A better impression of totality and individual contribution. - Differences in quantities are easier to see. - Easy to read the bars as they start from a common baseline. - The value of each bar is easily determined.
b) - Kenya is not self sufficient in the commodities due to the high population. - Frequent drought which lead to crop failure cause food shortage thus importation to
supplement local produce - Increased cost of farm inputs leading to low production hence the need to import. - Occasional illegal imports/smuggling /hoarding of the commodities creates artificial
shortage hence the need to import these commodities. - Pests and diseases reduce the amount of grain harvested thus the need for importation. - The requirements to maintain the trading quotas among the countries African trading
blocks that Kenya imports some of the commodities in exchange of her own imports 3. a i)
DISTRICT / YEAR 1982 CT 1992 CT 2002 CT
TRANS NZOIA KIAMBU MERU BUNGOMA
24 23 25 12
24 47 72 84
26 25 27 14
26 51 78 92
40 31 32 20
40 71 103 123
Milk production in 000 units in selected Districts in Kenya 4. a i) - The year 2009 recorded the highest network coverage in the country - The year 2007 held the lowest network coverage and uncovered areas respectively
since 2009 - Safaricom network has been the leading in terms of network coverage since 2007 to 2009 - YU network has been the least in terms of network coverage
ii) - Suitable for absolute totals in different periods - Gives a good visual impression of the totality - Easy to interpret
5. a ii) – It’s easy to compare the various components within a circle. - They are simple to construct after angles have been calculated. - Give clear visual impression of individual components.
- It’s easy to determine the value of each component since the size, the sector is proportional to the value it represent. b) = 130,000 – 70,000 = 60,000 √1 mk
% increase = 60,000 x 100 = 600 70,000
= 85 5/7 % √1 mk
6. a) Gold = 26/100 x 360 = 93.6 = 940 1
Fluorspar = 14/100 x 360 = 50.4 = 500 1
Soda Ash= 32/100 x 360 =115.2 =1150 1
Zinc= 28/100 x 360 = 100.8 = 1010 1
b) - Good in showing variant types of data
- Easy to draw
- Easy to interpret
- Easy to make comparisons

5. MAPS AND MAP WORK 1. a i) - Kisumu east 116/2
- Muhoroni 117/1 - Lumbwa 117/2 - Nyakach 116/4 - Kericho 117/4 - Kisii 130/2 - Chemagel 131/1 - Chapatarakwa 131/2
b i) - Presence of tea plantation-tea grows under heavy amount of rainfall - Presence of forest cover - presence of permanent river
b ii) - R. Kibol - Scrub vegetation - Tea plantation
c i)
d i) - the major river is R.yurith - river are permanent - the river are few
ii) - Farming - Forestry - Mining
3. a) (i)- 0º201S35º191E ii) - Power transmission line
b i) - Trigonometrical station - Contours - Hunhures e.g. along road in grid square 6867
ii) - 3.9Km ± 0.1 (3.8km – 4.0km) iii) - 180 + 35 = 215º ±1º = (214º – 216º)
-all weather road loose surface
-district boundary
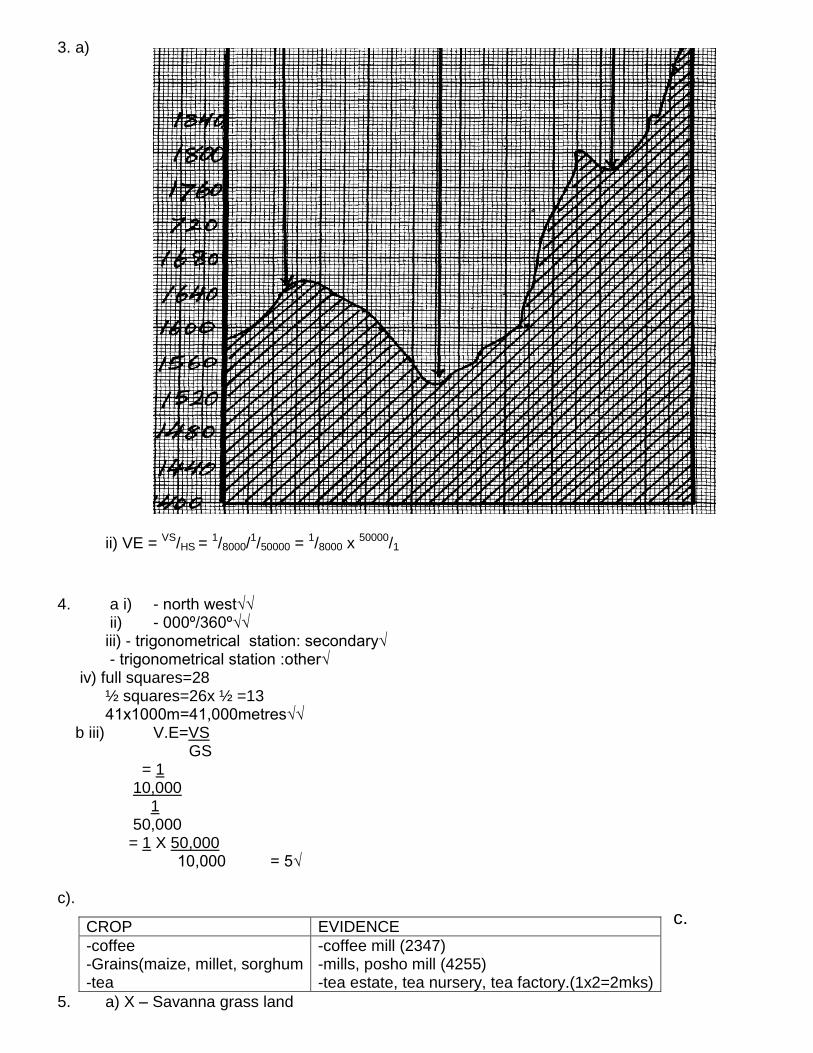
3. a) ii) VE = VS/HS = 1/8000/
1/50000 = 1/8000 x 50000/1
4. a i) - north west√√
ii) - 000º/360º√√ iii) - trigonometrical station: secondary√ - trigonometrical station :other√ iv) full squares=28
½ squares=26x ½ =13 41x1000m=41,000metres√√
b iii) V.E=VS GS
= 1 10,000 1 50,000 = 1 X 50,000 10,000 = 5√ c).
c.
5. a) X – Savanna grass land
CROP EVIDENCE
-coffee -Grains(maize, millet, sorghum -tea
-coffee mill (2347) -mills, posho mill (4255) -tea estate, tea nursery, tea factory.(1x2=2mks)
Y – Tropical rain forest b) - Has very low temperature
- Thin soils and bare rock - Soil is permafrost
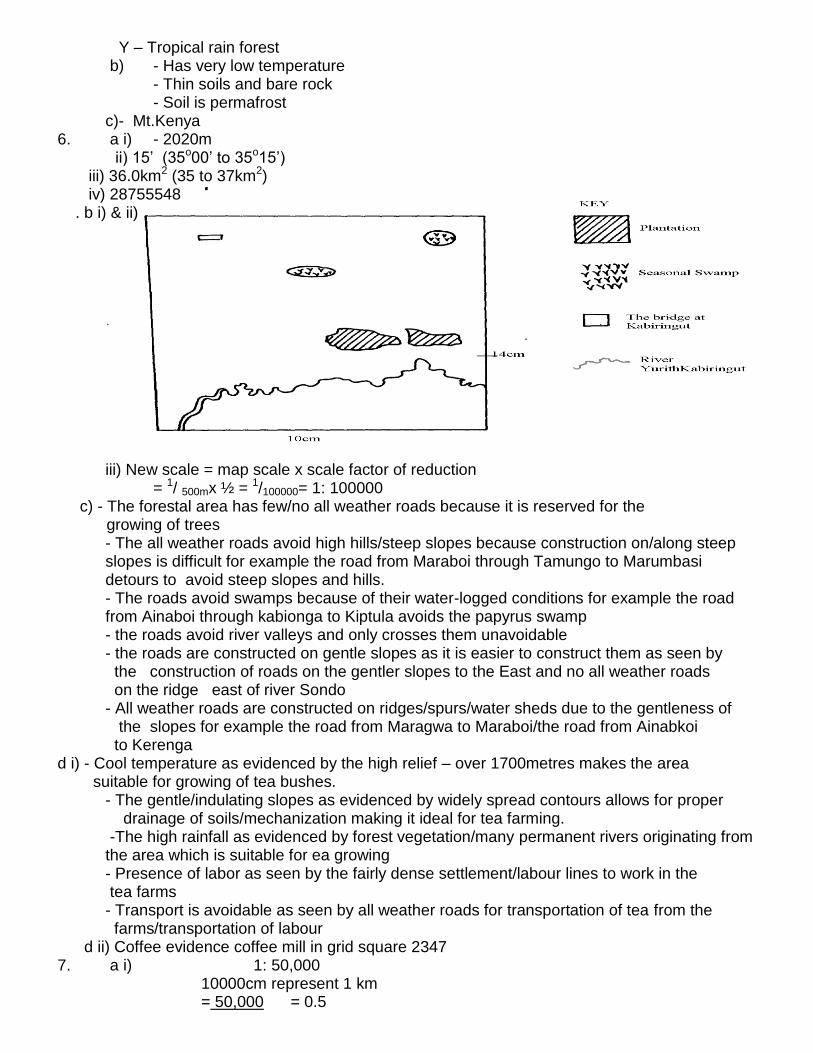
c)- Mt.Kenya 6. a i) - 2020m ii) 15’ (35o00’ to 35o15’) iii) 36.0km2 (35 to 37km2) iv) 28755548 . b i) & ii)
iii) New scale = map scale x scale factor of reduction = 1/ 500mx ½ = 1/100000= 1: 100000
c) - The forestal area has few/no all weather roads because it is reserved for the growing of trees
- The all weather roads avoid high hills/steep slopes because construction on/along steep slopes is difficult for example the road from Maraboi through Tamungo to Marumbasi detours to avoid steep slopes and hills. - The roads avoid swamps because of their water-logged conditions for example the road from Ainaboi through kabionga to Kiptula avoids the papyrus swamp - the roads avoid river valleys and only crosses them unavoidable - the roads are constructed on gentle slopes as it is easier to construct them as seen by the construction of roads on the gentler slopes to the East and no all weather roads on the ridge east of river Sondo - All weather roads are constructed on ridges/spurs/water sheds due to the gentleness of the slopes for example the road from Maragwa to Maraboi/the road from Ainabkoi to Kerenga
d i) - Cool temperature as evidenced by the high relief – over 1700metres makes the area suitable for growing of tea bushes.
- The gentle/indulating slopes as evidenced by widely spread contours allows for proper drainage of soils/mechanization making it ideal for tea farming. -The high rainfall as evidenced by forest vegetation/many permanent rivers originating from the area which is suitable for ea growing - Presence of labor as seen by the fairly dense settlement/labour lines to work in the tea farms - Transport is avoidable as seen by all weather roads for transportation of tea from the farms/transportation of labour
d ii) Coffee evidence coffee mill in grid square 2347 7. a i) 1: 50,000 10000cm represent 1 km = 50,000 = 0.5

100000 1 centimeter represents 0.5 kilometers
ii) - 35o001 – 35o15E iii) - 120o + 1o . b) - Wood land - Riverine trees - Papyrus - Scattered trees
- Scrub
c ii) - River Sondo is the main river
- River Yurith flows S. westwards - Papyrus swamp present to the north and south - Yurith river has meanders - Rivers are permanent - Most rivers show a dendritic pattern
- Dams in grid square 4349 and 4954 d) - Shops and trading centre
- Presence of roads foot paths - Dense settlements provide market - Police post for security
8. a i) -Rift valley -Nyanza ii) -south west direction
iv) 420557 b i) - 4.00km=0.1(3.9 to4.1)km ii) -use of place names -grid reference -compass direction
iii) -forest -woodland -scrubs -riverine trees -papyrus swamp iv) -Tea growing-evidenced by tea factory/tea estates -live stocks keeping-evidence by veterinary livestock centre -cereal crops growing-evidenced by posho mill
(c)-Gentle have dense settlement due to gentle gradient which encourages settlement as evidence by spaced contours. -Relatively flat areas have little or no settlement due to pour drainage as evidenced by papyrus swamp -Areas with steep slopes in the western area hear Kebenet have few settlements as evidence by closely spaced contours -There has dense settlements due to fertile soil as evidenced by the growing of tea in estates
(d) -there are several permanent rivers in the area -rivers Sondu and Yurith are the major rivers in the area -rivers with their tributaries for dendritic drainage pattern -there is a seasonal swamp in grid square 3656 -in the west, rivers flow north-west wards in the south they flow westwards -there are fewer rivers in the north than in the south-
9. a i) - topographical map. ii) - Contours - Trigonometrical stations.

b i) 1.3 cm 1 km 100000 cm 1 km = 100,000 cm 13 cm 1cm X 100000 = 0.000013km
13 ii) - Tea. Evidence by changoi tea factory and tea nursery.
- Coffee, evidence by coffee mill c i) - The plains are densely settled as the land is flat/gentle land.
- The basins have been avoided as they land is water logged/flooded/swampy. - Steep slope/escarpment have been avoided because they are unstable for construction of houses/for farming. - There are few settlement on hilly areas because slopes are gentle.
ii) - Education/schooling evidenced by Gekonge school, Matongo school, Cheboan school, Kakibei school e.t.c
- Trading evidenced by Health centres, Dispensaries - Social work evidence by labour lines. - Transportation evidence by murram, Dry –weather roads.
- Road - River - Forest
10. a i) 35001 - 35151 ii) Map scale 1:50000 i.e. 1cm represents 50000 cm
50000cm = 50000 100000 km = 0.5km/ ½ km Statement scale is 1cm represents 0.5km/ ½ km
iii) Contours Trigonometrically stations b iii) VE = VS HS = 1/2000/ 1/50000 = 50000 x 1 1 2000 = 25 11 . (a) - The drainage consists of rivers papyrus swamps, ponds and lakes
- River Yurith is the main river - River Yurith generally flow West wards - The river has many meanders - River Yurith has two main- tributaries Itare and Kitoi

25
- The area covered by the map are numerous - River Yurith has many tributaries that form a dendrific pattern along the course - The river yurith is Permanent River - There are many disappearing rivers
b)
ECONOMIC ACTIVITY Transportation Trading Crop farming
EVIDENCE Roads/ main tracks/ foot paths Dry weather roads, All weather roads:. Bound surface and loose surface), Air strip Shops, Coffee mill/ tea factory/ posho mill factory Tea nursery/ tea plantation
c) - Employment to people work there is provided. - Facilitates agriculture in the regions around. - Processing of tea, ready for use. - Transportation of people evidence by all weather road e.t.c
d)- Presence of tea that requires high rainfall. - Forest - Many permanent rivers. - Presence of many factories that use a lot of water.
12. a i) Topographical. ii) 24 54 iii) Calculate the area enclosed by Kendu Kisii. All weather roads bound to the West of the map. 7.5 km2 = (7.00 – 8.00 km2). iv) - Education - evidence school. - Medical care – evidence hospital. - Administration – evidence Chief’s Camp, DC’s, D.O’s office. - Recreation. b) ii) Vertical scale Horizontal scale = 1 x 50,000 = 1 20 1 5,000 V.S = 2500
c) - There are several permanent rivers like Itare and Kitoi. - River Yurith is the main river. - Rivers flow from North Eastern to North Western. - There is a swamp / tree swamp around Kabiaga farm. - Rivers form dendritic pattern
d) - The scrub vegetation shows availability of pasture for cattle. - The many rivers (like R. Yurith, Itare and Kitoi) in the area shows that there is adequate water for cattle.
- The high altitude of above 1800m above the sea level indicate cool conditions ideal for cattle keeping.
13. a i) 020º

ii) 556711 iii) map scale 1:50,000
1 cm rep 50,000cm 50,000=50,000√1 100,000 =0.5 Statement scale is 1cm rep 0.5km/ ½ km
iv) 0º 19’S 35º 18’E v) -contours
-trigonometrically stations/pillars b i) -education-school/college
-recreational-club/race course -Health-hospital
. b ii) - tea growing –tea estate/tea factory - Trading-shop/markets - Transportation-all weather roads/dry weather roads, murram roads - Quarrying-quarry
d) -the main river is tugenon -There are many permanent rivers
-River Kipkwes and its tributan’s form Dendntic drainage pattern -River north of northing 69 flow generally towards the north -River south of northing 60 flow towards west/south west
14. a)- Rift Valley province - Nyanza province b i) ii) V.E = VS/HS = 1/50m = 1/50000cm
VE = 10 2 iv) – Topographical 15. a i) i) - 402488
ii) - 7.1 ± 0.1 Km iii) - LUMBWA
. b i) - 35001E to 35151E ii) - 1844 – 1847 m
. c i) - The southern part of the area covered by the mp is well drained as evidenced by presence of many permanent rivers - The main river is Yurith that flows South Western wards - There is a seasonal swamp in the northern part of the area covered by the map - There are several dams along river Kitoi - River Sondo and its tributaries form dentric drainage pattern - River Kitoi and Kimugung re in their youthful stages ii)
1800 1800 1750 1700
1660
1650
1600
Ri
ver
Ro
ck
All
wea
ther
loose
surf
ace
road
Mas
hes
MA
IN T
RA
CK
(M
OT
OR
AB
LE
)
RE
GIO
NA
L B
OU
ND
AR
Y
RF
OO
TP
AT
H

d i) ) - Steep slopes e.g. along the escarpment have been avoided. There are more settlement on gently sloping regions
- Forested areas e.g. to the south eastern part of the map have been avoided - Swampy areas have no settlement - Plantation forms have no settlement inside, people tend to settle around the forms - There are linear settlements along all weather road loose surface especially in the north
eastern part of the area covered by the map d ii) - Presence of well developed transport network in the area ensures movement of goods and Services
- Presence of scattered houses in the area ensures there is market provided by those in the houses - Tea factories and tea plantation farms is likely indication that people are employed in the area and therefore have better living standards