4. MEASUREMENT APPROACHarb.ca.gov/airways/Documents/plans/981220/Part3.pdf · 4-1 4. MEASUREMENT...
78
4-1 4. MEASUREMENT APPROACH This section specifies study design principles, measurement periods, the study domain, and the locations and purposes of sites for the different networks and study periods. Sections 5, 6, and 7 elaborate on the specific measurements to be taken within these networks during the long-term, winter, and fall experiments. 4.1 Study Design Principles The selection of measurement locations, observables, averaging times, and frequencies is guided by the following principles: • PM 10 is driven by PM 2.5 during winter. Solving the wintertime PM 2.5 problem also solves the wintertime PM 10 problem. The wintertime study therefore focuses on PM 2.5 measurements. • PM 10 is driven by both the PM 2.5 and coarse fractions during fall in the central to southern San Joaquin Valley. The fall study focuses on the coarse fraction that is predominantly suspended dust. • Excessive PM 10 and PM 2.5 situations due to nearby activities and windblown dust are relatively rare, random occurrences that are often of short duration and cannot be predicted. These situations can only be captured by very frequent sampling throughout the year. • The statistical nature of the PM 10 and PM 2.5 NAAQS minimizes the influence of a few high concentrations and requires three years of data to determine compliance status. Although elevated PM concentrations are sought during winter and fall, these are only of value to the extent that they can be extrapolated to similar occurrences during the three-year period needed to determine PM 2.5 and PM 10 standard compliance. • PM 2.5 standards are most likely to be exceeded in Fresno and Bakersfield. PM 10 standards are most likely to be exceeded in the Corcoran/Hanford region. These areas will be more intensively examined than other parts of central California. • Wintertime secondary ammonium nitrate, ammonium sulfate, and organic aerosol result from regional-scale transport and mixing of emissions from urban and non- urban areas. • Wintertime transport of secondary PM 2.5 and its precursors occurs above the surface, often at night or early morning, and reaches the ground-level during afternoon mixing. Measurements to verify this hypothesis and to determine the nature of this transport and mixing are emphasized in the winter study. • Existing or previously used measurement sites are preferred. When they serve the purpose, measurement sites from compliance networks, IMS95, VAQS, and
Transcript of 4. MEASUREMENT APPROACHarb.ca.gov/airways/Documents/plans/981220/Part3.pdf · 4-1 4. MEASUREMENT...
4-1
4. MEASUREMENT APPROACH
This section specifies study design principles, measurement periods, the studydomain, and the locations and purposes of sites for the different networks and study periods.Sections 5, 6, and 7 elaborate on the specific measurements to be taken within these networksduring the long-term, winter, and fall experiments.
4.1 Study Design Principles
The selection of measurement locations, observables, averaging times, andfrequencies is guided by the following principles:
• PM10 is driven by PM2.5 during winter. Solving the wintertime PM2.5 problemalso solves the wintertime PM10 problem. The wintertime study therefore focuseson PM2.5 measurements.
• PM10 is driven by both the PM2.5 and coarse fractions during fall in the central tosouthern San Joaquin Valley. The fall study focuses on the coarse fraction that ispredominantly suspended dust.
• Excessive PM10 and PM2.5 situations due to nearby activities and windblown dustare relatively rare, random occurrences that are often of short duration and cannotbe predicted. These situations can only be captured by very frequent samplingthroughout the year.
• The statistical nature of the PM10 and PM2.5 NAAQS minimizes the influence of afew high concentrations and requires three years of data to determine compliancestatus. Although elevated PM concentrations are sought during winter and fall,these are only of value to the extent that they can be extrapolated to similaroccurrences during the three-year period needed to determine PM2.5 and PM10
standard compliance.
• PM2.5 standards are most likely to be exceeded in Fresno and Bakersfield. PM10
standards are most likely to be exceeded in the Corcoran/Hanford region. Theseareas will be more intensively examined than other parts of central California.
• Wintertime secondary ammonium nitrate, ammonium sulfate, and organic aerosolresult from regional-scale transport and mixing of emissions from urban and non-urban areas.
• Wintertime transport of secondary PM2.5 and its precursors occurs above thesurface, often at night or early morning, and reaches the ground-level duringafternoon mixing. Measurements to verify this hypothesis and to determine thenature of this transport and mixing are emphasized in the winter study.
• Existing or previously used measurement sites are preferred. When they serve thepurpose, measurement sites from compliance networks, IMS95, VAQS, and
4-2
SJVAQS/AUSPEX are selected. These have been surveyed and documentedbefore. Several have existing infrastructure and trained technicians available.Previously used or existing sites offer an opportunity to contrast newmeasurements with those acquired in other studies.
• More detailed and costly measurements at a smaller number of anchor locationsare complemented by less detailed and costly measurements at many satellitelocations. Satellite measurements are used to understand the zone ofrepresentation, and changes that occur, between a few well-instrumented anchorsites with high time resolution for a number of observables.
• More frequent and more complete aerosol chemistry is preferable to a largernumber of locations with only mass concentrations. Without the chemicalcomposition, elevated mass concentrations cannot be explained and remainanomalies.
• The Fresno First Street and Bakersfield California sites represent communityexposure for those urban areas. Large numbers of micro-scale and middle-scalesaturation studies around those sites are not needed.
• Detailed understanding of one or two urban areas can be translated to other urbanareas that are not as intensively monitored. The sources are similar, although notidentical, in most central California urban areas, and there is evidence of onlysmall transport of primary particles between them. The exceptions areBakersfield and the eastern Bay area, where several large sulfur dioxide emittersare located.
• Sulfate concentrations are much lower than other PM2.5 components; its sourcesare well identified and probably the most accurate in the emissions inventory.Understanding ammonium nitrate formation and sources or precursors takesprecedence over understanding ammonium sulfate formation and sources. Theammonium/nitrate/sulfate chemical system is inter-related, so sulfate is notignored.
4.2 Study Periods
The long-term average study will take place from 12/1/1999 to 1/31/2001. Thisperiod is intended to achieve at least one representative of each conceptual model at one ormore of the measurement sites. This requires daily continuous aerosol sampling andmeteorological measurements at some of the sites, especially to capture the high windsituation. Annual average measurements continue through the shorter winter and fall studies.The annual study period includes two complete wintertime periods, with the detailedmeasurements made during the final winter. This schedule allows the ARB backbonenetwork to attain full operational capability and permits further evaluation and testing of newmeasurement systems that will be deployed.
4-3
The winter study takes place over a 60-day period between 11/16/2000 and1/31/2001. The beginning date between 11/16/2000 and 12/1/2000 will be selected based onlong-term weather forecasts. Three to eight day episodes, for a total of 15 episode days, willbe selected by forecast within this period for enhanced measurements. Episodes will beforecast by meteorologists based on satellite photos that indicate at least four-days betweenPacific storms and on NGM model forecasts of a Great Basin high pressure system that isconducive to PM buildup. A forecast team has been established to create a forecast protocoland practice it during winters of 1998/1999 and 1999/2000.
The fall study will occur on 60 consecutive days between 9/1/2000 and 10/31/2000,corresponding to harvesting and land preparation in the Corcoran area in the central SanJoaquin Valley. Special measurements taken during the summer will occur between7/1/2000 and 8/31/2000.
4.3 Study Domain and Long-Term Measurement Locations
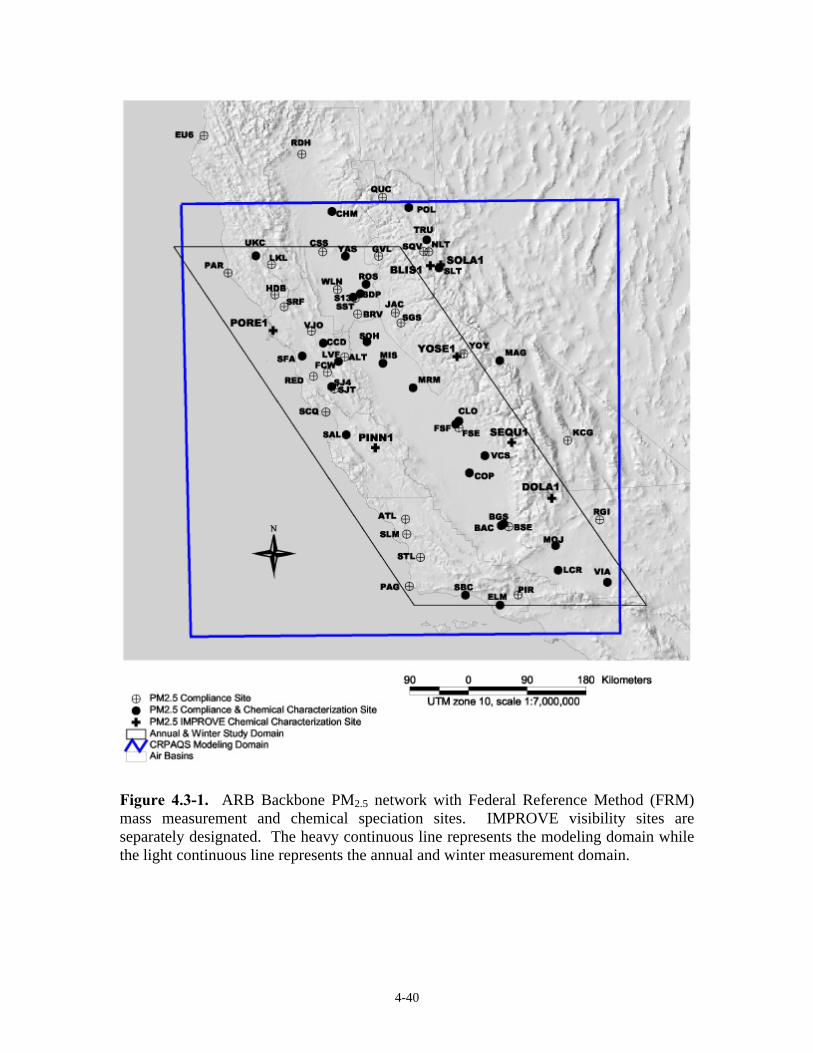
The study domain includes all of central California, as shown Figure 4.3-1. Themeteorological and air quality modeling domain is regional (lat/lon coordinates [33.8788,-124.2708] [33,8203,-117.1484] [39.7733,-116.7238] [39.8385, -124.5415]). The northernboundary extends through Chico and provides a sufficient representation of areas upwind ofSacramento. The western boundary extends approximately 200 km west of San Franciscoand allows the meteorological model to use mid-oceanic values for boundary conditions.The southern boundary extends below Santa Barbara and into the South Coast Air Basin. Theeastern boundary extends past Barstow and includes a large part of the Mojave Desert and allof the southern Sierra Nevada.
This large domain is represented for aerosol measurements by the ARB “backbone”monitoring network also shown by the small dots in Figure 4.3-1. This is a large networkthat will be operated for years to come and will provide the measurements used to determinecompliance with the 24-hour and annual standards. Each of these locations operates aFederal Reference Method (FRM) monitor that acquires PM2.5 deposited on a 47 mm Teflonmembrane filter that is submitted to gravimetric analysis; with appropriate handling andstorage these filters can also be used for elemental and ionic analyses. Several of thebackbone compliance sites are also designated in Figure 4.3-1 as chemical speciation sitesthat will acquire elemental, ionic, and carbon concentrations every sixth day during theannual study period.
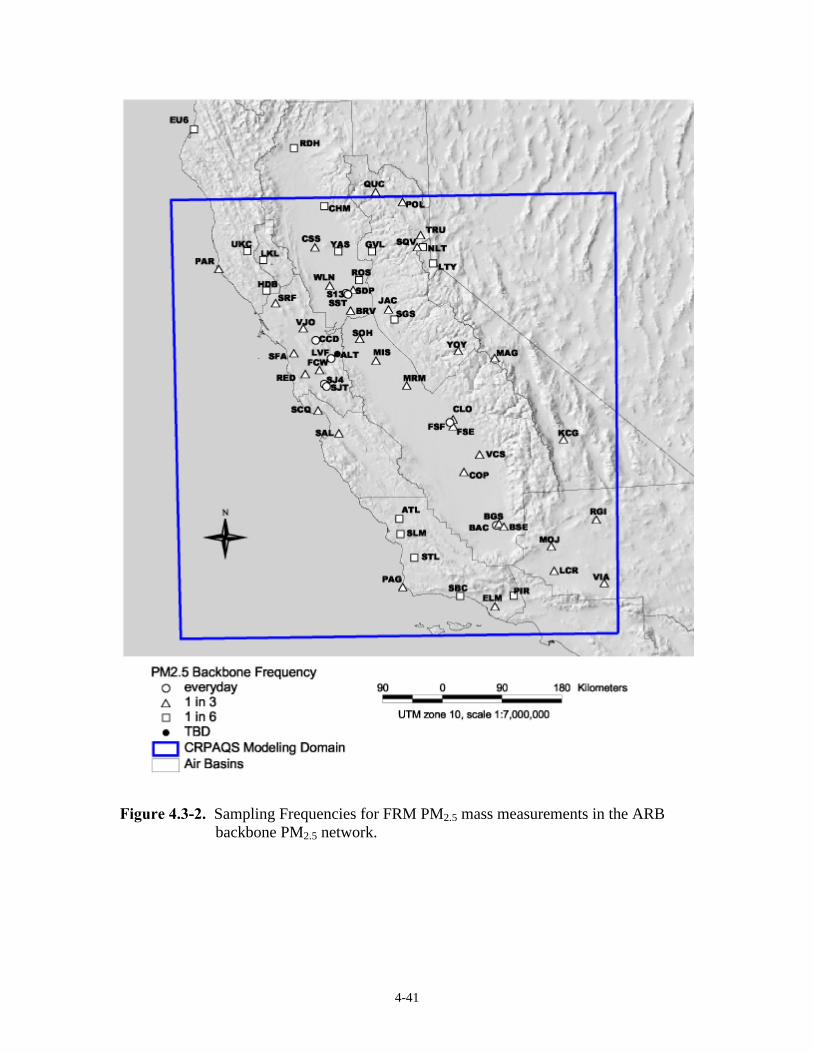
Figure 4.3-2 shows the current sampling frequency at each of the backbone networksites, ranging from every day to every sixth day sampling. These frequencies will beenhanced during the 15 episodic days of the winter study to acquire samples everyday withinthe winter measurement domain.
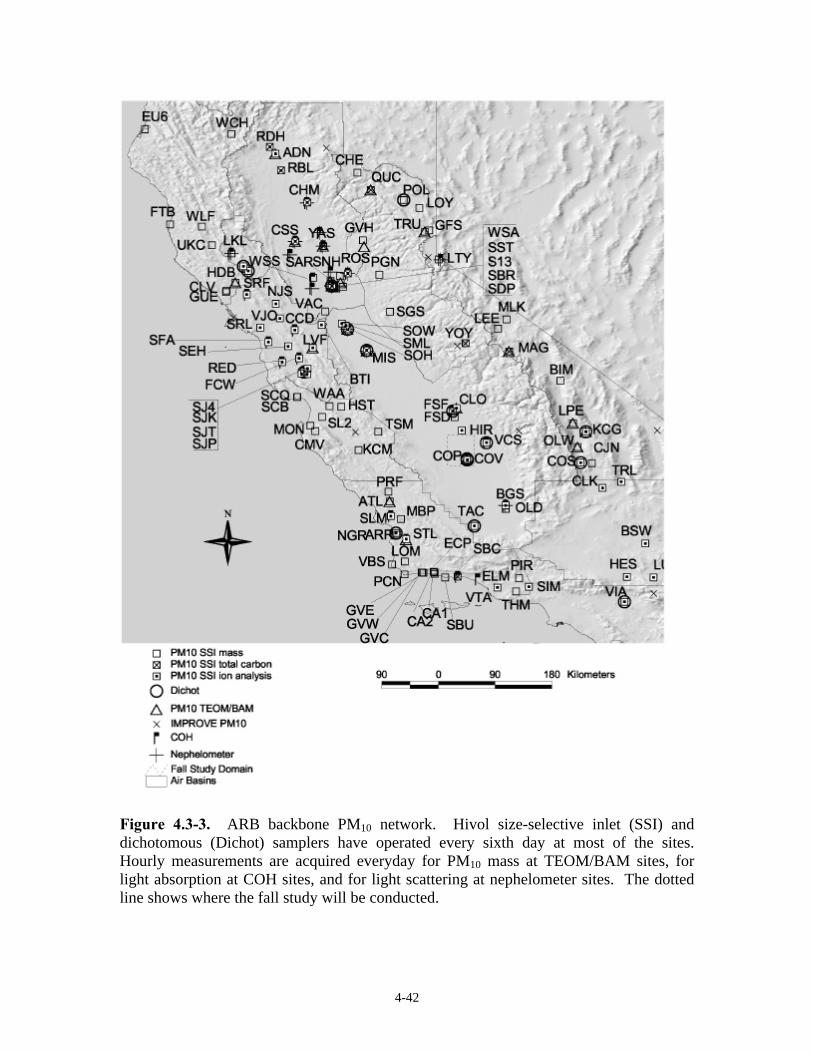
Figure 4.3-3 shows the ARB backbone PM10 network, much of which has beenoperated since 1987 within central California. This network has provided most of theinformation concerning suspended particle concentrations and chemical compositions thatresulted in the conceptual models presented in Section 3. Many of these are collocated withthe PM2.5 sites identified in Figure 4.3-3. Existing PM10 sites substantially outnumber
4-4
proposed PM2.5 compliance sites. The small domain indicated in Figure 4.3-3 shows wherethe fall PM10 study will be conducted.
4.4 PM10 and PM2.5 Measurement Network Enhancements
The long-term PM10 and PM2.5 networks will be enhanced during the CRPAQS fieldstudy with respect to variables measured, sampling frequency and averaging time, andspatial distribution. Sampling sites are classified as follows:
• Community exposure (COmmunity REpresentative, CORE): CORE sites areintended to represent PM2.5 concentrations experienced by large populations thatlive, work, and play within 5 to 10 km surrounding the site. These sites are mostaffected by regional and urban scale contributions with relatively smallneighborhood scale source contributions to PM2.5.
• Background: Background sites intend to measure concentrations that are notinfluenced by central California emissions. There is no location in centralCalifornia that is completely uninfluenced by manmade emissions in the state.Several sites along the west coast, in the Sierra Nevadas, and in the southeastdesert and Owens Valley may best represent atmospheric concentrations andcomposition much of the time. The concentrations and compositions measured atthese sites, coupled with examination of concurrent meteorology, will beexamined to determine the extent to which samples at these sites can be used torepresent global and continental scale concentrations.
• Interbasin transport: These sites are intended to evaluate concentrations alongestablished or potential transport pathways between the Bay Area, the southcentral coast, the SJV, the South Coast Air Basin, and the Mojave desert.Interbasin transport sites are typically at mountain passes. During winter, thesemay also double as background sites, as they will sometimes be above andsometimes be below the valleywide mixed layer.
• Intrabasin gradient: These sites are located in non-urban areas betweenbackbone network sites. They are intended to evaluate the extent to which oneurban area affects PM concentrations in another urban area, as well as the extentto which urban contributions arrive at non-urban locations. These sites are alsolocated in areas that may be affected by nearby dust emissions raised byundocumented activities or wind erosion.
• Vertical gradient: These sites are located at higher elevations on tall towers orhillsides to evaluate vertical mixing by comparison with ground-levelmeasurements.
• Source: Source sites are located right next to, and downwind of, representativeand identifiable emitters. Where practical, these are located within 1 km ofgradient or CORE sites to further evaluate the zone of influence of these sourceemissions on measurements at those sites. Source sites are intended to quantify
4-5
near-maximum contributions from individual emitters and, when coupled withmeasurements from nearby sites, estimate the zone of influence of these emitters.
• Receptor zone of representation: Receptor sites are intended to examinemedium or neighborhood scale spatial variability around CORE sites. Their dataare used to determine the extent to which the CORE site represents communityexposure at increasing distances from the CORE site.
• Visibility: Visibility sites are intended to estimate the amount of light scatteringor light extinction, and sometimes the contributions of atmospheric constituents toscattering and extinction. Many of the sites located for other purposes can servethese purposes, but a few sites are located specifically for these purposes,especially during the summer in and near the Mojave desert.
Sites meeting these classifications are distributed among three different networks:
• ARB backbone network: ARB, in collaboration with the California air qualitymanagement districts, is establishing the PM2.5 monitoring sites shown in Figure4.3-1. The IMPROVE visibility sites in National Parks are also backbone site.This network acquires samples with the frequencies shown in Figure 4.3-2. ThePM10 network shown in Figure 4.3-3 acquires filter samples every sixth day.Several of the PM10 sites have continuous monitors that measure hourly PM10
everyday. Most of these PM2.5 and PM10 sites have been selected to becommunity representative and will be used for determining compliance with thePM2.5 and PM10 NAAQS. These monitors will operate for many years, wellbeyond the duration of the CRPAQS field study. Additional measurements aremade at these backbone sites, as well as at other locations that represent theclassifications described above.
• CRPAQS anchor network: Anchor sites are more highly instrumented thanother sites, especially with monitors that acquire mass and chemicalmeasurements continuously at high time resolution. Five sites are collocated withPM2.5 backbone network sites for the annual program: Bakersfield-CaliforniaStreet (BAC), Fresno-First Street (FSF), Sacramento Del Paso Street (SDP), andSan Jose-Fourth Street (SJ4). An additional non-urban anchor site operates allyear at Angiola (ANGI). The Edwards Air Force Base (EDW) is an anchor siteduring the summer to evaluate the properties of visibility-reducing atmosphericconstituents in the Mojave Desert. The anchor network is substantiallyaugmented during the winter with additional measurement locations at BethelIsland (BTI), Dublin (DUB1), Modesto-I Street (MIS), Pt. Arena (PARN), SierraNevada Foothills (SNFH), and Walnut Grove Tower (WAG) sites. Both surfaceand elevated monitors are located on the Angiola (ANGT) and Walnut Grove(WAGT) towers to evaluate vertical gradients.
• CRPAQS satellite network: The satellite network consists of portable filter-based and continuous light scattering measurement systems that do not requirepower or complicated infrastructure. This type of network offers substantial
4-6
flexibility with respect to site selection and site type. Most of the interbasintransport and intrabasin gradient sites are in this category. Most of the satellitesites use PM2.5 inlets on the sampling systems owing to the relatively low numberof backbone PM2.5 sites compared to PM10 sites. Seven satellite sites at whichhistorically high PM10 concentrations have been measured are collocated withbackbone sites at the Bakersfield-Golden State (BGS), Corcoran-Patterson (COP),Fresno-Drummond (FSD), Hanford-Irwin (HAN), Modesto-24 Street (M14),Oildale-Manor (OLD), and Visalia-Church Street (VCS) sites. These PM10
satellite sites will be operated every six days, but three days behind the regularsix-day schedule applied to PM10 and PM2.5 sampling at these sites.
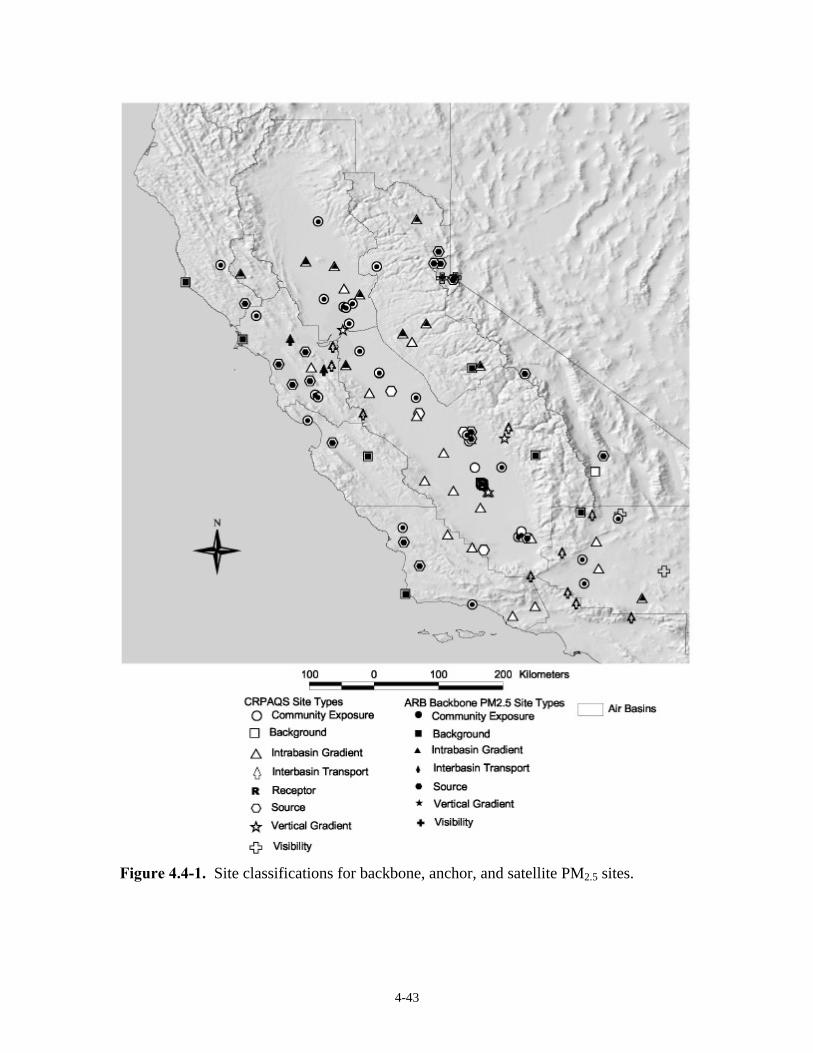
Figure 4.4-1 shows the combined backbone, anchor, and satellite site network forPM2.5 by site type, while Figure 4.4-2 shows the types of measurements that are to beacquired at each site, both as part of long-term monitoring and as part of CRPAQS.
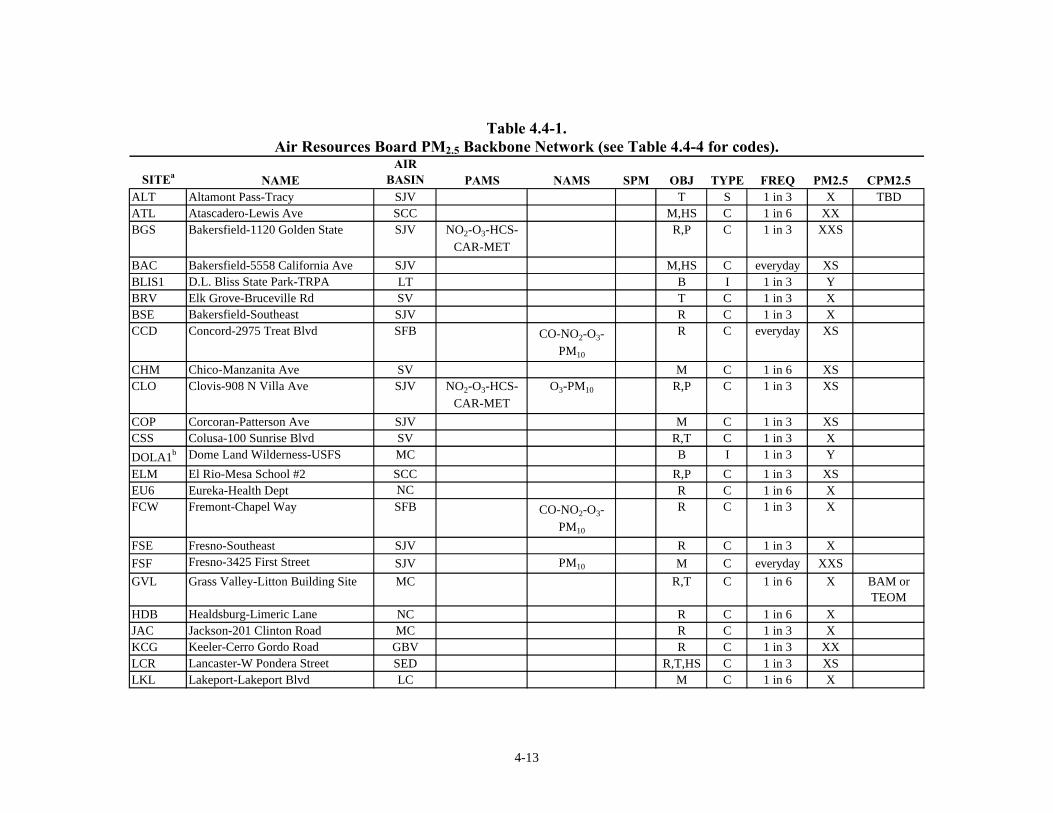
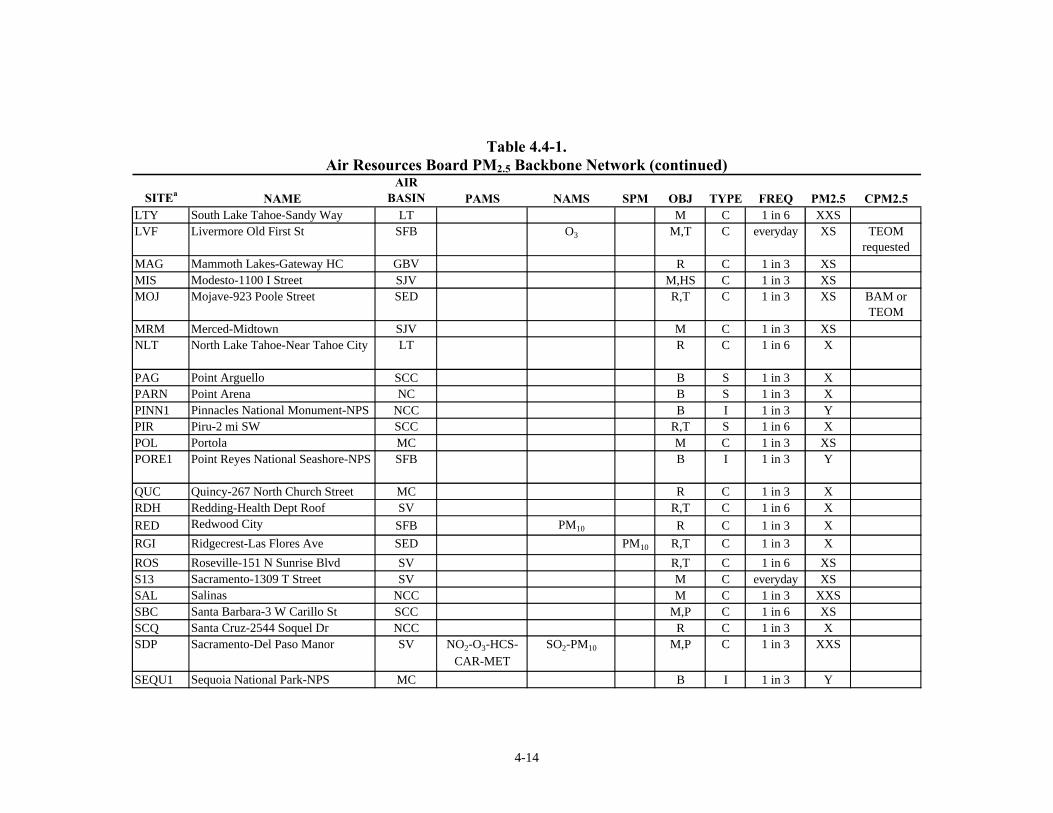
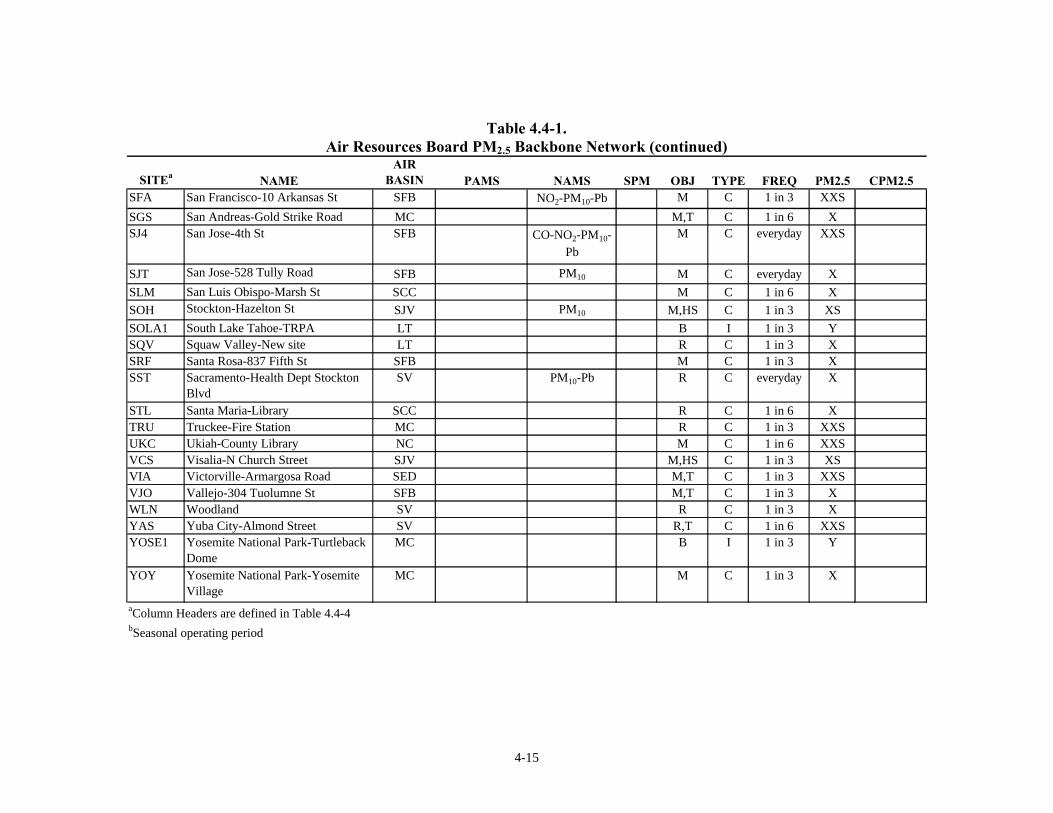
Table 4.4-1 describes the proposed PM2.5 network that is to be installed during 1998and 1999. This table summarizes the location, purpose, measurement frequency, and routinechemical characterization that is currently envisioned for these sites. Most of these sites areintended to be CORE sites. Background sites will be operated at Pt. Arena and Pt. Arguelloand a transport site will be operated at Altamont Pass. PM2.5 backbone network sites are to beequipped with Federal Reference Method (FRM) samplers that acquire PM2.5 mass depositson Teflon membrane filters that can be analyzed for mass and elemental concentrations.Table 4.4-1 and Figure 4.3-1 identify those sites that will be equipped with chemicalspeciation monitors that obtain samples on Teflon and quartz filters. As part of long-termmonitoring, the speciation monitors are intended to operate every twelfth day and willundergo chemical characterization for elements, ions, and carbon. The Ridgecrest (RGI) siteis not currently planned for backbone network speciation, but it will be upgraded for thispurpose during CRPAQS monitoring to better characterize the chemical characteristics ofPM2.5 in the Mojave Desert. CRPAQS will also increase the frequency of chemicalspeciation sampling at analysis at these sites to every six days during the annualmeasurement program.
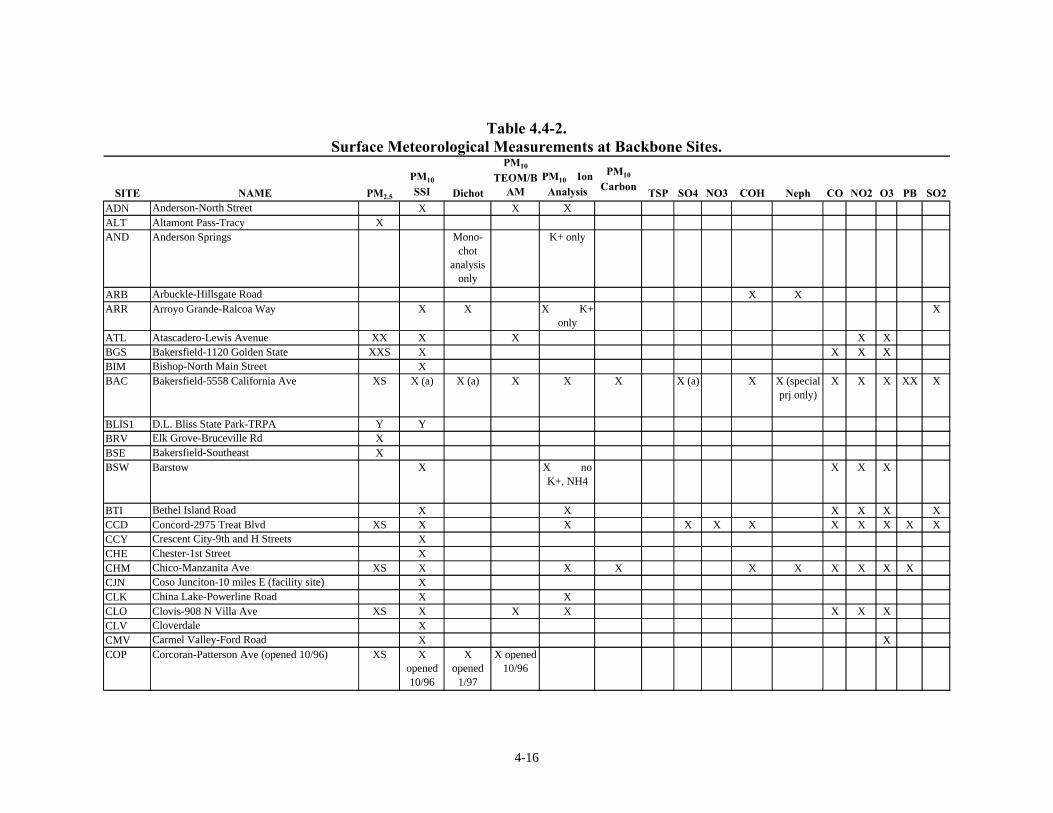
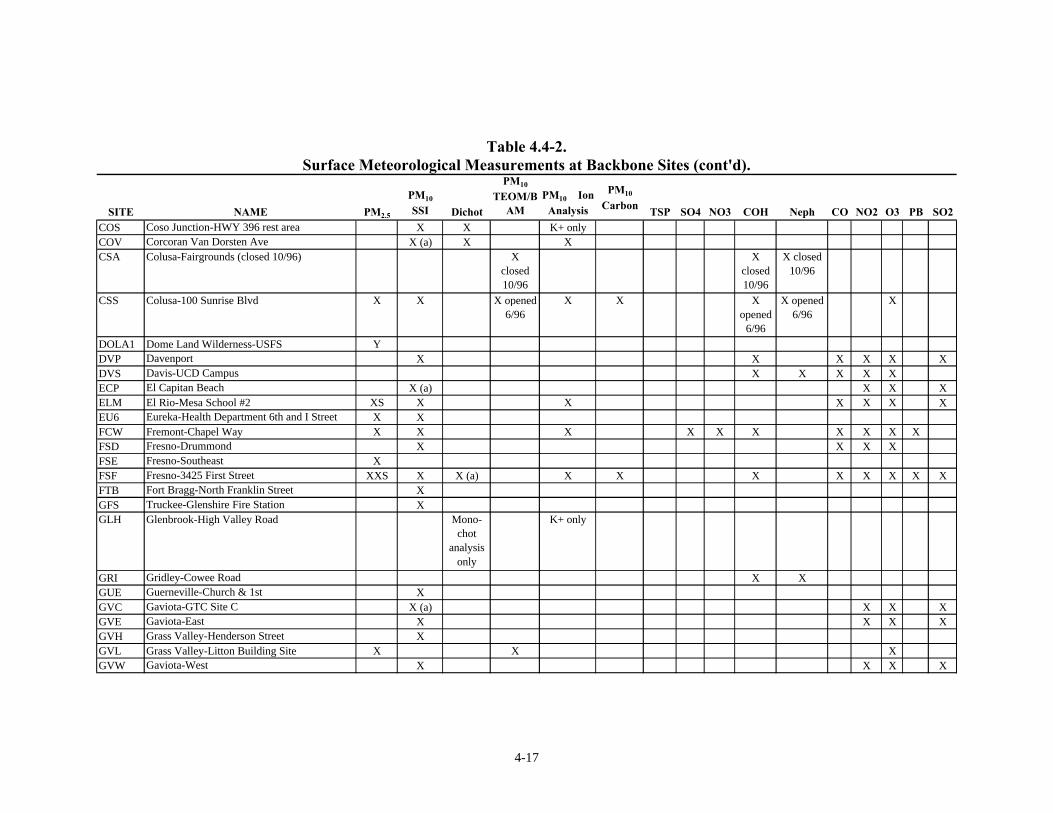
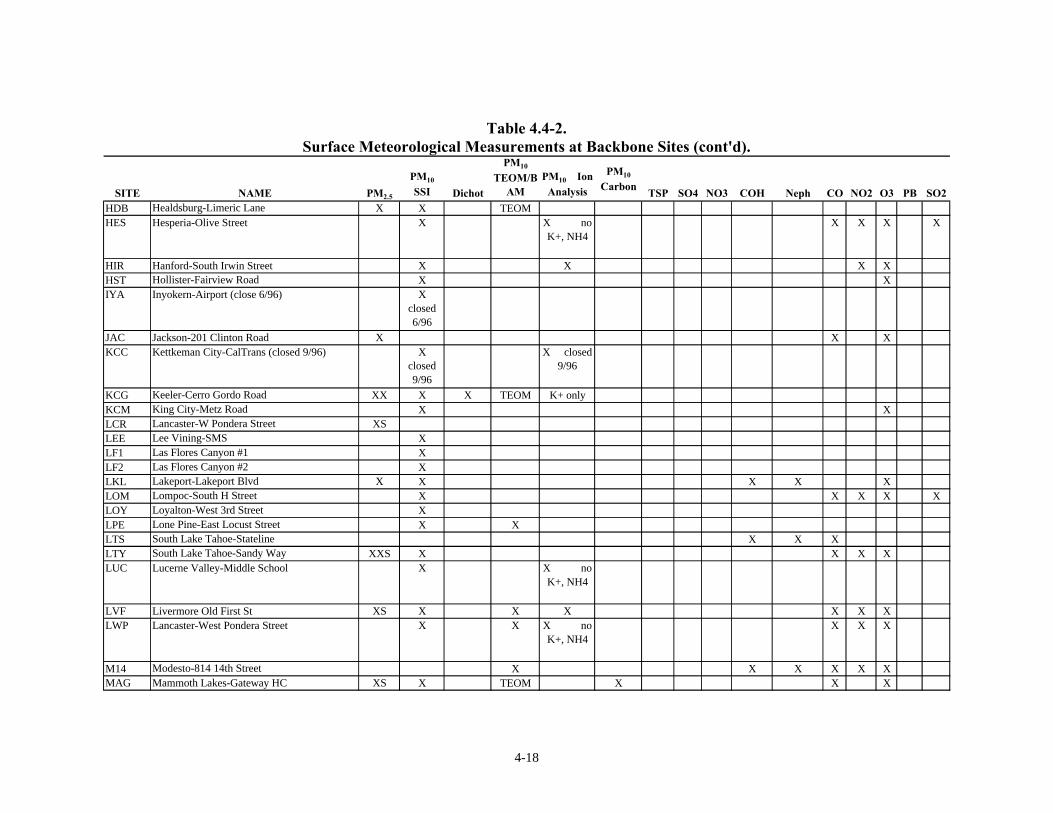
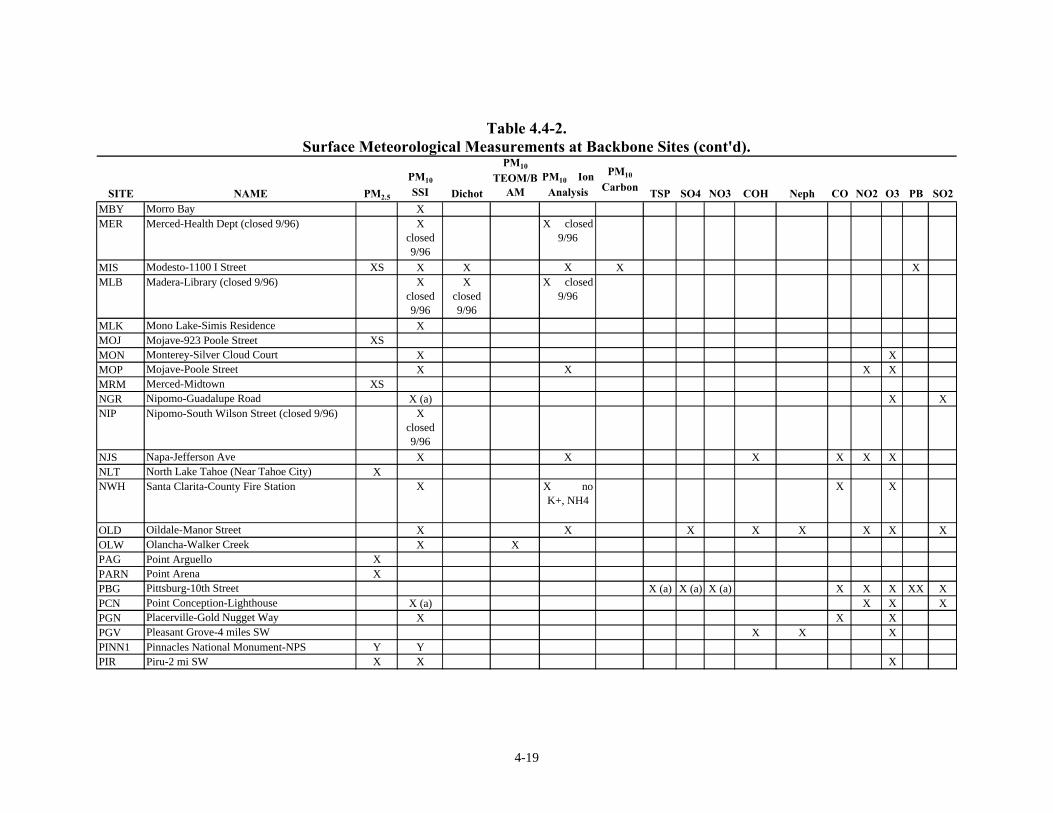
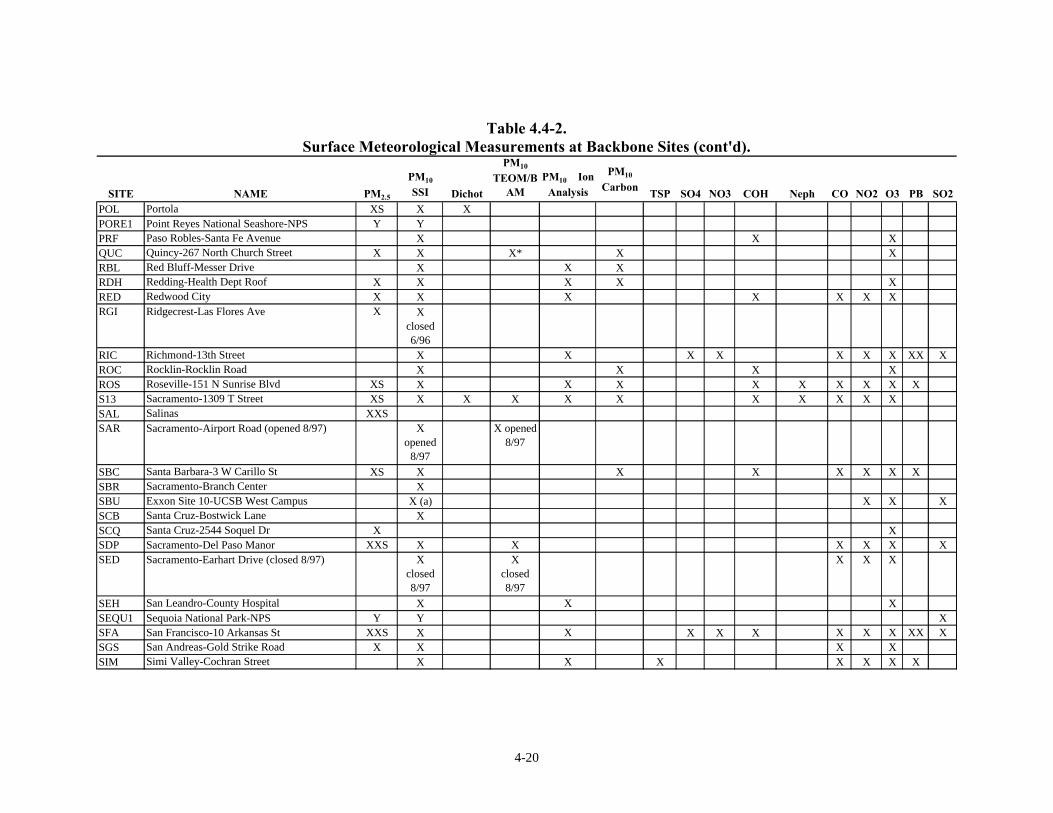
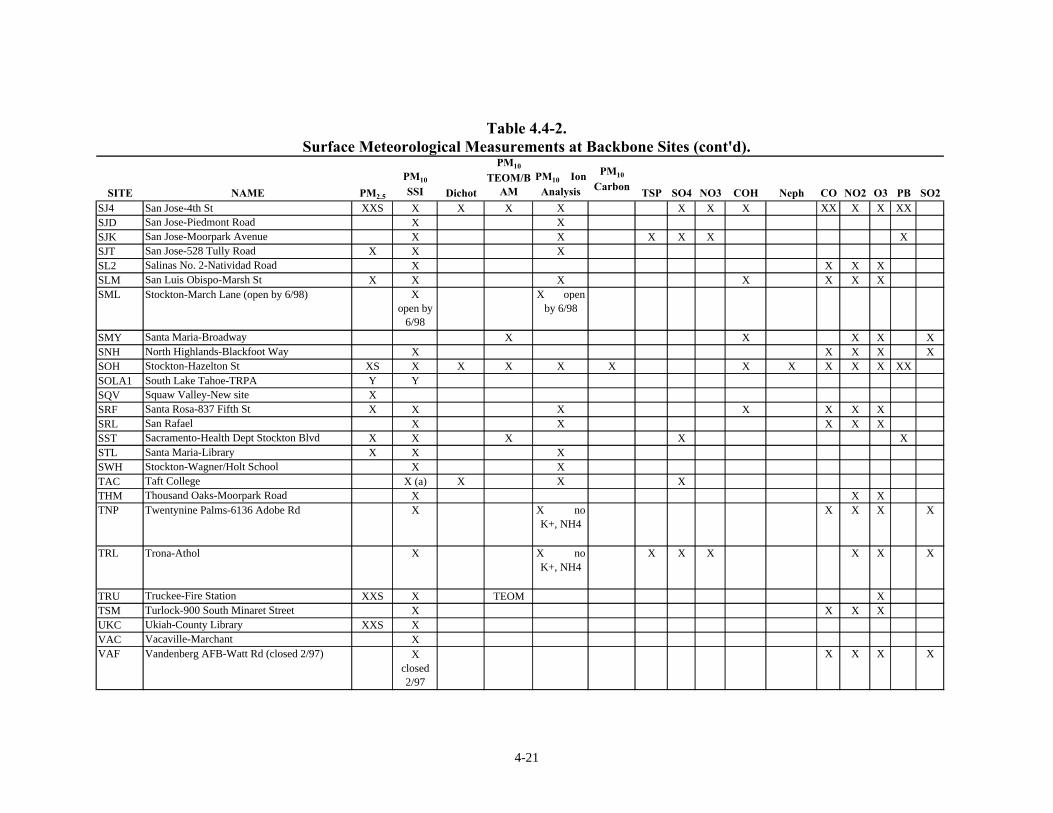
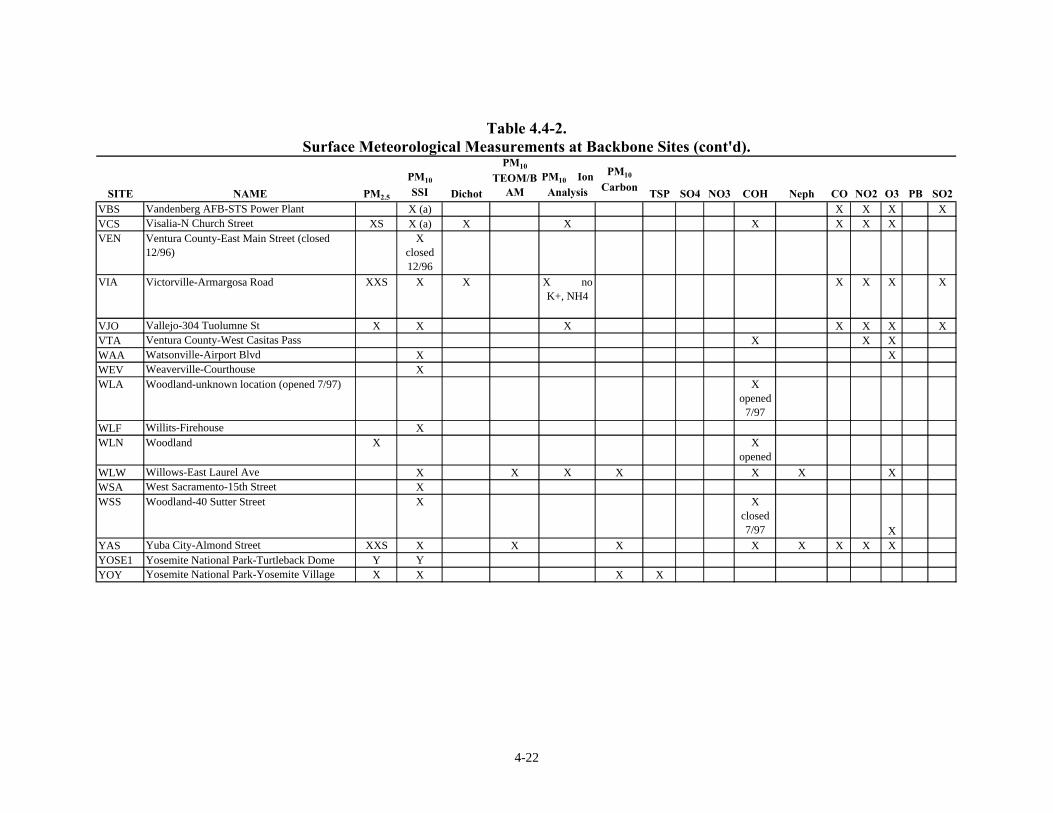
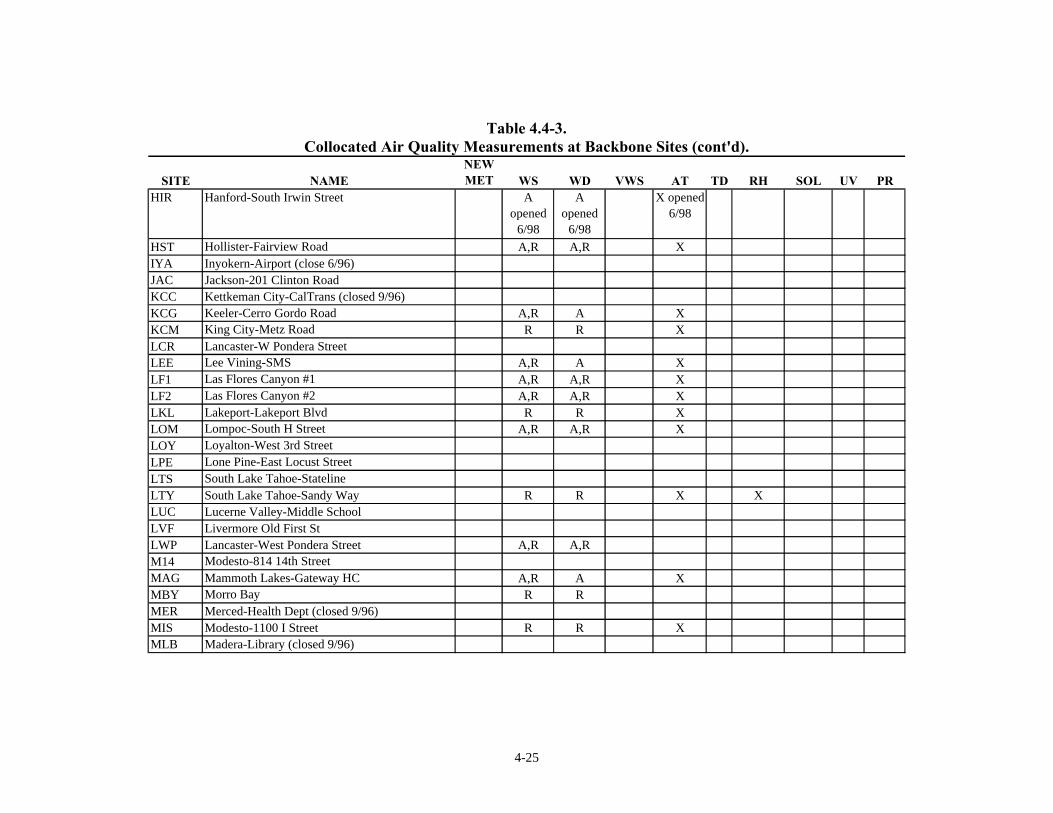
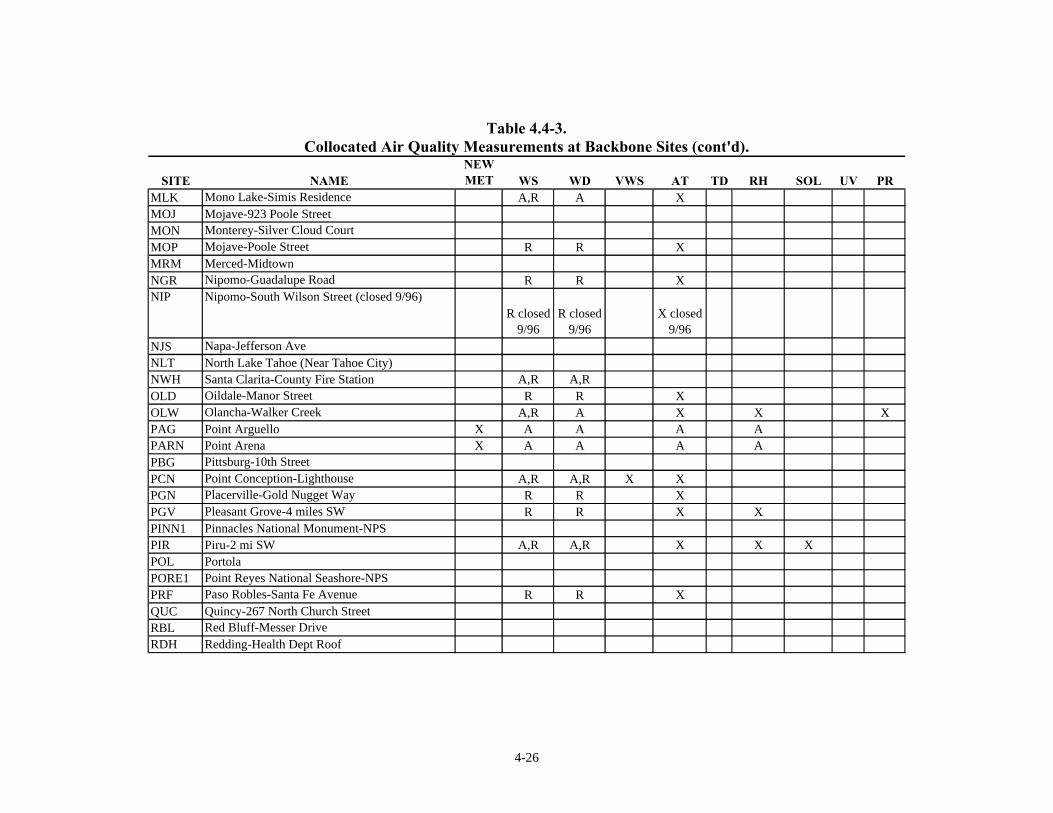
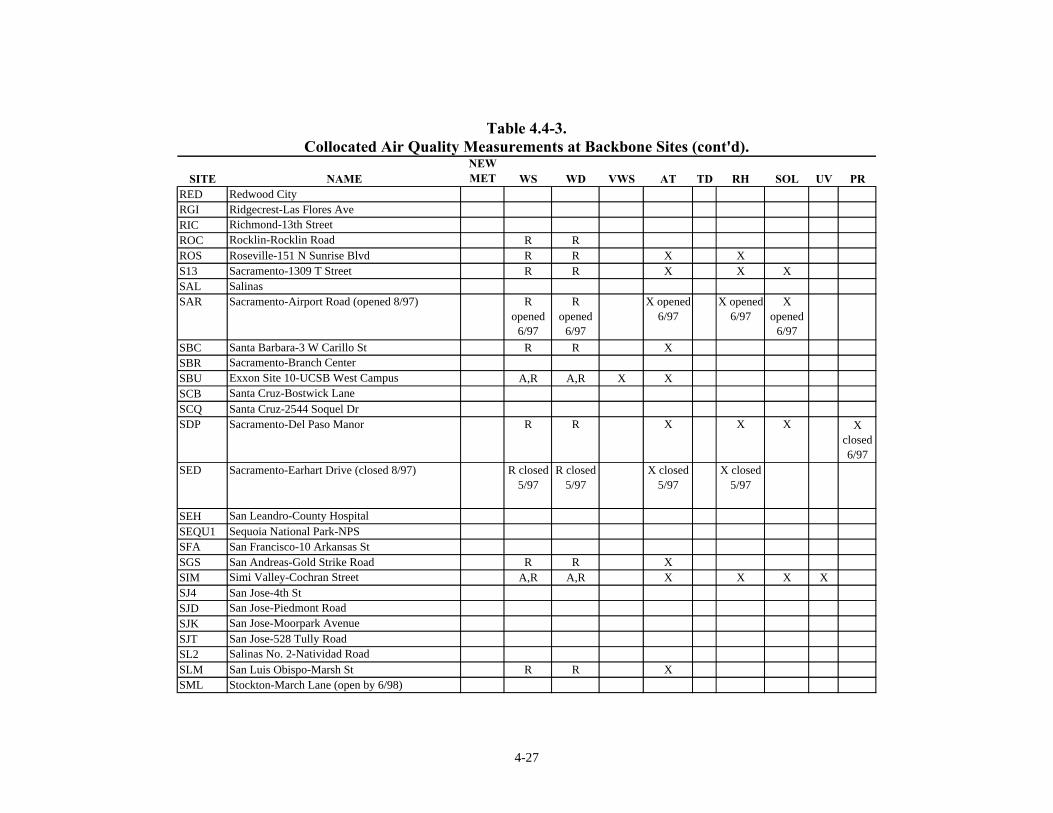
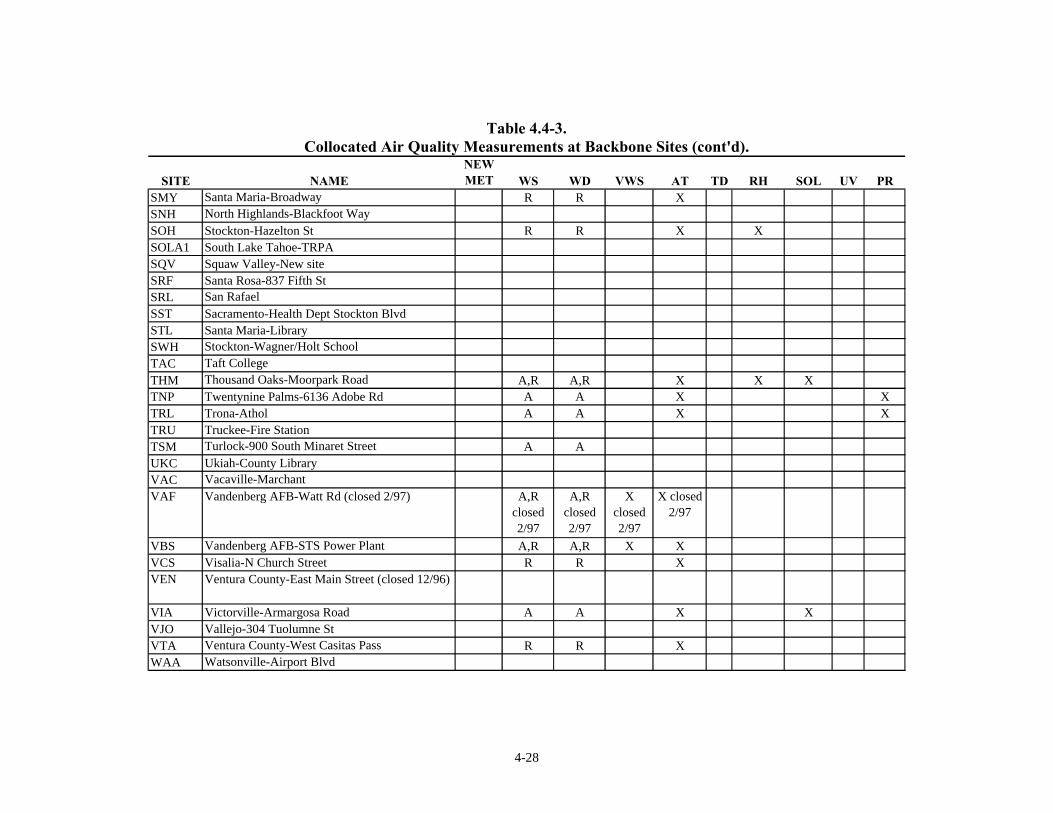
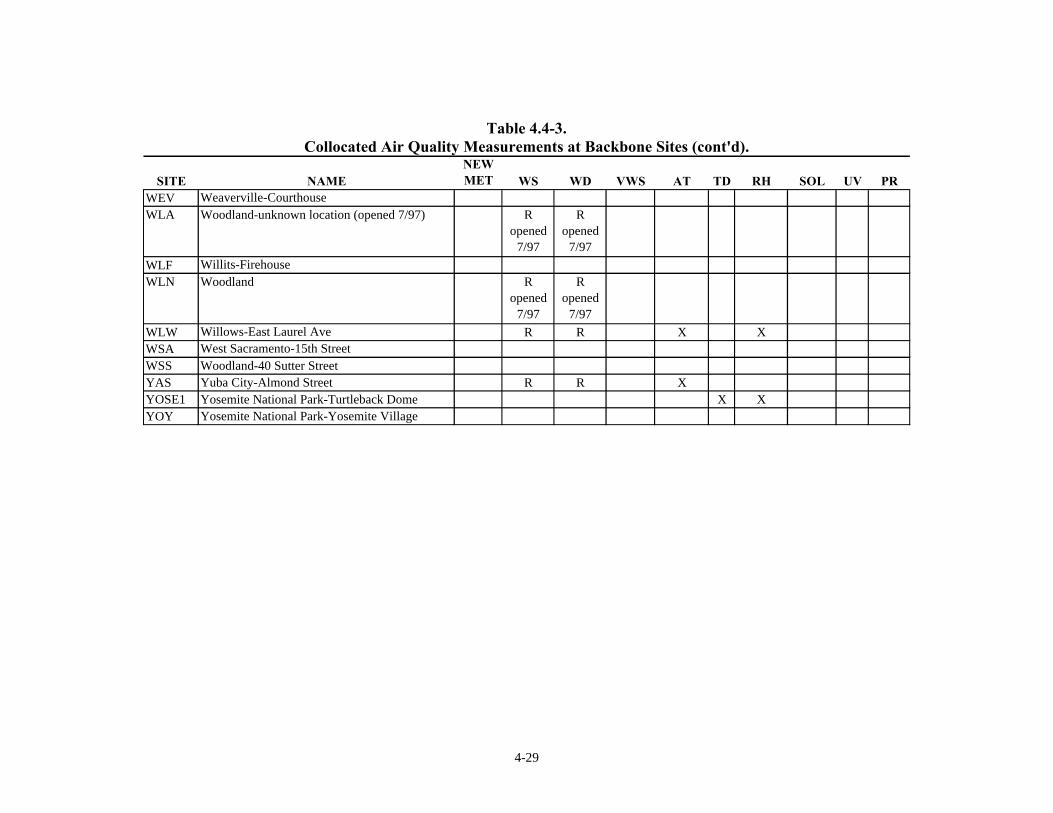
Table 4.4-2 identifies and describes the PM10 backbone network sites that correspondto those located in Figure 4.3-2. This table also shows which are collocated with PM2.5
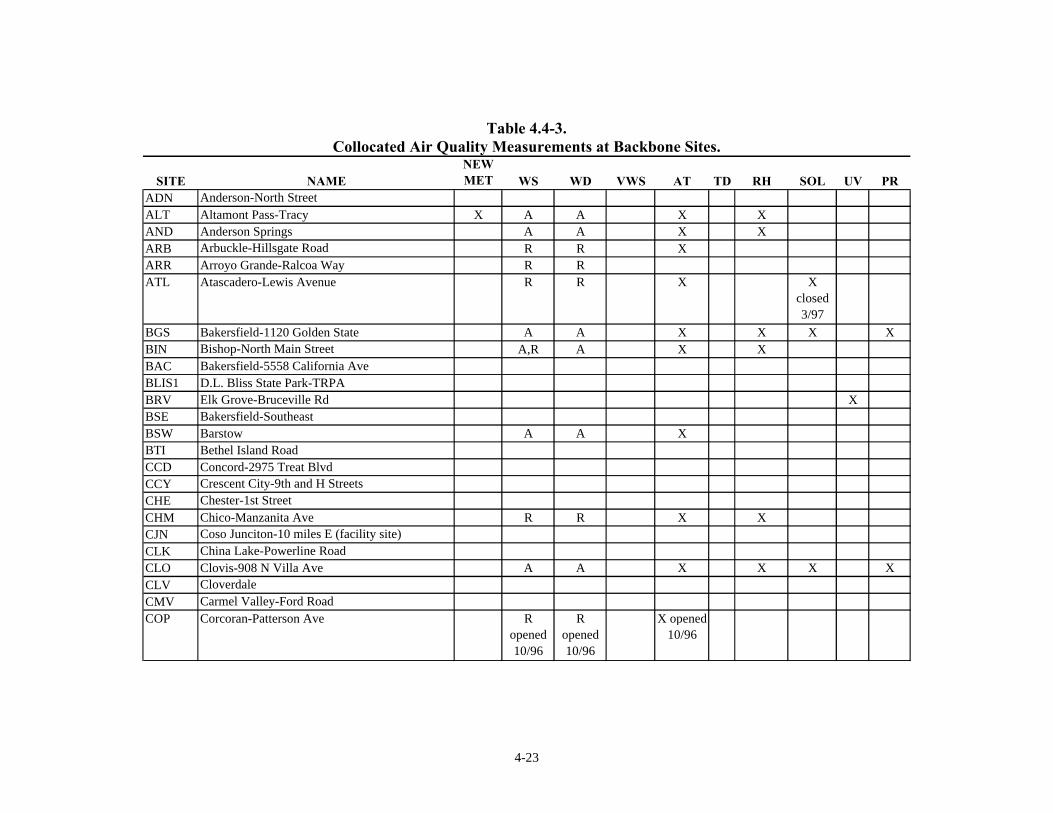
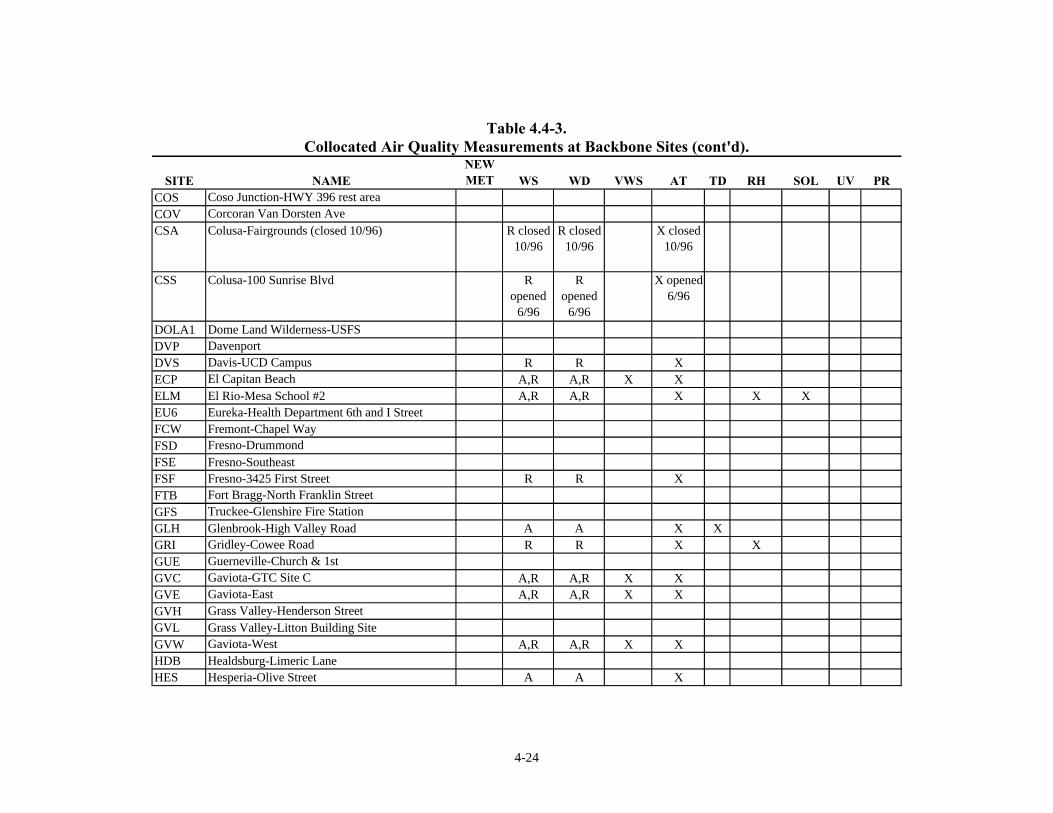
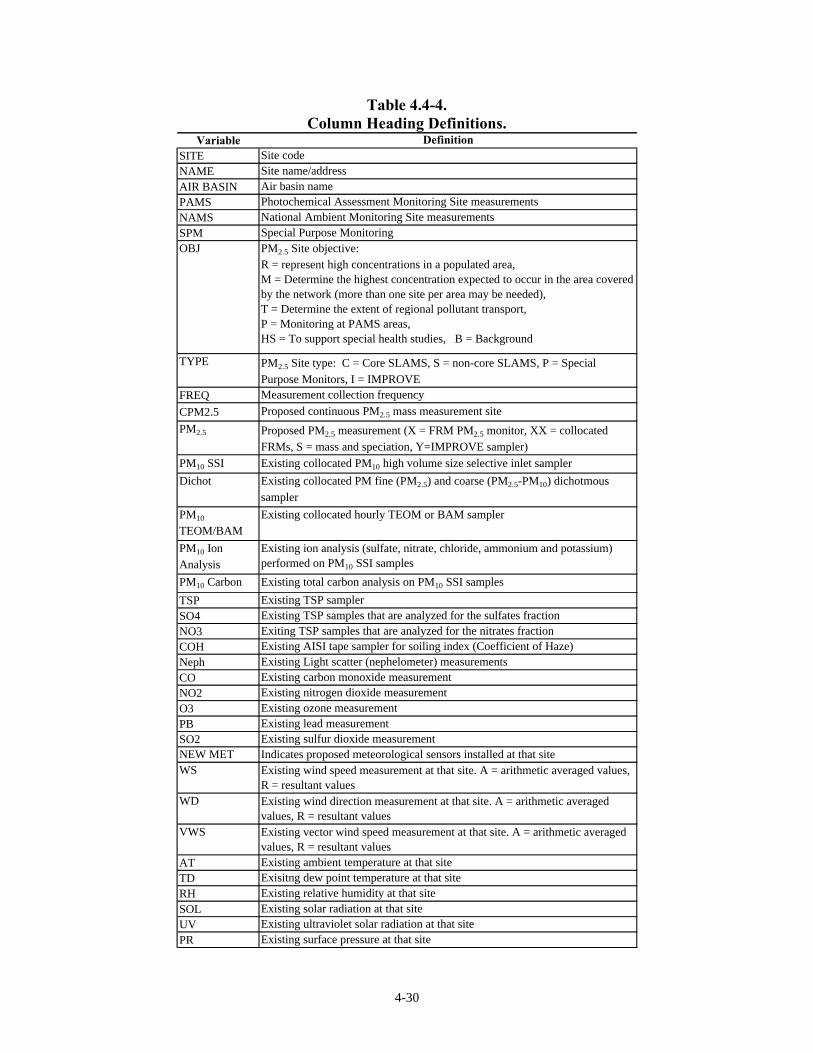
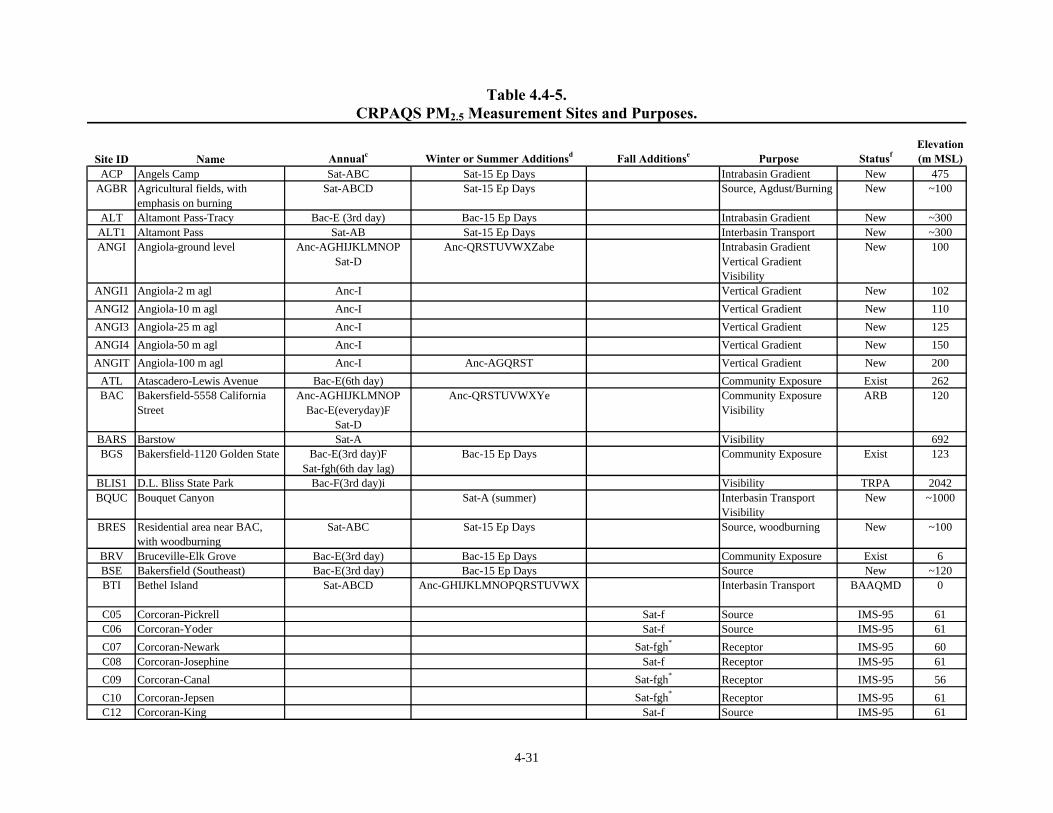
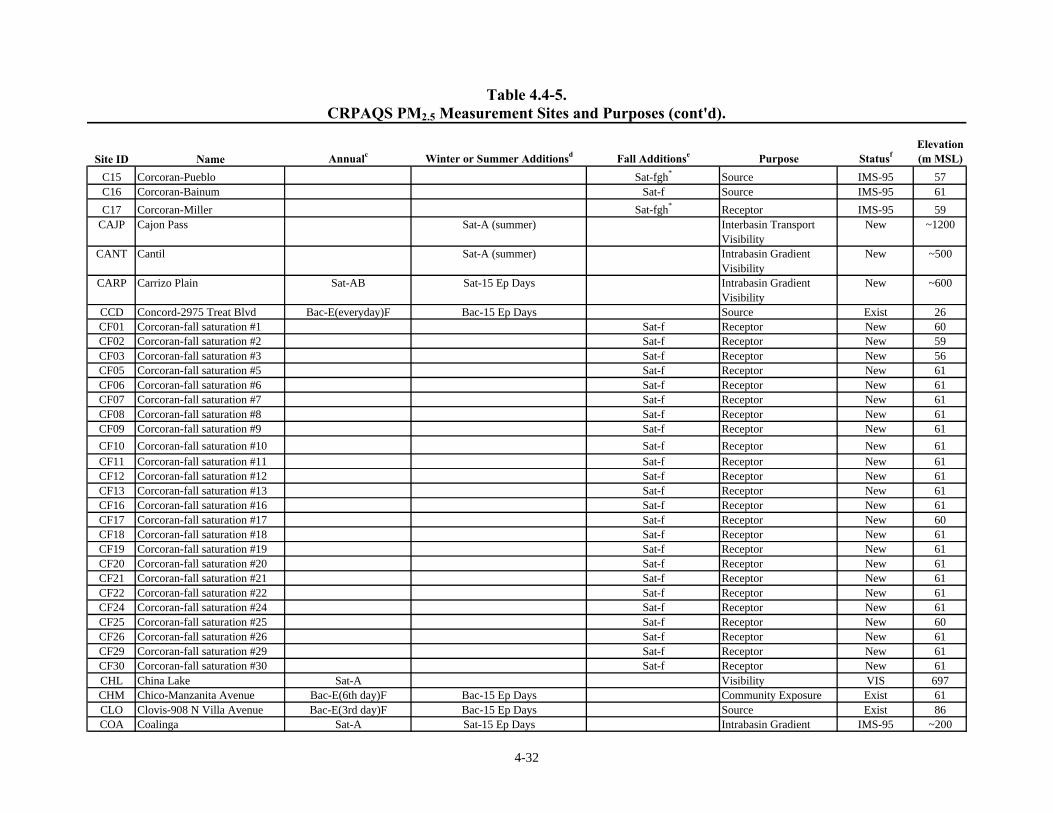
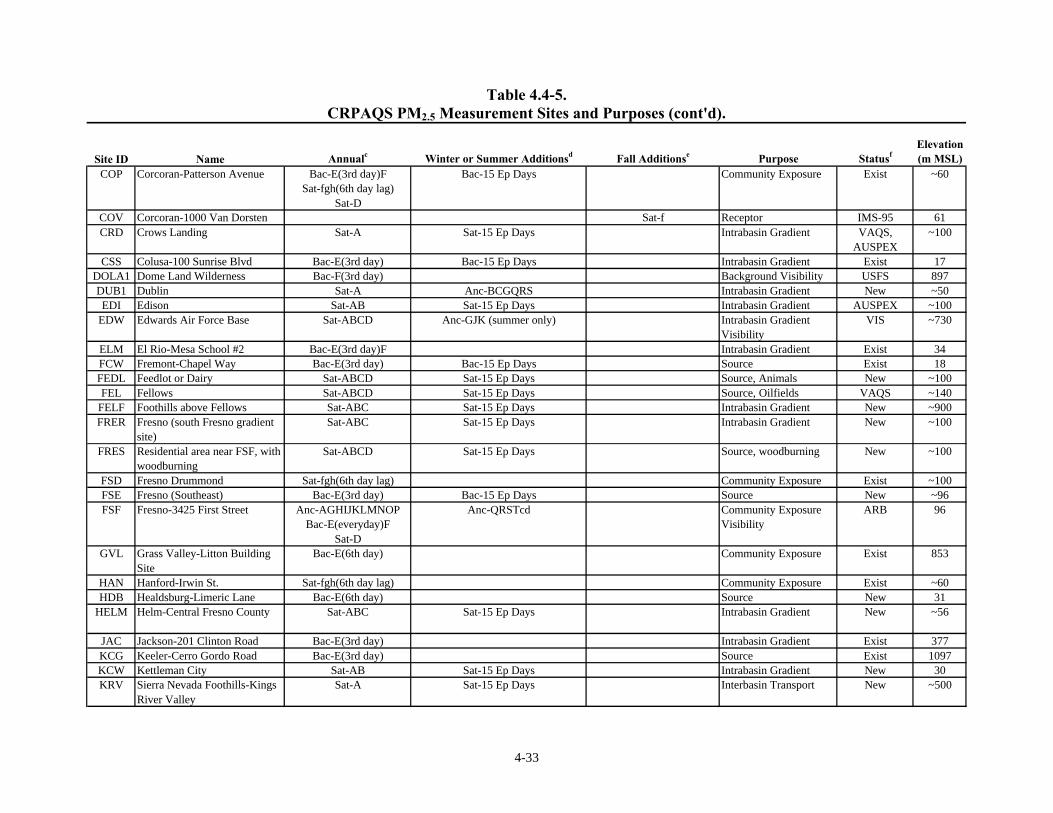
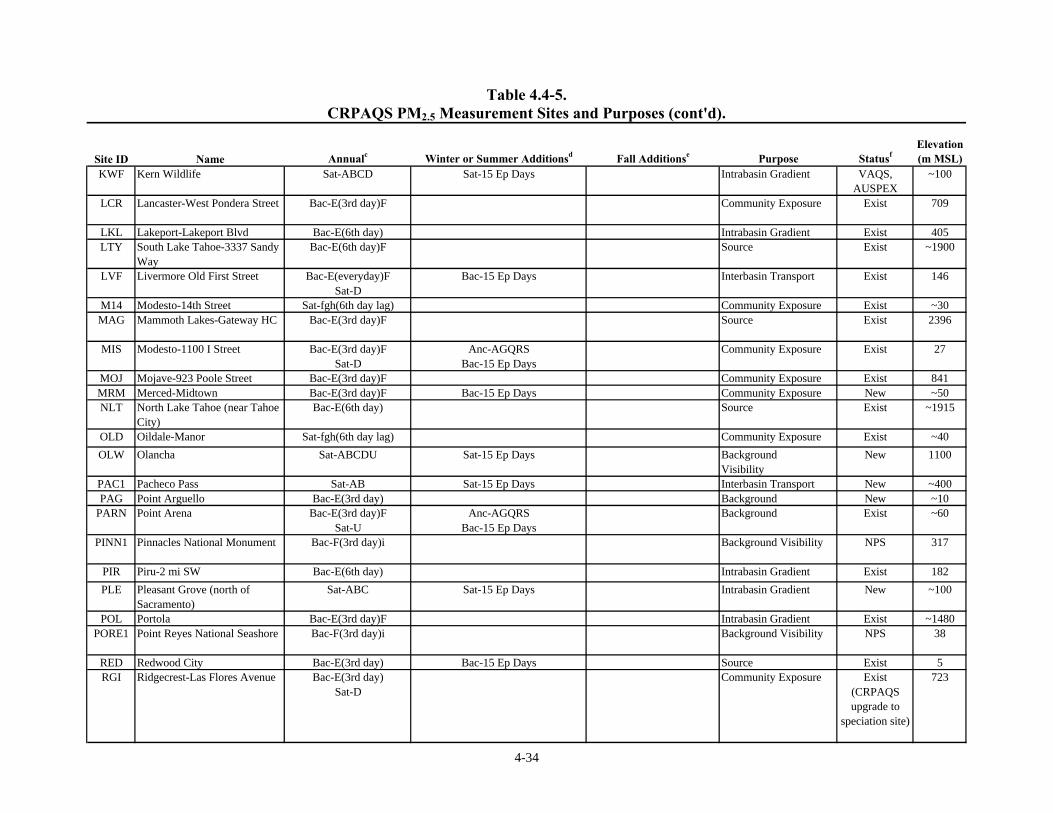
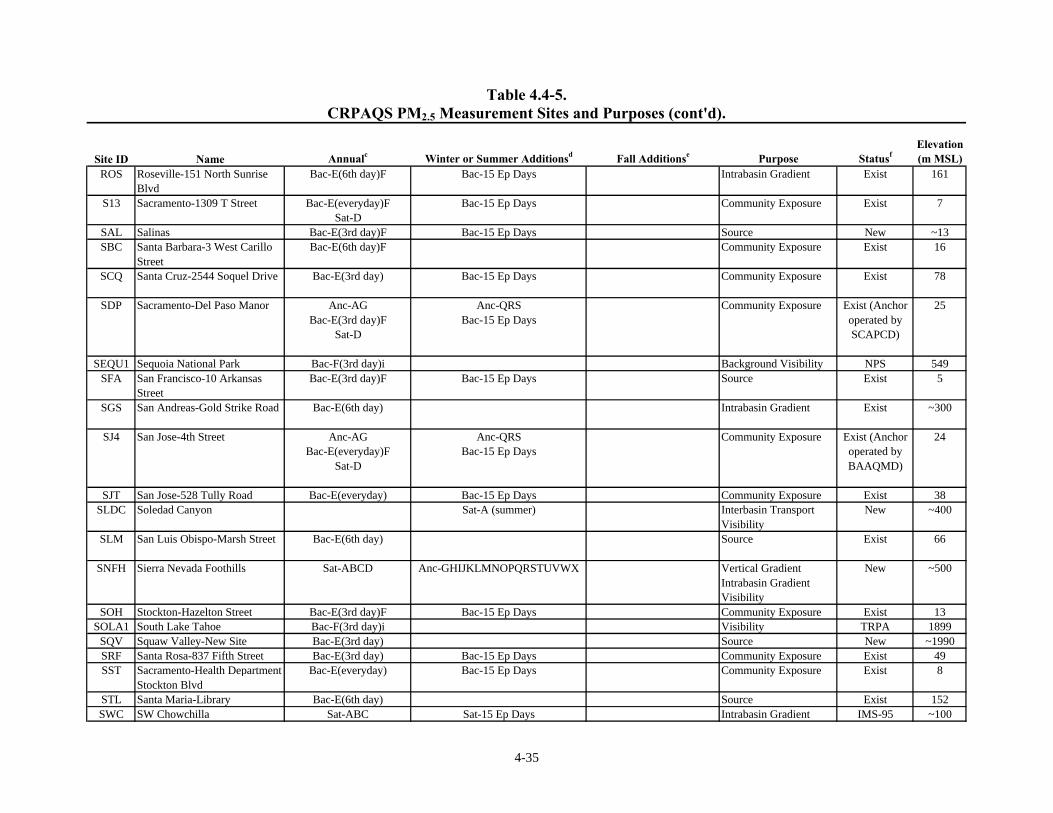
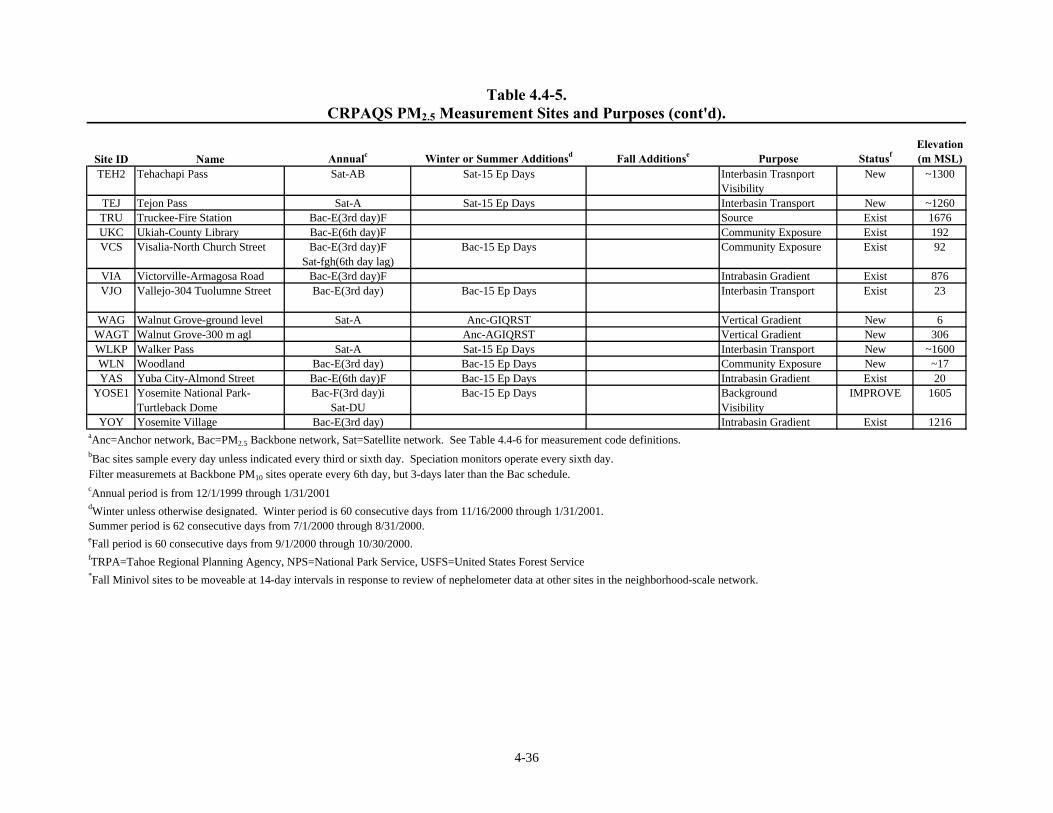
backbone network sites and those that only have PM10 measurements. Other air qualityvariables measured at each site are identified in this table and are plotted in Figure 4.3-3.Table 4.4-3 presents a similar summary for meteorological monitors that currently operate atthe backbone PM2.5 and PM10 samplings sites. Definitions for column headings in Tables4.4-1 through 4.4-3 are presented in Table 4.4-4. These existing measurements serve as astarting point for the addition of CRPAQS measurements. Tables 4.4-5 and 4.4-6 describethe aerosol measurements that will be acquired at each site and the methods and averagingtime to be applied to those measurements. As noted in Table 4.4-5, some of thesemeasurements will be specific for summer, fall, and winter periods while many of them willoperate throughout the 14-month annual monitoring period.
4-7
For the most part, the backbone network sites follow the summertime transportpathway from the Bay Area, through the SJV, and out into the Mojave Desert. The SJVbackbone sites are primarily located on the eastern side of the valley, along SR 99, withinpopulation centers. The exception is the Corcoran site, which is in a rural area that hasregistered elevated PM10 in the past and has served as a design location for the PM10 StateImplementation Plan. The larger urban areas have more than one PM2.5 monitor, as indicatedin Table 4.4-1, so that PM2.5 spatial homogeneity can be determined and spatial averages canbe calculated. These sites have undergone substantial scrutiny and they pass the tests forurban-scale, community exposure site described by Watson et al., (1997) and summarized inSection 8.
Most of the anchor sites are a subset of the backbone network. For annualmonitoring, these sites have been carefully considered to represent the followingcharacteristics:
• Fresno First Street CORE site (FSF): This long-term site in aresidential/commercial area receives a broad mixture of neighborhood, urban, andregional scale PM2.5 contributions. Although it is near neighborhoods wherewood is burned during winter, it is not overly influenced by this local source.
• Bakersfield California Street CORE site (BAC): This site is also in aresidential/commercial area with a broad mixture of sources from various scalesthat is not overly influenced by microscale sources. Refineries and oilfieldoperations provide an increment of sulfur emissions from well-defined directionsthat are above those found at other CORE sites in the SJV.
• Sacramento Del Paso Street CORE site (SDP): This site is in aresidential/commercial area with mostly traffic-dominated emissions nearby.This site provides a contrast with the other two sites in the central and lower SanJoaquin Valley.
• San Jose-Fourth Street CORE site (SJ4): This site is in aresidential/commercial area with mostly traffic-dominated emissions nearby.Wood smoke has been found as a significant contributor during winter. This siterepresents the climate and source mix in the Bay Area Air Quality ManagementDistrict.
• Angiola intrabasin gradient site (ANGI): This new site is located in a non-urban setting to the SE of Corcoran but outside the influence of SR 99 and itspopulation centers. This site needs to be located in a large field with at least a 1km fetch in all directions and with low vegetation. It should have a highoccurrence of fogs during winter. According to landuse maps, a variety ofagricultural activities surround this area with cotton and alfalfa being thedominant crops, interspersed with dairies, feedlots, chicken coops, and orchards.Agricultural activity may occur in nearby fields during the fall. This site needs tobe well outside of airplane flight paths as it will host a 100 m scaffold tower. Thistower will acquire micrometeorological measurements all year and will permit
4-8
elevated measurements during winter to determine vertical fluxes between thesurface and valleywide layer during winter.
During summer an anchor site will be operated at:
• Edwards Air Force Base (EDW): This site on the base has long been used toevaluate light extinction and its chemical constituents. The only nearby sourcesare suspended desert dust and roadway emissions from lightly traveled pavedroads within the base.
During winter, the annual anchor sites will be enhanced by measurements at:
• Bethel Island interbasin transport site (BTI): This established air quality sitein the Sacramento Delta is in a transition zone between the Bay Area and SJV. Itis along the summertime transport pathway between the two basins, but duringwinter it experiences secondary nitrate concentrations that are more typical of theSJV than of other Bay Area PM monitoring sites. It is isolated from localsources, but is directly east of the Benicia/Martinez, Pittsburg, Antioch industrialcorridor where much of central California’s point source emissions are located.
• Sierra Foothills background site (SNFH): This site needs to be located east ofFresno at ~500 m above mean sea level. Candidate locations are the U.S. ForestService Station at Prather (~500 m MSL, N 37° 02’ 09”, W 119° 30’ 42”) andthe U.S. Forest Service heliport at Trimmer (~500 MSL, N 36° 55’ 14”, W 119°18’ 18”). These candidates are being tested during the winter of 1998-99 usingportable nephelometers at these elevations as well as sites with lower and higherelevation. These sites are along the potential transport pathways to the LowerKaweah site in Sequoia National Park that is known to receive substantialtransport from the SJV during non-winter months, but is unpolluted during winter.The site finally selected should have minimal terrain obstructions between theselected site and the valley.
• Pt. Arena background site (PARN): This site is intended to evaluate the timeresolution of materials transported into the study area. Pt. Arena is far enoughnorth of the Bay Area that large amount of urban emissions are not anticipated.Early measurements at Pt. Reyes, further to the south, showed evidence ofcontamination by urban emissions.
• Dublin interbasin transport site (DUB1): This site needs to be establishedduring the winter to evaluate the timing and magnitude of materials leaving theBay Area through the Livermore Valley en route to Altamont Pass.
• Walnut Grove interbasin transport and vertical gradient site (WAG andWAGT): This site will be established during winter to take advantage of theability to locate instruments at the base of and at an elevated point (200 to 300 magl) of the Walnut Grove tower. This site is located near the transition point
4-9
between the Sacramento and San Joaquin Valleys and will evaluate transportbetween these valleys as well as the vertical evolution of pollutant concentrations.
• Angiola vertical gradient site (ANGT): In addition to the ground-basedmeasurements acquired throughout the year, continuous measurements ofsecondary particles and their precursors will be made at the top (~100 m agl) ofthe Angiola tower during winter.
• Modesto-I Street CORE site (MIS): This is an additionalcommercial/residential site that will better characterize wintertime exposures inone of the larger metropolitan areas of the study region.
Anchor sites require substantial infrastructure to support the detailed, high timeresolution measurements to be acquired both throughout the year and during the intensivemonitoring campaigns.
Many of the satellite sites specified in Table 4.4-5 are intrabasin gradient monitors todetermine what happens between the backbone sites, especially between the major cities.The Bethel Island and Altamont Pass sites are intended to monitors transport between theBay area and the San Joaquin Valley. The Pacheco Pass site monitors transport between thenorth central coast and the SJV. The Tehachapi site monitors transport between the SJV andthe Mohave Desert. Transport can go in both directions, and these interbasin transport sitesare collocated with meteorological monitors. The source-oriented sites are intended to benear and downwind of source types identified in Section 2. Two urban source monitors aretargeted for residential areas near the anchor sites in Fresno and Bakersfield to determineincremental amounts of exposure that might be contributed by neighborhood-scalecontributions such as woodburning. The fall campaign will operate additional satellite sitesfor PM10 that are described in greater detail in Section 7.
4.5 Surface Meteorological Network
The existing meteorological network in central California is extensive, butuncoordinated among the different agencies. Figure 4.5-1 shows the locations of surfacemeteorological monitoring sites from the Air Resources Board (ARB), the Bay Area AirQuality Management District (BAAQMD), the National Oceanic and AtmosphericAdministration (NOAA), the California Irrigation Management Information Service(CIMIS), Interagency Monitoring of PROtected Visual Environments (IMPROVE), theNational Weather Service (NWS), Pacific Gas and Electric Company (PG&E), the U.S.Coast Guard, Remote Automated Weather Stations (RAWS) for firefighting, and a fewmiscellaneous monitors. CRPAQS surface stations are located on this map along transportpathways, at anchor sites, and at upper air measurement sites to supplement this network.
Figure 4.5-2 shows the surface meteorological observables measured at eachmonitoring location, regardless of the network from which they are derived. Wind speed anddirection, temperature, and relative humidity are the most common measurements. Thenetwork or surface pressure and solar radiation measurements is also extensive. Three sites
4-10
measure ultraviolet radiation in the Sacramento Valley, in the San Joaquin Valley, and alongthe south coast in Santa Barbara county.
The existing networks report hourly average wind speed and direction, temperature,relative humidity, solar radiation, and pressure measurements. The specific measurements ateach site and the networks they belong to are documented in Appendix C. Sites that reportedmeasurements on 12/31/96 are plotted in Figure 4.5-1, and the integrated network needs to bere-evaluated for data reported on 12/31/98, and again by 8/31/99 to determine that thesenetworks will be in operation over the 1999-2001 CRPAQS monitoring period.
Thuillier et al. (1994) document the methods used to acquire and report data in mostof these networks with their similarities and differences. Wind speed measurements are takenat heights ranging from 2 m to 10 m agl at most sites and temperatures are measured byaspirated and unaspirated thermometers. The major limitations of existing networkinstrumentation are: 1) wind thresholds of ~1 m/s for most instruments, which is adequate fornon-winter periods, but not for low winds in the surface layer during winter; 2) relativehumidity sensors that are inaccurate at high (<90%) humidities; and 3) insufficient temporalresolution (i.e. on the order of minutes) to detect wind gusts that might suspend dust.
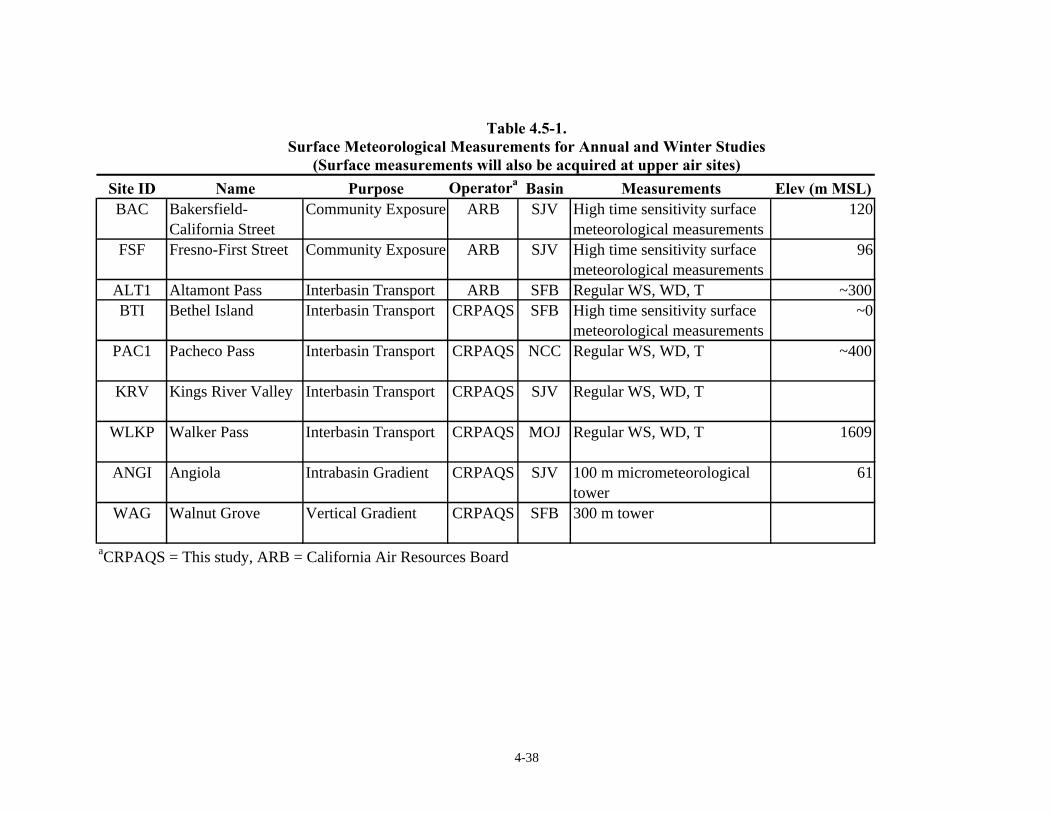
The existing meteorological network will be supplemented with the CRPAQS sitesshown in Figure 4.5-1 and described in Table 4.5-1. Ten meter meteorological towers ateach of these sites will be equipped with low threshold (~0.3 m/s) wind sensors and highsensitivity relative humidity sensors. Section 10 describes the monitors available for thesemeasurements. Five-minute average measurements will be acquired so that the data can beinterpreted with respect to wind gusts that might raise dust, short-term shifts and winddirection that might correspond to pulses measured by continuous particle monitors, andshort duration clouds and fogs that cause rapid changes in the 90% to 100% RH interval.With these supplemental measurements and surface measurements at the upper air sites, theexisting surface monitoring network provides adequate coverage for the central Californiastudy domain.
4.6 Upper Air Meteorological Network
Section 2 showed substantial decoupling between surface meteorological conditionsand those aloft for all but the afternoon periods. This situation occurs during both winter andnon-winter months. The decoupling endures for a larger number of hours per day duringwinter when days are shorter. Non-winter meteorology has been documented in several priorstudies, but little is known about conditions aloft during winter. As a result, the long-termupper air network will be supplemented with additional sites and special studies duringwinter.
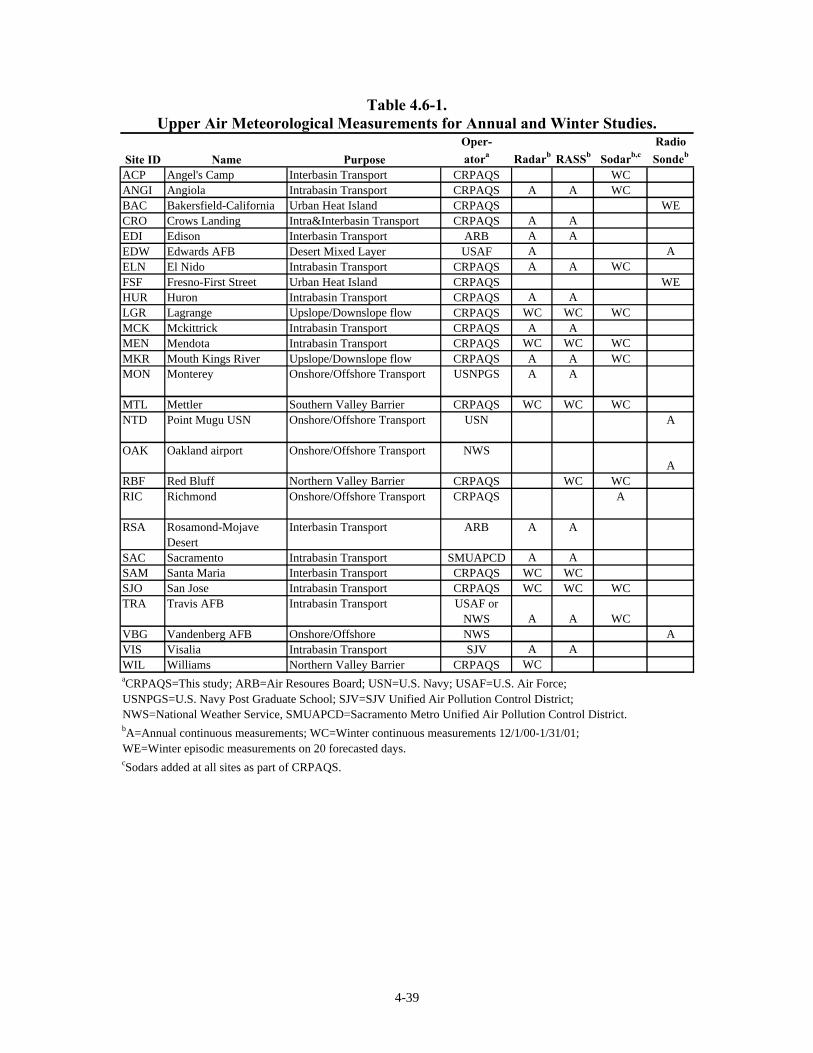
Figure 4.6-1 shows the locations of types of upper air meteorological monitors to bedeployed for the long-term campaign and Figure 4.6-2 shows how this network will beaugmented for the winter campaign. Table 4.6-1 describes the upper air sites, theirmeasurements and operators. Radar profilers, doppler sodars, and RASS are used at mostsites because they acquire hourly average wind speed, wind direction, and temperature byremote sensing without constant operator intervention. Sodars are collocated with profilers
4-11
at several locations because they provide greater vertical resolution in the first 100 m agl.This is especially important near terrain features and during winter. Radiosondes are neededto determine changes in relative humidity and to quantify conditions at elevations above~2000 m agl. They are also the only practical means of acquiring upper air measurements incities where the noise and siting requirements of remote sensing devices make them difficultto operate. NEXRAD radar sites are also located in Figures 6.5-1 and 6.5-2. While these areprimarily used to identify precipitating clouds, algorithms are being constructed to deduceupper air wind speeds and directions from their output. Relevant output from theseestablished sites will become part of the CRPAQS data base.
Several radar profilers are being installed to acquire a multi-year data base, and oneof the important functions of the CRPAQS supplements to this network is to relate theserelatively sparse measurements to the detailed meteorological patterns determined duringCRPAQS. The backbone profiler network includes Travis AFB, Visalia, Sacramento, andMonterrey. Profilers may become operational at Vandenberg and Edwards Air Force basesbefore the end of 1999. These profilers are operated by different entities, and equivalentmethods of data evaluation and reporting needs to be established among these entities prior toCRPAQS field campaigns.
Radiosondes are routinely launched through the year at 0400 and 1600 PST from theOakland, Vandenberg, Edwards, and Pt. Mugu. None of these locations are within thecentral valley, so these will be supplemented by lunches at Fresno and Bakersfield during the15 episodic days during winter. Figure 2.4-1 showed an information deficiency between1000 and 1600 PST when substantial vertical mixing is believed to occur. For the 15episodic days during winter, six radiosondes per day will be launched at 0400, 1000, 1200,1400, 1600, and 2200 PST at the Oakland and Edwards sites (supplementing the twice perday launches), and at the Fresno and Bakersfield sites.
4.7 Micrometeorological Towers
It is feasible and cost effective to construct and maintain a 100 m, walk-up, scaffoldtower at the Angiola site to support year-long micrometeorological measurements as well asother vertical experiments. For the long-term measurements, the tower will be instrumentedat five elevations with high precision anemometers, relative humidity, and temperaturemeasurements and will record five minute averages of wind speed, wind direction,temperature, and relative humidity as well as average cross-products in the vertical andhorizontal directions. These micrometeorological measurements will be used to create adiurnal and seasonal climatology for surface layer evolution, describe turbulent mixing anddispersion at the sub-grid scale level, and to determine micrometeorological conditions nearthe surface that affect suspension and deposition of dust, gases, and fine particles.
In addition to supporting continuous micrometeorological measurements, the talltower will provide a platform for measurements above the surface layer during nighttime andmorning periods during winter and to evaluate the injection heights and depositioncharacteristics of fugitive dust during fall. These uses include:

4-12
• Continuous measurements of black carbon, nitrate, nitric acid, ammonia andsulfate at the top level and surface to determine mixing and transportconcentrations above the surface layer only during the fall study and 20wintertime episode days.
• Fog water size and chemistry measurements at the top level to determinedifferences with elevation above ground level.
The Walnut Grove tower between Stockton and Sacramento will be instrumented in asimilar manner during the winter campaign to evaluate difference between the Sacramentoand San Joaquin Valleys.
4-13
Table 4.4-1.Air Resources Board PM2.5 Backbone Network (see Table 4.4-4 for codes).
SITEa NAMEAIR
BASIN PAMS NAMS SPM OBJ TYPE FREQ PM2.5 CPM2.5ALT Altamont Pass-Tracy SJV T S 1 in 3 X TBDATL Atascadero-Lewis Ave SCC M,HS C 1 in 6 XXBGS Bakersfield-1120 Golden State SJV NO2-O3-HCS-
CAR-METR,P C 1 in 3 XXS
BAC Bakersfield-5558 California Ave SJV M,HS C everyday XSBLIS1 D.L. Bliss State Park-TRPA LT B I 1 in 3 YBRV Elk Grove-Bruceville Rd SV T C 1 in 3 XBSE Bakersfield-Southeast SJV R C 1 in 3 XCCD Concord-2975 Treat Blvd SFB CO-NO2-O3-
PM10
R C everyday XS
CHM Chico-Manzanita Ave SV M C 1 in 6 XSCLO Clovis-908 N Villa Ave SJV NO2-O3-HCS-
CAR-METO3-PM10 R,P C 1 in 3 XS
COP Corcoran-Patterson Ave SJV M C 1 in 3 XSCSS Colusa-100 Sunrise Blvd SV R,T C 1 in 3 X
DOLA1b Dome Land Wilderness-USFS MC B I 1 in 3 Y
ELM El Rio-Mesa School #2 SCC R,P C 1 in 3 XSEU6 Eureka-Health Dept NC R C 1 in 6 XFCW Fremont-Chapel Way SFB CO-NO2-O3-
PM10
R C 1 in 3 X
FSE Fresno-Southeast SJV R C 1 in 3 X
FSF Fresno-3425 First Street SJV PM10 M C everyday XXS
GVL Grass Valley-Litton Building Site MC R,T C 1 in 6 X BAM or TEOM
HDB Healdsburg-Limeric Lane NC R C 1 in 6 XJAC Jackson-201 Clinton Road MC R C 1 in 3 XKCG Keeler-Cerro Gordo Road GBV R C 1 in 3 XXLCR Lancaster-W Pondera Street SED R,T,HS C 1 in 3 XSLKL Lakeport-Lakeport Blvd LC M C 1 in 6 X
4-14
Table 4.4-1.Air Resources Board PM2.5 Backbone Network (continued)
SITEa NAMEAIR
BASIN PAMS NAMS SPM OBJ TYPE FREQ PM2.5 CPM2.5LTY South Lake Tahoe-Sandy Way LT M C 1 in 6 XXSLVF Livermore Old First St SFB O3 M,T C everyday XS TEOM
requestedMAG Mammoth Lakes-Gateway HC GBV R C 1 in 3 XSMIS Modesto-1100 I Street SJV M,HS C 1 in 3 XSMOJ Mojave-923 Poole Street SED R,T C 1 in 3 XS BAM or
TEOMMRM Merced-Midtown SJV M C 1 in 3 XSNLT North Lake Tahoe-Near Tahoe City LT R C 1 in 6 X
PAG Point Arguello SCC B S 1 in 3 XPARN Point Arena NC B S 1 in 3 XPINN1 Pinnacles National Monument-NPS NCC B I 1 in 3 YPIR Piru-2 mi SW SCC R,T S 1 in 6 XPOL Portola MC M C 1 in 3 XSPORE1 Point Reyes National Seashore-NPS SFB B I 1 in 3 Y
QUC Quincy-267 North Church Street MC R C 1 in 3 XRDH Redding-Health Dept Roof SV R,T C 1 in 6 X
RED Redwood City SFB PM10 R C 1 in 3 X
RGI Ridgecrest-Las Flores Ave SED PM10 R,T C 1 in 3 X
ROS Roseville-151 N Sunrise Blvd SV R,T C 1 in 6 XSS13 Sacramento-1309 T Street SV M C everyday XSSAL Salinas NCC M C 1 in 3 XXSSBC Santa Barbara-3 W Carillo St SCC M,P C 1 in 6 XSSCQ Santa Cruz-2544 Soquel Dr NCC R C 1 in 3 XSDP Sacramento-Del Paso Manor SV NO2-O3-HCS-
CAR-METSO2-PM10 M,P C 1 in 3 XXS
SEQU1 Sequoia National Park-NPS MC B I 1 in 3 Y
4-15
Table 4.4-1.Air Resources Board PM2.5 Backbone Network (continued)
SITEa NAMEAIR
BASIN PAMS NAMS SPM OBJ TYPE FREQ PM2.5 CPM2.5SFA San Francisco-10 Arkansas St SFB NO2-PM10-Pb M C 1 in 3 XXS
SGS San Andreas-Gold Strike Road MC M,T C 1 in 6 XSJ4 San Jose-4th St SFB CO-NO2-PM10-
Pb
M C everyday XXS
SJT San Jose-528 Tully Road SFB PM10 M C everyday X
SLM San Luis Obispo-Marsh St SCC M C 1 in 6 X
SOH Stockton-Hazelton St SJV PM10 M,HS C 1 in 3 XS
SOLA1 South Lake Tahoe-TRPA LT B I 1 in 3 YSQV Squaw Valley-New site LT R C 1 in 3 XSRF Santa Rosa-837 Fifth St SFB M C 1 in 3 XSST Sacramento-Health Dept Stockton
BlvdSV PM10-Pb R C everyday X
STL Santa Maria-Library SCC R C 1 in 6 XTRU Truckee-Fire Station MC R C 1 in 3 XXSUKC Ukiah-County Library NC M C 1 in 6 XXSVCS Visalia-N Church Street SJV M,HS C 1 in 3 XSVIA Victorville-Armargosa Road SED M,T C 1 in 3 XXSVJO Vallejo-304 Tuolumne St SFB M,T C 1 in 3 XWLN Woodland SV R C 1 in 3 XYAS Yuba City-Almond Street SV R,T C 1 in 6 XXSYOSE1 Yosemite National Park-Turtleback
DomeMC B I 1 in 3 Y
YOY Yosemite National Park-Yosemite Village
MC M C 1 in 3 X
aColumn Headers are defined in Table 4.4-4bSeasonal operating period
4-16
Table 4.4-2.Surface Meteorological Measurements at Backbone Sites.
SITE NAME PM2.5
PM10
SSI Dichot
PM10
TEOM/BAM
PM10 Ion Analysis
PM10
CarbonTSP SO4 NO3 COH Neph CO NO2 O3 PB SO2
ADN Anderson-North Street X X XALT Altamont Pass-Tracy XAND Anderson Springs Mono-
chot analysis
only
K+ only
ARB Arbuckle-Hillsgate Road X XARR Arroyo Grande-Ralcoa Way X X X K+
onlyX
ATL Atascadero-Lewis Avenue XX X X X XBGS Bakersfield-1120 Golden State XXS X X X XBIM Bishop-North Main Street XBAC Bakersfield-5558 California Ave XS X (a) X (a) X X X X (a) X X (special
prj only)X X X XX X
BLIS1 D.L. Bliss State Park-TRPA Y YBRV Elk Grove-Bruceville Rd XBSE Bakersfield-Southeast XBSW Barstow X X no
K+, NH4X X X
BTI Bethel Island Road X X X X X XCCD Concord-2975 Treat Blvd XS X X X X X X X X X XCCY Crescent City-9th and H Streets XCHE Chester-1st Street XCHM Chico-Manzanita Ave XS X X X X X X X X XCJN Coso Junciton-10 miles E (facility site) XCLK China Lake-Powerline Road X XCLO Clovis-908 N Villa Ave XS X X X X X XCLV Cloverdale XCMV Carmel Valley-Ford Road X XCOP Corcoran-Patterson Ave (opened 10/96) XS X
opened 10/96
X opened
1/97
X opened 10/96
4-17
Table 4.4-2.Surface Meteorological Measurements at Backbone Sites (cont'd).
SITE NAME PM2.5
PM10
SSI Dichot
PM10
TEOM/BAM
PM10 Ion Analysis
PM10
CarbonTSP SO4 NO3 COH Neph CO NO2 O3 PB SO2
COS Coso Junction-HWY 396 rest area X X K+ onlyCOV Corcoran Van Dorsten Ave X (a) X XCSA Colusa-Fairgrounds (closed 10/96) X
closed 10/96
X closed 10/96
X closed 10/96
CSS Colusa-100 Sunrise Blvd X X X opened 6/96
X X X opened
6/96
X opened 6/96
X
DOLA1 Dome Land Wilderness-USFS YDVP Davenport X X X X X XDVS Davis-UCD Campus X X X X XECP El Capitan Beach X (a) X X XELM El Rio-Mesa School #2 XS X X X X X XEU6 Eureka-Health Department 6th and I Street X XFCW Fremont-Chapel Way X X X X X X X X X XFSD Fresno-Drummond X X X XFSE Fresno-Southeast XFSF Fresno-3425 First Street XXS X X (a) X X X X X X X XFTB Fort Bragg-North Franklin Street XGFS Truckee-Glenshire Fire Station XGLH Glenbrook-High Valley Road Mono-
chot analysis
only
K+ only
GRI Gridley-Cowee Road X XGUE Guerneville-Church & 1st XGVC Gaviota-GTC Site C X (a) X X XGVE Gaviota-East X X X XGVH Grass Valley-Henderson Street XGVL Grass Valley-Litton Building Site X X XGVW Gaviota-West X X X X
4-18
Table 4.4-2.Surface Meteorological Measurements at Backbone Sites (cont'd).
SITE NAME PM2.5
PM10
SSI Dichot
PM10
TEOM/BAM
PM10 Ion Analysis
PM10
CarbonTSP SO4 NO3 COH Neph CO NO2 O3 PB SO2
HDB Healdsburg-Limeric Lane X X TEOMHES Hesperia-Olive Street X X no
K+, NH4X X X X
HIR Hanford-South Irwin Street X X X XHST Hollister-Fairview Road X XIYA Inyokern-Airport (close 6/96) X
closed 6/96
JAC Jackson-201 Clinton Road X X XKCC Kettkeman City-CalTrans (closed 9/96) X
closed 9/96
X closed 9/96
KCG Keeler-Cerro Gordo Road XX X X TEOM K+ onlyKCM King City-Metz Road X XLCR Lancaster-W Pondera Street XSLEE Lee Vining-SMS XLF1 Las Flores Canyon #1 XLF2 Las Flores Canyon #2 XLKL Lakeport-Lakeport Blvd X X X X XLOM Lompoc-South H Street X X X X XLOY Loyalton-West 3rd Street XLPE Lone Pine-East Locust Street X XLTS South Lake Tahoe-Stateline X X XLTY South Lake Tahoe-Sandy Way XXS X X X XLUC Lucerne Valley-Middle School X X no
K+, NH4
LVF Livermore Old First St XS X X X X X XLWP Lancaster-West Pondera Street X X X no
K+, NH4X X X
M14 Modesto-814 14th Street X X X X X XMAG Mammoth Lakes-Gateway HC XS X TEOM X X X
4-19
Table 4.4-2.Surface Meteorological Measurements at Backbone Sites (cont'd).
SITE NAME PM2.5
PM10
SSI Dichot
PM10
TEOM/BAM
PM10 Ion Analysis
PM10
CarbonTSP SO4 NO3 COH Neph CO NO2 O3 PB SO2
MBY Morro Bay XMER Merced-Health Dept (closed 9/96) X
closed 9/96
X closed 9/96
MIS Modesto-1100 I Street XS X X X X XMLB Madera-Library (closed 9/96) X
closed 9/96
X closed 9/96
X closed 9/96
MLK Mono Lake-Simis Residence XMOJ Mojave-923 Poole Street XSMON Monterey-Silver Cloud Court X XMOP Mojave-Poole Street X X X XMRM Merced-Midtown XSNGR Nipomo-Guadalupe Road X (a) X XNIP Nipomo-South Wilson Street (closed 9/96) X
closed 9/96
NJS Napa-Jefferson Ave X X X X X XNLT North Lake Tahoe (Near Tahoe City) XNWH Santa Clarita-County Fire Station X X no
K+, NH4X X
OLD Oildale-Manor Street X X X X X X X XOLW Olancha-Walker Creek X XPAG Point Arguello XPARN Point Arena XPBG Pittsburg-10th Street X (a) X (a) X (a) X X X XX XPCN Point Conception-Lighthouse X (a) X X XPGN Placerville-Gold Nugget Way X X XPGV Pleasant Grove-4 miles SW X X XPINN1 Pinnacles National Monument-NPS Y YPIR Piru-2 mi SW X X X
4-20
Table 4.4-2.Surface Meteorological Measurements at Backbone Sites (cont'd).
SITE NAME PM2.5
PM10
SSI Dichot
PM10
TEOM/BAM
PM10 Ion Analysis
PM10
CarbonTSP SO4 NO3 COH Neph CO NO2 O3 PB SO2
POL Portola XS X XPORE1 Point Reyes National Seashore-NPS Y YPRF Paso Robles-Santa Fe Avenue X X XQUC Quincy-267 North Church Street X X X* X XRBL Red Bluff-Messer Drive X X XRDH Redding-Health Dept Roof X X X X XRED Redwood City X X X X X X XRGI Ridgecrest-Las Flores Ave X X
closed 6/96
RIC Richmond-13th Street X X X X X X X XX XROC Rocklin-Rocklin Road X X X XROS Roseville-151 N Sunrise Blvd XS X X X X X X X X XS13 Sacramento-1309 T Street XS X X X X X X X X X XSAL Salinas XXSSAR Sacramento-Airport Road (opened 8/97) X
opened 8/97
X opened 8/97
SBC Santa Barbara-3 W Carillo St XS X X X X X X XSBR Sacramento-Branch Center XSBU Exxon Site 10-UCSB West Campus X (a) X X XSCB Santa Cruz-Bostwick Lane XSCQ Santa Cruz-2544 Soquel Dr X XSDP Sacramento-Del Paso Manor XXS X X X X X XSED Sacramento-Earhart Drive (closed 8/97) X
closed 8/97
X closed 8/97
X X X
SEH San Leandro-County Hospital X X XSEQU1 Sequoia National Park-NPS Y Y XSFA San Francisco-10 Arkansas St XXS X X X X X X X X XX XSGS San Andreas-Gold Strike Road X X X XSIM Simi Valley-Cochran Street X X X X X X X
4-21
Table 4.4-2.Surface Meteorological Measurements at Backbone Sites (cont'd).
SITE NAME PM2.5
PM10
SSI Dichot
PM10
TEOM/BAM
PM10 Ion Analysis
PM10
CarbonTSP SO4 NO3 COH Neph CO NO2 O3 PB SO2
SJ4 San Jose-4th St XXS X X X X X X X XX X X XXSJD San Jose-Piedmont Road X XSJK San Jose-Moorpark Avenue X X X X X XSJT San Jose-528 Tully Road X X XSL2 Salinas No. 2-Natividad Road X X X XSLM San Luis Obispo-Marsh St X X X X X X XSML Stockton-March Lane (open by 6/98) X
open by 6/98
X open by 6/98
SMY Santa Maria-Broadway X X X X XSNH North Highlands-Blackfoot Way X X X X XSOH Stockton-Hazelton St XS X X X X X X X X X X XXSOLA1 South Lake Tahoe-TRPA Y YSQV Squaw Valley-New site XSRF Santa Rosa-837 Fifth St X X X X X X XSRL San Rafael X X X X XSST Sacramento-Health Dept Stockton Blvd X X X X XSTL Santa Maria-Library X X XSWH Stockton-Wagner/Holt School X XTAC Taft College X (a) X X XTHM Thousand Oaks-Moorpark Road X X XTNP Twentynine Palms-6136 Adobe Rd X X no
K+, NH4X X X X
TRL Trona-Athol X X no K+, NH4
X X X X X X
TRU Truckee-Fire Station XXS X TEOM XTSM Turlock-900 South Minaret Street X X X XUKC Ukiah-County Library XXS XVAC Vacaville-Marchant XVAF Vandenberg AFB-Watt Rd (closed 2/97) X
closed 2/97
X X X X
4-22
Table 4.4-2.Surface Meteorological Measurements at Backbone Sites (cont'd).
SITE NAME PM2.5
PM10
SSI Dichot
PM10
TEOM/BAM
PM10 Ion Analysis
PM10
CarbonTSP SO4 NO3 COH Neph CO NO2 O3 PB SO2
VBS Vandenberg AFB-STS Power Plant X (a) X X X XVCS Visalia-N Church Street XS X (a) X X X X X XVEN Ventura County-East Main Street (closed
12/96)X
closed 12/96
VIA Victorville-Armargosa Road XXS X X X no K+, NH4
X X X X
VJO Vallejo-304 Tuolumne St X X X X X X XVTA Ventura County-West Casitas Pass X X XWAA Watsonville-Airport Blvd X XWEV Weaverville-Courthouse XWLA Woodland-unknown location (opened 7/97) X
opened 7/97
WLF Willits-Firehouse XWLN Woodland X X
opened 7/97WLW Willows-East Laurel Ave X X X X X X X
WSA West Sacramento-15th Street XWSS Woodland-40 Sutter Street X X
closed 7/97 X
YAS Yuba City-Almond Street XXS X X X X X X X XYOSE1 Yosemite National Park-Turtleback Dome Y YYOY Yosemite National Park-Yosemite Village X X X X
4-23
Table 4.4-3.Collocated Air Quality Measurements at Backbone Sites.
SITE NAMENEW MET WS WD VWS AT TD RH SOL UV PR
ADN Anderson-North StreetALT Altamont Pass-Tracy X A A X XAND Anderson Springs A A X XARB Arbuckle-Hillsgate Road R R XARR Arroyo Grande-Ralcoa Way R RATL Atascadero-Lewis Avenue R R X X
closed 3/97
BGS Bakersfield-1120 Golden State A A X X X XBIN Bishop-North Main Street A,R A X XBAC Bakersfield-5558 California AveBLIS1 D.L. Bliss State Park-TRPABRV Elk Grove-Bruceville Rd XBSE Bakersfield-SoutheastBSW Barstow A A XBTI Bethel Island RoadCCD Concord-2975 Treat BlvdCCY Crescent City-9th and H StreetsCHE Chester-1st StreetCHM Chico-Manzanita Ave R R X XCJN Coso Junciton-10 miles E (facility site)CLK China Lake-Powerline RoadCLO Clovis-908 N Villa Ave A A X X X XCLV CloverdaleCMV Carmel Valley-Ford RoadCOP Corcoran-Patterson Ave R
opened 10/96
R opened 10/96
X opened 10/96
4-24
Table 4.4-3.Collocated Air Quality Measurements at Backbone Sites (cont'd).
SITE NAMENEW MET WS WD VWS AT TD RH SOL UV PR
COS Coso Junction-HWY 396 rest areaCOV Corcoran Van Dorsten AveCSA Colusa-Fairgrounds (closed 10/96) R closed
10/96R closed
10/96X closed
10/96
CSS Colusa-100 Sunrise Blvd R opened
6/96
R opened
6/96
X opened 6/96
DOLA1 Dome Land Wilderness-USFSDVP DavenportDVS Davis-UCD Campus R R XECP El Capitan Beach A,R A,R X XELM El Rio-Mesa School #2 A,R A,R X X XEU6 Eureka-Health Department 6th and I StreetFCW Fremont-Chapel WayFSD Fresno-DrummondFSE Fresno-SoutheastFSF Fresno-3425 First Street R R XFTB Fort Bragg-North Franklin StreetGFS Truckee-Glenshire Fire StationGLH Glenbrook-High Valley Road A A X XGRI Gridley-Cowee Road R R X XGUE Guerneville-Church & 1stGVC Gaviota-GTC Site C A,R A,R X XGVE Gaviota-East A,R A,R X XGVH Grass Valley-Henderson StreetGVL Grass Valley-Litton Building SiteGVW Gaviota-West A,R A,R X XHDB Healdsburg-Limeric LaneHES Hesperia-Olive Street A A X
4-25
Table 4.4-3.Collocated Air Quality Measurements at Backbone Sites (cont'd).
SITE NAMENEW MET WS WD VWS AT TD RH SOL UV PR
HIR Hanford-South Irwin Street A opened
6/98
A opened
6/98
X opened 6/98
HST Hollister-Fairview Road A,R A,R XIYA Inyokern-Airport (close 6/96)JAC Jackson-201 Clinton RoadKCC Kettkeman City-CalTrans (closed 9/96)KCG Keeler-Cerro Gordo Road A,R A XKCM King City-Metz Road R R XLCR Lancaster-W Pondera StreetLEE Lee Vining-SMS A,R A XLF1 Las Flores Canyon #1 A,R A,R XLF2 Las Flores Canyon #2 A,R A,R XLKL Lakeport-Lakeport Blvd R R XLOM Lompoc-South H Street A,R A,R XLOY Loyalton-West 3rd StreetLPE Lone Pine-East Locust StreetLTS South Lake Tahoe-StatelineLTY South Lake Tahoe-Sandy Way R R X XLUC Lucerne Valley-Middle SchoolLVF Livermore Old First StLWP Lancaster-West Pondera Street A,R A,RM14 Modesto-814 14th StreetMAG Mammoth Lakes-Gateway HC A,R A XMBY Morro Bay R RMER Merced-Health Dept (closed 9/96)MIS Modesto-1100 I Street R R XMLB Madera-Library (closed 9/96)
4-26
Table 4.4-3.Collocated Air Quality Measurements at Backbone Sites (cont'd).
SITE NAMENEW MET WS WD VWS AT TD RH SOL UV PR
MLK Mono Lake-Simis Residence A,R A XMOJ Mojave-923 Poole StreetMON Monterey-Silver Cloud CourtMOP Mojave-Poole Street R R XMRM Merced-MidtownNGR Nipomo-Guadalupe Road R R XNIP Nipomo-South Wilson Street (closed 9/96)
R closed 9/96
R closed 9/96
X closed 9/96
NJS Napa-Jefferson AveNLT North Lake Tahoe (Near Tahoe City)NWH Santa Clarita-County Fire Station A,R A,ROLD Oildale-Manor Street R R XOLW Olancha-Walker Creek A,R A X X XPAG Point Arguello X A A A APARN Point Arena X A A A APBG Pittsburg-10th StreetPCN Point Conception-Lighthouse A,R A,R X XPGN Placerville-Gold Nugget Way R R XPGV Pleasant Grove-4 miles SW R R X XPINN1 Pinnacles National Monument-NPSPIR Piru-2 mi SW A,R A,R X X XPOL PortolaPORE1 Point Reyes National Seashore-NPSPRF Paso Robles-Santa Fe Avenue R R XQUC Quincy-267 North Church StreetRBL Red Bluff-Messer DriveRDH Redding-Health Dept Roof
4-27
Table 4.4-3.Collocated Air Quality Measurements at Backbone Sites (cont'd).
SITE NAMENEW MET WS WD VWS AT TD RH SOL UV PR
RED Redwood CityRGI Ridgecrest-Las Flores AveRIC Richmond-13th StreetROC Rocklin-Rocklin Road R RROS Roseville-151 N Sunrise Blvd R R X XS13 Sacramento-1309 T Street R R X X XSAL SalinasSAR Sacramento-Airport Road (opened 8/97) R
opened 6/97
R opened
6/97
X opened 6/97
X opened 6/97
X opened
6/97
SBC Santa Barbara-3 W Carillo St R R XSBR Sacramento-Branch CenterSBU Exxon Site 10-UCSB West Campus A,R A,R X XSCB Santa Cruz-Bostwick LaneSCQ Santa Cruz-2544 Soquel DrSDP Sacramento-Del Paso Manor R R X X X X
closed 6/97
SED Sacramento-Earhart Drive (closed 8/97) R closed 5/97
R closed 5/97
X closed 5/97
X closed 5/97
SEH San Leandro-County HospitalSEQU1 Sequoia National Park-NPSSFA San Francisco-10 Arkansas StSGS San Andreas-Gold Strike Road R R XSIM Simi Valley-Cochran Street A,R A,R X X X XSJ4 San Jose-4th StSJD San Jose-Piedmont RoadSJK San Jose-Moorpark AvenueSJT San Jose-528 Tully RoadSL2 Salinas No. 2-Natividad RoadSLM San Luis Obispo-Marsh St R R XSML Stockton-March Lane (open by 6/98)
4-28
Table 4.4-3.Collocated Air Quality Measurements at Backbone Sites (cont'd).
SITE NAMENEW MET WS WD VWS AT TD RH SOL UV PR
SMY Santa Maria-Broadway R R XSNH North Highlands-Blackfoot WaySOH Stockton-Hazelton St R R X XSOLA1 South Lake Tahoe-TRPASQV Squaw Valley-New siteSRF Santa Rosa-837 Fifth StSRL San RafaelSST Sacramento-Health Dept Stockton BlvdSTL Santa Maria-LibrarySWH Stockton-Wagner/Holt SchoolTAC Taft CollegeTHM Thousand Oaks-Moorpark Road A,R A,R X X XTNP Twentynine Palms-6136 Adobe Rd A A X XTRL Trona-Athol A A X XTRU Truckee-Fire StationTSM Turlock-900 South Minaret Street A AUKC Ukiah-County LibraryVAC Vacaville-MarchantVAF Vandenberg AFB-Watt Rd (closed 2/97) A,R
closed 2/97
A,R closed 2/97
X closed 2/97
X closed 2/97
VBS Vandenberg AFB-STS Power Plant A,R A,R X XVCS Visalia-N Church Street R R XVEN Ventura County-East Main Street (closed 12/96)
VIA Victorville-Armargosa Road A A X XVJO Vallejo-304 Tuolumne StVTA Ventura County-West Casitas Pass R R XWAA Watsonville-Airport Blvd
4-29
Table 4.4-3.Collocated Air Quality Measurements at Backbone Sites (cont'd).
SITE NAMENEW MET WS WD VWS AT TD RH SOL UV PR
WEV Weaverville-CourthouseWLA Woodland-unknown location (opened 7/97) R
opened 7/97
R opened
7/97
WLF Willits-FirehouseWLN Woodland R
opened 7/97
R opened
7/97
WLW Willows-East Laurel Ave R R X XWSA West Sacramento-15th StreetWSS Woodland-40 Sutter StreetYAS Yuba City-Almond Street R R XYOSE1 Yosemite National Park-Turtleback Dome X XYOY Yosemite National Park-Yosemite Village
4-30
Table 4.4-4.Column Heading Definitions.
Variable DefinitionSITE Site codeNAME Site name/addressAIR BASIN Air basin namePAMS Photochemical Assessment Monitoring Site measurementsNAMS National Ambient Monitoring Site measurementsSPM Special Purpose MonitoringOBJ PM2.5 Site objective:
R = represent high concentrations in a populated area, M = Determine the highest concentration expected to occur in the area covered by the network (more than one site per area may be needed), T = Determine the extent of regional pollutant transport, P = Monitoring at PAMS areas, HS = To support special health studies, B = Background
TYPE PM2.5 Site type: C = Core SLAMS, S = non-core SLAMS, P = Special Purpose Monitors, I = IMPROVE
FREQ Measurement collection frequency
CPM2.5 Proposed continuous PM2.5 mass measurement site
PM2.5 Proposed PM2.5 measurement (X = FRM PM2.5 monitor, XX = collocated FRMs, S = mass and speciation, Y=IMPROVE sampler)
PM10 SSI Existing collocated PM10 high volume size selective inlet sampler
Dichot Existing collocated PM fine (PM2.5) and coarse (PM2.5-PM10) dichotmous sampler
PM10
TEOM/BAMExisting collocated hourly TEOM or BAM sampler
PM10 Ion Analysis
Existing ion analysis (sulfate, nitrate, chloride, ammonium and potassium) performed on PM10 SSI samples
PM10 Carbon Existing total carbon analysis on PM10 SSI samples
TSP Existing TSP samplerSO4 Existing TSP samples that are analyzed for the sulfates fractionNO3 Exiting TSP samples that are analyzed for the nitrates fractionCOH Existing AISI tape sampler for soiling index (Coefficient of Haze)Neph Existing Light scatter (nephelometer) measurementsCO Existing carbon monoxide measurementNO2 Existing nitrogen dioxide measurementO3 Existing ozone measurementPB Existing lead measurementSO2 Existing sulfur dioxide measurementNEW MET Indicates proposed meteorological sensors installed at that siteWS Existing wind speed measurement at that site. A = arithmetic averaged values,
R = resultant valuesWD Existing wind direction measurement at that site. A = arithmetic averaged
values, R = resultant valuesVWS Existing vector wind speed measurement at that site. A = arithmetic averaged
values, R = resultant valuesAT Existing ambient temperature at that siteTD Exisitng dew point temperature at that siteRH Existing relative humidity at that siteSOL Existing solar radiation at that siteUV Existing ultraviolet solar radiation at that sitePR Existing surface pressure at that site
4-31
Table 4.4-5.CRPAQS PM2.5 Measurement Sites and Purposes.
Site ID Name Annualc Winter or Summer Additionsd Fall Additionse Purpose StatusfElevation (m MSL)
ACP Angels Camp Sat-ABC Sat-15 Ep Days Intrabasin Gradient New 475AGBR Agricultural fields, with
emphasis on burningSat-ABCD Sat-15 Ep Days Source, Agdust/Burning New ~100
ALT Altamont Pass-Tracy Bac-E (3rd day) Bac-15 Ep Days Intrabasin Gradient New ~300ALT1 Altamont Pass Sat-AB Sat-15 Ep Days Interbasin Transport New ~300ANGI Angiola-ground level Anc-AGHIJKLMNOP
Sat-DAnc-QRSTUVWXZabe Intrabasin Gradient
Vertical GradientVisibility
New 100
ANGI1 Angiola-2 m agl Anc-I Vertical Gradient New 102
ANGI2 Angiola-10 m agl Anc-I Vertical Gradient New 110
ANGI3 Angiola-25 m agl Anc-I Vertical Gradient New 125
ANGI4 Angiola-50 m agl Anc-I Vertical Gradient New 150
ANGIT Angiola-100 m agl Anc-I Anc-AGQRST Vertical Gradient New 200
ATL Atascadero-Lewis Avenue Bac-E(6th day) Community Exposure Exist 262BAC Bakersfield-5558 California
StreetAnc-AGHIJKLMNOP
Bac-E(everyday)FSat-D
Anc-QRSTUVWXYe Community ExposureVisibility
ARB 120
BARS Barstow Sat-A Visibility 692BGS Bakersfield-1120 Golden State Bac-E(3rd day)F
Sat-fgh(6th day lag)Bac-15 Ep Days Community Exposure Exist 123
BLIS1 D.L. Bliss State Park Bac-F(3rd day)i Visibility TRPA 2042BQUC Bouquet Canyon Sat-A (summer) Interbasin Transport
VisibilityNew ~1000
BRES Residential area near BAC, with woodburning
Sat-ABC Sat-15 Ep Days Source, woodburning New ~100
BRV Bruceville-Elk Grove Bac-E(3rd day) Bac-15 Ep Days Community Exposure Exist 6BSE Bakersfield (Southeast) Bac-E(3rd day) Bac-15 Ep Days Source New ~120BTI Bethel Island Sat-ABCD Anc-GHIJKLMNOPQRSTUVWX Interbasin Transport BAAQMD 0
C05 Corcoran-Pickrell Sat-f Source IMS-95 61C06 Corcoran-Yoder Sat-f Source IMS-95 61
C07 Corcoran-Newark Sat-fgh* Receptor IMS-95 60C08 Corcoran-Josephine Sat-f Receptor IMS-95 61
C09 Corcoran-Canal Sat-fgh* Receptor IMS-95 56
C10 Corcoran-Jepsen Sat-fgh* Receptor IMS-95 61C12 Corcoran-King Sat-f Source IMS-95 61
4-32
Table 4.4-5.CRPAQS PM2.5 Measurement Sites and Purposes (cont'd).
Site ID Name Annualc Winter or Summer Additionsd Fall Additionse Purpose StatusfElevation (m MSL)
C15 Corcoran-Pueblo Sat-fgh* Source IMS-95 57C16 Corcoran-Bainum Sat-f Source IMS-95 61
C17 Corcoran-Miller Sat-fgh* Receptor IMS-95 59CAJP Cajon Pass Sat-A (summer) Interbasin Transport
VisibilityNew ~1200
CANT Cantil Sat-A (summer) Intrabasin GradientVisibility
New ~500
CARP Carrizo Plain Sat-AB Sat-15 Ep Days Intrabasin GradientVisibility
New ~600
CCD Concord-2975 Treat Blvd Bac-E(everyday)F Bac-15 Ep Days Source Exist 26CF01 Corcoran-fall saturation #1 Sat-f Receptor New 60CF02 Corcoran-fall saturation #2 Sat-f Receptor New 59CF03 Corcoran-fall saturation #3 Sat-f Receptor New 56CF05 Corcoran-fall saturation #5 Sat-f Receptor New 61CF06 Corcoran-fall saturation #6 Sat-f Receptor New 61CF07 Corcoran-fall saturation #7 Sat-f Receptor New 61CF08 Corcoran-fall saturation #8 Sat-f Receptor New 61CF09 Corcoran-fall saturation #9 Sat-f Receptor New 61
CF10 Corcoran-fall saturation #10 Sat-f Receptor New 61CF11 Corcoran-fall saturation #11 Sat-f Receptor New 61CF12 Corcoran-fall saturation #12 Sat-f Receptor New 61CF13 Corcoran-fall saturation #13 Sat-f Receptor New 61CF16 Corcoran-fall saturation #16 Sat-f Receptor New 61CF17 Corcoran-fall saturation #17 Sat-f Receptor New 60CF18 Corcoran-fall saturation #18 Sat-f Receptor New 61CF19 Corcoran-fall saturation #19 Sat-f Receptor New 61CF20 Corcoran-fall saturation #20 Sat-f Receptor New 61CF21 Corcoran-fall saturation #21 Sat-f Receptor New 61CF22 Corcoran-fall saturation #22 Sat-f Receptor New 61CF24 Corcoran-fall saturation #24 Sat-f Receptor New 61CF25 Corcoran-fall saturation #25 Sat-f Receptor New 60CF26 Corcoran-fall saturation #26 Sat-f Receptor New 61CF29 Corcoran-fall saturation #29 Sat-f Receptor New 61CF30 Corcoran-fall saturation #30 Sat-f Receptor New 61CHL China Lake Sat-A Visibility VIS 697CHM Chico-Manzanita Avenue Bac-E(6th day)F Bac-15 Ep Days Community Exposure Exist 61CLO Clovis-908 N Villa Avenue Bac-E(3rd day)F Bac-15 Ep Days Source Exist 86COA Coalinga Sat-A Sat-15 Ep Days Intrabasin Gradient IMS-95 ~200
4-33
Table 4.4-5.CRPAQS PM2.5 Measurement Sites and Purposes (cont'd).
Site ID Name Annualc Winter or Summer Additionsd Fall Additionse Purpose StatusfElevation (m MSL)
COP Corcoran-Patterson Avenue Bac-E(3rd day)FSat-fgh(6th day lag)
Sat-D
Bac-15 Ep Days Community Exposure Exist ~60
COV Corcoran-1000 Van Dorsten Sat-f Receptor IMS-95 61CRD Crows Landing Sat-A Sat-15 Ep Days Intrabasin Gradient VAQS,
AUSPEX~100
CSS Colusa-100 Sunrise Blvd Bac-E(3rd day) Bac-15 Ep Days Intrabasin Gradient Exist 17DOLA1 Dome Land Wilderness Bac-F(3rd day) Background Visibility USFS 897DUB1 Dublin Sat-A Anc-BCGQRS Intrabasin Gradient New ~50EDI Edison Sat-AB Sat-15 Ep Days Intrabasin Gradient AUSPEX ~100
EDW Edwards Air Force Base Sat-ABCD Anc-GJK (summer only) Intrabasin GradientVisibility
VIS ~730
ELM El Rio-Mesa School #2 Bac-E(3rd day)F Intrabasin Gradient Exist 34FCW Fremont-Chapel Way Bac-E(3rd day) Bac-15 Ep Days Source Exist 18FEDL Feedlot or Dairy Sat-ABCD Sat-15 Ep Days Source, Animals New ~100FEL Fellows Sat-ABCD Sat-15 Ep Days Source, Oilfields VAQS ~140
FELF Foothills above Fellows Sat-ABC Sat-15 Ep Days Intrabasin Gradient New ~900FRER Fresno (south Fresno gradient
site)Sat-ABC Sat-15 Ep Days Intrabasin Gradient New ~100
FRES Residential area near FSF, with woodburning
Sat-ABCD Sat-15 Ep Days Source, woodburning New ~100
FSD Fresno Drummond Sat-fgh(6th day lag) Community Exposure Exist ~100FSE Fresno (Southeast) Bac-E(3rd day) Bac-15 Ep Days Source New ~96FSF Fresno-3425 First Street Anc-AGHIJKLMNOP
Bac-E(everyday)FSat-D
Anc-QRSTcd Community ExposureVisibility
ARB 96
GVL Grass Valley-Litton Building Site
Bac-E(6th day) Community Exposure Exist 853
HAN Hanford-Irwin St. Sat-fgh(6th day lag) Community Exposure Exist ~60HDB Healdsburg-Limeric Lane Bac-E(6th day) Source New 31
HELM Helm-Central Fresno County Sat-ABC Sat-15 Ep Days Intrabasin Gradient New ~56
JAC Jackson-201 Clinton Road Bac-E(3rd day) Intrabasin Gradient Exist 377KCG Keeler-Cerro Gordo Road Bac-E(3rd day) Source Exist 1097KCW Kettleman City Sat-AB Sat-15 Ep Days Intrabasin Gradient New 30KRV Sierra Nevada Foothills-Kings
River ValleySat-A Sat-15 Ep Days Interbasin Transport New ~500
4-34
Table 4.4-5.CRPAQS PM2.5 Measurement Sites and Purposes (cont'd).
Site ID Name Annualc Winter or Summer Additionsd Fall Additionse Purpose StatusfElevation (m MSL)
KWF Kern Wildlife Sat-ABCD Sat-15 Ep Days Intrabasin Gradient VAQS, AUSPEX
~100
LCR Lancaster-West Pondera Street Bac-E(3rd day)F Community Exposure Exist 709
LKL Lakeport-Lakeport Blvd Bac-E(6th day) Intrabasin Gradient Exist 405LTY South Lake Tahoe-3337 Sandy
WayBac-E(6th day)F Source Exist ~1900
LVF Livermore Old First Street Bac-E(everyday)FSat-D
Bac-15 Ep Days Interbasin Transport Exist 146
M14 Modesto-14th Street Sat-fgh(6th day lag) Community Exposure Exist ~30MAG Mammoth Lakes-Gateway HC Bac-E(3rd day)F Source Exist 2396
MIS Modesto-1100 I Street Bac-E(3rd day)FSat-D
Anc-AGQRSBac-15 Ep Days
Community Exposure Exist 27
MOJ Mojave-923 Poole Street Bac-E(3rd day)F Community Exposure Exist 841MRM Merced-Midtown Bac-E(3rd day)F Bac-15 Ep Days Community Exposure New ~50NLT North Lake Tahoe (near Tahoe
City)Bac-E(6th day) Source Exist ~1915
OLD Oildale-Manor Sat-fgh(6th day lag) Community Exposure Exist ~40
OLW Olancha Sat-ABCDU Sat-15 Ep Days BackgroundVisibility
New 1100
PAC1 Pacheco Pass Sat-AB Sat-15 Ep Days Interbasin Transport New ~400PAG Point Arguello Bac-E(3rd day) Background New ~10
PARN Point Arena Bac-E(3rd day)FSat-U
Anc-AGQRSBac-15 Ep Days
Background Exist ~60
PINN1 Pinnacles National Monument Bac-F(3rd day)i Background Visibility NPS 317
PIR Piru-2 mi SW Bac-E(6th day) Intrabasin Gradient Exist 182
PLE Pleasant Grove (north of Sacramento)
Sat-ABC Sat-15 Ep Days Intrabasin Gradient New ~100
POL Portola Bac-E(3rd day)F Intrabasin Gradient Exist ~1480PORE1 Point Reyes National Seashore Bac-F(3rd day)i Background Visibility NPS 38
RED Redwood City Bac-E(3rd day) Bac-15 Ep Days Source Exist 5RGI Ridgecrest-Las Flores Avenue Bac-E(3rd day)
Sat-DCommunity Exposure Exist
(CRPAQS upgrade to
speciation site)
723
4-35
Table 4.4-5.CRPAQS PM2.5 Measurement Sites and Purposes (cont'd).
Site ID Name Annualc Winter or Summer Additionsd Fall Additionse Purpose StatusfElevation (m MSL)
ROS Roseville-151 North Sunrise Blvd
Bac-E(6th day)F Bac-15 Ep Days Intrabasin Gradient Exist 161
S13 Sacramento-1309 T Street Bac-E(everyday)FSat-D
Bac-15 Ep Days Community Exposure Exist 7
SAL Salinas Bac-E(3rd day)F Bac-15 Ep Days Source New ~13SBC Santa Barbara-3 West Carillo
StreetBac-E(6th day)F Community Exposure Exist 16
SCQ Santa Cruz-2544 Soquel Drive Bac-E(3rd day) Bac-15 Ep Days Community Exposure Exist 78
SDP Sacramento-Del Paso Manor Anc-AGBac-E(3rd day)F
Sat-D
Anc-QRSBac-15 Ep Days
Community Exposure Exist (Anchor operated by SCAPCD)
25
SEQU1 Sequoia National Park Bac-F(3rd day)i Background Visibility NPS 549SFA San Francisco-10 Arkansas
StreetBac-E(3rd day)F Bac-15 Ep Days Source Exist 5
SGS San Andreas-Gold Strike Road Bac-E(6th day) Intrabasin Gradient Exist ~300
SJ4 San Jose-4th Street Anc-AGBac-E(everyday)F
Sat-D
Anc-QRSBac-15 Ep Days
Community Exposure Exist (Anchor operated by BAAQMD)
24
SJT San Jose-528 Tully Road Bac-E(everyday) Bac-15 Ep Days Community Exposure Exist 38SLDC Soledad Canyon Sat-A (summer) Interbasin Transport
VisibilityNew ~400
SLM San Luis Obispo-Marsh Street Bac-E(6th day) Source Exist 66
SNFH Sierra Nevada Foothills Sat-ABCD Anc-GHIJKLMNOPQRSTUVWX Vertical GradientIntrabasin GradientVisibility
New ~500
SOH Stockton-Hazelton Street Bac-E(3rd day)F Bac-15 Ep Days Community Exposure Exist 13SOLA1 South Lake Tahoe Bac-F(3rd day)i Visibility TRPA 1899
SQV Squaw Valley-New Site Bac-E(3rd day) Source New ~1990SRF Santa Rosa-837 Fifth Street Bac-E(3rd day) Bac-15 Ep Days Community Exposure Exist 49SST Sacramento-Health Department
Stockton BlvdBac-E(everyday) Bac-15 Ep Days Community Exposure Exist 8
STL Santa Maria-Library Bac-E(6th day) Source Exist 152SWC SW Chowchilla Sat-ABC Sat-15 Ep Days Intrabasin Gradient IMS-95 ~100
4-36
Table 4.4-5.CRPAQS PM2.5 Measurement Sites and Purposes (cont'd).
Site ID Name Annualc Winter or Summer Additionsd Fall Additionse Purpose StatusfElevation (m MSL)
TEH2 Tehachapi Pass Sat-AB Sat-15 Ep Days Interbasin TrasnportVisibility
New ~1300
TEJ Tejon Pass Sat-A Sat-15 Ep Days Interbasin Transport New ~1260TRU Truckee-Fire Station Bac-E(3rd day)F Source Exist 1676UKC Ukiah-County Library Bac-E(6th day)F Community Exposure Exist 192VCS Visalia-North Church Street Bac-E(3rd day)F
Sat-fgh(6th day lag)Bac-15 Ep Days Community Exposure Exist 92
VIA Victorville-Armagosa Road Bac-E(3rd day)F Intrabasin Gradient Exist 876VJO Vallejo-304 Tuolumne Street Bac-E(3rd day) Bac-15 Ep Days Interbasin Transport Exist 23
WAG Walnut Grove-ground level Sat-A Anc-GIQRST Vertical Gradient New 6WAGT Walnut Grove-300 m agl Anc-AGIQRST Vertical Gradient New 306WLKP Walker Pass Sat-A Sat-15 Ep Days Interbasin Transport New ~1600WLN Woodland Bac-E(3rd day) Bac-15 Ep Days Community Exposure New ~17YAS Yuba City-Almond Street Bac-E(6th day)F Bac-15 Ep Days Intrabasin Gradient Exist 20
YOSE1 Yosemite National Park-Turtleback Dome
Bac-F(3rd day)iSat-DU
Bac-15 Ep Days BackgroundVisibility
IMPROVE 1605
YOY Yosemite Village Bac-E(3rd day) Intrabasin Gradient Exist 1216aAnc=Anchor network, Bac=PM2.5 Backbone network, Sat=Satellite network. See Table 4.4-6 for measurement code definitions.bBac sites sample every day unless indicated every third or sixth day. Speciation monitors operate every sixth day.Filter measuremets at Backbone PM10 sites operate every 6th day, but 3-days later than the Bac schedule.cAnnual period is from 12/1/1999 through 1/31/2001dWinter unless otherwise designated. Winter period is 60 consecutive days from 11/16/2000 through 1/31/2001.Summer period is 62 consecutive days from 7/1/2000 through 8/31/2000.eFall period is 60 consecutive days from 9/1/2000 through 10/30/2000.fTRPA=Tahoe Regional Planning Agency, NPS=National Park Service, USFS=United States Forest Service*Fall Minivol sites to be moveable at 14-day intervals in response to review of nephelometer data at other sites in the neighborhood-scale network.
4-37
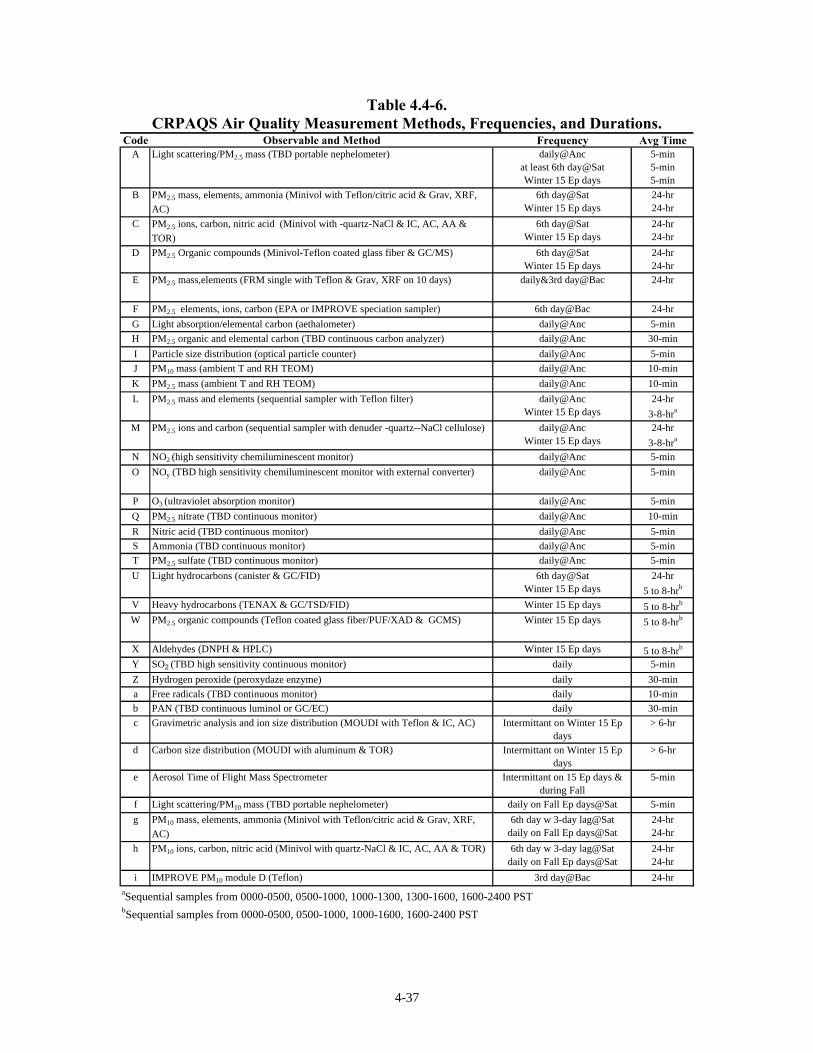
Table 4.4-6.CRPAQS Air Quality Measurement Methods, Frequencies, and Durations.
Code Observable and Method Frequency Avg TimeA Light scattering/PM2.5 mass (TBD portable nephelometer) daily@Anc
at least 6th day@SatWinter 15 Ep days
5-min5-min5-min
B PM2.5 mass, elements, ammonia (Minivol with Teflon/citric acid & Grav, XRF, AC)
6th day@SatWinter 15 Ep days
24-hr24-hr
C PM2.5 ions, carbon, nitric acid (Minivol with -quartz-NaCl & IC, AC, AA &
TOR)
6th day@SatWinter 15 Ep days
24-hr24-hr
D PM2.5 Organic compounds (Minivol-Teflon coated glass fiber & GC/MS) 6th day@SatWinter 15 Ep days
24-hr24-hr
E PM2.5 mass,elements (FRM single with Teflon & Grav, XRF on 10 days) daily&3rd day@Bac 24-hr
F PM2.5 elements, ions, carbon (EPA or IMPROVE speciation sampler) 6th day@Bac 24-hr
G Light absorption/elemental carbon (aethalometer) daily@Anc 5-min
H PM2.5 organic and elemental carbon (TBD continuous carbon analyzer) daily@Anc 30-min
I Particle size distribution (optical particle counter) daily@Anc 5-min
J PM10 mass (ambient T and RH TEOM) daily@Anc 10-min
K PM2.5 mass (ambient T and RH TEOM) daily@Anc 10-min
L PM2.5 mass and elements (sequential sampler with Teflon filter) daily@AncWinter 15 Ep days
24-hr
3-8-hra
M PM2.5 ions and carbon (sequential sampler with denuder -quartz--NaCl cellulose) daily@AncWinter 15 Ep days
24-hr
3-8-hra
N NO2 (high sensitivity chemiluminescent monitor) daily@Anc 5-min
O NOy (TBD high sensitivity chemiluminescent monitor with external converter) daily@Anc 5-min
P O3 (ultraviolet absorption monitor) daily@Anc 5-min
Q PM2.5 nitrate (TBD continuous monitor) daily@Anc 10-min
R Nitric acid (TBD continuous monitor) daily@Anc 5-min
S Ammonia (TBD continuous monitor) daily@Anc 5-min
T PM2.5 sulfate (TBD continuous monitor) daily@Anc 5-min
U Light hydrocarbons (canister & GC/FID) 6th day@SatWinter 15 Ep days
24-hr
5 to 8-hrb
V Heavy hydrocarbons (TENAX & GC/TSD/FID) Winter 15 Ep days 5 to 8-hrb
W PM2.5 organic compounds (Teflon coated glass fiber/PUF/XAD & GCMS) Winter 15 Ep days 5 to 8-hrb
X Aldehydes (DNPH & HPLC) Winter 15 Ep days 5 to 8-hrb
Y SO2 (TBD high sensitivity continuous monitor) daily 5-min
Z Hydrogen peroxide (peroxydaze enzyme) daily 30-min
a Free radicals (TBD continuous monitor) daily 10-min
b PAN (TBD continuous luminol or GC/EC) daily 30-min
c Gravimetric analysis and ion size distribution (MOUDI with Teflon & IC, AC) Intermittant on Winter 15 Ep days
> 6-hr
d Carbon size distribution (MOUDI with aluminum & TOR) Intermittant on Winter 15 Ep days
> 6-hr
e Aerosol Time of Flight Mass Spectrometer Intermittant on 15 Ep days & during Fall
5-min
f Light scattering/PM10 mass (TBD portable nephelometer) daily on Fall Ep days@Sat 5-min
g PM10 mass, elements, ammonia (Minivol with Teflon/citric acid & Grav, XRF,
AC)
6th day w 3-day lag@Satdaily on Fall Ep days@Sat
24-hr24-hr
h PM10 ions, carbon, nitric acid (Minivol with quartz-NaCl & IC, AC, AA & TOR) 6th day w 3-day lag@Satdaily on Fall Ep days@Sat
24-hr24-hr
i IMPROVE PM10 module D (Teflon) 3rd day@Bac 24-hraSequential samples from 0000-0500, 0500-1000, 1000-1300, 1300-1600, 1600-2400 PSTbSequential samples from 0000-0500, 0500-1000, 1000-1600, 1600-2400 PST
4-38
Table 4.5-1.Surface Meteorological Measurements for Annual and Winter Studies
(Surface measurements will also be acquired at upper air sites)
Site ID Name Purpose Operatora Basin Measurements Elev (m MSL)BAC Bakersfield-
California StreetCommunity Exposure ARB SJV High time sensitivity surface
meteorological measurements120
FSF Fresno-First Street Community Exposure ARB SJV High time sensitivity surface meteorological measurements
96
ALT1 Altamont Pass Interbasin Transport ARB SFB Regular WS, WD, T ~300BTI Bethel Island Interbasin Transport CRPAQS SFB High time sensitivity surface
meteorological measurements~0
PAC1 Pacheco Pass Interbasin Transport CRPAQS NCC Regular WS, WD, T ~400
KRV Kings River Valley Interbasin Transport CRPAQS SJV Regular WS, WD, T
WLKP Walker Pass Interbasin Transport CRPAQS MOJ Regular WS, WD, T 1609
ANGI Angiola Intrabasin Gradient CRPAQS SJV 100 m micrometeorological tower
61
WAG Walnut Grove Vertical Gradient CRPAQS SFB 300 m tower
aCRPAQS = This study, ARB = California Air Resources Board
4-39
Table 4.6-1.Upper Air Meteorological Measurements for Annual and Winter Studies.
Site ID Name Purpose
Oper-
atora Radarb RASSb Sodarb,c
Radio
Sondeb
ACP Angel's Camp Interbasin Transport CRPAQS WCANGI Angiola Intrabasin Transport CRPAQS A A WCBAC Bakersfield-California Urban Heat Island CRPAQS WECRO Crows Landing Intra&Interbasin Transport CRPAQS A AEDI Edison Interbasin Transport ARB A AEDW Edwards AFB Desert Mixed Layer USAF A AELN El Nido Intrabasin Transport CRPAQS A A WCFSF Fresno-First Street Urban Heat Island CRPAQS WEHUR Huron Intrabasin Transport CRPAQS A ALGR Lagrange Upslope/Downslope flow CRPAQS WC WC WCMCK Mckittrick Intrabasin Transport CRPAQS A AMEN Mendota Intrabasin Transport CRPAQS WC WC WCMKR Mouth Kings River Upslope/Downslope flow CRPAQS A A WCMON Monterey Onshore/Offshore Transport USNPGS A A
MTL Mettler Southern Valley Barrier CRPAQS WC WC WCNTD Point Mugu USN Onshore/Offshore Transport USN A
OAK Oakland airport Onshore/Offshore Transport NWSA
RBF Red Bluff Northern Valley Barrier CRPAQS WC WCRIC Richmond Onshore/Offshore Transport CRPAQS A
RSA Rosamond-Mojave Desert
Interbasin Transport ARB A A
SAC Sacramento Intrabasin Transport SMUAPCD A ASAM Santa Maria Interbasin Transport CRPAQS WC WCSJO San Jose Intrabasin Transport CRPAQS WC WC WCTRA Travis AFB Intrabasin Transport USAF or
NWS A A WCVBG Vandenberg AFB Onshore/Offshore NWS AVIS Visalia Intrabasin Transport SJV A AWIL Williams Northern Valley Barrier CRPAQS WCaCRPAQS=This study; ARB=Air Resoures Board; USN=U.S. Navy; USAF=U.S. Air Force;USNPGS=U.S. Navy Post Graduate School; SJV=SJV Unified Air Pollution Control District;NWS=National Weather Service, SMUAPCD=Sacramento Metro Unified Air Pollution Control District.bA=Annual continuous measurements; WC=Winter continuous measurements 12/1/00-1/31/01;WE=Winter episodic measurements on 20 forecasted days.cSodars added at all sites as part of CRPAQS.
4-40
Figure 4.3-1. ARB Backbone PM2.5 network with Federal Reference Method (FRM)mass measurement and chemical speciation sites. IMPROVE visibility sites areseparately designated. The heavy continuous line represents the modeling domain whilethe light continuous line represents the annual and winter measurement domain.
4-41
Figure 4.3-2. Sampling Frequencies for FRM PM2.5 mass measurements in the ARBbackbone PM2.5 network.
4-42
Figure 4.3-3. ARB backbone PM10 network. Hivol size-selective inlet (SSI) anddichotomous (Dichot) samplers have operated every sixth day at most of the sites.Hourly measurements are acquired everyday for PM10 mass at TEOM/BAM sites, forlight absorption at COH sites, and for light scattering at nephelometer sites. The dottedline shows where the fall study will be conducted.
4-43
Figure 4.4-1. Site classifications for backbone, anchor, and satellite PM2.5 sites.
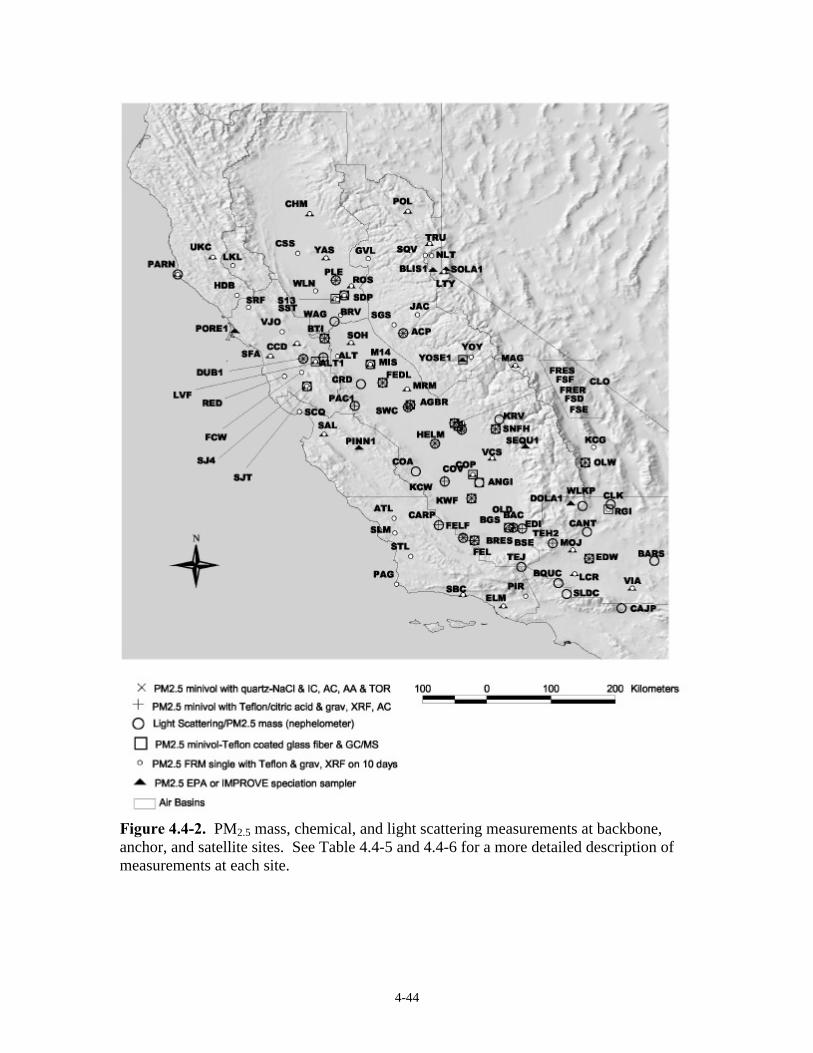
4-44
Figure 4.4-2. PM2.5 mass, chemical, and light scattering measurements at backbone,anchor, and satellite sites. See Table 4.4-5 and 4.4-6 for a more detailed description ofmeasurements at each site.
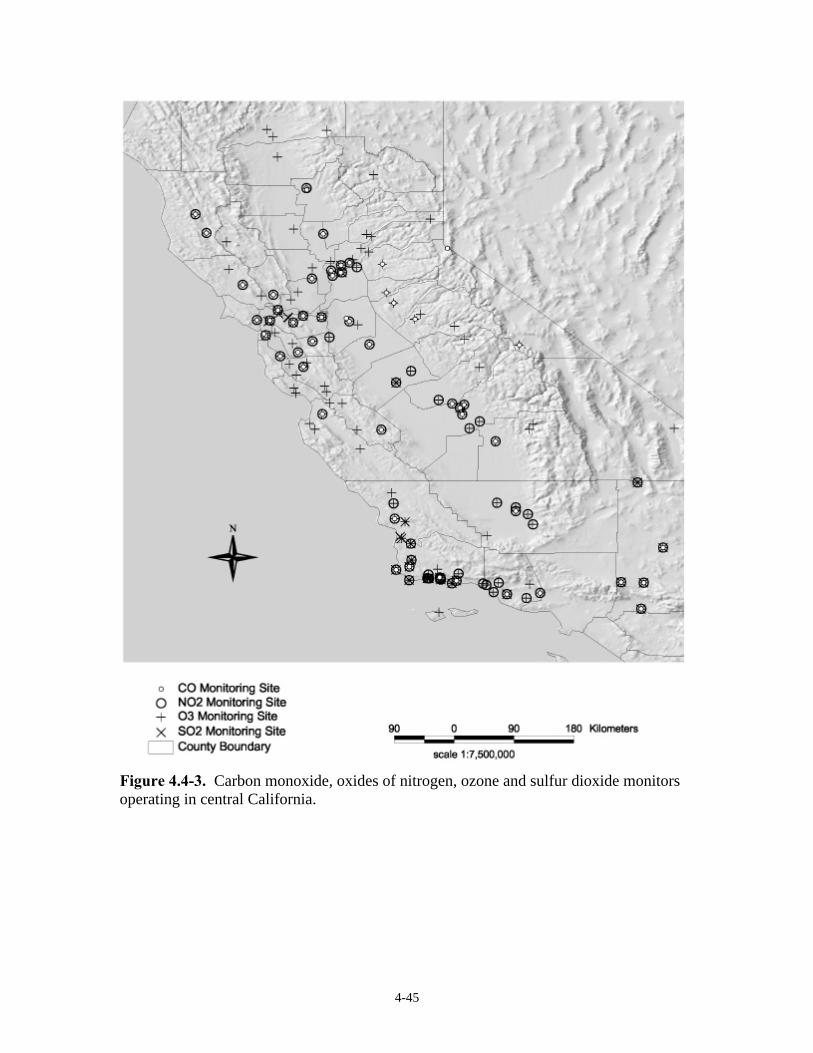
4-45
Figure 4.4-3. Carbon monoxide, oxides of nitrogen, ozone and sulfur dioxide monitorsoperating in central California.
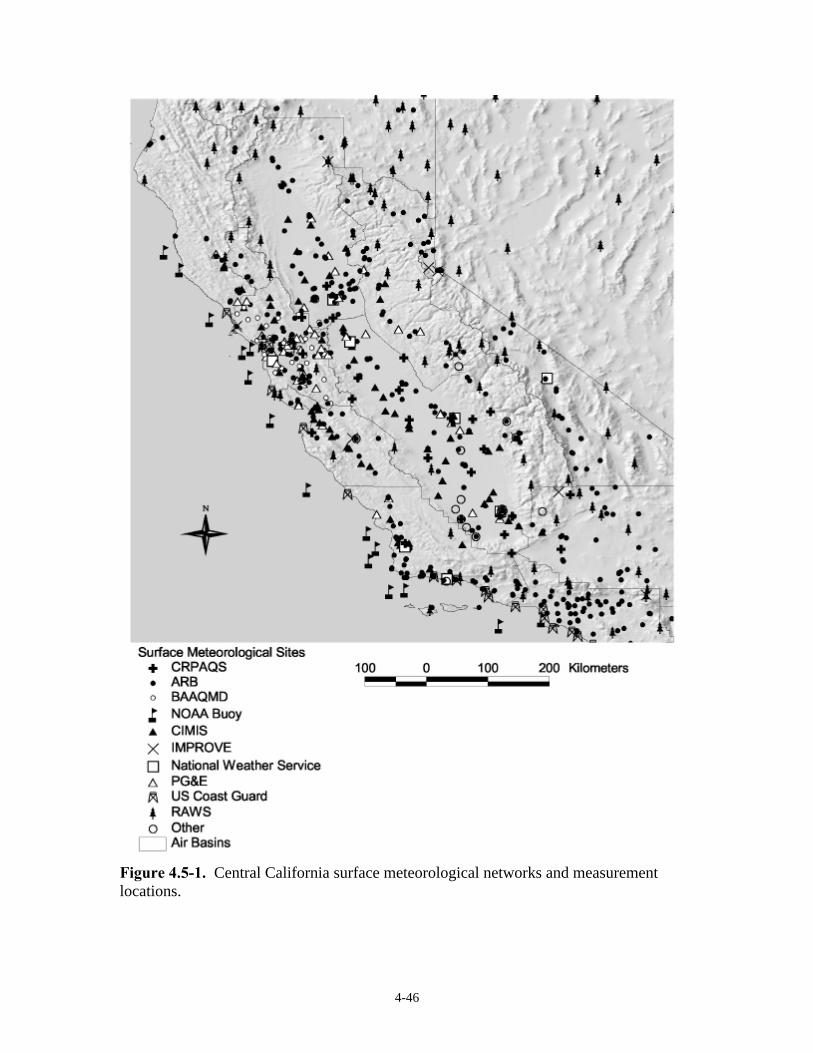
4-46
Figure 4.5-1. Central California surface meteorological networks and measurementlocations.
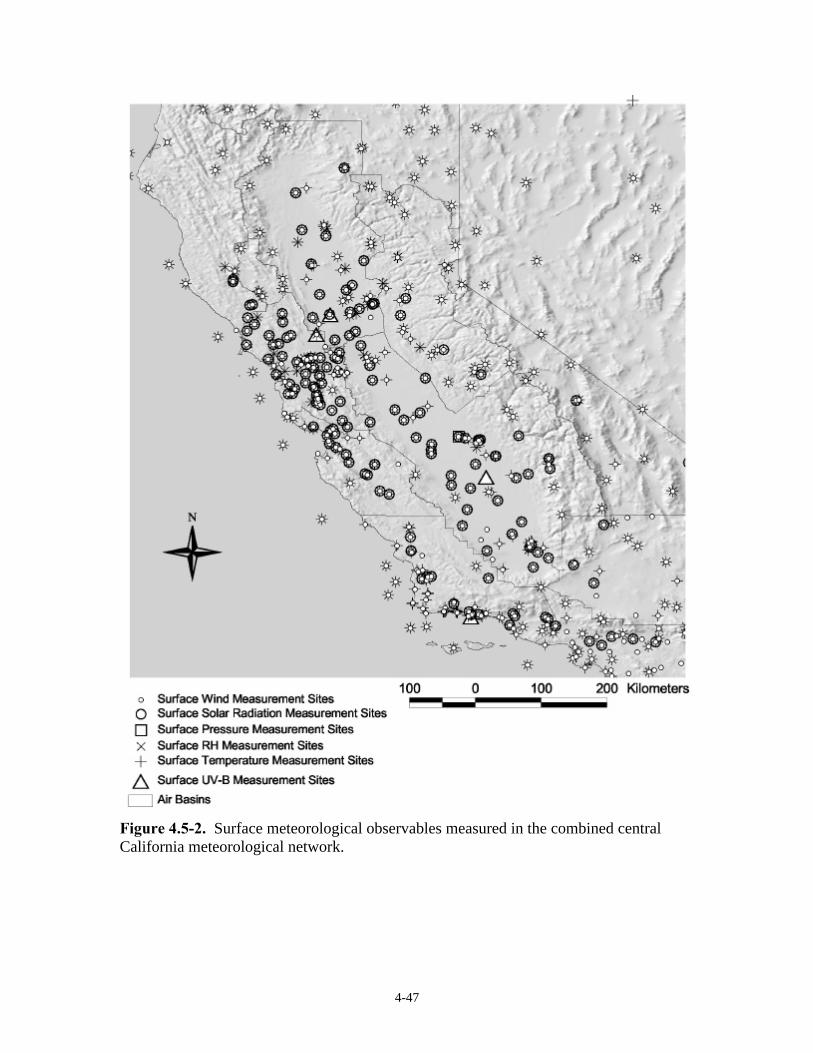
4-47
Figure 4.5-2. Surface meteorological observables measured in the combined centralCalifornia meteorological network.
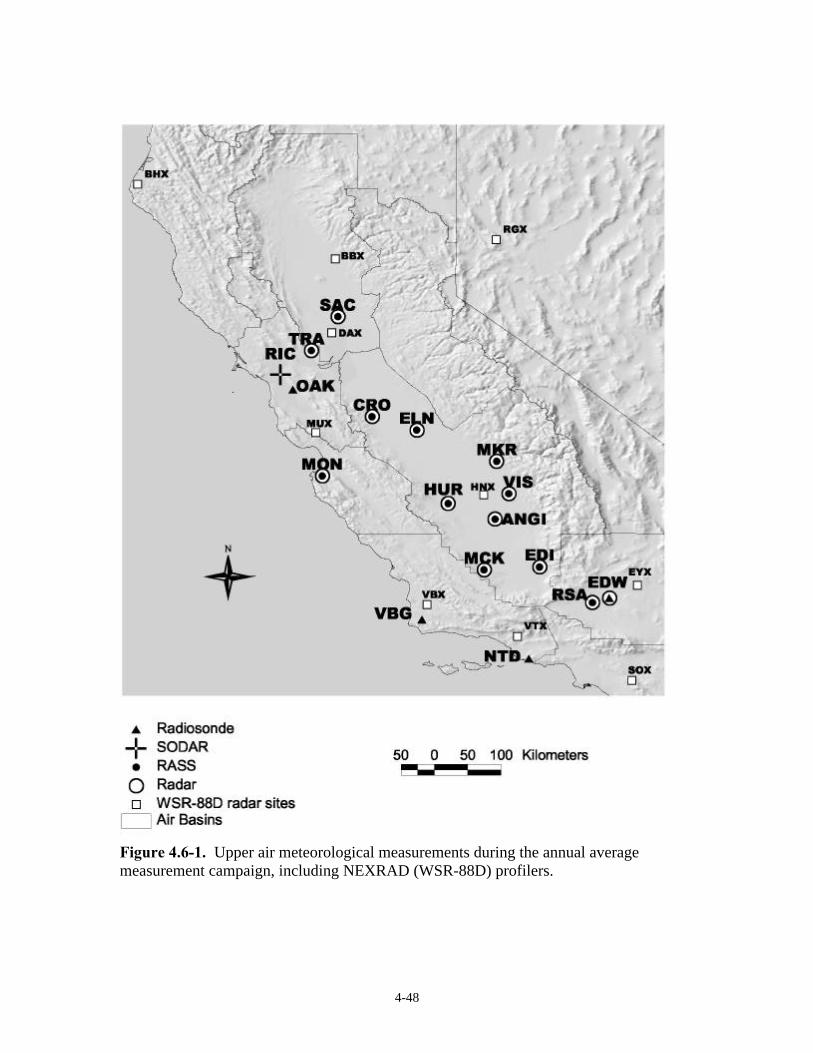
4-48
Figure 4.6-1. Upper air meteorological measurements during the annual averagemeasurement campaign, including NEXRAD (WSR-88D) profilers.
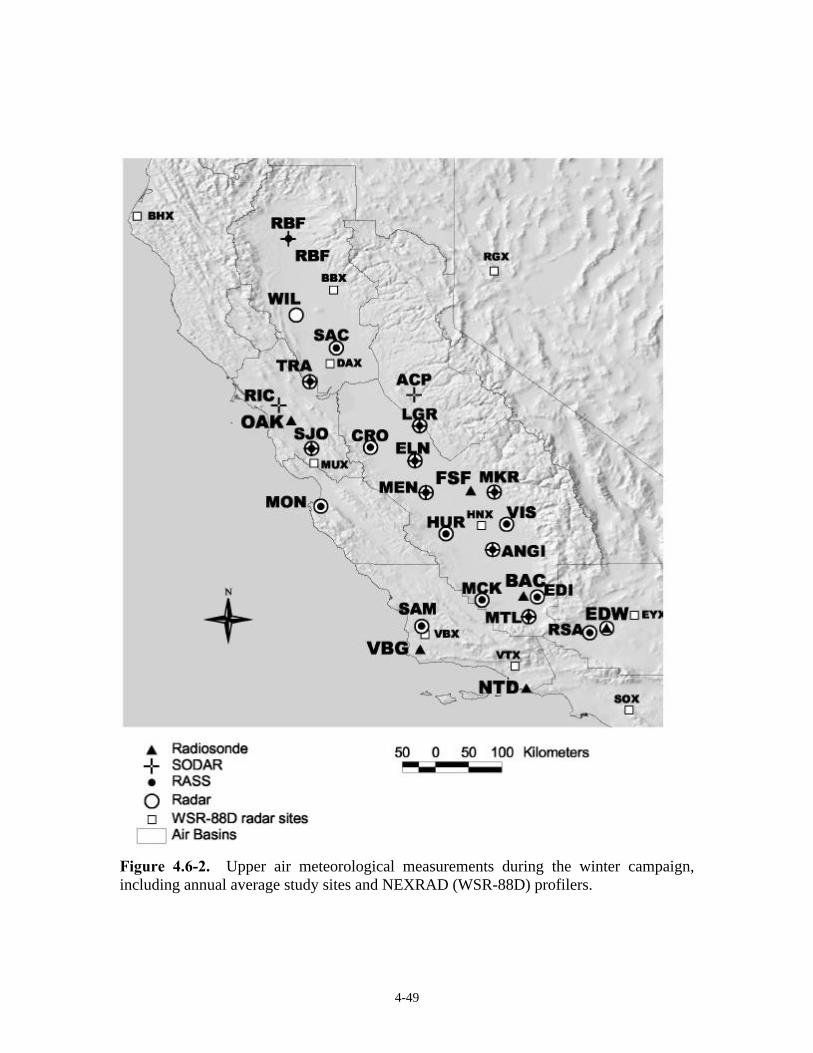
4-49
Figure 4.6-2. Upper air meteorological measurements during the winter campaign,including annual average study sites and NEXRAD (WSR-88D) profilers.
5-1
5. ANNUAL AVERAGE MEASUREMENT PROGRAM
The annual average measurement program will provide information to understand thecauses of PM2.5 annual averages that might exceed the 15 µg/m3 limit. This section specifiesthe variables measured, averaging times, sampling and analysis frequencies, monitoringsystems, and sampling sites that will be installed and operated by CRPAQS for the long-termannual average study. It also describes how CRPAQS measurements and those assembledfrom other networks will be used to address each of the study objectives specified in Section1.
5.1 CRPAQS Annual Average Aerosol Measurements
Table 5.1-1 specifies the CRPAQS particle and precursor gas measurements to betaken for the 12/1/1999 through 1/31/2001 long-term monitoring period. Thesemeasurements complement and supplement those acquired as part of the ARB backbonenetwork. Taken together, they constitute a large coverage of background, interbasintransport, intrabasin gradient, source-oriented, and community exposure sites.
The entire network includes the application of advanced, middle, and simpletechnologies for particle measurements. Advanced continuous and filter-based measurementsare applied at the anchor sites. These sites require a large and expensive infrastructure interms of hardware, software, technician training, space, power and security. The urbananchor sites include community-representative CORE sites that were shown in Section 2 tobe most likely to exceed the annual and 24-hour PM2.5 NAAQS.
Middle technology measurements are implemented by the ARB backbone PM2.5
network using a combination of EPA Federal Reference Method (FRM) filter samplers, EPAspeciation samplers, Federal Equivalent Method (FEM) sequential filter and IMPROVEsamplers, and Correlated Acceptable Continuous (CAC) monitors. As shown in Section 4,this network is extensive in sampling frequency and spatial representation. It will besupplemented by CRPAQS measurements with more frequent chemical sampling andanalysis and, in some cases, with upgraded equipment to permit chemically speciatedsampling, especially at background sites. Fixed sites supporting these measurements requiresubstantial support infrastructure, but this will be provided by the ARB and central Californiaair quality districts with minimal supplemental support provided by CRPAQS. Themeasurement technologies applied in the backbone network are well established, but theywere heretofore only applied in research networks.
Simple technology measurements apply battery-powered, Minivol filter samplerscollocated with low-cost, battery-powered nephelometers to acquire information between thebackbone and anchor network sites. These stations require no physical infrastructure beyondthe sampling equipment, can be maintained by local part time operators, and are relativelyinexpensive to implement. Extra battery powered samplers with quartz filters are located atsome of the anchor, backbone, and satellite sites to obtain groups of samples that will beextracted together to obtain a representative organic speciation for annual average sourceapportionment.
5-2
Annual average aerosol samples will be analyzed for mass concentration, elements(Al, Si, P, S, Cl, K, Ca, Ti, V, Cr, Mn, Fe, Co, Ni, Cu, Zn, Ga, As, Se, Br, Rb, Sr, Y, Zr, Mo,Pd, Ag, Cd, In, Sn, Sb, Ba, La, Au, Hg, Tl, Pb, and U), water-soluble ions (chloride, sulfate,nitrate, ammonium, and potassium), and carbon (organic and elemental carbon). CRPAQSaerosol chemical measurements should be compatible with and comparable to those acquiredfrom the speciation monitors operated at backbone sites identified in Section 4. CRPAQSwill augment the planned one in twelve days sampling frequency to every sixth day samplingand analysis at the speciation sites. All of the sixth-day satellite site samples with 24-hourfilter sampling will be analyzed for the entire 14-month annual average period. Theparticulate organic samples will be aggregated for the year 2000 at each sampled forextraction and analysis of an entire year’s worth of samples. Samples from up to ten daysbetween the sixth day sampling schedule may be selected for elemental analysis, based onelevated concentrations observed at some sites. These will most probably be days thatcorrespond to nearby source or windblown dust events. Up to 100 total samples from anchorsites with daily sequential samples may be submitted to full chemical analysis to examineepisodes that might develop outside the winter intensive measurement campaign. This totalincludes the sixth day samples.
5.2 CRPAQS Annual Average Surface Meteorological Measurements
As shown in Section 4, the existing surface meteorological network is extensive inspatial extent, but it is insufficient with respect to averaging time, wind thresholds, andsensitivity to high relative humidities. Table 5.2-1 describes the supplementaryinstrumentation to be supplied at key locations to complement the existing network. Theselocations emphasize anchor sites, where high quality temperature and relative humidity areneeded to apply chemical equilibrium models, at interbasin transport sites to determine flowsand particle fluxes (estimated by nephelometer/particle measurements, and at several of theupper air measurement sites to correspond with the elevated meteorological measurements.
5.3 CRPAQS Annual Average Upper Air Measurements
Table 5.3-1 details the upper air measurements to be acquired with radar profiler,RASS, and radiosonde systems for the long-term study. Half of the planned profilers will beoperated by other agencies and half will be operated by CRPAQS over the study period.Profilers and RASS require substantial support infrastructure and have strict sitingrequirements with respect to nearby obstructions that interfere with the signals and residentswho are annoyed by the high-pitched noise. CRPAQS additions to the existing network arelisted in order of priority. The radiosonde launches are the normal twice per day (0400 and1600 PST) measurements acquired at military bases and by the National Weather Service.
5.4 Annual Average Micrometeorological Tower
Table 5.4-1 identifies the instrumentation to be located on the 100 m tower. Thistower will acquire high time resolution measurements of meteorology and particle size at
5-3
several levels and is a key element in the interpretation of boundary layer evolution. It willbe operated throughout the year to provide a database that can be examined under a variety ofclimatological conditions.
5.5 Annual Average Special Studies
Three preparatory and one summer study will be conducted as part of the long-termmeasurement program. The three preparatory studies are: 1) measurement evaluation study;2) Sierra Foothills site evaluation study; and 3) winter forecast accuracy study. The summer2000 study is a detailed particle organic characterization study.
5.5.1 Measurement Evaluation Study
The objectives of the measurement evaluation study are to: 1) evaluate thepracticality and durability of new monitoring instruments under central California winterconditions, especially continuous monitors; 2) develop data acquisition and reductionprocedures for these measurements; 3) determine the equivalence and predictability amongdifferent measurement methods, and 4) evaluate the extent to which the expected pulse-widths of high-time resolution instruments assists in the interpretation and modeling ofintegrated aerosol samples. Method development is explicitly excluded as an objective forthis study owing to resource limitations. Only instruments that exist and have proven theiroperability elsewhere are part of this evaluation.
The measurement evaluation study will be conducted at the Bakersfield-Californiasite during 12/1/1998 through 1/25/99. This site has been used for several comparisonstudies (e.g. Pitchford et al., 1997). Table 5.5-1 identifies the instruments to be evaluatedalong with the observables to be measured. Several of these are the same as those specifiedin Table 5.1-1, and these specifications may change as a result of this evaluation. Otherinstruments, specifically those that continuously measure sulfate, nitrate, ammonia, and nitricacid, are included owing to their use in winter studies described in Section 6.
The measurement evaluation study will be conducted in collaboration with the ARB’sMonitoring and Laboratory Division (MLD) that will supply some of the neededinstrumentation and operate the site and with ARB’s Research Division that will sponsorTime-Of-Flight Mass spectrometric measurements.
Several of the continuous instruments may be left operating after the study withassistance from the MLD to determine their longevity and resource requirements. These willserve as the basic infrastructure for the Bakersfield anchor site during long-term monitoring.Power requirements and environmental sensitivities of each instrument will be recorded toplan site requirements for the other anchor and satellite sites.
5.5.2 Winter Forecast Accuracy Study
The forecast accuracy study is being conducted during the winters of 1998-99 and1999-2000. The objective of this study is to develop, apply, refine, and evaluate a wintertime
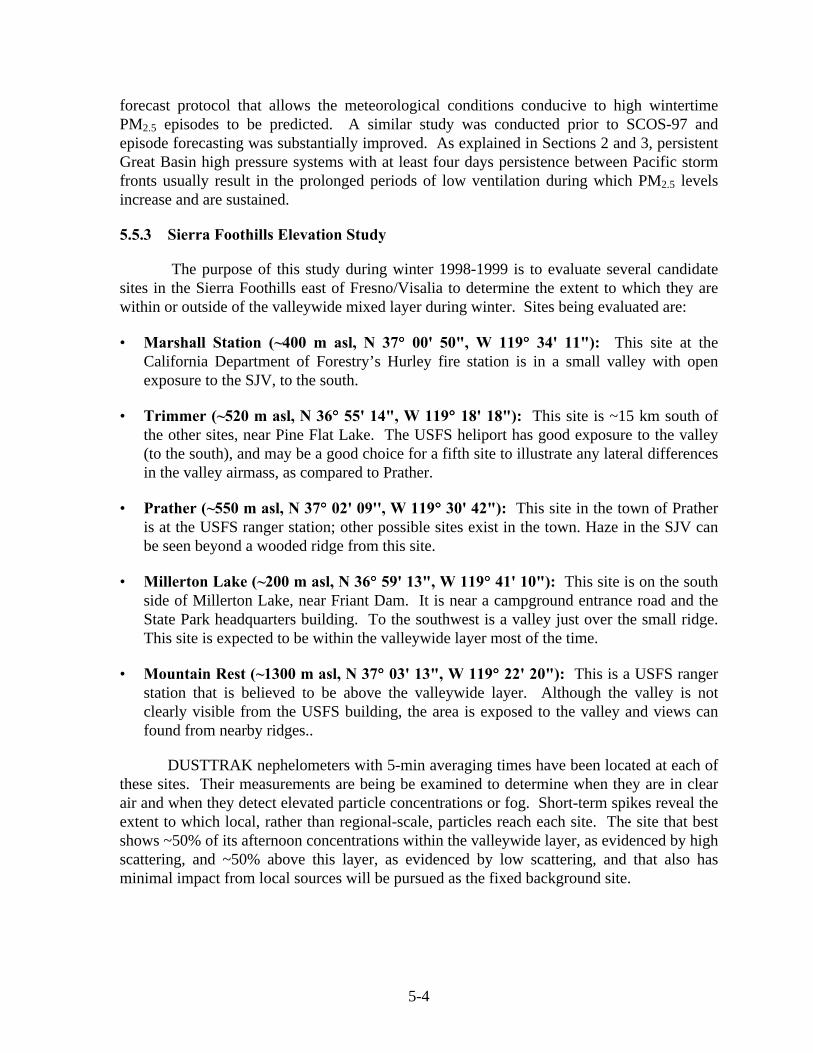
5-4
forecast protocol that allows the meteorological conditions conducive to high wintertimePM2.5 episodes to be predicted. A similar study was conducted prior to SCOS-97 andepisode forecasting was substantially improved. As explained in Sections 2 and 3, persistentGreat Basin high pressure systems with at least four days persistence between Pacific stormfronts usually result in the prolonged periods of low ventilation during which PM2.5 levelsincrease and are sustained.
5.5.3 Sierra Foothills Elevation Study
The purpose of this study during winter 1998-1999 is to evaluate several candidatesites in the Sierra Foothills east of Fresno/Visalia to determine the extent to which they arewithin or outside of the valleywide mixed layer during winter. Sites being evaluated are:
• Marshall Station (~400 m asl, N 37°° 00' 50", W 119°° 34' 11"): This site at theCalifornia Department of Forestry’s Hurley fire station is in a small valley with openexposure to the SJV, to the south.
• Trimmer (~520 m asl, N 36°° 55' 14", W 119°° 18' 18"): This site is ~15 km south ofthe other sites, near Pine Flat Lake. The USFS heliport has good exposure to the valley(to the south), and may be a good choice for a fifth site to illustrate any lateral differencesin the valley airmass, as compared to Prather.
• Prather (~550 m asl, N 37°° 02' 09'', W 119°° 30' 42"): This site in the town of Pratheris at the USFS ranger station; other possible sites exist in the town. Haze in the SJV canbe seen beyond a wooded ridge from this site.
• Millerton Lake (~200 m asl, N 36°° 59' 13", W 119°° 41' 10"): This site is on the southside of Millerton Lake, near Friant Dam. It is near a campground entrance road and theState Park headquarters building. To the southwest is a valley just over the small ridge.This site is expected to be within the valleywide layer most of the time.
• Mountain Rest (~1300 m asl, N 37°° 03' 13", W 119°° 22' 20"): This is a USFS rangerstation that is believed to be above the valleywide layer. Although the valley is notclearly visible from the USFS building, the area is exposed to the valley and views canfound from nearby ridges..
DUSTTRAK nephelometers with 5-min averaging times have been located at each ofthese sites. Their measurements are being be examined to determine when they are in clearair and when they detect elevated particle concentrations or fog. Short-term spikes reveal theextent to which local, rather than regional-scale, particles reach each site. The site that bestshows ~50% of its afternoon concentrations within the valleywide layer, as evidenced by highscattering, and ~50% above this layer, as evidenced by low scattering, and that also hasminimal impact from local sources will be pursued as the fixed background site.
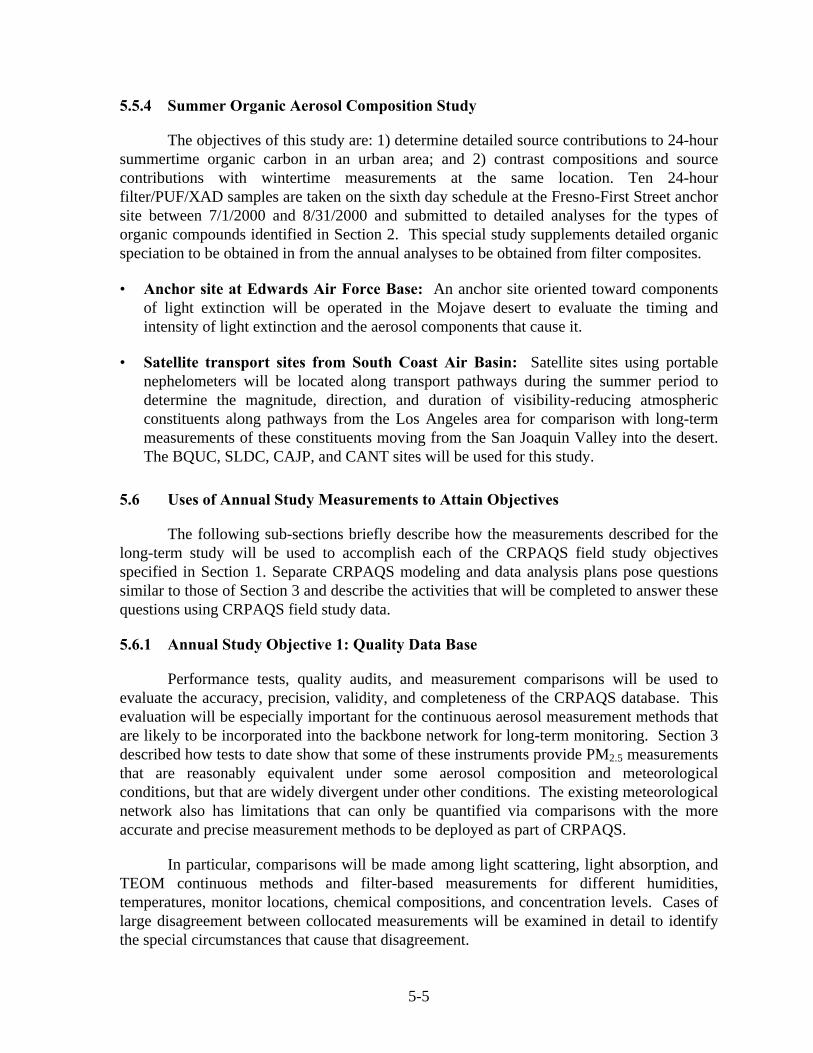
5-5
5.5.4 Summer Organic Aerosol Composition Study
The objectives of this study are: 1) determine detailed source contributions to 24-hoursummertime organic carbon in an urban area; and 2) contrast compositions and sourcecontributions with wintertime measurements at the same location. Ten 24-hourfilter/PUF/XAD samples are taken on the sixth day schedule at the Fresno-First Street anchorsite between 7/1/2000 and 8/31/2000 and submitted to detailed analyses for the types oforganic compounds identified in Section 2. This special study supplements detailed organicspeciation to be obtained in from the annual analyses to be obtained from filter composites.
• Anchor site at Edwards Air Force Base: An anchor site oriented toward componentsof light extinction will be operated in the Mojave desert to evaluate the timing andintensity of light extinction and the aerosol components that cause it.
• Satellite transport sites from South Coast Air Basin: Satellite sites using portablenephelometers will be located along transport pathways during the summer period todetermine the magnitude, direction, and duration of visibility-reducing atmosphericconstituents along pathways from the Los Angeles area for comparison with long-termmeasurements of these constituents moving from the San Joaquin Valley into the desert.The BQUC, SLDC, CAJP, and CANT sites will be used for this study.
5.6 Uses of Annual Study Measurements to Attain Objectives
The following sub-sections briefly describe how the measurements described for thelong-term study will be used to accomplish each of the CRPAQS field study objectivesspecified in Section 1. Separate CRPAQS modeling and data analysis plans pose questionssimilar to those of Section 3 and describe the activities that will be completed to answer thesequestions using CRPAQS field study data.
5.6.1 Annual Study Objective 1: Quality Data Base
Performance tests, quality audits, and measurement comparisons will be used toevaluate the accuracy, precision, validity, and completeness of the CRPAQS database. Thisevaluation will be especially important for the continuous aerosol measurement methods thatare likely to be incorporated into the backbone network for long-term monitoring. Section 3described how tests to date show that some of these instruments provide PM2.5 measurementsthat are reasonably equivalent under some aerosol composition and meteorologicalconditions, but that are widely divergent under other conditions. The existing meteorologicalnetwork also has limitations that can only be quantified via comparisons with the moreaccurate and precise measurement methods to be deployed as part of CRPAQS.
In particular, comparisons will be made among light scattering, light absorption, andTEOM continuous methods and filter-based measurements for different humidities,temperatures, monitor locations, chemical compositions, and concentration levels. Cases oflarge disagreement between collocated measurements will be examined in detail to identifythe special circumstances that cause that disagreement.
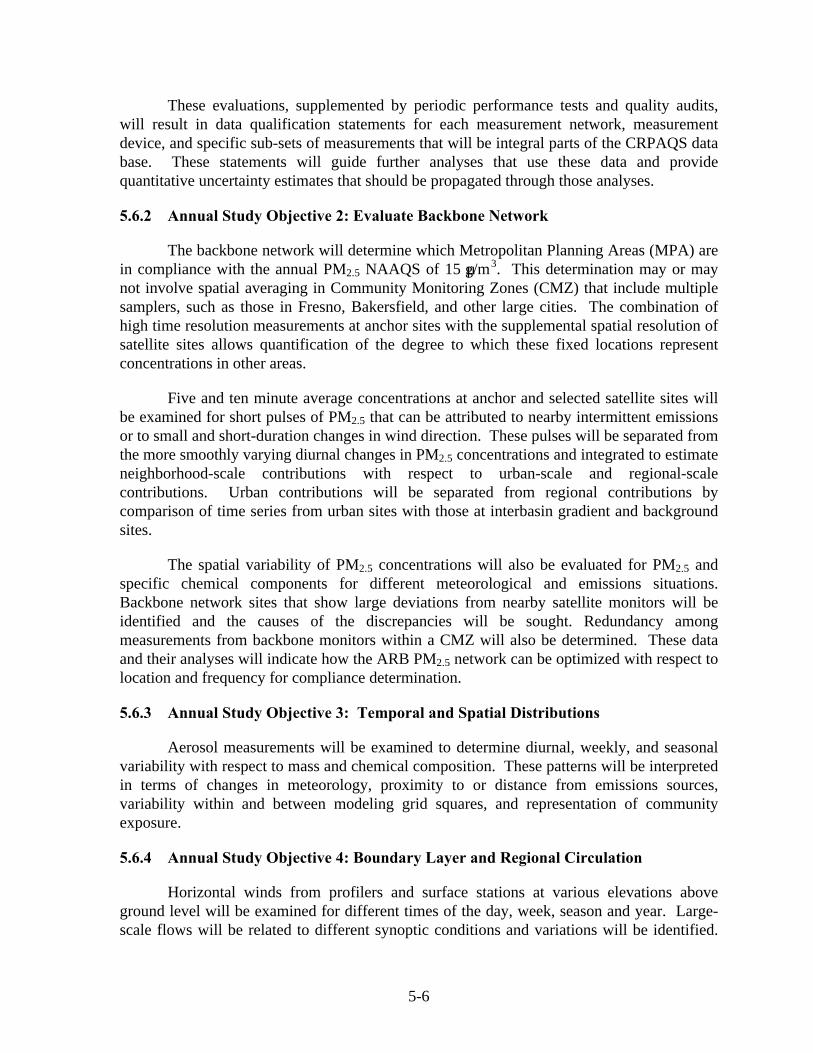
5-6
These evaluations, supplemented by periodic performance tests and quality audits,will result in data qualification statements for each measurement network, measurementdevice, and specific sub-sets of measurements that will be integral parts of the CRPAQS database. These statements will guide further analyses that use these data and providequantitative uncertainty estimates that should be propagated through those analyses.
5.6.2 Annual Study Objective 2: Evaluate Backbone Network
The backbone network will determine which Metropolitan Planning Areas (MPA) arein compliance with the annual PM2.5 NAAQS of 15 µg/m3. This determination may or maynot involve spatial averaging in Community Monitoring Zones (CMZ) that include multiplesamplers, such as those in Fresno, Bakersfield, and other large cities. The combination ofhigh time resolution measurements at anchor sites with the supplemental spatial resolution ofsatellite sites allows quantification of the degree to which these fixed locations representconcentrations in other areas.
Five and ten minute average concentrations at anchor and selected satellite sites willbe examined for short pulses of PM2.5 that can be attributed to nearby intermittent emissionsor to small and short-duration changes in wind direction. These pulses will be separated fromthe more smoothly varying diurnal changes in PM2.5 concentrations and integrated to estimateneighborhood-scale contributions with respect to urban-scale and regional-scalecontributions. Urban contributions will be separated from regional contributions bycomparison of time series from urban sites with those at interbasin gradient and backgroundsites.
The spatial variability of PM2.5 concentrations will also be evaluated for PM2.5 andspecific chemical components for different meteorological and emissions situations.Backbone network sites that show large deviations from nearby satellite monitors will beidentified and the causes of the discrepancies will be sought. Redundancy amongmeasurements from backbone monitors within a CMZ will also be determined. These dataand their analyses will indicate how the ARB PM2.5 network can be optimized with respect tolocation and frequency for compliance determination.
5.6.3 Annual Study Objective 3: Temporal and Spatial Distributions
Aerosol measurements will be examined to determine diurnal, weekly, and seasonalvariability with respect to mass and chemical composition. These patterns will be interpretedin terms of changes in meteorology, proximity to or distance from emissions sources,variability within and between modeling grid squares, and representation of communityexposure.
5.6.4 Annual Study Objective 4: Boundary Layer and Regional Circulation
Horizontal winds from profilers and surface stations at various elevations aboveground level will be examined for different times of the day, week, season and year. Large-scale flows will be related to different synoptic conditions and variations will be identified.
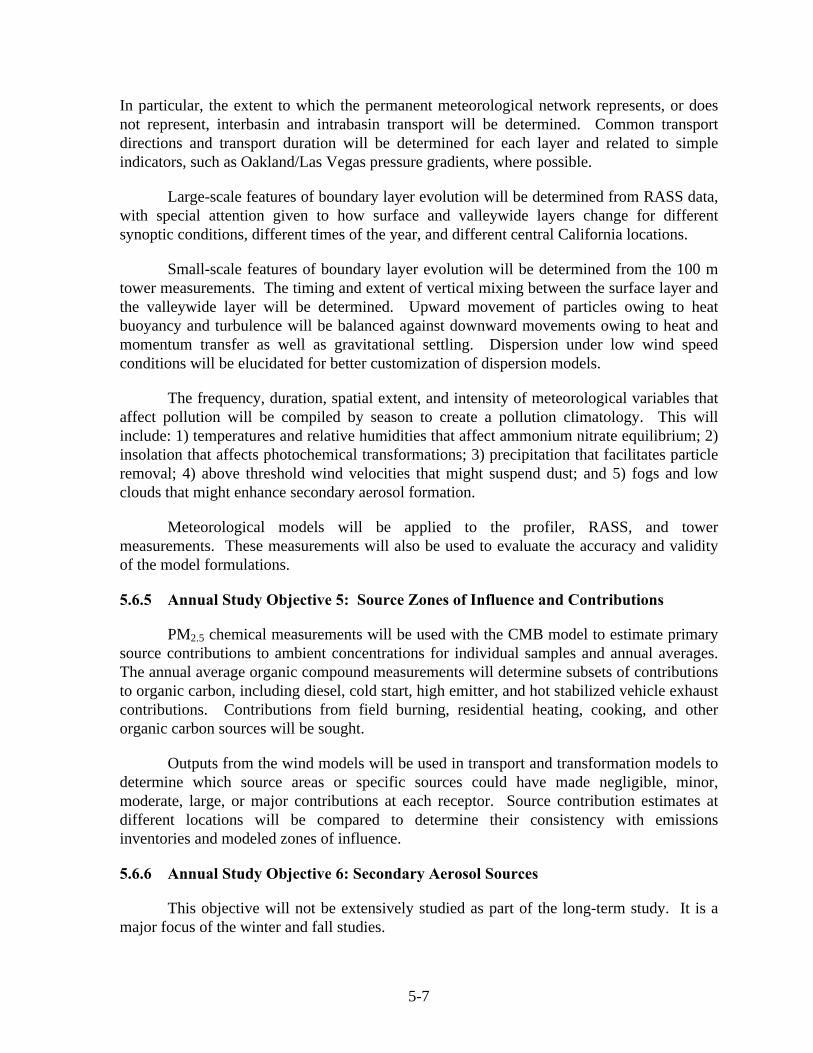
5-7
In particular, the extent to which the permanent meteorological network represents, or doesnot represent, interbasin and intrabasin transport will be determined. Common transportdirections and transport duration will be determined for each layer and related to simpleindicators, such as Oakland/Las Vegas pressure gradients, where possible.
Large-scale features of boundary layer evolution will be determined from RASS data,with special attention given to how surface and valleywide layers change for differentsynoptic conditions, different times of the year, and different central California locations.
Small-scale features of boundary layer evolution will be determined from the 100 mtower measurements. The timing and extent of vertical mixing between the surface layer andthe valleywide layer will be determined. Upward movement of particles owing to heatbuoyancy and turbulence will be balanced against downward movements owing to heat andmomentum transfer as well as gravitational settling. Dispersion under low wind speedconditions will be elucidated for better customization of dispersion models.
The frequency, duration, spatial extent, and intensity of meteorological variables thataffect pollution will be compiled by season to create a pollution climatology. This willinclude: 1) temperatures and relative humidities that affect ammonium nitrate equilibrium; 2)insolation that affects photochemical transformations; 3) precipitation that facilitates particleremoval; 4) above threshold wind velocities that might suspend dust; and 5) fogs and lowclouds that might enhance secondary aerosol formation.
Meteorological models will be applied to the profiler, RASS, and towermeasurements. These measurements will also be used to evaluate the accuracy and validityof the model formulations.
5.6.5 Annual Study Objective 5: Source Zones of Influence and Contributions
PM2.5 chemical measurements will be used with the CMB model to estimate primarysource contributions to ambient concentrations for individual samples and annual averages.The annual average organic compound measurements will determine subsets of contributionsto organic carbon, including diesel, cold start, high emitter, and hot stabilized vehicle exhaustcontributions. Contributions from field burning, residential heating, cooking, and otherorganic carbon sources will be sought.
Outputs from the wind models will be used in transport and transformation models todetermine which source areas or specific sources could have made negligible, minor,moderate, large, or major contributions at each receptor. Source contribution estimates atdifferent locations will be compared to determine their consistency with emissionsinventories and modeled zones of influence.
5.6.6 Annual Study Objective 6: Secondary Aerosol Sources
This objective will not be extensively studied as part of the long-term study. It is amajor focus of the winter and fall studies.

5-8
For the long-term annual average study chemical transformation mechanisms will beincluded in air quality models for comparison with the CMB-apportioned ammonium nitrateand ammonium sulfate. The possibility of precursors from different source regions will bedetermined.
5.6.7 Annual Study Objective 7: Conceptual Model Refinement
Results of data analysis and modeling will be used to refine the conceptual models inSection 3, especially those related to nearby sources and high wind fugitive dust. Additionalsituations favoring high PM2.5 may be encountered as part of these analyses.
5.6.8 Annual Study Objective 8: Simulation Methods
This objective will be addressed by the winter study. As part of the long-term annualaverage study, adjustments will be made to meteorological and air quality dispersion modelsto incorporate new concepts and parameters derived from the 100 m meteorological tower.Detailed analysis of modeling results will be made on selected episodes that representdifferent meteorological situations and PM2.5 levels.
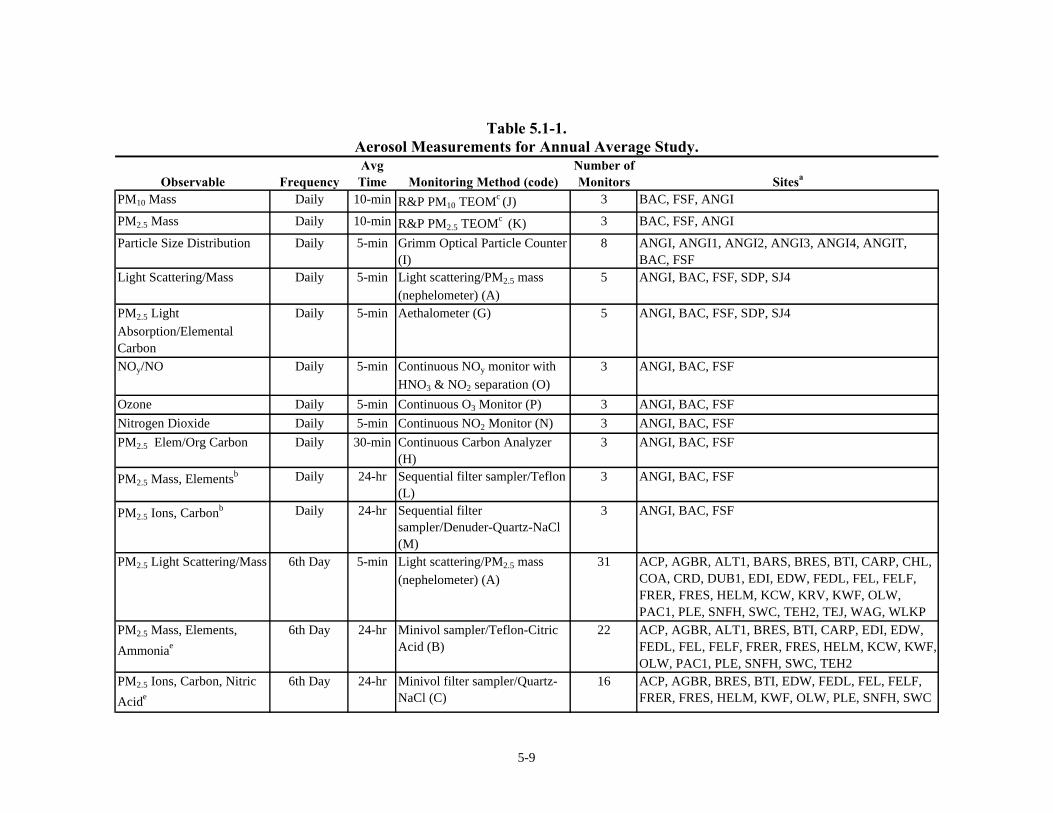
5-9
Table 5.1-1.Aerosol Measurements for Annual Average Study.
Observable FrequencyAvg Time Monitoring Method (code)
Number of Monitors Sitesa
PM10 Mass Daily 10-min R&P PM10 TEOMc (J) 3 BAC, FSF, ANGI
PM2.5 Mass Daily 10-min R&P PM2.5 TEOMc (K) 3 BAC, FSF, ANGI
Particle Size Distribution Daily 5-min Grimm Optical Particle Counter (I)
8 ANGI, ANGI1, ANGI2, ANGI3, ANGI4, ANGIT, BAC, FSF
Light Scattering/Mass Daily 5-min Light scattering/PM2.5 mass (nephelometer) (A)
5 ANGI, BAC, FSF, SDP, SJ4
PM2.5 Light Absorption/Elemental Carbon
Daily 5-min Aethalometer (G) 5 ANGI, BAC, FSF, SDP, SJ4
NOy/NO Daily 5-min Continuous NOy monitor with HNO3 & NO2 separation (O)
3 ANGI, BAC, FSF
Ozone Daily 5-min Continuous O3 Monitor (P) 3 ANGI, BAC, FSF
Nitrogen Dioxide Daily 5-min Continuous NO2 Monitor (N) 3 ANGI, BAC, FSF
PM2.5 Elem/Org Carbon Daily 30-min Continuous Carbon Analyzer (H)
3 ANGI, BAC, FSF
PM2.5 Mass, Elementsb Daily 24-hr Sequential filter sampler/Teflon (L)
3 ANGI, BAC, FSF
PM2.5 Ions, Carbonb Daily 24-hr Sequential filter sampler/Denuder-Quartz-NaCl (M)
3 ANGI, BAC, FSF
PM2.5 Light Scattering/Mass 6th Day 5-min Light scattering/PM2.5 mass (nephelometer) (A)
31 ACP, AGBR, ALT1, BARS, BRES, BTI, CARP, CHL, COA, CRD, DUB1, EDI, EDW, FEDL, FEL, FELF, FRER, FRES, HELM, KCW, KRV, KWF, OLW, PAC1, PLE, SNFH, SWC, TEH2, TEJ, WAG, WLKP
PM2.5 Mass, Elements,
Ammoniae
6th Day 24-hr Minivol sampler/Teflon-Citric Acid (B)
22 ACP, AGBR, ALT1, BRES, BTI, CARP, EDI, EDW, FEDL, FEL, FELF, FRER, FRES, HELM, KCW, KWF, OLW, PAC1, PLE, SNFH, SWC, TEH2
PM2.5 Ions, Carbon, Nitric
Acide
6th Day 24-hr Minivol filter sampler/Quartz-NaCl (C)
16 ACP, AGBR, BRES, BTI, EDW, FEDL, FEL, FELF, FRER, FRES, HELM, KWF, OLW, PLE, SNFH, SWC
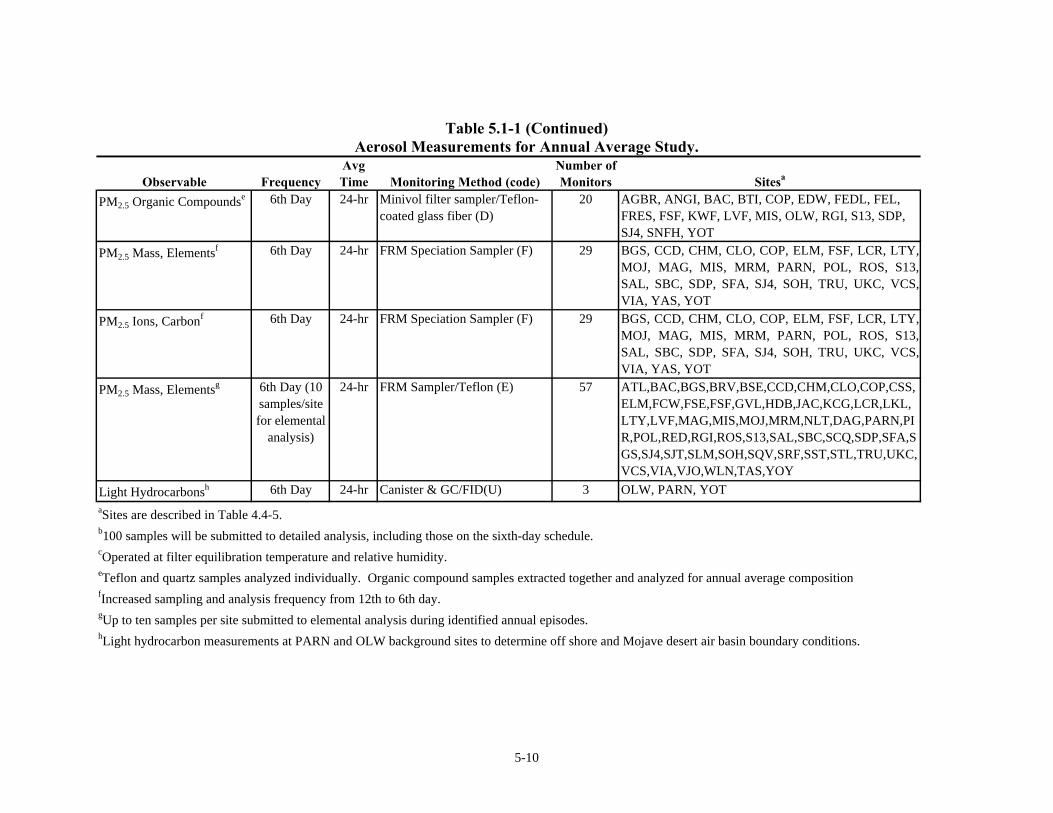
5-10
Table 5.1-1 (Continued)Aerosol Measurements for Annual Average Study.
Observable FrequencyAvg Time Monitoring Method (code)
Number of Monitors Sitesa
PM2.5 Organic Compoundse 6th Day 24-hr Minivol filter sampler/Teflon-coated glass fiber (D)
20 AGBR, ANGI, BAC, BTI, COP, EDW, FEDL, FEL, FRES, FSF, KWF, LVF, MIS, OLW, RGI, S13, SDP, SJ4, SNFH, YOT
PM2.5 Mass, Elementsf 6th Day 24-hr FRM Speciation Sampler (F) 29 BGS, CCD, CHM, CLO, COP, ELM, FSF, LCR, LTY,MOJ, MAG, MIS, MRM, PARN, POL, ROS, S13,SAL, SBC, SDP, SFA, SJ4, SOH, TRU, UKC, VCS,VIA, YAS, YOT
PM2.5 Ions, Carbonf 6th Day 24-hr FRM Speciation Sampler (F) 29 BGS, CCD, CHM, CLO, COP, ELM, FSF, LCR, LTY,MOJ, MAG, MIS, MRM, PARN, POL, ROS, S13,SAL, SBC, SDP, SFA, SJ4, SOH, TRU, UKC, VCS,VIA, YAS, YOT
PM2.5 Mass, Elementsg 6th Day (10 samples/site for elemental
analysis)
24-hr FRM Sampler/Teflon (E) 57 ATL,BAC,BGS,BRV,BSE,CCD,CHM,CLO,COP,CSS,ELM,FCW,FSE,FSF,GVL,HDB,JAC,KCG,LCR,LKL,LTY,LVF,MAG,MIS,MOJ,MRM,NLT,DAG,PARN,PIR,POL,RED,RGI,ROS,S13,SAL,SBC,SCQ,SDP,SFA,SGS,SJ4,SJT,SLM,SOH,SQV,SRF,SST,STL,TRU,UKC,VCS,VIA,VJO,WLN,TAS,YOY
Light Hydrocarbonsh 6th Day 24-hr Canister & GC/FID(U) 3 OLW, PARN, YOT
aSites are described in Table 4.4-5.b100 samples will be submitted to detailed analysis, including those on the sixth-day schedule.cOperated at filter equilibration temperature and relative humidity.eTeflon and quartz samples analyzed individually. Organic compound samples extracted together and analyzed for annual average compositionfIncreased sampling and analysis frequency from 12th to 6th day.gUp to ten samples per site submitted to elemental analysis during identified annual episodes.hLight hydrocarbon measurements at PARN and OLW background sites to determine off shore and Mojave desert air basin boundary conditions.
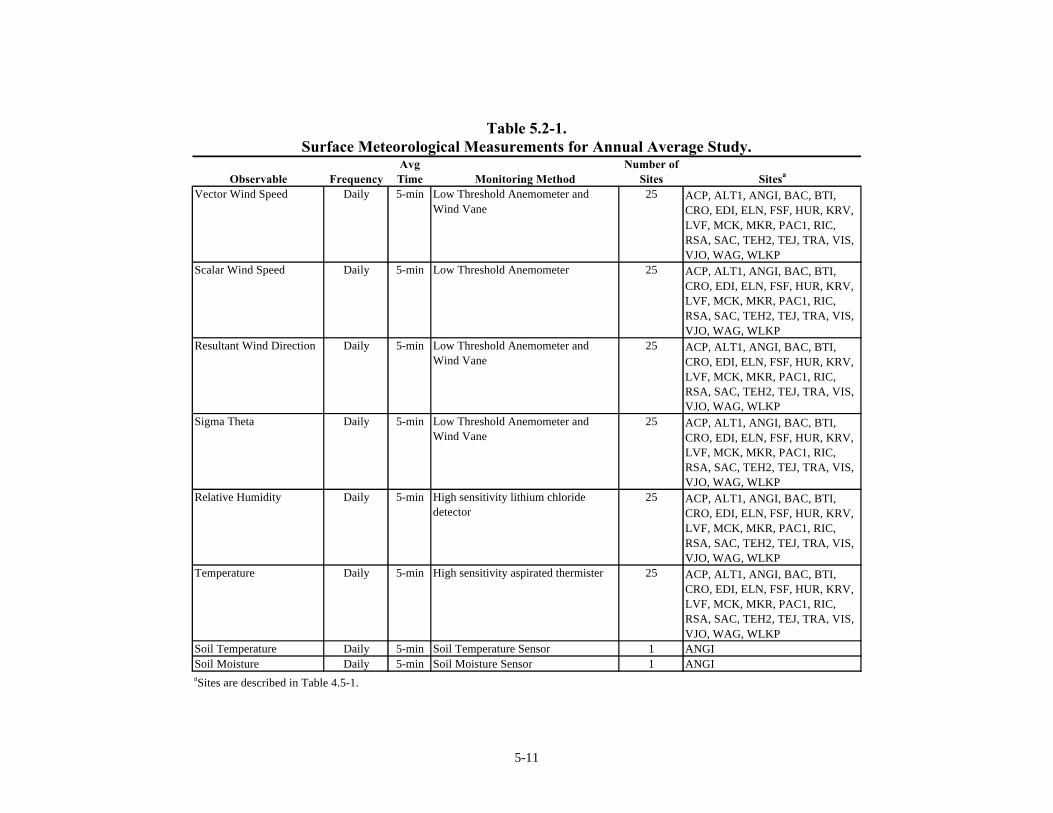
5-11
Table 5.2-1.Surface Meteorological Measurements for Annual Average Study.
Observable FrequencyAvg Time Monitoring Method
Number of Sites Sitesa
Vector Wind Speed Daily 5-min Low Threshold Anemometer and Wind Vane
25 ACP, ALT1, ANGI, BAC, BTI, CRO, EDI, ELN, FSF, HUR, KRV, LVF, MCK, MKR, PAC1, RIC, RSA, SAC, TEH2, TEJ, TRA, VIS, VJO, WAG, WLKP
Scalar Wind Speed Daily 5-min Low Threshold Anemometer 25 ACP, ALT1, ANGI, BAC, BTI, CRO, EDI, ELN, FSF, HUR, KRV, LVF, MCK, MKR, PAC1, RIC, RSA, SAC, TEH2, TEJ, TRA, VIS, VJO, WAG, WLKP
Resultant Wind Direction Daily 5-min Low Threshold Anemometer and Wind Vane
25 ACP, ALT1, ANGI, BAC, BTI, CRO, EDI, ELN, FSF, HUR, KRV, LVF, MCK, MKR, PAC1, RIC, RSA, SAC, TEH2, TEJ, TRA, VIS, VJO, WAG, WLKP
Sigma Theta Daily 5-min Low Threshold Anemometer and Wind Vane
25 ACP, ALT1, ANGI, BAC, BTI, CRO, EDI, ELN, FSF, HUR, KRV, LVF, MCK, MKR, PAC1, RIC, RSA, SAC, TEH2, TEJ, TRA, VIS, VJO, WAG, WLKP
Relative Humidity Daily 5-min High sensitivity lithium chloride detector
25 ACP, ALT1, ANGI, BAC, BTI, CRO, EDI, ELN, FSF, HUR, KRV, LVF, MCK, MKR, PAC1, RIC, RSA, SAC, TEH2, TEJ, TRA, VIS, VJO, WAG, WLKP
Temperature Daily 5-min High sensitivity aspirated thermister 25 ACP, ALT1, ANGI, BAC, BTI, CRO, EDI, ELN, FSF, HUR, KRV, LVF, MCK, MKR, PAC1, RIC, RSA, SAC, TEH2, TEJ, TRA, VIS, VJO, WAG, WLKP
Soil Temperature Daily 5-min Soil Temperature Sensor 1 ANGISoil Moisture Daily 5-min Soil Moisture Sensor 1 ANGIaSites are described in Table 4.5-1.
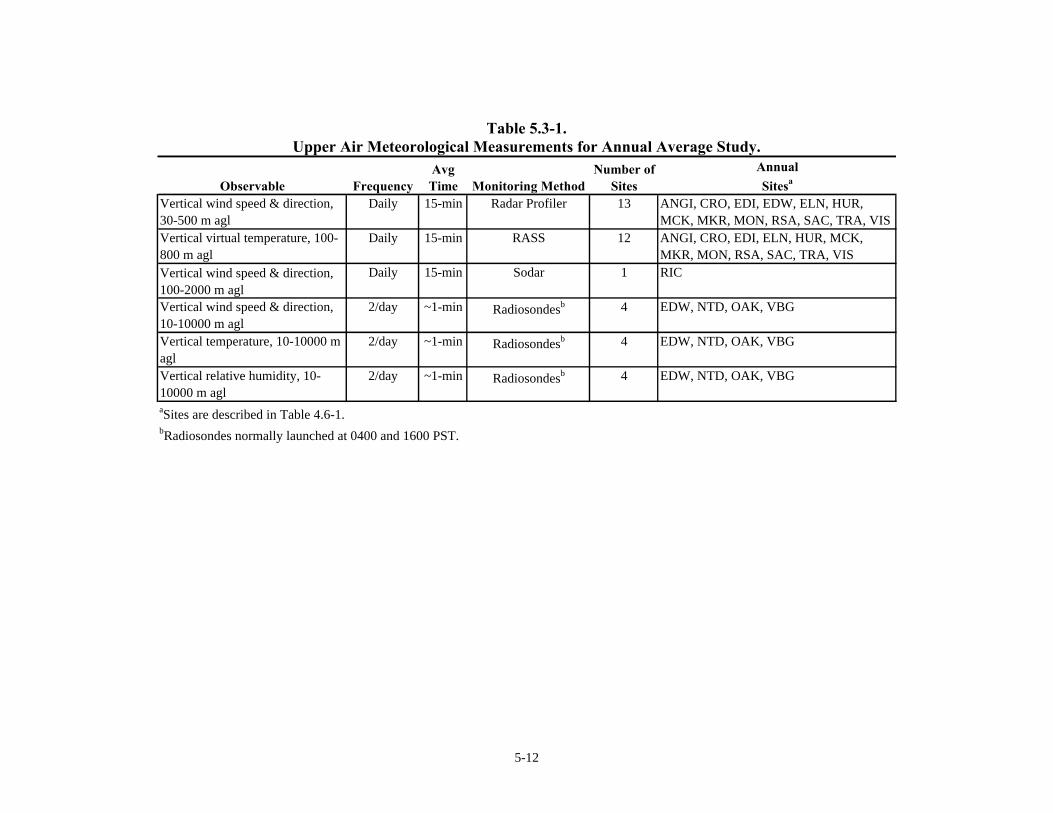
5-12
Table 5.3-1.Upper Air Meteorological Measurements for Annual Average Study.
Observable FrequencyAvg Time Monitoring Method
Number of Sites
Annual
Sitesa
Vertical wind speed & direction, 30-500 m agl
Daily 15-min Radar Profiler 13 ANGI, CRO, EDI, EDW, ELN, HUR, MCK, MKR, MON, RSA, SAC, TRA, VIS
Vertical virtual temperature, 100-800 m agl
Daily 15-min RASS 12 ANGI, CRO, EDI, ELN, HUR, MCK, MKR, MON, RSA, SAC, TRA, VIS
Vertical wind speed & direction, 100-2000 m agl
Daily 15-min Sodar 1 RIC
Vertical wind speed & direction, 10-10000 m agl
2/day ~1-min Radiosondesb 4 EDW, NTD, OAK, VBG
Vertical temperature, 10-10000 m agl
2/day ~1-min Radiosondesb 4 EDW, NTD, OAK, VBG
Vertical relative humidity, 10-10000 m agl
2/day ~1-min Radiosondesb 4 EDW, NTD, OAK, VBG
aSites are described in Table 4.6-1.bRadiosondes normally launched at 0400 and 1600 PST.
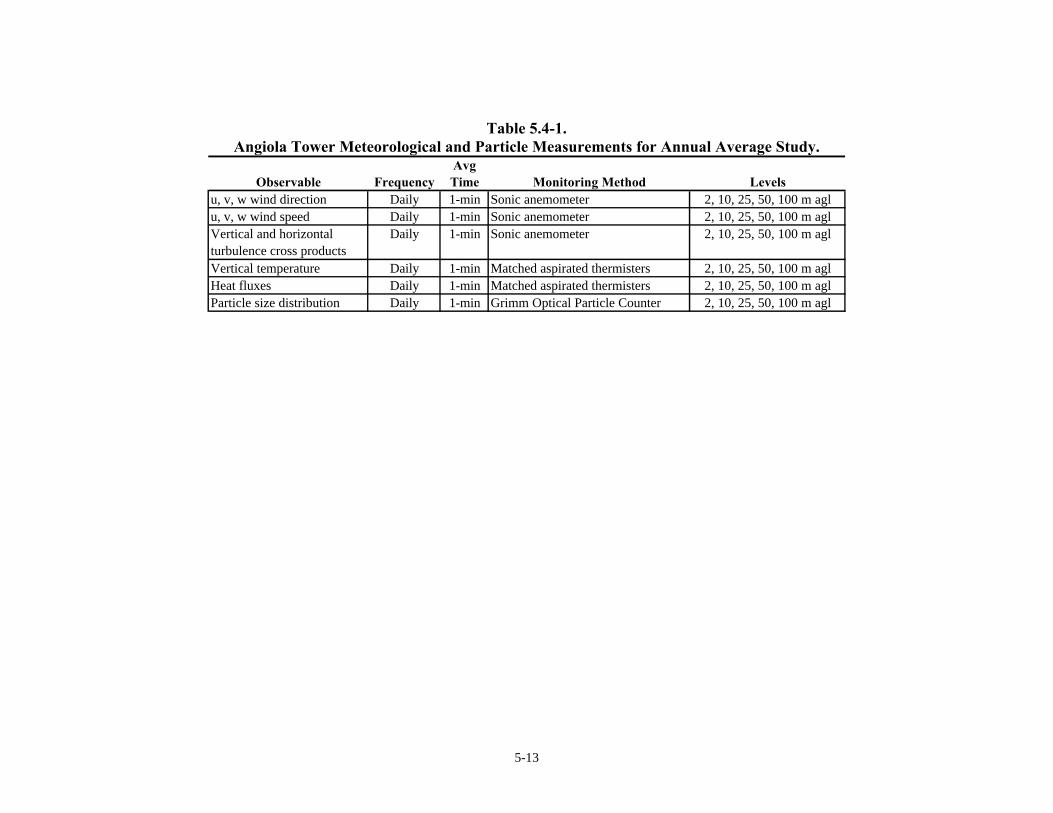
5-13
Table 5.4-1.Angiola Tower Meteorological and Particle Measurements for Annual Average Study.
Observable FrequencyAvg Time Monitoring Method Levels
u, v, w wind direction Daily 1-min Sonic anemometer 2, 10, 25, 50, 100 m aglu, v, w wind speed Daily 1-min Sonic anemometer 2, 10, 25, 50, 100 m aglVertical and horizontal turbulence cross products
Daily 1-min Sonic anemometer 2, 10, 25, 50, 100 m agl
Vertical temperature Daily 1-min Matched aspirated thermisters 2, 10, 25, 50, 100 m aglHeat fluxes Daily 1-min Matched aspirated thermisters 2, 10, 25, 50, 100 m aglParticle size distribution Daily 1-min Grimm Optical Particle Counter 2, 10, 25, 50, 100 m agl
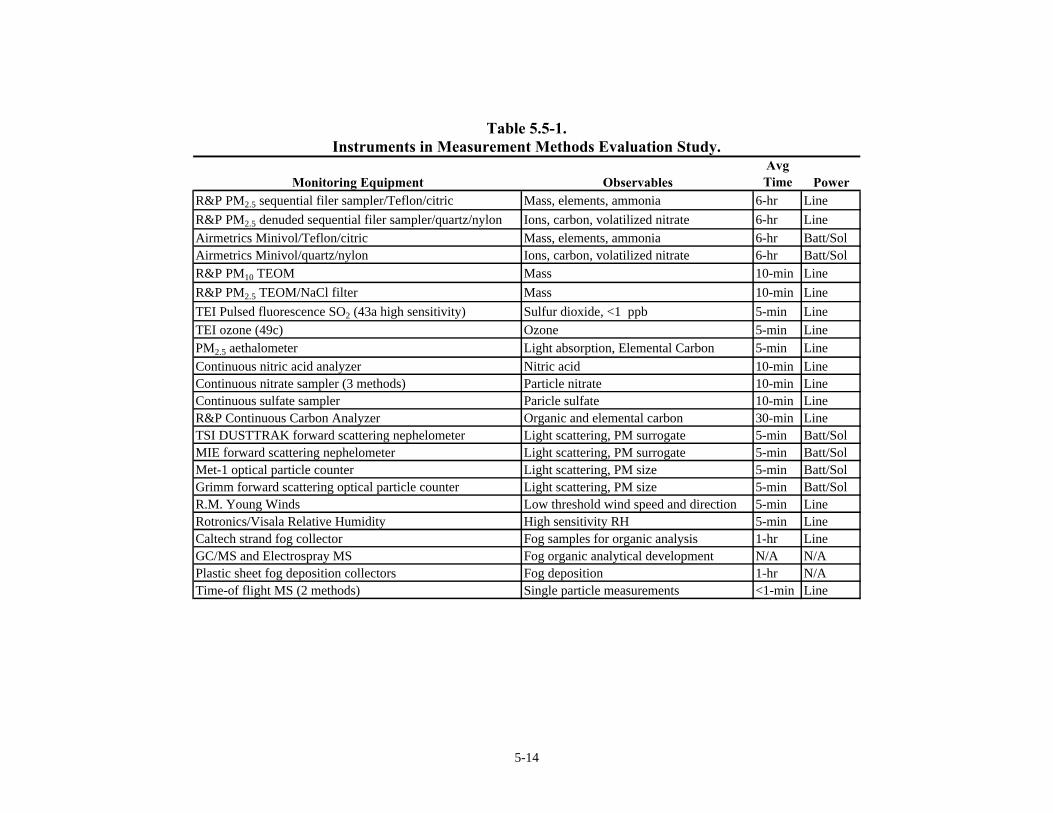
5-14
Table 5.5-1.Instruments in Measurement Methods Evaluation Study.
Monitoring Equipment ObservablesAvg Time Power
R&P PM2.5 sequential filer sampler/Teflon/citric Mass, elements, ammonia 6-hr Line
R&P PM2.5 denuded sequential filer sampler/quartz/nylon Ions, carbon, volatilized nitrate 6-hr LineAirmetrics Minivol/Teflon/citric Mass, elements, ammonia 6-hr Batt/SolAirmetrics Minivol/quartz/nylon Ions, carbon, volatilized nitrate 6-hr Batt/SolR&P PM10 TEOM Mass 10-min Line
R&P PM2.5 TEOM/NaCl filter Mass 10-min Line
TEI Pulsed fluorescence SO2 (43a high sensitivity) Sulfur dioxide, <1 ppb 5-min LineTEI ozone (49c) Ozone 5-min LinePM2.5 aethalometer Light absorption, Elemental Carbon 5-min LineContinuous nitric acid analyzer Nitric acid 10-min LineContinuous nitrate sampler (3 methods) Particle nitrate 10-min LineContinuous sulfate sampler Paricle sulfate 10-min LineR&P Continuous Carbon Analyzer Organic and elemental carbon 30-min LineTSI DUSTTRAK forward scattering nephelometer Light scattering, PM surrogate 5-min Batt/SolMIE forward scattering nephelometer Light scattering, PM surrogate 5-min Batt/SolMet-1 optical particle counter Light scattering, PM size 5-min Batt/SolGrimm forward scattering optical particle counter Light scattering, PM size 5-min Batt/SolR.M. Young Winds Low threshold wind speed and direction 5-min LineRotronics/Visala Relative Humidity High sensitivity RH 5-min LineCaltech strand fog collector Fog samples for organic analysis 1-hr LineGC/MS and Electrospray MS Fog organic analytical development N/A N/APlastic sheet fog deposition collectors Fog deposition 1-hr N/ATime-of flight MS (2 methods) Single particle measurements <1-min Line
6-1
6. WINTER MEASUREMENT PROGRAM
The winter measurement program is designed to understand the detailed causes ofprimary and secondary components of PM2.5 during pollution buildup episodes and to applyand evaluate state-of-the-art air quality models. This section specifies the variablesmeasured, averaging times, sampling and analysis frequencies, monitoring systems, andsampling sites that will supplement those operated during the annual average study. Thenetwork description tables show the total number of monitors (including those for the annualaverage networks) as well as the numbers and types of measurements to be added duringwinter. It describes how these additional data will be used to expand on the data usesspecified in Section 5 to attain each CRPAQS objective.
6.1 CRPAQS Winter Aerosol Measurements
As noted in Section 4, several sites will be upgraded to anchor sites for the wintercampaign and additional instrumentation will be added to the annual average anchor sites.Table 6.4-1 specifies the instruments that will be operated continuously at each of these sites.Several of these are the same as those used for the annual program, but additional chemicalspeciation of secondary compounds and precursors is added for the winter. All of the annualstudy measurements take place at the six day intervals specified in Section 5 throughout thewinter study period. The continuous monitors are operated every day, throughout the day,over the 60-day period to be selected between 11/15/2000 and 1/31/2001. High sensitivitysulfur dioxide is monitored only at the Bakersfield site to examine correspondence of SO2
pulses with sulfate pulses that might arise from nearby oilfield operations. Hydrogenperoxide and radicals are measured at Angiola, as this site is distant from the very reactivebut spatially non-representative species anticipated near source emissions in cities.
Detailed chemical measurements, as described in Table 6.4-2, will be acquired forintensive operating periods consisting of PM2.5 episodes of three days duration or more. Upto 15 days of episodic measurements will be acquired, consisting of three to five separatePM2.5 episodes during the 60 day study period. Monitoring during these episodes will beinitiated by a forecast team that has refined and tested the forecast methodology during twoprior winters.
Filter samples will be taken throughout each episode to characterize organic andinorganic chemistry. The sampling periods have been selected to encompass periods duringwhich emissions and meteorology have been observed to change. Rapid changes in verticalmixing between 1000 and 1300 PST are represented by a single sample, as is the morningrush hour period between 0500 and 1000 PST. The afternoon period from 1300 to 1600 iswhen vertical mixing is believed to be most vigorous. Semi-volatile organic compoundsrequire more sample, and these samples are not taken for less than 5-hour sample durations.
The satellite sites and backbone network will operate everyday during each episode.This frequency may need to be adjusted for some sites to accommodate samplers that requirea manual sample change.
6-2
6.2 CRPAQS Winter Upper Air Measurements
Table 6.2-1 specifies how the annual upper air measurements will be supplementedfor the Winter study. Profiler and RASS systems are added to characterize different parts ofcentral California. Doppler sodars collocated at the profiler sites are needed to understandthe transport and vertical mixing between the surface layer and the valleywide layer thatappears to occur each morning below the 100 m lower limit of the profilers. Thesecontinuous monitors will operate throughout the winter study period.
Additional radiosondes will be launched during the 15 episodic days, with greaterfrequency during the vertical mixing period between 1000 and 1400 PST. The launchfrequency at the NWS Oakland site will be supplemented with four additional airsondescorresponding to the CRPAQS schedule. These launches supplement the remotely sensedwind and temperature with measurements at lower and higher elevations and with relativehumidity.
6.3 Tower Measurements
In addition to the meteorological and particle size measurements acquired during theannual program, continuous measurements for nitric acid, nitrate, sulfate, ammonia, ozone,NOy, and elemental carbon (aethalometer) will be acquired at the 100 m level of the Angiolatower and at a level between 100 m and 300m on the Walnut Grove tower using the sameinstrumentation as that described in Table 6.3-1. The Walnut Grove tower will also beinstrumented with micrometeorological sensors similar to those on the Angiola tower duringthe winter period. These measurements will be minimally acquired on the 15 episode days,and on as many other days in between that are practical with logistical, cost, and weatherconstraints. These measurements will allow detailed examination of vertical pollutanttransfer between the surface layer and the valleywide layer to test the hypothesis that verticalmixing and non-afternoon transport above the surface layer mixes pollutants from differentsources. From ~1700 to 1000 PST the next day, the 100 m measurements will estimateconcentrations above the surface layer, but below the top of the valleywide layer.
6.4 Winter Special Studies
Four special studies are conducted during one or more of the four episodes: 1)valleywide layer depth study; 2) chemical composition aloft; 3) in situ single particlequantification; and 4) fog size and chemistry.
6.4.1 Aircraft Valleywide Layer Depth Study
The primary objective of the valleywide layer depth study is to determine thevariability in height of the valleywide mixed layer at and between upper air measurementlocations in central California. This information is needed to determine the accuracy towhich layer depths can be estimated by interpolation of upper air measurements that areacquired throughout the winter campaign. Limited upper air measurements from IMS-95found substantial difference in layer depths at different locations within the San JoaquinValley.
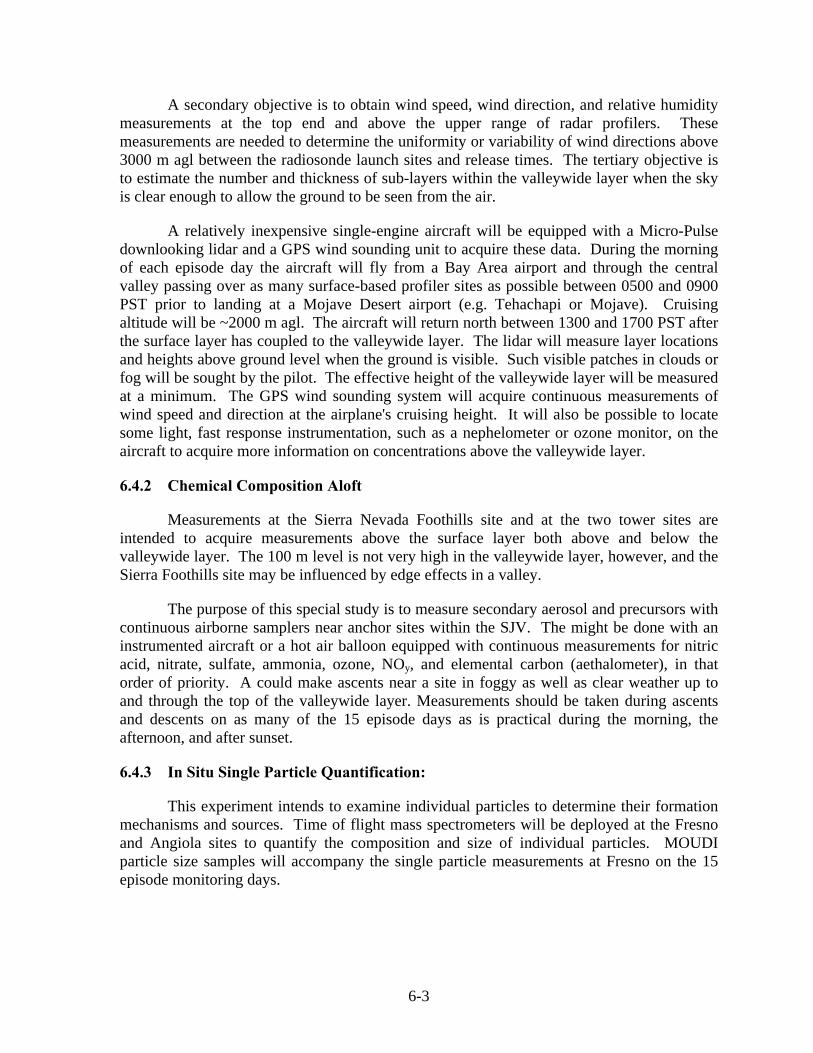
6-3
A secondary objective is to obtain wind speed, wind direction, and relative humiditymeasurements at the top end and above the upper range of radar profilers. Thesemeasurements are needed to determine the uniformity or variability of wind directions above3000 m agl between the radiosonde launch sites and release times. The tertiary objective isto estimate the number and thickness of sub-layers within the valleywide layer when the skyis clear enough to allow the ground to be seen from the air.
A relatively inexpensive single-engine aircraft will be equipped with a Micro-Pulsedownlooking lidar and a GPS wind sounding unit to acquire these data. During the morningof each episode day the aircraft will fly from a Bay Area airport and through the centralvalley passing over as many surface-based profiler sites as possible between 0500 and 0900PST prior to landing at a Mojave Desert airport (e.g. Tehachapi or Mojave). Cruisingaltitude will be ~2000 m agl. The aircraft will return north between 1300 and 1700 PST afterthe surface layer has coupled to the valleywide layer. The lidar will measure layer locationsand heights above ground level when the ground is visible. Such visible patches in clouds orfog will be sought by the pilot. The effective height of the valleywide layer will be measuredat a minimum. The GPS wind sounding system will acquire continuous measurements ofwind speed and direction at the airplane's cruising height. It will also be possible to locatesome light, fast response instrumentation, such as a nephelometer or ozone monitor, on theaircraft to acquire more information on concentrations above the valleywide layer.
6.4.2 Chemical Composition Aloft
Measurements at the Sierra Nevada Foothills site and at the two tower sites areintended to acquire measurements above the surface layer both above and below thevalleywide layer. The 100 m level is not very high in the valleywide layer, however, and theSierra Foothills site may be influenced by edge effects in a valley.
The purpose of this special study is to measure secondary aerosol and precursors withcontinuous airborne samplers near anchor sites within the SJV. The might be done with aninstrumented aircraft or a hot air balloon equipped with continuous measurements for nitricacid, nitrate, sulfate, ammonia, ozone, NOy, and elemental carbon (aethalometer), in thatorder of priority. A could make ascents near a site in foggy as well as clear weather up toand through the top of the valleywide layer. Measurements should be taken during ascentsand descents on as many of the 15 episode days as is practical during the morning, theafternoon, and after sunset.
6.4.3 In Situ Single Particle Quantification:
This experiment intends to examine individual particles to determine their formationmechanisms and sources. Time of flight mass spectrometers will be deployed at the Fresnoand Angiola sites to quantify the composition and size of individual particles. MOUDIparticle size samples will accompany the single particle measurements at Fresno on the 15episode monitoring days.
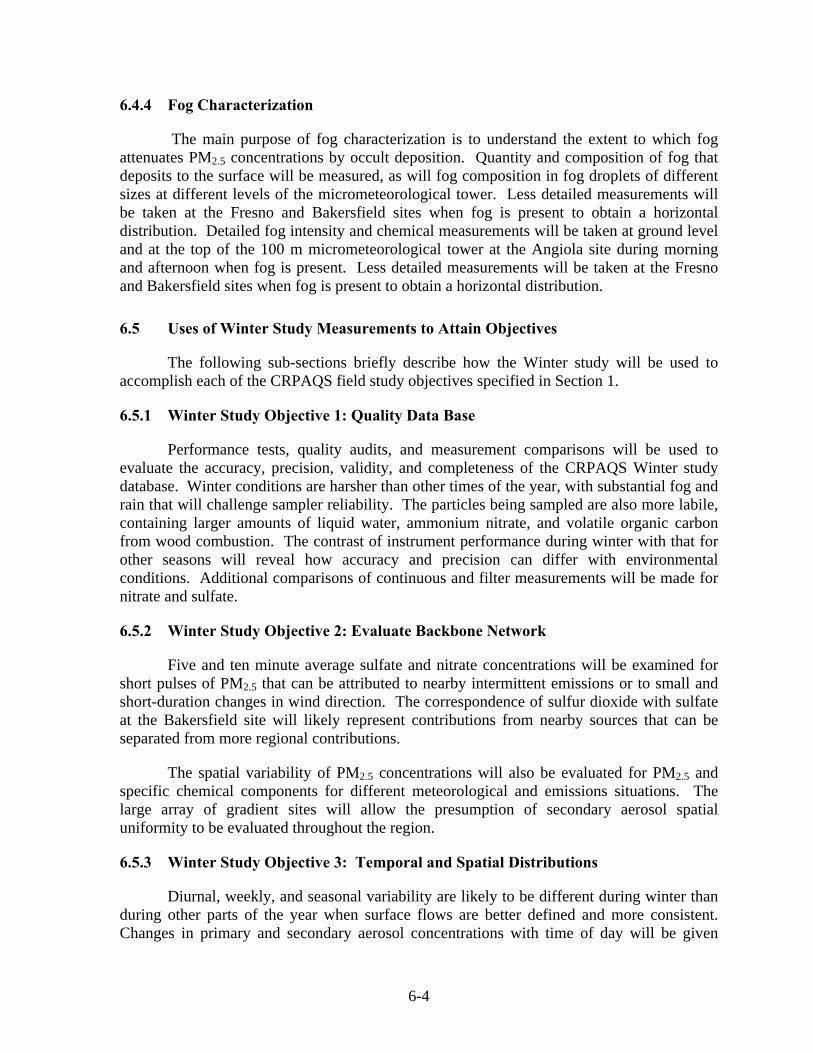
6-4
6.4.4 Fog Characterization
The main purpose of fog characterization is to understand the extent to which fogattenuates PM2.5 concentrations by occult deposition. Quantity and composition of fog thatdeposits to the surface will be measured, as will fog composition in fog droplets of differentsizes at different levels of the micrometeorological tower. Less detailed measurements willbe taken at the Fresno and Bakersfield sites when fog is present to obtain a horizontaldistribution. Detailed fog intensity and chemical measurements will be taken at ground leveland at the top of the 100 m micrometeorological tower at the Angiola site during morningand afternoon when fog is present. Less detailed measurements will be taken at the Fresnoand Bakersfield sites when fog is present to obtain a horizontal distribution.
6.5 Uses of Winter Study Measurements to Attain Objectives
The following sub-sections briefly describe how the Winter study will be used toaccomplish each of the CRPAQS field study objectives specified in Section 1.
6.5.1 Winter Study Objective 1: Quality Data Base
Performance tests, quality audits, and measurement comparisons will be used toevaluate the accuracy, precision, validity, and completeness of the CRPAQS Winter studydatabase. Winter conditions are harsher than other times of the year, with substantial fog andrain that will challenge sampler reliability. The particles being sampled are also more labile,containing larger amounts of liquid water, ammonium nitrate, and volatile organic carbonfrom wood combustion. The contrast of instrument performance during winter with that forother seasons will reveal how accuracy and precision can differ with environmentalconditions. Additional comparisons of continuous and filter measurements will be made fornitrate and sulfate.
6.5.2 Winter Study Objective 2: Evaluate Backbone Network
Five and ten minute average sulfate and nitrate concentrations will be examined forshort pulses of PM2.5 that can be attributed to nearby intermittent emissions or to small andshort-duration changes in wind direction. The correspondence of sulfur dioxide with sulfateat the Bakersfield site will likely represent contributions from nearby sources that can beseparated from more regional contributions.
The spatial variability of PM2.5 concentrations will also be evaluated for PM2.5 andspecific chemical components for different meteorological and emissions situations. Thelarge array of gradient sites will allow the presumption of secondary aerosol spatialuniformity to be evaluated throughout the region.
6.5.3 Winter Study Objective 3: Temporal and Spatial Distributions
Diurnal, weekly, and seasonal variability are likely to be different during winter thanduring other parts of the year when surface flows are better defined and more consistent.Changes in primary and secondary aerosol concentrations with time of day will be given
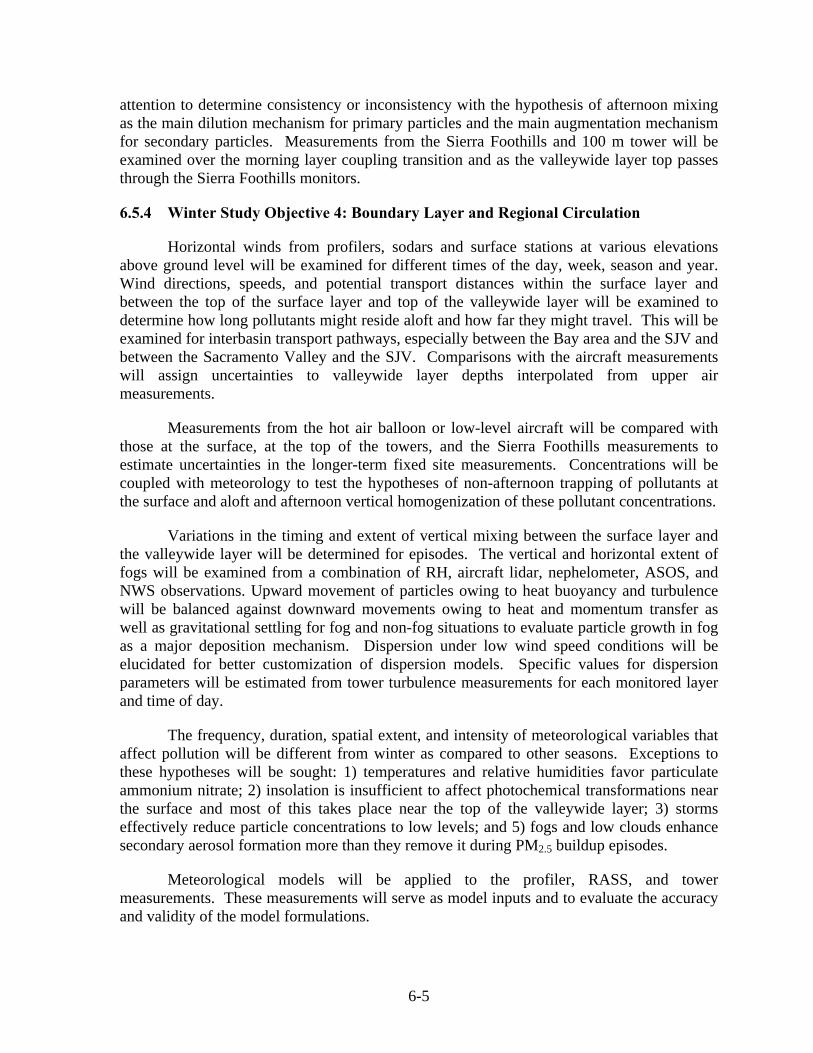
6-5
attention to determine consistency or inconsistency with the hypothesis of afternoon mixingas the main dilution mechanism for primary particles and the main augmentation mechanismfor secondary particles. Measurements from the Sierra Foothills and 100 m tower will beexamined over the morning layer coupling transition and as the valleywide layer top passesthrough the Sierra Foothills monitors.
6.5.4 Winter Study Objective 4: Boundary Layer and Regional Circulation
Horizontal winds from profilers, sodars and surface stations at various elevationsabove ground level will be examined for different times of the day, week, season and year.Wind directions, speeds, and potential transport distances within the surface layer andbetween the top of the surface layer and top of the valleywide layer will be examined todetermine how long pollutants might reside aloft and how far they might travel. This will beexamined for interbasin transport pathways, especially between the Bay area and the SJV andbetween the Sacramento Valley and the SJV. Comparisons with the aircraft measurementswill assign uncertainties to valleywide layer depths interpolated from upper airmeasurements.
Measurements from the hot air balloon or low-level aircraft will be compared withthose at the surface, at the top of the towers, and the Sierra Foothills measurements toestimate uncertainties in the longer-term fixed site measurements. Concentrations will becoupled with meteorology to test the hypotheses of non-afternoon trapping of pollutants atthe surface and aloft and afternoon vertical homogenization of these pollutant concentrations.
Variations in the timing and extent of vertical mixing between the surface layer andthe valleywide layer will be determined for episodes. The vertical and horizontal extent offogs will be examined from a combination of RH, aircraft lidar, nephelometer, ASOS, andNWS observations. Upward movement of particles owing to heat buoyancy and turbulencewill be balanced against downward movements owing to heat and momentum transfer aswell as gravitational settling for fog and non-fog situations to evaluate particle growth in fogas a major deposition mechanism. Dispersion under low wind speed conditions will beelucidated for better customization of dispersion models. Specific values for dispersionparameters will be estimated from tower turbulence measurements for each monitored layerand time of day.
The frequency, duration, spatial extent, and intensity of meteorological variables thataffect pollution will be different from winter as compared to other seasons. Exceptions tothese hypotheses will be sought: 1) temperatures and relative humidities favor particulateammonium nitrate; 2) insolation is insufficient to affect photochemical transformations nearthe surface and most of this takes place near the top of the valleywide layer; 3) stormseffectively reduce particle concentrations to low levels; and 5) fogs and low clouds enhancesecondary aerosol formation more than they remove it during PM2.5 buildup episodes.
Meteorological models will be applied to the profiler, RASS, and towermeasurements. These measurements will serve as model inputs and to evaluate the accuracyand validity of the model formulations.
6-6
6.5.5 Winter Study Objective 5: Source Zones of Influence and Contributions
PM2.5 chemical measurements will be used with the CMB model to estimate primarysource contributions to ambient concentrations for individual samples and annual averages.The CMB will use all gaseous and particulate organic and inorganic speciation data for thediurnal sampling periods. In addition to quantifying primary source contributions, the CMBanalysis will determine differences between primary emissions profiles and ambientconcentrations consistent with, and at odds with, secondary aerosol formation. The organiccompound measurements at the anchor sites will permit the distinction of diesel, cold start,high emitter, and hot stabilized vehicle exhaust, wood burning, cooking, and other organiccarbon sources to be distinguished by time of day. The afternoon samples will quantify theseurban-generated contributions that reach non-urban areas and presumably reach other urbanareas via the vertical mixing and valleywide layer transport pathway.
Outputs from the wind models will be used in transport and transformation models todetermine which source areas or specific sources could have made negligible, minor,moderate, large, or major contributions at each receptor. More careful attention to transportin the surface and valleywide layers will be needed in these models. Source contributionestimates at different locations will be compared to determine their consistency withemissions inventories and modeled zones of influence.
6.5.6 Winter Study Objective 6: Secondary Aerosol Sources
Aerosol equilibrium models will be applied to the continuous sulfate, nitrate,ammonia, and nitric acid measurements to verify the hypothesis that there is sufficientammonia to completely neutralize available acid throughout each day of each episode.
Organic gaseous precursors and particle organic compounds will be examined forchanges in abundances that indicate secondary aerosol formation
6.5.7 Winter Study Objective 7: Conceptual Model Refinement
Wintertime flows at the surface, within the valleywide layer, and above the layer willbe established for different synoptic conditions. These are currently unknown. The verticalmixing with reaction and transport aloft hypothesis in Section 3 will be tested. This is crucialto understanding the effect of one urban area’s emissions on pollution levels on other centralCalifornia urban areas during winter, especially for secondary aerosol components.
6.5.8 Winter Study Objective 8: Simulation Methods
Full-scale application of the most advanced emissions, meteorological, and air qualitymodels will be applied to the winter episodes. The winter measurements will supply initialand boundary conditions as model inputs. They will supply parameters for deposition anddispersion. They will supply substantial data for comparison with model outputs in order toevaluate which components of the models are not representing the physical and chemicalprocesses that occur during winter in central California.
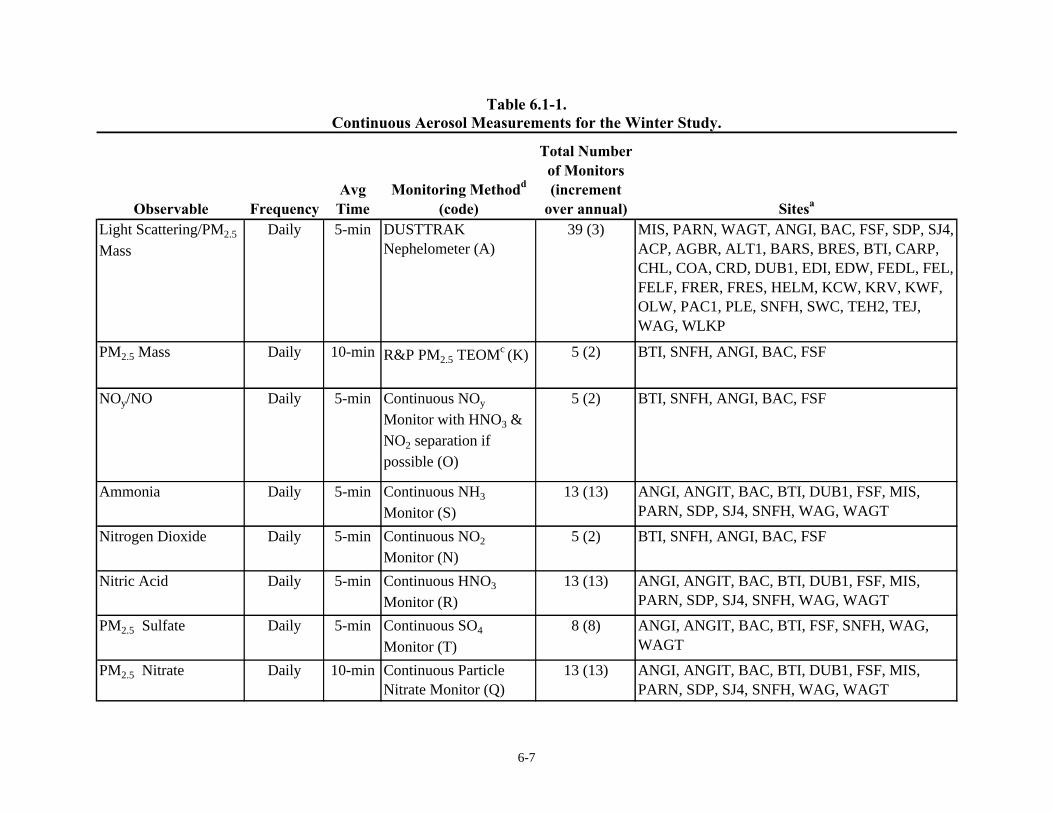
6-7
Table 6.1-1.Continuous Aerosol Measurements for the Winter Study.
Observable FrequencyAvg
TimeMonitoring Methodd
(code)
Total Number of Monitors (increment
over annual) Sitesa
Light Scattering/PM2.5
MassDaily 5-min DUSTTRAK
Nephelometer (A)39 (3) MIS, PARN, WAGT, ANGI, BAC, FSF, SDP, SJ4,
ACP, AGBR, ALT1, BARS, BRES, BTI, CARP, CHL, COA, CRD, DUB1, EDI, EDW, FEDL, FEL, FELF, FRER, FRES, HELM, KCW, KRV, KWF, OLW, PAC1, PLE, SNFH, SWC, TEH2, TEJ, WAG, WLKP
PM2.5 Mass Daily 10-min R&P PM2.5 TEOMc (K) 5 (2) BTI, SNFH, ANGI, BAC, FSF
NOy/NO Daily 5-min Continuous NOy
Monitor with HNO3 & NO2 separation if possible (O)
5 (2) BTI, SNFH, ANGI, BAC, FSF
Ammonia Daily 5-min Continuous NH3
Monitor (S)13 (13) ANGI, ANGIT, BAC, BTI, DUB1, FSF, MIS,
PARN, SDP, SJ4, SNFH, WAG, WAGT
Nitrogen Dioxide Daily 5-min Continuous NO2
Monitor (N)5 (2) BTI, SNFH, ANGI, BAC, FSF
Nitric Acid Daily 5-min Continuous HNO3
Monitor (R)13 (13) ANGI, ANGIT, BAC, BTI, DUB1, FSF, MIS,
PARN, SDP, SJ4, SNFH, WAG, WAGT
PM2.5 Sulfate Daily 5-min Continuous SO4
Monitor (T)8 (8) ANGI, ANGIT, BAC, BTI, FSF, SNFH, WAG,
WAGT
PM2.5 Nitrate Daily 10-min Continuous Particle Nitrate Monitor (Q)
13 (13) ANGI, ANGIT, BAC, BTI, DUB1, FSF, MIS, PARN, SDP, SJ4, SNFH, WAG, WAGT
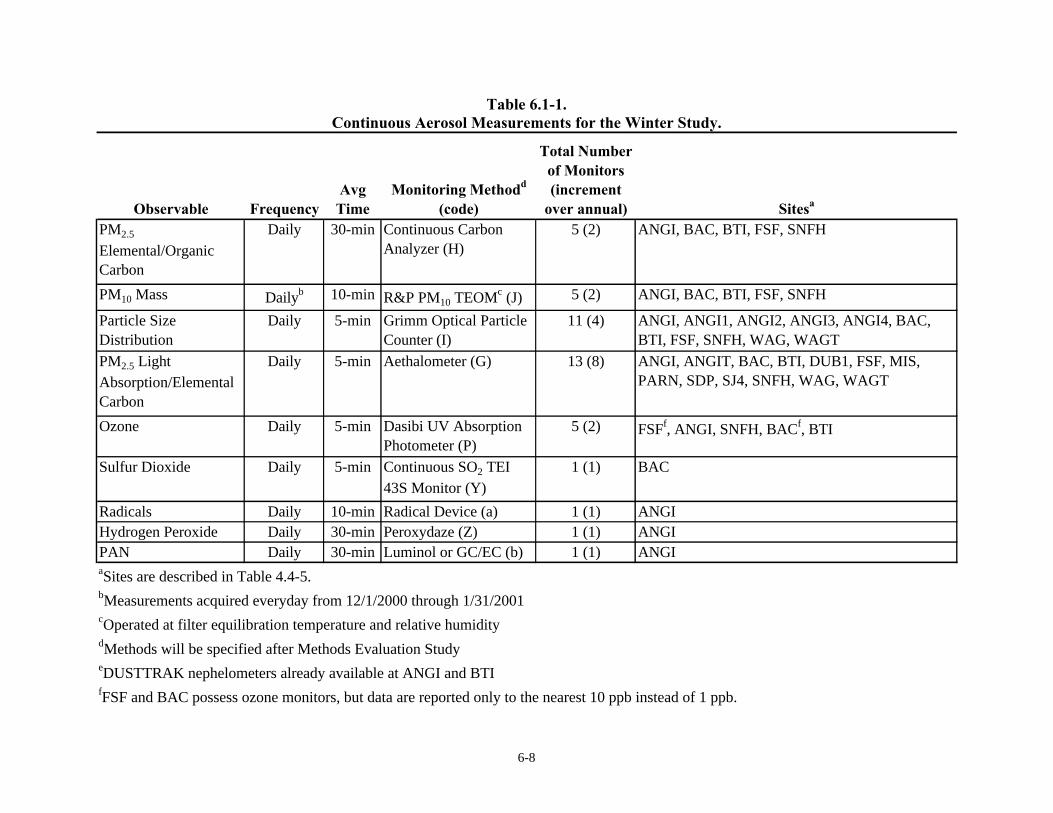
6-8
Table 6.1-1.Continuous Aerosol Measurements for the Winter Study.
Observable FrequencyAvg
TimeMonitoring Methodd
(code)
Total Number of Monitors (increment
over annual) Sitesa
PM2.5
Elemental/Organic Carbon
Daily 30-min Continuous Carbon Analyzer (H)
5 (2) ANGI, BAC, BTI, FSF, SNFH
PM10 Mass Dailyb 10-min R&P PM10 TEOMc (J) 5 (2) ANGI, BAC, BTI, FSF, SNFH
Particle Size Distribution
Daily 5-min Grimm Optical Particle Counter (I)
11 (4) ANGI, ANGI1, ANGI2, ANGI3, ANGI4, BAC, BTI, FSF, SNFH, WAG, WAGT
PM2.5 Light Absorption/Elemental Carbon
Daily 5-min Aethalometer (G) 13 (8) ANGI, ANGIT, BAC, BTI, DUB1, FSF, MIS, PARN, SDP, SJ4, SNFH, WAG, WAGT
Ozone Daily 5-min Dasibi UV Absorption Photometer (P)
5 (2) FSFf, ANGI, SNFH, BACf, BTI
Sulfur Dioxide Daily 5-min Continuous SO2 TEI 43S Monitor (Y)
1 (1) BAC
Radicals Daily 10-min Radical Device (a) 1 (1) ANGIHydrogen Peroxide Daily 30-min Peroxydaze (Z) 1 (1) ANGIPAN Daily 30-min Luminol or GC/EC (b) 1 (1) ANGIaSites are described in Table 4.4-5.bMeasurements acquired everyday from 12/1/2000 through 1/31/2001cOperated at filter equilibration temperature and relative humiditydMethods will be specified after Methods Evaluation StudyeDUSTTRAK nephelometers already available at ANGI and BTIfFSF and BAC possess ozone monitors, but data are reported only to the nearest 10 ppb instead of 1 ppb.
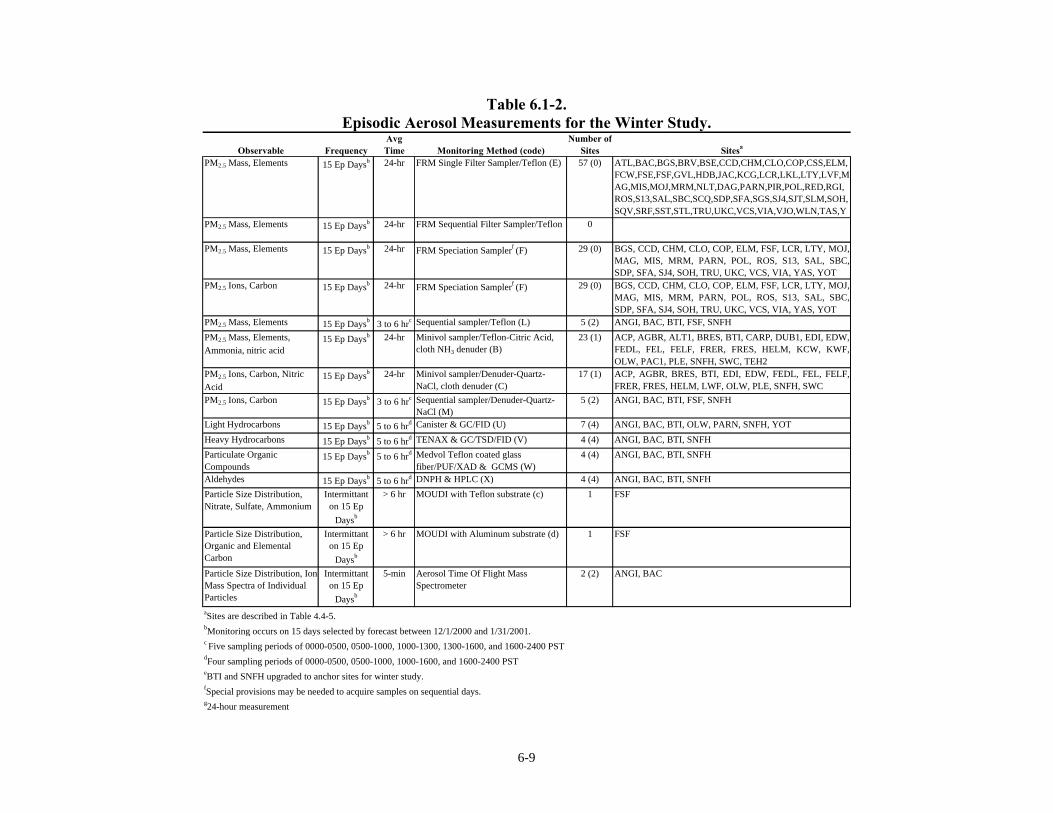
6-9
Table 6.1-2.Episodic Aerosol Measurements for the Winter Study.
Observable FrequencyAvg Time Monitoring Method (code)
Number of Sites Sitesa
PM2.5 Mass, Elements 15 Ep Daysb 24-hr FRM Single Filter Sampler/Teflon (E) 57 (0) ATL,BAC,BGS,BRV,BSE,CCD,CHM,CLO,COP,CSS,ELM,FCW,FSE,FSF,GVL,HDB,JAC,KCG,LCR,LKL,LTY,LVF,MAG,MIS,MOJ,MRM,NLT,DAG,PARN,PIR,POL,RED,RGI,ROS,S13,SAL,SBC,SCQ,SDP,SFA,SGS,SJ4,SJT,SLM,SOH,SQV,SRF,SST,STL,TRU,UKC,VCS,VIA,VJO,WLN,TAS,Y
PM2.5 Mass, Elements 15 Ep Daysb 24-hr FRM Sequential Filter Sampler/Teflon 0
PM2.5 Mass, Elements 15 Ep Daysb 24-hr FRM Speciation Samplerf (F) 29 (0) BGS, CCD, CHM, CLO, COP, ELM, FSF, LCR, LTY, MOJ,MAG, MIS, MRM, PARN, POL, ROS, S13, SAL, SBC,SDP, SFA, SJ4, SOH, TRU, UKC, VCS, VIA, YAS, YOT
PM2.5 Ions, Carbon 15 Ep Daysb 24-hr FRM Speciation Samplerf (F) 29 (0) BGS, CCD, CHM, CLO, COP, ELM, FSF, LCR, LTY, MOJ,MAG, MIS, MRM, PARN, POL, ROS, S13, SAL, SBC,SDP, SFA, SJ4, SOH, TRU, UKC, VCS, VIA, YAS, YOT
PM2.5 Mass, Elements 15 Ep Daysb 3 to 6 hrc Sequential sampler/Teflon (L) 5 (2) ANGI, BAC, BTI, FSF, SNFH
PM2.5 Mass, Elements, Ammonia, nitric acid
15 Ep Daysb 24-hr Minivol sampler/Teflon-Citric Acid, cloth NH3 denuder (B)
23 (1) ACP, AGBR, ALT1, BRES, BTI, CARP, DUB1, EDI, EDW,FEDL, FEL, FELF, FRER, FRES, HELM, KCW, KWF,OLW, PAC1, PLE, SNFH, SWC, TEH2
PM2.5 Ions, Carbon, Nitric Acid
15 Ep Daysb 24-hr Minivol sampler/Denuder-Quartz-NaCl, cloth denuder (C)
17 (1) ACP, AGBR, BRES, BTI, EDI, EDW, FEDL, FEL, FELF,FRER, FRES, HELM, LWF, OLW, PLE, SNFH, SWC
PM2.5 Ions, Carbon 15 Ep Daysb 3 to 6 hrc Sequential sampler/Denuder-Quartz-NaCl (M)
5 (2) ANGI, BAC, BTI, FSF, SNFH
Light Hydrocarbons 15 Ep Daysb 5 to 6 hrd Canister & GC/FID (U) 7 (4) ANGI, BAC, BTI, OLW, PARN, SNFH, YOT
Heavy Hydrocarbons 15 Ep Daysb 5 to 6 hrd TENAX & GC/TSD/FID (V) 4 (4) ANGI, BAC, BTI, SNFH
Particulate Organic Compounds
15 Ep Daysb 5 to 6 hrd Medvol Teflon coated glass fiber/PUF/XAD & GCMS (W)
4 (4) ANGI, BAC, BTI, SNFH
Aldehydes 15 Ep Daysb 5 to 6 hrd DNPH & HPLC (X) 4 (4) ANGI, BAC, BTI, SNFH
Particle Size Distribution, Nitrate, Sulfate, Ammonium
Intermittant on 15 Ep
Daysb
> 6 hr MOUDI with Teflon substrate (c) 1 FSF
Particle Size Distribution, Organic and Elemental Carbon
Intermittant on 15 Ep
Daysb
> 6 hr MOUDI with Aluminum substrate (d) 1 FSF
Particle Size Distribution, Ion Mass Spectra of Individual Particles
Intermittant on 15 Ep
Daysb
5-min Aerosol Time Of Flight Mass Spectrometer
2 (2) ANGI, BAC
aSites are described in Table 4.4-5.bMonitoring occurs on 15 days selected by forecast between 12/1/2000 and 1/31/2001.c Five sampling periods of 0000-0500, 0500-1000, 1000-1300, 1300-1600, and 1600-2400 PST dFour sampling periods of 0000-0500, 0500-1000, 1000-1600, and 1600-2400 PST eBTI and SNFH upgraded to anchor sites for winter study.fSpecial provisions may be needed to acquire samples on sequential days.g24-hour measurement
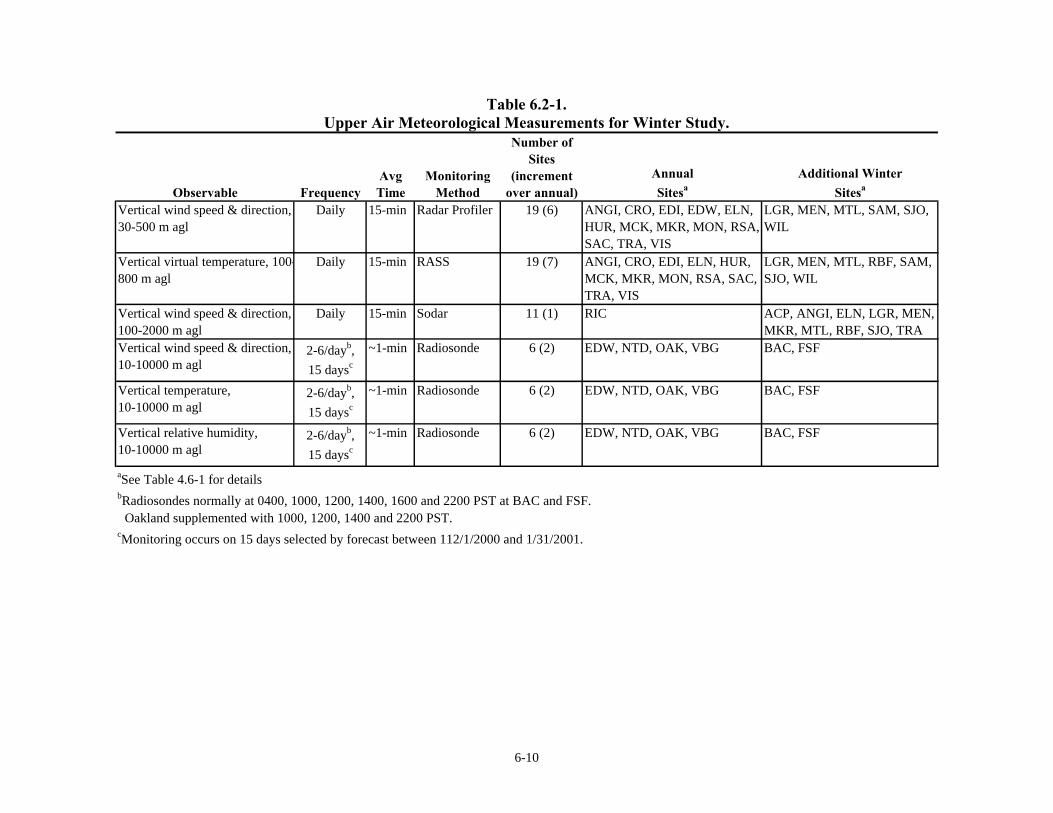
6-10
Table 6.2-1.Upper Air Meteorological Measurements for Winter Study.
Observable FrequencyAvg Time
Monitoring Method
Number of Sites
(increment over annual)
Annual
Sitesa
Additional Winter
Sitesa
Vertical wind speed & direction, 30-500 m agl
Daily 15-min Radar Profiler 19 (6) ANGI, CRO, EDI, EDW, ELN, HUR, MCK, MKR, MON, RSA, SAC, TRA, VIS
LGR, MEN, MTL, SAM, SJO, WIL
Vertical virtual temperature, 100-800 m agl
Daily 15-min RASS 19 (7) ANGI, CRO, EDI, ELN, HUR, MCK, MKR, MON, RSA, SAC, TRA, VIS
LGR, MEN, MTL, RBF, SAM, SJO, WIL
Vertical wind speed & direction, 100-2000 m agl
Daily 15-min Sodar 11 (1) RIC ACP, ANGI, ELN, LGR, MEN, MKR, MTL, RBF, SJO, TRA
Vertical wind speed & direction, 10-10000 m agl
2-6/dayb,
15 daysc
~1-min Radiosonde 6 (2) EDW, NTD, OAK, VBG BAC, FSF
Vertical temperature, 10-10000 m agl
2-6/dayb,
15 daysc
~1-min Radiosonde 6 (2) EDW, NTD, OAK, VBG BAC, FSF
Vertical relative humidity, 10-10000 m agl
2-6/dayb,
15 daysc
~1-min Radiosonde 6 (2) EDW, NTD, OAK, VBG BAC, FSF
aSee Table 4.6-1 for detailsbRadiosondes normally at 0400, 1000, 1200, 1400, 1600 and 2200 PST at BAC and FSF. Oakland supplemented with 1000, 1200, 1400 and 2200 PST.cMonitoring occurs on 15 days selected by forecast between 112/1/2000 and 1/31/2001.
7-1
7. FALL MEASUREMENT PROGRAM
The fall measurement program is designed to understand the detailed causes of PM10
as well as PM2.5 concentrations. The major component of the coarse particle fraction of PM10
during fall is fugitive dust. The major components of the PM2.5 of PM10 are ammoniumnitrate, organic carbon, and fugitive dust. A significant part of the organic carbon also arisesfrom dust contributions owing to a 10% to 20% abundance of carbon in most centralCalifornia dust emissions.
7.1 CRPAQS Fall Study Measurements
The fall study period is intended to bracket in time activities associated with thecotton harvest peak in the Corcoran area. The study domain in Figure 7.1-1 is ofneighborhood rather than urban or regional scale. This is imbedded in the annual averagemonitoring measurements that take place on a regional scale. The main objectives of the Fallstudy are: 1) determine the zone of influence of and contributions from different fugitive dustsources; and 2) evaluate the causes of moderate ammonium nitrate concentrations under clearsky stagnation conditions.
The fall study will be conducted in and around Corcoran, CA, where the highest PM10
concentrations have been measured in previous years. Twenty-four hour duration PM10
samples will be acquired everyday on Teflon filters amenable to elemental analysis at theCorcoran and Hanford sites. These will be used to determine how PM10 and its coarsefugitive dust fraction throughout this period of traditionally high PM10 levels.
Figure 7.1-1 shows the satellite PM10 network that will be operated for 60 daysbetween 9/1/2000 and 10/31/2000. Thirty-one satellite sites with portable PM10
nephelometers will be operated in and around the Corcoran area to detect dust clouds thatmove through the area and the contributions from nearby sources. These will beaccompanied at five sites by Minivol PM10 samplers with Teflon and quartz filters toevaluate chemical composition. Measurements from the continuous monitors will beevaluated every two weeks over the 60-day campaign to determine which sites are hot-spots,and the Minivols will be moved throughout the networks to chemically characterize the PM10
at some of these sites.
Up to five surface meteorological stations will be located within and around theCorcoran satellite network to acquire five-minute average wind speed and wind direction.Measurements from these sites will be compared with the measurements from the long-termstation at Corcoran to determine the extent to which it represents transport directions and dustsuspension properties induced by meteorology. These measurements will also be used toassign directionality to pulses measured by continuous nephelometers and to relate thesepulses to wind erosion during gusts.
A sodar will operate near the Corcoran airport to evaluate the evolution of theboundary layer and to quantify the potential transport distances of materials that aresuspended above the surface layer.
7-2
These measurements complement and supplement those acquired as part of the long-term annual PM10 backbone network and the seven-site supplemental PM10 measurements inthe annual study. Taken together, they constitute a large coverage of background, interbasintransport, intrabasin gradient, source-oriented, and community exposure sites, with specialattention given to the central San Joaquin Valley. The sites in Figure 7.1-1 receptor zone ofrepresentation and source zone of influence sites.
7.2 Fall Special Studies
Two special studies will be conducted as part of the fall term measurement program:1) in situ single particle quntification; and 2) fugitive dust marker measurements.
7.2.1 In Situ Single Particle Quantification
This experiment intends to examine individual particles to determine their formationmechanisms and sources. Time of flight mass spectrometers will be deployed for shortperiods at the Corcoran and Fresno sites to quantify the composition and size of individualparticles. The timing, size, and chemical nature of individual particles with a large chemicalcomponent will be contrasted between these two sites to evaluate the extent to which urbanand non-urban fugitive dust sources affect PM10 levels in a large metropolitan area (Fresno)and a nearby rural town (Corcoran).
7.2.2 Fugitive Dust Marker Measurements
Specific markers of different fugitive dust sources will be quantified on 24-hour PM10
samples in Fresno, Corcoran, and Angiola to distinguish between specific sources such asroad dust, construction dust, and agricultural dusts associated with different crops andfarming operations. Sampling and analysis methods for this part of the fall campaign will befinalized after the Fugitive Dust Characterization Study. This will be the first ambient test ofchemical and physical markers found in distinct sources that might quantify theircontributions to receptors. Marker categories include microscopic size and composition,pesticides, lipids, microbes, and fatty acids.
This study may require 24-hour PM10 samples at each site on: 1) Teflon membranefilters for high sensitivity XRF or PIXE analyses; 2) Teflon membrane filters for FTIRanalysis; 3) quartz filters for ion and carbon analyses; 4) quartz filters for volatilization massspectrometric analysis; 5) hivol quartz filters for detailed organic analysis; and 6) Nucelporefilters for microscopic analysis.
7-3
7.3 Uses of Fall Measurements to Attain Objectives
The following sub-sections briefly describe how the measurements described for thefall study will be used to accomplish each of the CRPAQS field study objectives specified inSection 1.
7.3.1 Fall Study Average Objective 1: Quality Data Base
Performance tests, quality audits, and measurement comparisons will be used toevaluate the accuracy, precision, validity, and completeness of the CRPAQS database.Special attention will be given to PM10 measurement accuracy and precision formeasurements acquired in this study.
7.3.2 Fall Study Objective 2: Evaluate Backbone Network
Data will be used to evaluate the PM10 network, especially the sites that remainwithin the fall study domain.
7.3.3 Fall Study Objective 3: Temporal and Spatial Distributions
Spatial and temporal analyses similar to those specified in Section 5 will be applied tothe PM10 measurements, especially those from the portable nephelometers. Commonalitiesand differences with respect to the PM2.5 variations will be sought. The hypothesis, that thePM10 zone of representation is much smaller than the PM2.5 zone of representation, will betested by comparing chemical concentrations from the satellite sites.
7.3.4 Fall Study Objective 4: Boundary Layer and Regional Circulation
Micrometeorological and particle size measurements from the Angiola tower willdetermine which sizes attain elevations sufficient to be transported long distances by windsaloft. Horizontal winds aloft will be applied to concentrations measured at the top of the 100m tower to estimate the directions and distances that coarse particles might reach populatedurban areas.
7.3.5 Fall Study Objective 5: Source Zones of Influence and Contributions
Chemical and physical measurements will be used with the CMB model to estimateprimary source contributions to ambient PM10 concentrations at Fresno and Angiola. Thegoal of these source apportionments will be to distinguish among paved road dust,agricultural dust, construction dust, and dust raised by wind from exposed areas. The urbanand rural concentrations of fugitive dust markers will be compared and contrasted todetermine how much urban and non-urban dust sources intermix.
7.3.6 Fall Study Objective 6: Secondary Aerosol Sources
Ammonia distributions measured in the satellite network will be examined todetermine the zone of influence for ammonia emitters in the Corcoran area.

7-4
7.3.7 Fall Study Objective 7: Conceptual Model Refinement
The clear sky stagnation conceptual model will be examined and updated.
7.3.8 Fall Study Objective 8: Simulation Methods
Emissions models, especially for ammonia and fugitive dust, will be compared withambient measurements and emissions surveys during this study period.
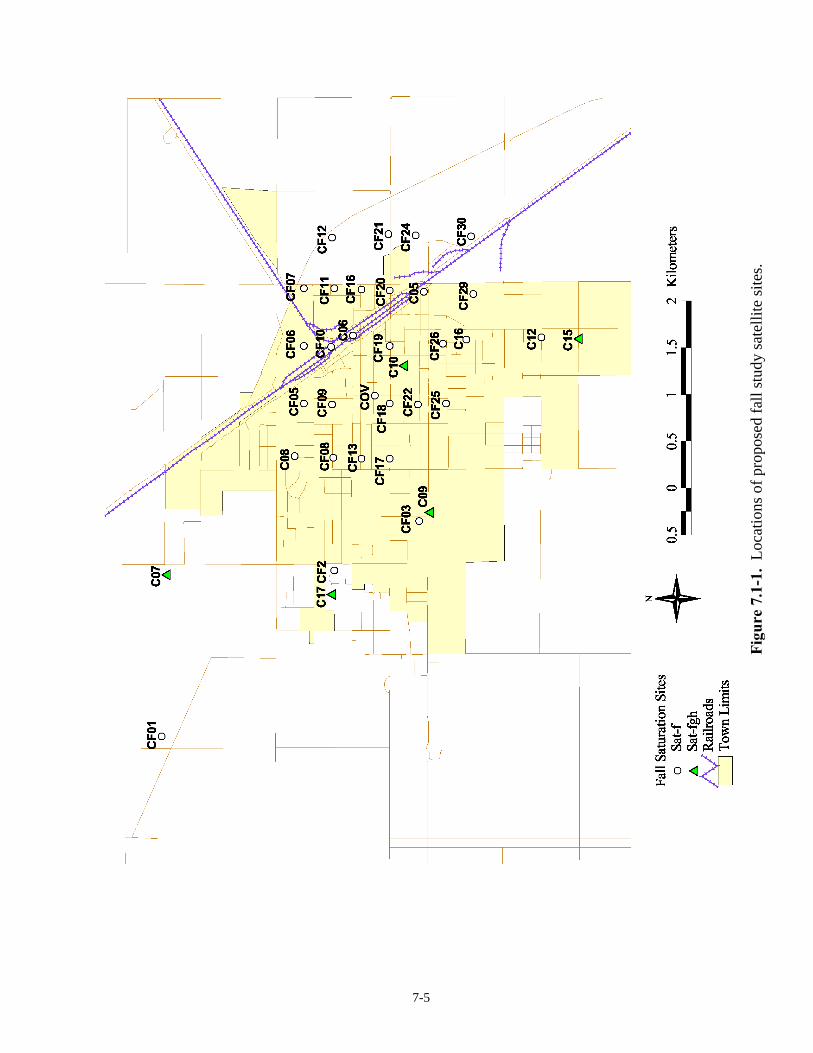
7-5
Fig
ure
7.1
-1.
Loc
atio
ns o
f pr
opos
ed f
all s
tudy
sat
ellit
e si
tes.