4 Macroeconomic Environment Environment 17 4 Macroeconomic Environment ... Chart 4.1.6 Proxy for...
27
Macroeconomic Environment 17 4 Macroeconomic Environment The U.S. economy expanded at a moderate pace in 2010 and early 2011. The economy is healing slowly from the lingering effects of the extraordinary financial market dislocations in 2008–09 and the severe declines in employment and output (Chart 4.0.1). Businesses have increased investment, and consumers have increased spending (Chart 4.0.2). However, construction and housing demand remain depressed, the unemployment rate is elevated, and the gains in total employment have been insufficient to raise the employment-population ratio. Most foreign economies also continue to recover from the most severe global downturn since the Great Depression, albeit at differing paces. Emerging economies, which suffered fewer financial disruptions from the crisis, have been able to recover more quickly, and many of those economies have returned to or exceeded their previous trend growth rate. Recovery in the advanced economies has been slowed by the weakness of the financial sector, and many have not yet reached their pre-crisis level of economic activity. With interest rates in advanced economies at historically low levels to support economic growth, funds have flowed to emerging markets, where returns are relatively higher. Political tensions in North Africa and the Middle East, and the natural disaster in Japan added to uncertainty in the first half of 2011. The recession depressed tax revenues and required additional public sector spending, leading to substantial increases in government debt in many advanced economies (Charts 4.0.3 and 4.0.4). For the most part, financial markets have been able to smoothly accommodate elevated government borrowing, as private savers have increased their demand for government debt. However, certain governments and financial institutions in peripheral Europe have encountered severe difficulties in maintaining access to private financial market funding. As the global economy continues to recover, governments Chart 4.0.1 Real GDP Growth and the Unemployment Rate -8 -4 0 4 8 12 1995 1999 2003 2007 2011 2 4 6 8 10 12 Percent Change – Annual Rate Percent Source: BLS and BEA GDP Growth (left axis) Unemployment Rate (right axis) Chart 4.0.2 Real GDP Growth and Its Components -12 -10 -8 -6 -4 -2 0 2 4 6 8 10 12 2007:Q1 2008:Q1 2009:Q1 2010:Q1 2011:Q1 -12 -10 -8 -6 -4 -2 0 2 4 6 8 10 12 Percent Contribution Percent Change – Annual Rate Source: BEA Personal Consumption Expenditures Residential Investment + Structures Government Consumption and Investment Net Exports GDP Growth (right axis) left axis Equipment and Software left axis Change in Inventories
-
Upload
vuongtuong -
Category
Documents
-
view
228 -
download
1
Transcript of 4 Macroeconomic Environment Environment 17 4 Macroeconomic Environment ... Chart 4.1.6 Proxy for...

Macroeconomic Environment 17
4 Macroeconomic Environment
The U.S. economy expanded at a moderate pace in 2010 and early 2011. The economy is healing slowly from the lingering effects of the extraordinary financial market dislocations in 2008–09 and the severe declines in employment and output (Chart 4.0.1). Businesses have increased investment, and consumers have increased spending (Chart 4.0.2). However, construction and housing demand remain depressed, the unemployment rate is elevated, and the gains in total employment have been insufficient to raise the employment-population ratio.
Most foreign economies also continue to recover from the most severe global downturn since the Great Depression, albeit at differing paces. Emerging economies, which suffered fewer financial disruptions from the crisis, have been able to recover more quickly, and many of those economies have returned to or exceeded their previous trend growth rate. Recovery in the advanced economies has been slowed by the weakness of the financial sector, and many have not yet reached their pre-crisis level of economic activity. With interest rates in advanced economies at historically low levels to support economic growth, funds have flowed to emerging markets, where returns are relatively higher. Political tensions in North Africa and the Middle East, and the natural disaster in Japan added to uncertainty in the first half of 2011.
The recession depressed tax revenues and required additional public sector spending, leading to substantial increases in government debt in many advanced economies (Charts 4.0.3 and 4.0.4). For the most part, financial markets have been able to smoothly accommodate elevated government borrowing, as private savers have increased their demand for government debt. However, certain governments and financial institutions in peripheral Europe have encountered severe difficulties in maintaining access to private financial market funding. As the global economy continues to recover, governments
Chart 4.0.1 Real GDP Growth and the Unemployment Rate
-8
-4
0
4
8
12
1995 1999 2003 2007 20112
4
6
8
10
12
4.0.1 Real GDP Growth and the Unemployment RatePercent Change – Annual Rate Percent
Source: BLS and BEA
GDP Growth (left axis)
Unemployment Rate (right axis)
Chart 4.0.2 Real GDP Growth and Its Components
-12-10
-8-6-4-202468
1012
2007:Q1 2008:Q1 2009:Q1 2010:Q1 2011:Q1-12-10-8-6-4-2024681012
4.0.2 Real GDP Growth and Its ComponentsPercent Contribution Percent Change – Annual Rate
Source: BEA
Personal Consumption ExpendituresResidential Investment + StructuresGovernment Consumption and Investment
Net Exports
GDP Growth (right axis)
left axis
Equipment and Software
left axis Change in Inventories

18 2011 FSOC Annual Report
face the challenge of rebalancing revenue and expenditures.
4.1 Provision of Financial Services to the Real Economy
Functions of the Financial SystemThe financial system has three primary functions: (1) credit flow facilitation, (2) risk transfer, and (3) transaction and payment services.
Credit flows: A primary function of the financial system is to facilitate the flow of funds from savers to borrowers at prices that appropriately compensate all parties for the inherent riskiness of lending; hence, financial markets and their participants play a key role in price discovery.
Risk transfer: Another key function of the financial system is to facilitate the efficient allocation of risk across households and businesses.
Transaction and payment services: The financial system is also responsible for providing reliable and robust transaction and payment services to the real economy.
4.1.1 Credit Flows
The reduction in credit flows to households and businesses during the crisis reflected both a decline in demand for credit and a reduction in the supply of available credit. Combined credit flows to businesses and households have started to increase. However, persistent weakness in real estate markets continues to restrain demand for and supply of mortgage credit.
Before the financial crisis, many households and financial market participants increased their debt loads. Some of this credit flowed to borrowers with limited ability, and at times limited incentives, to repay their loans. Further, some companies that originated mortgages and sold them for securitization were compensated on the basis of volume and did not always retain a stake in the mortgages. This meant that they had less incentive than traditional
Chart 4.0.3 United States Nonfinancial Net Debt Flows
-0.4
-0.2
0.0
0.2
0.4
0.6
0.8
1.0
2000:Q1 2002:Q1 2004:Q1 2006:Q1 2008:Q1 2010:Q1-0.4
-0.2
0.0
0.2
0.4
0.6
0.8
1.0
4.0.3 United States Nonfinancial Net Debt FlowsTrillions of US$ Trillions of US$
Private Nonfinancial SectorGeneral Government
Source: Flow of Funds Note: At a quarterly rate.
Chart 4.0.4 Euro Area Nonfinancial Net Debt Flows
-0.4
-0.2
0.0
0.2
0.4
0.6
0.8
1.0
2000:Q1 2002:Q1 2004:Q1 2006:Q1 2008:Q1 2010:Q1-0.4
-0.2
0.0
0.2
0.4
0.6
0.8
1.0
4.0.4 Euro Area Nonfinancial Net Debt FlowsTrillions of Euros Trillions of Euros
Private Nonfinancial SectorGeneral Government
Source: Eurostat Note: At a quarterly rate.
Chart 4.1.1 Net Debt Outstanding as a Percent of GDP
40
50
60
70
80
90
100
110
120
130
2000:Q1 2002:Q1 2004:Q1 2006:Q1 2008:Q1 2010:Q140
50
60
70
80
90
100
110
120
130
4.1.1 Net Debt Outstanding as a Percent of GDPPercent Percent
Source: Flow of Funds, BEA
Nonfinancial Corporate
Financial Institutions
U.S. General Government
Household

Macroeconomic Environment 19
originate-to-hold lenders to underwrite loans to high standards.
The crisis triggered significant reductions in the flow of credit and an unprecedented deleveraging by consumers, businesses, and, most dramatically, the financial sector itself. Even as the recession stressed government budgets, public borrowing largely replaced private borrowing in the credit markets (Chart 4.1.1). These trends have begun to moderate, and net flows of credit to the private nonfinancial sector have turned marginally positive owing to increases in both demand for and supply of credit.
Credit Flows to the Corporate Sector
The nonfinancial corporate sector continues to recover as increased demand and low labor costs contribute to profitability. In the aggregate, corporate borrowers are experiencing more favorable financing conditions from banks, bond markets, and syndicated loan markets, which allow large corporate firms to finance their activities on better terms. For instance, bank underwriting standards have eased from the extremely tight conditions at the peak of the crisis (Chart 4.1.2).
Credit intermediation for large corporations in the United States is characterized by a high degree of funding through debt capital markets rather than through banks. Debt capital markets, somewhat impaired during the crisis, are again functioning well. Corporate bond markets have recovered, and issuance of investment-grade and speculative-grade bonds has been robust in recent months (Chart 4.1.3). Spreads between yields on corporate bonds and comparable-maturity U.S. Treasury securities have narrowed, although they remain above the very low pre-crisis levels (Chart 4.1.4). In addition, new equity issuance has been robust lately and M&A activity has picked up, indicating that credit has become more available.
Corporate leveraged buyouts (LBOs) remain well below the elevated levels seen during the last credit cycle, although they have increased somewhat as credit conditions have improved
Chart 4.1.2 Bank Business Lending Standards and Demand
-80
-60
-40
-20
0
20
40
60
80
100
2000:Q1 2002:Q1 2004:Q1 2006:Q1 2008:Q1 2010:Q1
-80
-60
-40
-20
0
20
40
60
80
100
4.1.2 Bank Business Lending Standards and Demand
Net Percent Net Percent
Source: SLOOS
Reporting
Increased
Demand
Reporting
Higher Spreads
Reporting
Tightened
Standards
Note: For C&I loans to medium and large firms.
Chart 4.1.3 Corporate Bond Market Issuance
0
20
40
60
80
100
2005 2006 2007 2008 2009 2010 20110
20
40
60
80
100
4.1.3 Corporate Bond Market IssuanceBillions of US$ Billions of US$
Source: Dealogic
Investment-GradeHigh-Yield
Note: U.S. marketed issuance only.
Chart 4.1.4 Corporate Bond Spreads4.1.4 Corporate Bond Spreads
Source: Bloomberg
0
400
800
1200
1600
2000
2400
2005 2006 2007 2008 2009 2010 20110
400
800
1200
1600
2000
2400Basis Points Basis Points
Investment-Grade
High-Yield
Note: Spreads to Treasuries.

20 2011 FSOC Annual Report
(Chart 4.1.5). Private equity firms continue to hold high levels of committed but uninvested capital available for LBO activity.
Credit Flows to the Small Business Sector
Banks are a large source of credit for small businesses: banks provide these businesses with term loans, credit cards, credit lines, commercial mortgages, and capital leases. Regulatory data on business loans less than $1 million and agricultural loans less than $500,000 suggest that small business lending had increased solidly in the years leading up to 2008, before declining by more than 10 percent through 2010 (Chart 4.1.6). A number of related factors explain the decline, including the general dislocation of credit during the crisis, the adverse effect of the crisis on borrowers’ balance sheets and on the value of their available collateral, and the reduced demand for credit in light of lower inventory investment and cuts in investment and payrolls as these businesses have experienced weak demand and stagnant prospective sales.
In the National Federation of Independent Business (NFIB) June 2011 Small Business Survey, the number of small businesses reporting that credit is “harder to obtain” has declined to mid-2008 levels. Small businesses continue to cite weak demand for their products or services as the main factor limiting growth. Additionally, with more than half of credit to small businesses secured by some form of real estate, borrowing capacity is limited by the ongoing stress in real estate.
Credit Flows to the Household Sector
Consumer spending has risen at a moderate pace since mid-2009, contributing to overall economic growth. However, consumer credit flows, which fell sharply during the crisis, have only recently begun to recover. The modest recovery of these flows reflects restraints on the availability of consumer credit as well as subdued demand as households face weaker income prospects. Nonmortgage lending to consumers, which declined for several years, began growing in 2010, driven by nonrevolving credit (Chart 4.1.7). The amount of revolving credit available to consumers has been
Chart 4.1.5 North American Completed LBOs
0
50
100
150
200
250
2003:Q1 2005:Q1 2007:Q1 2009:Q1 2011:Q10
50
100
150
200
250
4.1.5 North American Completed LBOsBillions of US$ Number of Deals
Source: Thomson Reuters
Deal Value Net Debt of Target (left axis)
Number of Deals (right axis)
Chart 4.1.6 Proxy for Small Business Lending
500
550
600
650
700
750
800
2000:Q2 2002:Q2 2004:Q2 2006:Q2 2008:Q2 2010:Q2500
550
600
650
700
750
800
4.1.6 Proxy for Small Business LendingBillions of US$ Billions of US$
Source: FDIC Note: Data from all FDIC-insured institutions; includes C&I and NFNR loans less than 1MM, agriculture and farm loans less than 500k.
Chart 4.1.7 Nonmortgage Consumer Credit Flows
-4
-3
-2
-1
0
1
2
3
4
5
2000 2002 2004 2006 2008 2010-4
-3
-2
-1
0
1
2
3
4
5
4.1.7 Nonmortgage Consumer Credit Flows% Change – 3-month % Change – 3-month
Source: FR G-19
Nonrevolving
Revolving

Macroeconomic Environment 21
substantially reduced, although aggregate borrowing capacity remains considerable (Chart 4.1.8). Demand for auto financing has risen along with the increase in vehicle purchases from the lows of the crisis. Student loan volumes increased during the downturn in part because of rising enrollments and increased tuition costs; these volumes have been increasingly supported by government-guaranteed loan programs.
Real Estate and Mortgage Markets
The housing sector remains depressed. To date, real residential investment has fallen nearly 60 percent since its peak in early 2006. Housing starts and sales of new homes have remained near record low levels, and distressed sales have increased, recently comprising 46 percent of all sales (Charts 4.1.9 and 4.1.10). As a result of the pullback in mortgage lending and an elevated level of charge-offs, overall mortgage debt outstanding contracted for two years (Chart 4.1.11).
Home prices face continued downward pressure from excess inventory, lackluster demand, and distressed sales, in part coming from foreclosures. After stabilizing in late 2009 and early 2010, home prices have fallen further since the summer of 2010. The CoreLogic repeat sales home price index, which is representative of conforming and non-conforming mortgages, is back down to its mid-2003 levels, about one-third below its 2006 peak (Chart 4.1.12). The Federal Reserve Board’s Senior Loan Officer Opinion Survey for April 2011 showed that demand for residential mortgages at banks continued to decrease.
Some of the housing market fundamentals have shown signs of improvement. Indexes of affordability based on current interest rates, median incomes, and median home prices have risen to historic highs (Chart 4.1.13). The very low levels of new home construction in recent years have helped trim the backlog of excess new homes for sale. In addition, the unusually low levels of household formation over the past several years could reverse once the labor market improves sufficiently, suggesting the possibility of pent-up demand for housing.
Chart 4.1.8 Credit Card Limit and Outstanding Balance
0
1
2
3
4
2000:Q1 2002:Q1 2004:Q1 2006:Q1 2008:Q1 2010:Q1-20
-10
0
10
20
30
40
4.1.8 Credit Card Limit and Outstanding BalanceTrillions of US$ % Change – Annual Rate
Credit Card Available Credit (left axis)Credit Card Balance (left axis)
Source: FRBNY Consumer Credit Panel
Growth in Credit Card Balance (right axis)
Chart 4.1.9 Single-Family New Home Starts and Sales
0
400
800
1200
1600
2000
2000 2002 2004 2006 2008 20100
400
800
1200
1600
2000
4.1.9 Single-Family New Home Starts and SalesThousands of Units, Annual Rate Thousands of Units, Annual Rate
Source: Census Bureau
Starts
Sales
Chart 4.1.10 Distressed Sales Share of Total Home Sales
0
10
20
30
40
50
2000 2002 2004 2006 2008 20100
10
20
30
40
50
4.1.10 Distressed Sales Share of Total Home SalesPercent Percent
Source: CoreLogic

22 2011 FSOC Annual Report
More than offsetting the developments in these fundamentals, ongoing operational deficiencies and legal challenges in the processing of foreclosure filings have significantly slowed the foreclosure process, adding to a growing inventory of distressed properties. Moreover, the government-sponsored enterprises (GSEs) Fannie Mae and Freddie Mac, as well as the Federal Housing Administration (FHA) and the Department of Veterans Affairs (VA)—which together account for the guarantee and insurance of more than 90 percent of originations—have tightened their underwriting standards. Standards have been tightened across product, credit score, and loan-to-value (LTV) spectrums, and fewer loans with low down payments are being guaranteed. FICO scores on mortgage originations have risen sharply, reflecting the tighter underwriting standards as well as the characteristics of borrowers who are applying for credit (Chart 4.1.14).
On the other hand, FHA/VA loans, which typically have higher LTVs and hence greater risk compared with GSE loans, have gained a larger share of the market, rising from 3 percent of total market originations in 2005 to more than 30 percent in mid-2010.
National commercial real estate (CRE) markets also weakened dramatically during the credit crisis and recession. Moody’s/REAL commercial property price index fell by about 45 percent from its 2007 peak (Chart 4.1.15). Sales activity also decreased sharply: commercial property transactions fell 89 percent to $66 billion in 2009 from a peak of $579 billion in 2007. A combination of weaker cash flows, lower collateral values, and tightened underwriting standards since 2008 has made it more difficult for CRE owners to refinance their debt, putting further stress on the market. Since mid-2008, bank lending to finance commercial property has fallen by 50 percent. One-quarter of recent CRE activity has involved distressed properties.
Commercial mortgage-backed security (CMBS) issuers account for nearly 25 percent of the total CRE debt. Reflecting the credit crisis
Chart 4.1.11 Net Consumer Sector Credit Flows
-0.3
-0.2
-0.1
0.0
0.1
0.2
0.3
0.4
0.5
0.6
2000:Q1 2002:Q1 2004:Q1 2006:Q1 2008:Q1 2010:Q1-0.3
-0.2
-0.1
0.0
0.1
0.2
0.3
0.4
0.5
0.6
4.1.11 Net Consumer Sector Credit FlowsTrillions of US$ Trillions of US$
Mortgage and Home EquityNonmortgage
Source: FRBNY Consumer Credit Panel
Chart 4.1.12 National Repeat Sales Home Price Indexes
100
120
140
160
180
200
220
2000 2002 2004 2006 2008 2010100
120
140
160
180
200
220
4.1.12 National Repeat Sales Home Price IndexesIndex, January 2000 = 100 Index, January 2000 = 100
Source: FHFA and CoreLogic
CoreLogic (including distressed sales)
FHFA
CoreLogic (excluding distressed sales)
Chart 4.1.13 Housing Affordability Index
80
100
120
140
160
180
200
1990 1994 1998 2002 2006 2010
80
100
120
140
160
180
200
4.1.13 Housing Affordability Index
Index Index
Source: NAR
Note: At 100 the income of a median family would qualify for an
80% LTV mortgage on a median priced single-family home.

Macroeconomic Environment 23
and economic stress, issuance of CMBS in the United States was only $2.7 billion in 2009 and $11.6 billion in 2010, well below the approximately $200 billion issued in both 2006 and 2007 (Chart 4.1.16).
Recently, the commercial property market has shown tentative signs of recovery, with more sales activity among higher quality, well-leased properties in major metropolitan markets, as well as signs of increased demand for and supply of commercial property loan financing. The Senior Loan Officer Opinion Survey for April 2011 showed that about 35 percent of domestic banks on net had seen increased demand for CRE loans, and a few large banks and foreign banks had eased their lending standards somewhat, although outstanding bank commercial property loans have continued to fall.
Securitization Markets
Much of the large increase in credit leading up to the financial crisis was driven by an expansion of securitized credit, particularly in the mortgage market. During this time, financial market participants and regulators tended to view securitization favorably: it allowed banks to reduce their exposure to certain types of loans, redistributing those risks to investors who were more willing to handle them and lowering the borrowing costs for households and businesses.
However, the crisis revealed deep flaws in the implementation of securitization. For example, banks and other firms that originated mortgages and packaged them into residential mortgage-backed securities (RMBS) for sale to investors often did not retain an interest in those mortgages and, thus, had no incentive to adequately monitor the performance of the originated mortgages. In the years before the crisis, underwriting standards deteriorated and nontraditional mortgage products proliferated (Chart 4.1.17).
The private-label (non-GSE) RMBS market collapsed in 2007 after house prices began to fall, which led to greater and more correlated
Chart 4.1.14 Median Credit Score at Mortgage Origination
600
640
680
720
760
800
2003 2004 2005 2006 2007 2008 2009 2010 2011600
640
680
720
760
800
4.1.14 Median Credit Score at Mortgage OriginationFICO Score FICO Score
Source: LPS Applied Analytics
Prime Purchase Prime Refinance
FHA Purchase
FHA Refinance
Chart 4.1.15 Commercial Property Price Indexes
60
80
100
120
140
160
180
200
2001 2003 2005 2007 2009 201160
80
100
120
140
160
180
200
4.1.15 Commercial Property Price Indexes
Index, December 2000 = 100 Index, December 2000 = 100
Source: Real Capital Analytics, Geltner & Associates
Moody’s/REAL
CPPI
6-city Trophy Index
Distressed Index
Note: Trophy Index for sales >$10MM.
Chart 4.1.16 CMBS New Issuance
0
50
100
150
200
250
2001 2003 2005 2007 2009 2011 YTD0
50
100
150
200
250
4.1.16 CMBS New IssuanceBillions of US$ Billions of US$
Source: Commercial Mortgage Alert Note: 2011 YTD as of 6/30/2011.

24 2011 FSOC Annual Report
delinquencies of nontraditional mortgages and thus reduced the value of these securities considerably. This market remains severely impaired and has affected other asset-backed securities markets. In the absence of strong offsetting developments, the lack of a meaningful rebound to overall private sector securitization activity is likely to have implications for the types of lending or fee-based activities that banks will choose to engage in and, in turn, for the future cost and level of credit intermediation (Chart 4.1.18). For nearly all asset classes, securitization activity remains at levels well below those that prevailed before the crisis. Recent issuance has been concentrated in securitizations of consumer auto loan and lease receivables, as well as resecuritizations of real estate mortgage investment conduits, which are repackaged CMBS and RMBS.
4.1.2 Risk Transfer
The financial system provides risk transfer services to the economy through a wide range of insurance and derivatives products. Certain credit risk transfer products played an important role in exacerbating the financial crisis and have not returned to their pre-crisis form.
A key role of financial markets and institutions is to allocate risk efficiently across households and businesses. The insurance market is a key market in financial risk transfer. Unlike most cases of credit intermediation, in which borrowers receive a large payment at the start and then repay the obligation over time, insurance policies typically involve upfront customer payments (premiums) in exchange for a contractual promise from the insurer to pay benefits upon a specified event in the future. The traditional U.S. insurance market largely functioned without disruption in payments to consumers throughout the financial crisis and the recovery.
Derivative contracts have become another important source of risk transfer in the financial system. The market for these contracts, which
Chart 4.1.17 Private-Label RMBS Gross Issuance
0
200
400
600
800
1000
1200
1400
2000 2002 2004 2006 2008 2010
0
200
400
600
800
1000
1200
1400
4.1.17 Private-Label RMBS Gross Issuance
Billions of US$ Billions of US$
Source: JPMorgan
Subprime FixedOption ARMAlt-A HybridAlt-A FixedPrime ARMPrime Fixed
Subprime ARM
11 Bil. 3 Bil.
Note: 2011 as of 2011:Q2.
Chart 4.1.18 GSE and Private-Label RMBS Gross Issuance
0
500
1000
1500
2000
2500
3000
2000 2002 2004 2006 2008 20100
500
1000
1500
2000
2500
3000
4.1.18 GSE and Private-Label RMBS Gross IssuanceBillions of US$ Billions of US$
Source: JPMorgan
Private-LabelGSE
Note: 2011 as of 2011:Q2.
Macroeconomic Environment 25
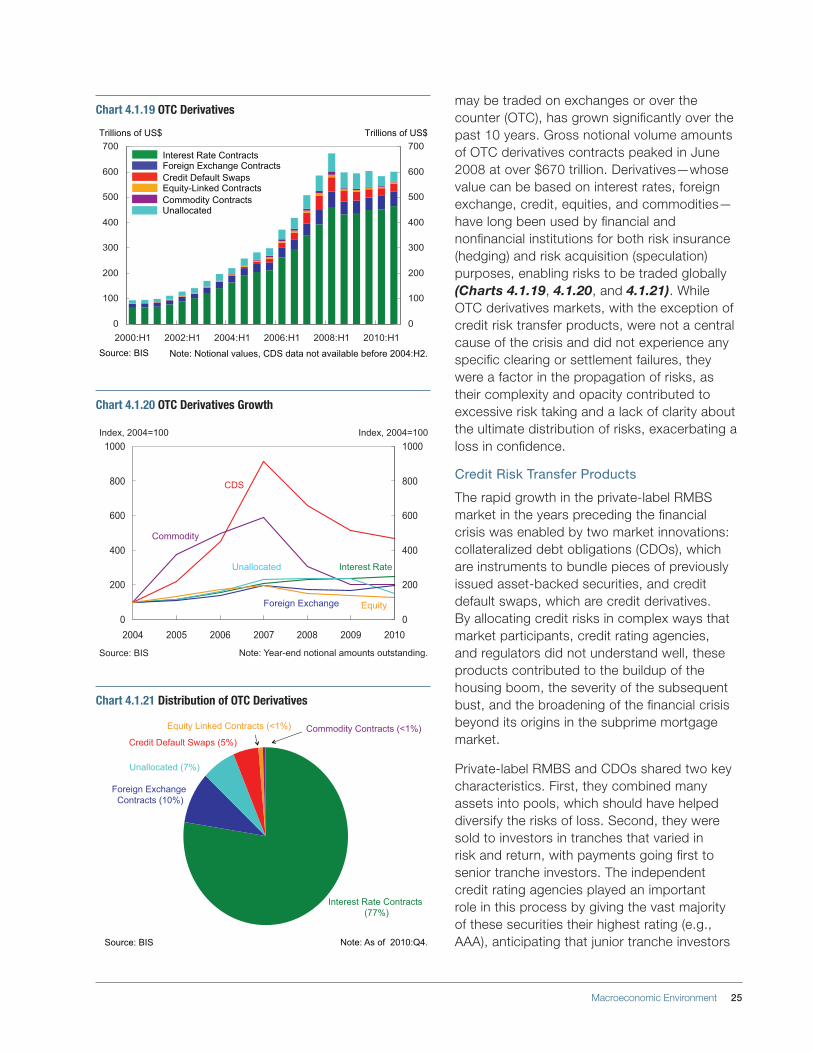
may be traded on exchanges or over the counter (OTC), has grown significantly over the past 10 years. Gross notional volume amounts of OTC derivatives contracts peaked in June 2008 at over $670 trillion. Derivatives—whose value can be based on interest rates, foreign exchange, credit, equities, and commodities—have long been used by financial and nonfinancial institutions for both risk insurance (hedging) and risk acquisition (speculation) purposes, enabling risks to be traded globally (Charts 4.1.19, 4.1.20, and 4.1.21). While OTC derivatives markets, with the exception of credit risk transfer products, were not a central cause of the crisis and did not experience any specific clearing or settlement failures, they were a factor in the propagation of risks, as their complexity and opacity contributed to excessive risk taking and a lack of clarity about the ultimate distribution of risks, exacerbating a loss in confidence.
Credit Risk Transfer Products
The rapid growth in the private-label RMBS market in the years preceding the financial crisis was enabled by two market innovations: collateralized debt obligations (CDOs), which are instruments to bundle pieces of previously issued asset-backed securities, and credit default swaps, which are credit derivatives. By allocating credit risks in complex ways that market participants, credit rating agencies, and regulators did not understand well, these products contributed to the buildup of the housing boom, the severity of the subsequent bust, and the broadening of the financial crisis beyond its origins in the subprime mortgage market.
Private-label RMBS and CDOs shared two key characteristics. First, they combined many assets into pools, which should have helped diversify the risks of loss. Second, they were sold to investors in tranches that varied in risk and return, with payments going first to senior tranche investors. The independent credit rating agencies played an important role in this process by giving the vast majority of these securities their highest rating (e.g., AAA), anticipating that junior tranche investors
Chart 4.1.19 OTC Derivatives
0
100
200
300
400
500
600
700
2000:H1 2002:H1 2004:H1 2006:H1 2008:H1 2010:H1
0
100
200
300
400
500
600
700
4.1.19 OTC Derivatives
Trillions of US$ Trillions of US$
Source: BIS
Foreign Exchange ContractsInterest Rate Contracts
Equity-Linked ContractsCredit Default Swaps
UnallocatedCommodity Contracts
Note: Notional values, CDS data not available before 2004:H2.
Chart 4.1.20 OTC Derivatives Growth
0
200
400
600
800
1000
2004 2005 2006 2007 2008 2009 20100
200
400
600
800
1000
4.1.20 OTC Derivatives GrowthIndex, 2004=100 Index, 2004=100
Source: BIS
CDS
EquityForeign Exchange
Unallocated Interest Rate
Commodity
Note: Year-end notional amounts outstanding.
Chart 4.1.21 Distribution of OTC Derivatives4.1.21 Distribution of OTC Derivatives
Source: BIS
Interest Rate Contracts (77%)
Foreign Exchange Contracts (10%)
Unallocated (7%)
Equity Linked Contracts (<1%)
Credit Default Swaps (5%)
.4Q:0102 fo sA :etoN
Commodity Contracts (<1%)

26 2011 FSOC Annual Report
would cover expected losses based on the low historical default rates for residential mortgages, the diversification of the asset pools, and the assumption that house prices would generally continue to rise.
During the mortgage boom, senior tranches of RMBS attracted broad classes of investors, including banks, insurance companies, and GSEs (Chart 4.1.22). The riskier junior-investment-grade tranches of RMBS were typically pooled by investment banks and purchased by CDOs (Chart 4.1.23). Although most of the securities issued by these CDOs also received the highest credit rating (again, based on the presumed benefits of diversification), senior CDO tranches had a very different investor base from senior RMBS tranches. They were typically retained by the originating bank or sold with liquidity or credit guarantees provided by the originating bank or with insurance written by a segment of the insurance industry known as financial guarantors. In many cases, the credit rating agencies based their high ratings on these securities on the availability of these guarantees. Junior-investment-grade CDO tranches were typically purchased by other CDOs.
An important component in maintaining this structure during the mortgage boom was credit default swaps (CDS). Financial institutions and investors purchased CDS to help manage their risks from RMBS and CDO securities. The insurance conglomerate AIG was a large seller of these CDS. In addition, synthetic CDOs grew rapidly during the pre-crisis period. These were derivative-linked CDOs that packaged long positions in CDS referencing RMBS or CDO securities; if the underlying securities did not perform, the synthetic CDO investors would lose money as if the CDOs owned positions in actual securities (Chart 4.1.24).
The result of this complex and opaque system was that a surprising amount of the credit risk in the mortgage market was concentrated in senior CDO tranches held or guaranteed by the banks that created CDOs and by a small number of financial guarantors. These large institutions and other investors in MBS and CDOs suffered billions of dollars in losses
ABX Sellers (synthetic)
Mezz. CDOs (70bn)
Further price shocks
ABS CDOs (400bn)
4.1.23 Ownership of Investment Grade Subordinates in RMBS and ABS CDOs (June 2007)
AAA CDOs* (320bn)
Source: Lehman Brothers
CDO Equity (10bn)
CMBS/ABS (40bn)
Others (60bn)
Financial Guarantees
(160bn)
CP Puts (60bn)
ABCP/SIV (45bn)IG
(240 bn)
180
100
Note: *Issuing banks often retained AAA CDO securities while buying protection from guarantors. They also sold senior CDO securities to CP
investors while providing protection in the form of liquidity puts.
Chart 4.1.23 Ownership of Investment Grade Subordinates in RMBS and ABS CDOs (June 2007)
Chart 4.1.22 Private-Label Residential MBS Exposures
0
500
1000
1500
2000
AAAs IG Subs Non-IG Subs0
500
1000
1500
2000
4.1.22 Private-Label Residential MBS ExposuresBillions of US$ Billions of US$
Source: Lehman Brothers
GSEsBanksSecurities Lenders
OverseasABCPOthers
Note: As of 2007:Q2.
Chart 4.1.24 ABS Structured Finance CDO Issuance
0
50
100
150
200
250
2000 2001 2002 2003 2004 2005 2006 2007 2008 2009 20100
50
100
150
200
250
4.1.24 ABS Structured Finance CDO Issuance
Billions of US$ Billions of US$
Synthetic CDO
Source: Cordell, Huang and Williams (2011)
Cash CDO

Macroeconomic Environment 27
when mortgage defaults across the country exceeded expectations and the performance of diverse pools of RMBS turned out to be highly correlated. By the end of 2009, $319 billion of subprime and Alt-A MBS had been materially impaired, as had $479 billion of CDOs that invested in MBS (Chart 4.1.25).
The market for CDOs has not recovered since the crisis. The financial guarantors, with one exception, are not currently providing such guarantees and appear unlikely to return to the market in the near term. However, the broader market for CDS referencing the risk of default by corporate entities remains robust.
4.1.3 Transactions and Payment Services to Households and Businesses
Transaction and retail payment services, which facilitate a high volume of payments across the financial system, functioned well during the crisis.
Depository institutions provide a variety of retail payment services to consumers and businesses, such as check, debit card, credit card, automated clearing house, and prepaid card transaction services. Retail payments, which are characterized by high volumes but low average dollar transaction values, have undergone significant technological and financial innovation in recent years, changing how they are transacted. According to the most recent Federal Reserve Payments Study, the estimated number of noncash payments totaled $109 billion in 2009, with a total value of approximately $72 trillion. More than three-quarters of these retail payments, by volume, were made electronically, a 9.3 percentage point increase since 2006 (Charts 4.1.26 and 4.1.27). Retail payments depend critically on consumer and business accounts at depository institutions that are used for transaction purposes.
While there have been a number of bank, thrift, and credit union failures—including several high-profile failures or near-failures of large complex financial institutions—the FDIC and the NCUA were able to prevent any disruptions in retail
Chart 4.1.25 Impaired MBS and CDO Securities
0
200
400
600
800
1000
Aaa Aa thru B Aaa Aa thru B Aaa Aa thru B0
200
400
600
800
1000
4.1.25 Impaired MBS and CDO SecuritiesBillions of US$ Billions of US$
Source: Cordell, Huang and Williams (2011), Moody’s
ImpairedNot Impaired
Alt A MBS Subprime MBS ABS CDOs
Note: As of 2009:Q4.
Chart 4.1.26 Noncash Retail Payments: 20064.1.26 Noncash Retail Payments: 2006
Source: 2010 Federal Reserve Payments Study
Checks Paid (32%)
Prepaid (4%)
ACH (15%)
Credit Card (23%)
Debit Card (26%)
Chart 4.1.27 Noncash Retail Payments: 20094.1.27 Noncash Retail Payments: 2009
Source: 2010 Federal Reserve Payments Study
Checks Paid (22%)
Prepaid (5%)
ACH (18%)Credit Card
(20%)
Debit Card (35%)
28 2011 FSOC Annual Report
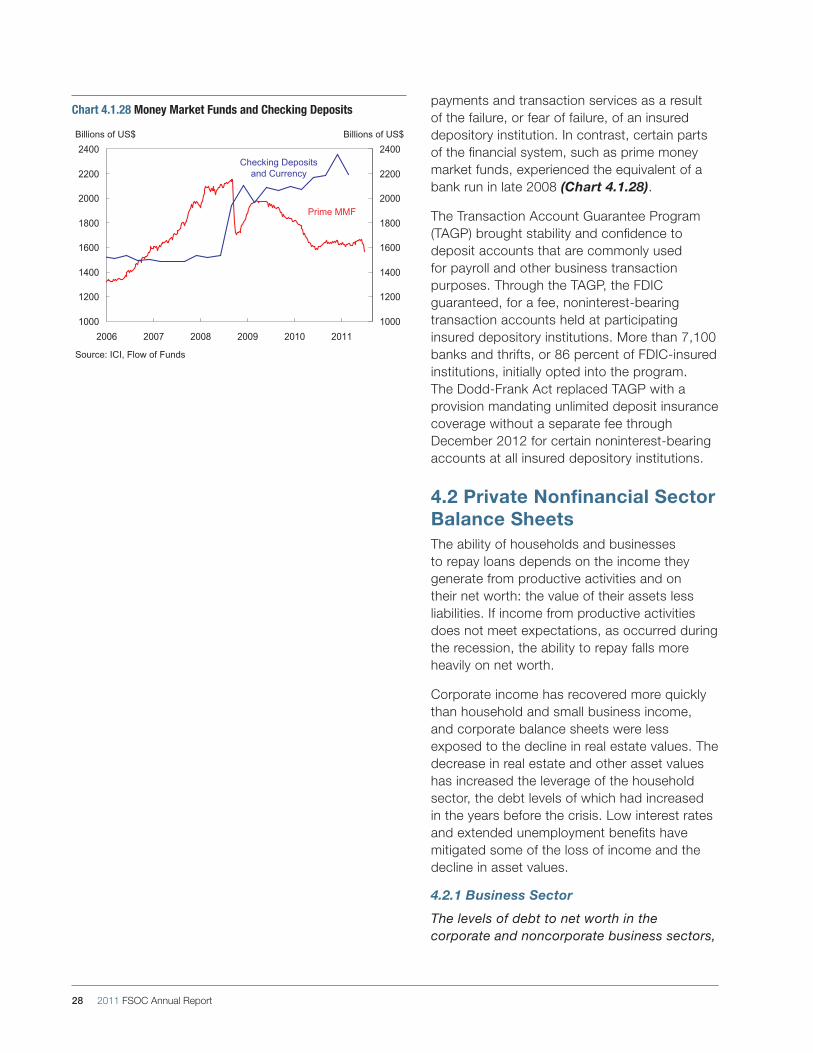
payments and transaction services as a result of the failure, or fear of failure, of an insured depository institution. In contrast, certain parts of the financial system, such as prime money market funds, experienced the equivalent of a bank run in late 2008 (Chart 4.1.28).
The Transaction Account Guarantee Program (TAGP) brought stability and confidence to deposit accounts that are commonly used for payroll and other business transaction purposes. Through the TAGP, the FDIC guaranteed, for a fee, noninterest-bearing transaction accounts held at participating insured depository institutions. More than 7,100 banks and thrifts, or 86 percent of FDIC-insured institutions, initially opted into the program. The Dodd-Frank Act replaced TAGP with a provision mandating unlimited deposit insurance coverage without a separate fee through December 2012 for certain noninterest-bearing accounts at all insured depository institutions.
4.2 Private Nonfinancial Sector Balance SheetsThe ability of households and businesses to repay loans depends on the income they generate from productive activities and on their net worth: the value of their assets less liabilities. If income from productive activities does not meet expectations, as occurred during the recession, the ability to repay falls more heavily on net worth.
Corporate income has recovered more quickly than household and small business income, and corporate balance sheets were less exposed to the decline in real estate values. The decrease in real estate and other asset values has increased the leverage of the household sector, the debt levels of which had increased in the years before the crisis. Low interest rates and extended unemployment benefits have mitigated some of the loss of income and the decline in asset values.
4.2.1 Business Sector
The levels of debt to net worth in the corporate and noncorporate business sectors,
Chart 4.1.28 Money Market Funds and Checking Deposits4.1.28 Money Market Funds and Checking Deposits
Source: ICI, Flow of Funds
1000
1200
1400
1600
1800
2000
2200
2400
2006 2007 2008 2009 2010 20111000
1200
1400
1600
1800
2000
2200
2400Billions of US$ Billions of US$
Checking Deposits and Currency
Prime MMF

Macroeconomic Environment 29
which spiked during the downturn as a result of deteriorating asset values, remain elevated but are showing modest improvement.
Corporate
Nonfinancial corporate balance sheets deteriorated significantly during the downturn, as leverage reached historical highs, primarily because of unprecedented declines in the value of assets held by these firms. Corporate balance sheets have recovered somewhat over recent quarters. Nevertheless, leverage has decreased only modestly and remains at elevated levels, as the value of assets in the sector have increased only moderately faster than liabilities (Chart 4.2.1).
Since mid-2009, corporations have generated strong profit growth and improved cash flow, reflecting the impact of aggressive cost-cutting, moderate revenue growth, and lower interest costs. This has driven equity market valuations back to near pre-crisis levels and has allowed nonfinancial corporations to increase capital through retained earnings. These developments have also allowed corporations to significantly bolster their liquidity (Chart 4.2.2).
Nonfinancial corporate balance sheets were in relatively good condition entering the crisis. As a result, the corporate bond default rate, which spiked to a similar level as that in the previous recession, was lower than expected given the severity of this recession, particularly compared with the level implied from bond prices in early 2009 (Charts 4.1.4 and 4.2.3). Since the crisis, high-yield issuers have improved their ability to cover their debt payments out of cash flow. These firms also have only a limited amount of debt maturing over the near term and (as discussed in Section 4.1.1) benefit from improved financing conditions.
Noncorporate
Balance sheets in the noncorporate sector, composed primarily of small businesses, were adversely affected by the credit crisis and recession owing to poor sales, declines in asset values, and a reduction in credit availability.
Chart 4.2.1 Corporate Credit Market Debt to Net Worth
0
10
20
30
40
50
60
1952:Q1 1962:Q1 1972:Q1 1982:Q1 1992:Q1 2002:Q10
10
20
30
40
50
60
4.2.1 Corporate Credit Market Debt to Net WorthPercent Percent
Source: Flow of Funds Note: Nonfarm nonfinancial corporate business.
Chart 4.2.2 Financial Ratios for Nonfinancial Corporations
24
25
26
27
28
29
30
31
32
2000 2002 2004 2006 2008 20106
7
8
9
10
11
12
4.2.2 Financial Ratios for Nonfinancial CorporationsPercent Percent
Source: Compustat
Liquid Assets over Total Assets (right axis)
Debt over Total Assets
(left axis)
Chart 4.2.3 Nonfinancial Corporate Bond Default Rate
0
1
2
3
4
5
6
7
8
1980 1985 1990 1995 2000 2005 20100
1
2
3
4
5
6
7
8
4.2.3 Nonfinancial Corporate Bond Default RatePercent of Outstandings Percent of Outstandings
Source: Moody’s Investors ServiceNote: 6-month trailing defaults divided by
beginning-of-period outstandings.
Annual Rate

30 2011 FSOC Annual Report
In the aggregate, the assets of small businesses are composed primarily of real estate (Chart 4.2.4). Consequently, the sharp drop in real estate values during the crisis had a severe impact on the balance sheets of many small businesses and led to a sharp increase in the measured leverage of small businesses. Leverage in this sector has fallen only modestly since then and remains well above its pre-crisis levels (Chart 4.2.5).
Small businesses generally have less access than corporations to capital markets and thus depend more on bank financing. Therefore, the improvements in the functioning of corporate bond markets have had little direct positive impact on the small business sector. Also, continued strains in the banking sector, particularly for smaller community banks, have constrained credit availability for small businesses. According to the Federal Reserve Board’s Senior Loan Officer Opinion Survey, loan standards to small firms, which were tightened sharply during the crisis, have not been loosened to any significant extent over the past year.
The Senior Loan Officer Opinion Survey also indicates that the demand for bank loans from small businesses has not picked up much over the past year. The weakness in demand probably reflects two main factors. First, because many small business loans are secured by real estate collateral, declines in real estate prices have affected available collateral, which may prevent small businesses from seeking loans. Second, small businesses still report weak sales; in the latest NFIB survey, nearly one-quarter of respondents cited poor sales as their primary problem.
4.2.2 Household Sector
Household net worth increased over the year through the first quarter of 2011, as equity values increased and debt levels decreased modestly. The burden of debt payments relative to income has improved. However, mortgage-related debt remains high relative to the value of housing. Households have taken on more debt to fund college education.
Chart 4.2.4 Noncorporate Assets
0.0
0.2
0.4
0.6
0.8
1.0
1990:Q1 1994:Q1 1998:Q1 2002:Q1 2006:Q1 2010:Q10.0
0.2
0.4
0.6
0.8
1.0
4.2.4 Noncorporate AssetsShare of Total Assets Share of Total Assets
Source: Flow of Funds
Residential RE
Accounts Receivable
Cash and Securities
Other Assets
Nonresidential RE
Note: Nonfarm noncorporate business.
Chart 4.2.5 Noncorporate Credit Market Debt to Net Worth
30
40
50
60
70
80
90
2000:Q1 2002:Q1 2004:Q1 2006:Q1 2008:Q1 2010:Q130
40
50
60
70
80
90
4.2.5 Noncorporate Credit Market Debt to Net WorthPercent Percent
Source: Flow of Funds Note: Nonfarm noncorporate business.

Macroeconomic Environment 31
In the aggregate, household balance sheets are recovering, with net worth increasing moderately over the year through the first quarter of 2011 after large falls in 2008 and 2009. Declines in housing wealth have restrained the increase in aggregate net worth, which has been driven primarily by a rebound in stock values from their March 2009 lows (Chart 4.2.6). However, the recovery in household balance sheets has not been evenly distributed across income levels, particularly for lower income households that do not have much participation in equity markets. Because of the continued weakness in home prices, owners’ equity in housing has remained near a record low of approximately 40 percent since mid-2008, more than 20 percentage points lower than its average over 1990–2005 (Chart 4.2.7).
Consumer debt outstanding, driven primarily by mortgages, peaked in 2008 and has declined by about $1 trillion. In part, this decline is the result of households’ active efforts to reduce their debt levels. But it also reflects the impact of foreclosures, which have removed mortgage debt from household balance sheets.
Many homeowners who were delinquent on their mortgages have been able to lower their payments through government and private modification programs. Nearly five million mortgage modification arrangements were started between April 2009 and the end of April 2011, which is more than double the number of foreclosure completions for the same period (2.1 million), although some homeowners may have received help from more than one program. More than 730,000 homeowners have received permanent modifications under the Troubled Asset Relief Program’s Home Affordable Modification Program, with estimated median savings of about 37 percent, or $525 per month per homeowner. Others have been helped by government programs to modify second liens or to encourage foreclosure alternatives, such as short sales and deeds-in lieu. Still, with about 2.5 million mortgages entering the foreclosure process annually in recent years, many homeowners remain financially stressed.
Chart 4.2.6 Household and Nonprofit Balance Sheets
-40
-20
0
20
40
60
80
100
2000:Q1 2002:Q1 2004:Q1 2006:Q1 2008:Q1 2010:Q1-40
-20
0
20
40
60
80
100
4.2.6 Household and Nonprofit Balance SheetsTrillions of US$ Trillions of US$
Source: Flow of Funds
Real EstateCash InstrumentsCredit Market Instruments
Other Assets
Other DebtConsumer Credit
Equities
Mortgages
Net Worth
Chart 4.2.7 Share of Owners’ Equity in Household Real Estate
30
40
50
60
70
80
90
1952 1958 1964 1970 1976 1982 1988 1994 2000 200630
40
50
60
70
80
90
4.2.7 Share of Owners’ Equity in Household Real EstatePercent Percent
Source: Flow of Funds
32 2011 FSOC Annual Report
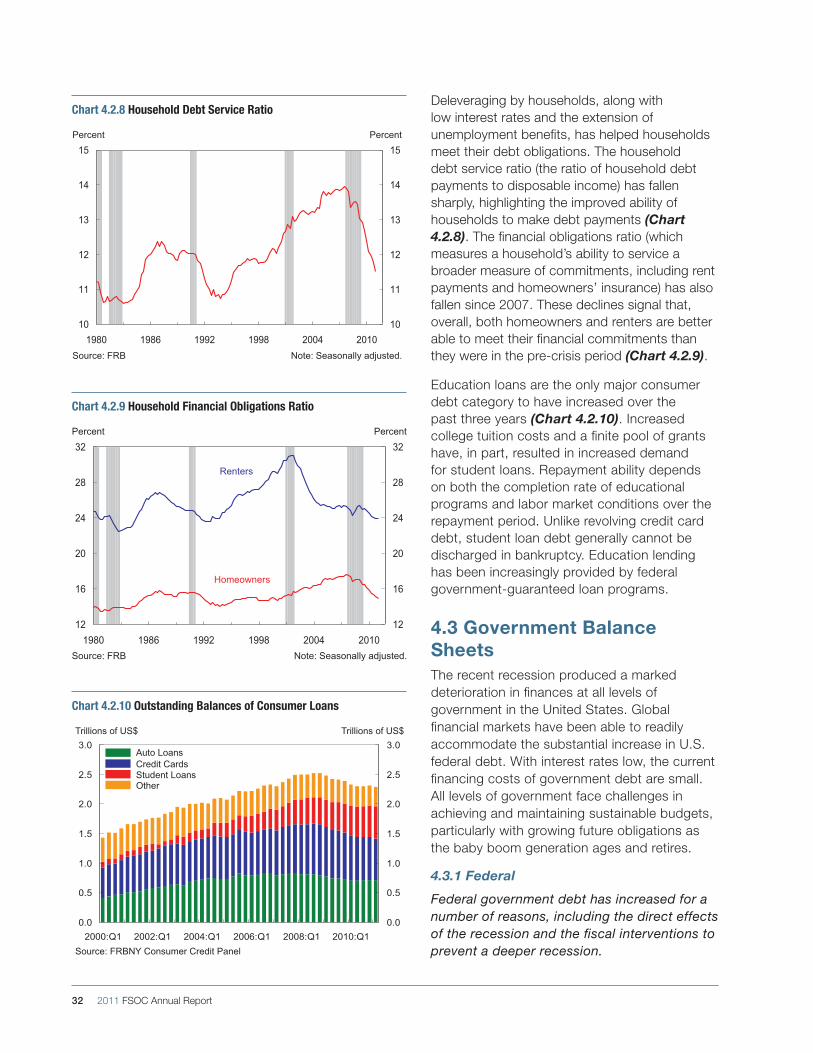
Deleveraging by households, along with low interest rates and the extension of unemployment benefits, has helped households meet their debt obligations. The household debt service ratio (the ratio of household debt payments to disposable income) has fallen sharply, highlighting the improved ability of households to make debt payments (Chart 4.2.8). The financial obligations ratio (which measures a household’s ability to service a broader measure of commitments, including rent payments and homeowners’ insurance) has also fallen since 2007. These declines signal that, overall, both homeowners and renters are better able to meet their financial commitments than they were in the pre-crisis period (Chart 4.2.9).
Education loans are the only major consumer debt category to have increased over the past three years (Chart 4.2.10). Increased college tuition costs and a finite pool of grants have, in part, resulted in increased demand for student loans. Repayment ability depends on both the completion rate of educational programs and labor market conditions over the repayment period. Unlike revolving credit card debt, student loan debt generally cannot be discharged in bankruptcy. Education lending has been increasingly provided by federal government-guaranteed loan programs.
4.3 Government Balance SheetsThe recent recession produced a marked deterioration in finances at all levels of government in the United States. Global financial markets have been able to readily accommodate the substantial increase in U.S. federal debt. With interest rates low, the current financing costs of government debt are small. All levels of government face challenges in achieving and maintaining sustainable budgets, particularly with growing future obligations as the baby boom generation ages and retires.
4.3.1 Federal
Federal government debt has increased for a number of reasons, including the direct effects of the recession and the fiscal interventions to prevent a deeper recession.
Chart 4.2.8 Household Debt Service Ratio
10
11
12
13
14
15
1980 1986 1992 1998 2004 201010
11
12
13
14
15
4.2.8 Household Debt Service Ratio
Percent Percent
Source: FRB Note: Seasonally adjusted.
Chart 4.2.9 Household Financial Obligations Ratio
12
16
20
24
28
32
1980 1986 1992 1998 2004 201012
16
20
24
28
32
4.2.9 Household Financial Obligations Ratio
Percent Percent
Source: FRB
Homeowners
Renters
Note: Seasonally adjusted.
Chart 4.2.10 Outstanding Balances of Consumer Loans
0.0
0.5
1.0
1.5
2.0
2.5
3.0
2000:Q1 2002:Q1 2004:Q1 2006:Q1 2008:Q1 2010:Q10.0
0.5
1.0
1.5
2.0
2.5
3.0
4.2.10 Outstanding Balances of Consumer LoansTrillions of US$ Trillions of US$
Source: FRBNY Consumer Credit Panel
Auto LoansCredit CardsStudent LoansOther

Macroeconomic Environment 33
The U.S. federal government is the largest issuer of debt in the world. This mainly reflects the large size of the U.S. economy relative to the rest of the world. The size of the market for U.S. debt, its liquidity, and the long-term stability and flexibility of the U.S. economy have made the U.S. dollar the dominant global reserve asset (see Chart 4.3.1 and Box A: U.S. Dollar as the International Reserve Asset).
In fiscal year (FY) 2007, the federal government had a deficit of 1.2 percent of GDP and net debt outstanding of $5.02 trillion. In FY2010, the deficit increased to 8.9 percent of GDP; it is projected to remain around this level in FY2011. At the end of FY2010, net public debt outstanding reached $9.01 trillion, 62 percent of GDP (Chart 4.3.2). Total public outstanding debt increased from $9.00 trillion in FY2007 to $13.56 trillion in FY2010. In May 2011, total Treasury debt reached the limit set by Congress in February 2010.
Much of the increase in the debt was driven by the direct effects of the recession on revenues and expenditures, and the use of fiscal policy to mitigate some of the risks of a deeper recession. A small part of the increase in debt is due to direct government assistance to the financial sector, mainly in the form of capital provided to Fannie Mae and Freddie Mac, the two large GSEs. The Congressional Budget Office estimates that the net cost of the Troubled Asset Relief Program will be less than 0.25 percent of GDP. The assistance to the financial sector resulted in the government accumulating financial assets.
Even before the recession and the attendant increase in the deficit, government finances were acknowledged to be on an unsustainable path, partly owing to the increased expenditures for Medicare and Social Security anticipated with the aging of the baby-boom generation. The unsustainable path of government debt under the continuation of certain revenue and expenditure policies is widely recognized (Charts 4.3.2 and 4.3.3). The need for long-run fiscal balance has been a focus of recent
Chart 4.3.1 Total Treasury Market Turnover
Chart 4.3.2 Federal Government Debt Held by the Public
30
50
70
90
110
2000 2003 2006 2009 2012 2015 2018 202130
50
70
90
110
4.3.2 Federal Government Debt Held by the PublicPercent of GDP Percent of GDP
Source: CBO
CBO Extended Baseline Scenario
CBO Alternative Fiscal Scenario
Note: Fiscal years.
Chart 4.3.3 Outlays and Revenues Using CBO Projections4.3.3 Outlays and Revenue Using CBO Projections Trillions of US$ Trillions of US$
Source: CBO
Current Law Baseline: Outlays
Current Law Baseline:
Revenues
Note: Projection is based on the Mar. 2011 CBO baseline budget forecast adjusted using Table 1.7 of the CBO Jan. 2011 outlook that specifies the effect of a continuation of certain policies. Revenues and outlays were adjusted from the baseline by accounting
for the effects of maintaining the Medicare payment rates at the 2011 level, extending certain income, estate, and gift tax provisions scheduled to expire at the end of 2012 while indexing the AMT for inflation.
Continuation of Certain Policies:
Outlays
Continuation of Certain Policies:
Revenues
Projections
34 2011 FSOC Annual Report
The U.S. dollar is the world’s most actively traded currency in foreign exchange markets and the main reserve asset held by foreign central banks and finance ministries. This has been true since the end of World War II.
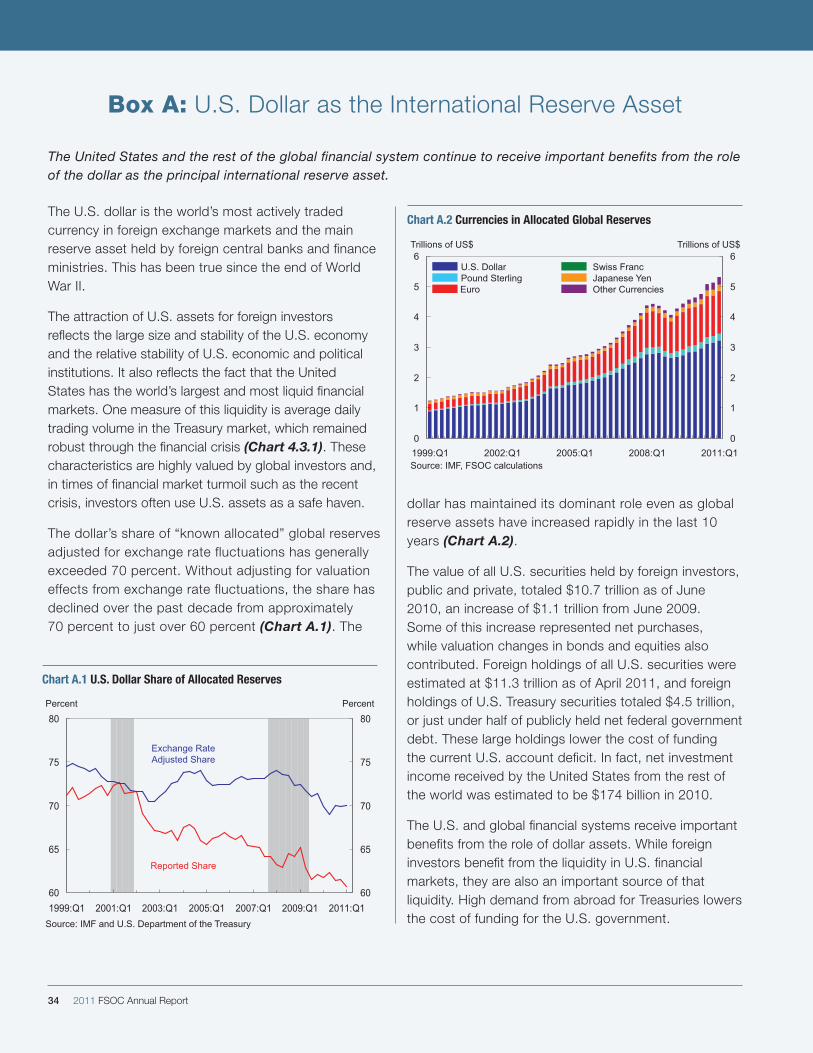
The attraction of U.S. assets for foreign investors reflects the large size and stability of the U.S. economy and the relative stability of U.S. economic and political institutions. It also reflects the fact that the United States has the world’s largest and most liquid financial markets. One measure of this liquidity is average daily trading volume in the Treasury market, which remained robust through the financial crisis (Chart 4.3.1). These characteristics are highly valued by global investors and, in times of financial market turmoil such as the recent crisis, investors often use U.S. assets as a safe haven.
The dollar’s share of “known allocated” global reserves adjusted for exchange rate fluctuations has generally exceeded 70 percent. Without adjusting for valuation effects from exchange rate fluctuations, the share has declined over the past decade from approximately 70 percent to just over 60 percent (Chart A.1). The
dollar has maintained its dominant role even as global reserve assets have increased rapidly in the last 10 years (Chart A.2).
The value of all U.S. securities held by foreign investors, public and private, totaled $10.7 trillion as of June 2010, an increase of $1.1 trillion from June 2009. Some of this increase represented net purchases, while valuation changes in bonds and equities also contributed. Foreign holdings of all U.S. securities were estimated at $11.3 trillion as of April 2011, and foreign holdings of U.S. Treasury securities totaled $4.5 trillion, or just under half of publicly held net federal government debt. These large holdings lower the cost of funding the current U.S. account deficit. In fact, net investment income received by the United States from the rest of the world was estimated to be $174 billion in 2010.
The U.S. and global financial systems receive important benefits from the role of dollar assets. While foreign investors benefit from the liquidity in U.S. financial markets, they are also an important source of that liquidity. High demand from abroad for Treasuries lowers the cost of funding for the U.S. government.
Box A: U.S. Dollar as the International Reserve Asset
The United States and the rest of the global financial system continue to receive important benefits from the role of the dollar as the principal international reserve asset.
Chart A.1 U.S. Dollar Share of Allocated Reserves
60
65
70
75
80
1999:Q1 2001:Q1 2003:Q1 2005:Q1 2007:Q1 2009:Q1 2011:Q160
65
70
75
80
A.1 U.S. Dollar Share of Allocated ReservesPercent Percent
Source: IMF and U.S. Department of the Treasury
Reported Share
Exchange Rate Adjusted Share
Chart A.2 Currencies in Allocated Global Reserves
0
1
2
3
4
5
6
1999:Q1 2002:Q1 2005:Q1 2008:Q1 2011:Q10
1
2
3
4
5
6Trillions of US$ Trillions of US$
Source: IMF, FSOC calculations
U.S. Dollar Swiss FrancPound SterlingEuro Other Currencies
Japanese Yen
A.2 Currencies in Allocated Global Reserves
Macroeconomic Environment 35
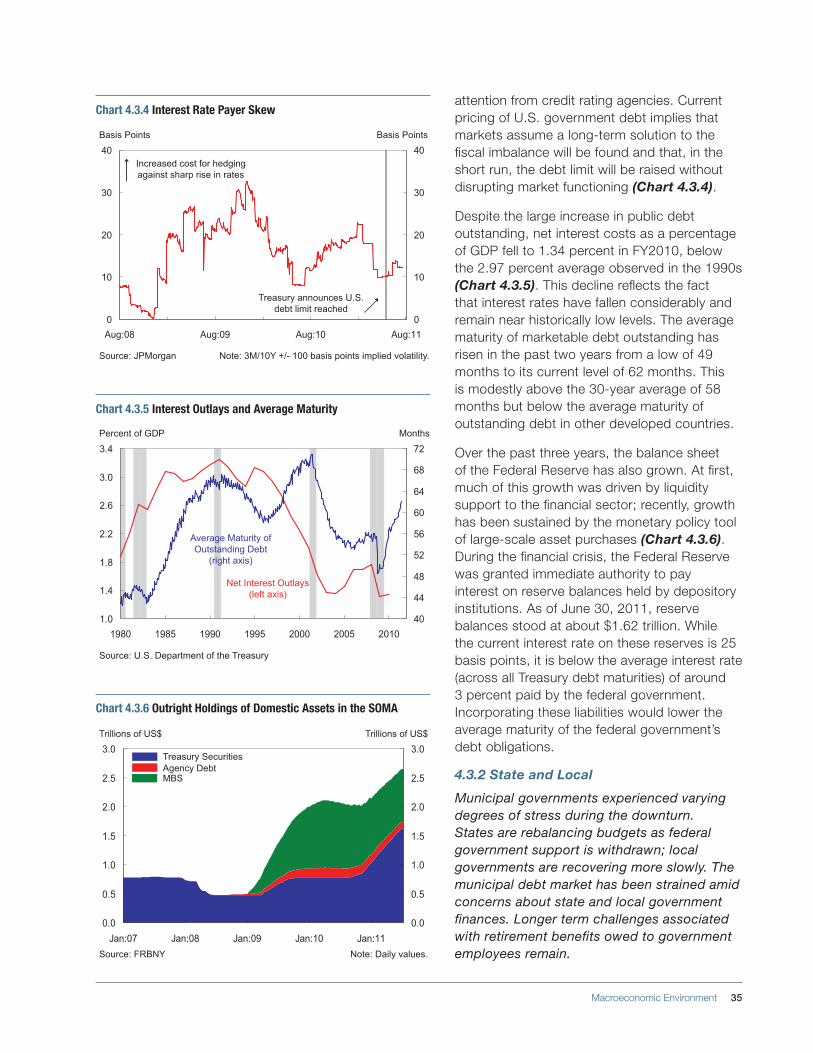
attention from credit rating agencies. Current pricing of U.S. government debt implies that markets assume a long-term solution to the fiscal imbalance will be found and that, in the short run, the debt limit will be raised without disrupting market functioning (Chart 4.3.4).
Despite the large increase in public debt outstanding, net interest costs as a percentage of GDP fell to 1.34 percent in FY2010, below the 2.97 percent average observed in the 1990s (Chart 4.3.5). This decline reflects the fact that interest rates have fallen considerably and remain near historically low levels. The average maturity of marketable debt outstanding has risen in the past two years from a low of 49 months to its current level of 62 months. This is modestly above the 30-year average of 58 months but below the average maturity of outstanding debt in other developed countries.
Over the past three years, the balance sheet of the Federal Reserve has also grown. At first, much of this growth was driven by liquidity support to the financial sector; recently, growth has been sustained by the monetary policy tool of large-scale asset purchases (Chart 4.3.6). During the financial crisis, the Federal Reserve was granted immediate authority to pay interest on reserve balances held by depository institutions. As of June 30, 2011, reserve balances stood at about $1.62 trillion. While the current interest rate on these reserves is 25 basis points, it is below the average interest rate (across all Treasury debt maturities) of around 3 percent paid by the federal government. Incorporating these liabilities would lower the average maturity of the federal government’s debt obligations.
4.3.2 State and Local
Municipal governments experienced varying degrees of stress during the downturn. States are rebalancing budgets as federal government support is withdrawn; local governments are recovering more slowly. The municipal debt market has been strained amid concerns about state and local government finances. Longer term challenges associated with retirement benefits owed to government employees remain.
Chart 4.3.4 Interest Rate Payer Skew
0
10
20
30
40
Aug:08 Aug:09 Aug:10 Aug:110
10
20
30
40
4.3.4 Interest Rate Payer Skew
Basis Points Basis Points
Source: JPMorgan
Increased cost for hedging against sharp rise in rates
Treasury announces U.S. debt limit reached
Note: 3M/10Y +/- 100 basis points implied volatility.
Chart 4.3.6 Outright Holdings of Domestic Assets in the SOMA
0.0
0.5
1.0
1.5
2.0
2.5
3.0
Jan:07 Jan:08 Jan:09 Jan:10 Jan:110.0
0.5
1.0
1.5
2.0
2.5
3.0
4.3.6 Outright Holdings of Domestic Assets in the SOMATrillions of US$ Trillions of US$
Source: FRBNY
Treasury SecuritiesAgency DebtMBS
Note: Daily values.
Chart 4.3.5 Interest Outlays and Average Maturity
1.0
1.4
1.8
2.2
2.6
3.0
3.4
1980 1985 1990 1995 2000 2005 201040
44
48
52
56
60
64
68
72
4.3.5 Interest Outlays and Average MaturityPercent of GDP Months
Source: U.S. Department of the Treasury
Net Interest Outlays (left axis)
Average Maturity of Outstanding Debt
(right axis)
36 2011 FSOC Annual Report
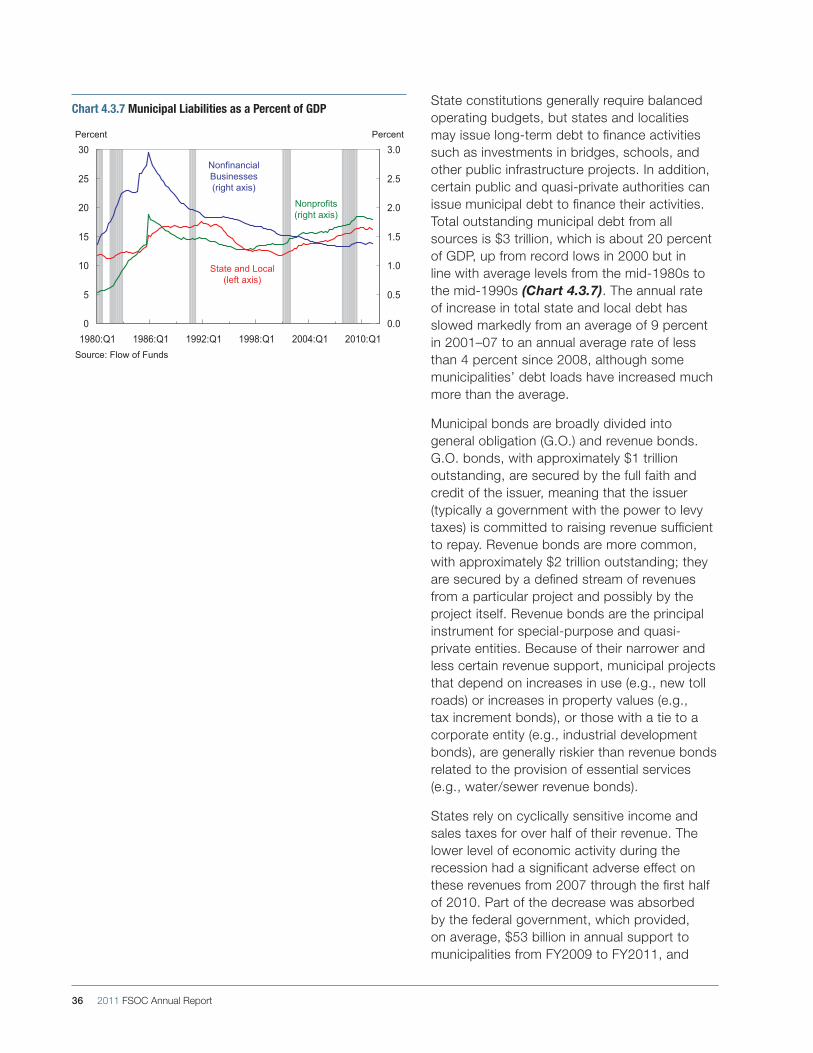
State constitutions generally require balanced operating budgets, but states and localities may issue long-term debt to finance activities such as investments in bridges, schools, and other public infrastructure projects. In addition, certain public and quasi-private authorities can issue municipal debt to finance their activities. Total outstanding municipal debt from all sources is $3 trillion, which is about 20 percent of GDP, up from record lows in 2000 but in line with average levels from the mid-1980s to the mid-1990s (Chart 4.3.7). The annual rate of increase in total state and local debt has slowed markedly from an average of 9 percent in 2001–07 to an annual average rate of less than 4 percent since 2008, although some municipalities’ debt loads have increased much more than the average.
Municipal bonds are broadly divided into general obligation (G.O.) and revenue bonds. G.O. bonds, with approximately $1 trillion outstanding, are secured by the full faith and credit of the issuer, meaning that the issuer (typically a government with the power to levy taxes) is committed to raising revenue sufficient to repay. Revenue bonds are more common, with approximately $2 trillion outstanding; they are secured by a defined stream of revenues from a particular project and possibly by the project itself. Revenue bonds are the principal instrument for special-purpose and quasi-private entities. Because of their narrower and less certain revenue support, municipal projects that depend on increases in use (e.g., new toll roads) or increases in property values (e.g., tax increment bonds), or those with a tie to a corporate entity (e.g., industrial development bonds), are generally riskier than revenue bonds related to the provision of essential services (e.g., water/sewer revenue bonds).
States rely on cyclically sensitive income and sales taxes for over half of their revenue. The lower level of economic activity during the recession had a significant adverse effect on these revenues from 2007 through the first half of 2010. Part of the decrease was absorbed by the federal government, which provided, on average, $53 billion in annual support to municipalities from FY2009 to FY2011, and
Chart 4.3.7 Municipal Liabilities as a Percent of GDP
0
5
10
15
20
25
30
1980:Q1 1986:Q1 1992:Q1 1998:Q1 2004:Q1 2010:Q10.0
0.5
1.0
1.5
2.0
2.5
3.0
4.3.7 Municipal Liabilities as a Percent of GDPPercent Percent
Source: Flow of Funds
State and Local (left axis)
Nonfinancial Businesses (right axis)
Nonprofits (right axis)

Macroeconomic Environment 37
bridged approximately a third of state budget shortfalls in 2010. Tax revenue is recovering and states are going through the process of rebalancing revenues and expenditures as federal government support is withdrawn (Chart 4.3.8).
Local governments and smaller municipal issuers are more vulnerable as they have smaller tax bases than states and are less able to raise revenue (Chart 4.3.9). Cities are currently facing reductions in state aid, on which they have historically relied for 30 percent of their funding. They also face declining property tax collections, traditionally their largest independent source of revenue, due to the sustained declines in real estate values and lower sales tax revenue (Chart 4.3.10). Funding has also become more difficult to obtain for single-purpose entities such as hospital authorities.
Despite the strains induced by the recession, municipal bond defaults are historically low. Defaults are associated with smaller municipal entities in geographic areas hardest hit by the housing crisis and recession. Also, defaults are more common for municipal projects that relied on future growth that did not materialize, or revenue bonds backed by issuers with corporate credit characteristics, such as industrial development bonds, pollution control bonds, or bonds in the health care sector (see Box B: Municipal Debt Market).
State and local governments face longer term challenges associated with the unfunded portion of future benefits owed to their employees. With high equity valuations in 2000, state pension systems were considered more than adequately funded; however, by 2008, declines in asset values led to significant underfunding, and approximately 80 percent of states failed to make their actuarially required contributions to their pension funds. Estimates of the unfunded portion of state and local retirement liabilities range from $1 trillion to $3 trillion. Other postemployment benefits represent an additional $0.5 trillion to $0.9 trillion in unfunded liabilities. The widening unfunded portion of pension obligations
Chart 4.3.8 State Tax Revenue
-20
-15
-10
-5
0
5
10
15
20
2005:Q1 2006:Q1 2007:Q1 2008:Q1 2009:Q1 2010:Q1-20
-15
-10
-5
0
5
10
15
20
4.3.8 State Tax Revenue% Change – Year to Year % Change – Year to Year
Source: U.S. Census Bureau
IncomeSales
Chart 4.3.9 City General Fund Revenues and Expenditures
-4
-2
0
2
4
6
8
2005 2006 2007 2008 2009 2010-4
-2
0
2
4
6
8
4.3.9 City General Fund Revenues and Expenditures% Change – Year to Year % Change – Year to Year
Source: National League of Cities
RevenueExpenditures
Chart 4.3.10 City General Fund Tax Receipts
-8-6-4-202468
101214
2005 2006 2007 2008 2009 2010-8-6-4-202468101214
4.3.10 City General Fund Tax Receipts% Change – Year to Year % Change – Year to Year
Source: National League of Cities
Sales TaxProperty TaxIncome Tax
38 2011 FSOC Annual Report
Municipal bonds may be exempt from federal, state, and local taxes if the proceeds of such bonds are used by a government unit for its own purposes and if the property financed by the bonds will be owned by the government unit. Generally, with some exceptions, bonds that do not meet these standards are considered private activity bonds and are not tax-exempt. Furthermore, some types of private activity bonds that are exempt from the regular tax may be subject to the alternative minimum tax.
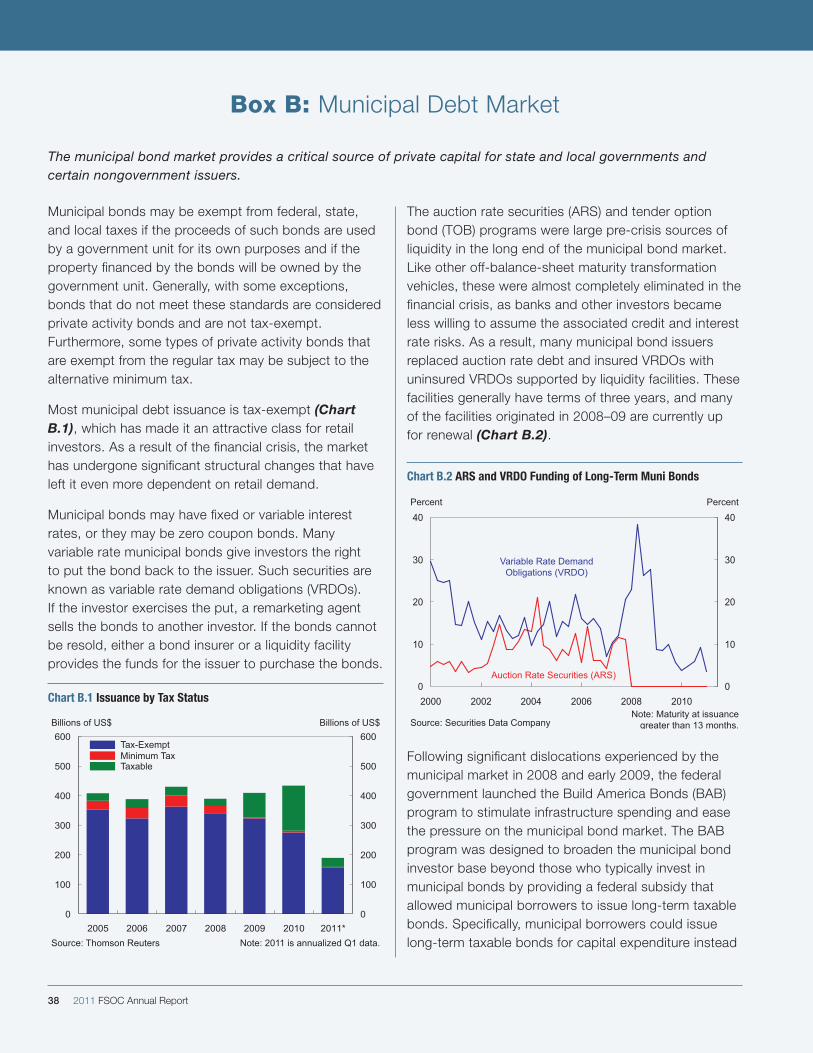
Most municipal debt issuance is tax-exempt (Chart B.1), which has made it an attractive class for retail investors. As a result of the financial crisis, the market has undergone significant structural changes that have left it even more dependent on retail demand.
Municipal bonds may have fixed or variable interest rates, or they may be zero coupon bonds. Many variable rate municipal bonds give investors the right to put the bond back to the issuer. Such securities are known as variable rate demand obligations (VRDOs). If the investor exercises the put, a remarketing agent sells the bonds to another investor. If the bonds cannot be resold, either a bond insurer or a liquidity facility provides the funds for the issuer to purchase the bonds.
The auction rate securities (ARS) and tender option bond (TOB) programs were large pre-crisis sources of liquidity in the long end of the municipal bond market. Like other off-balance-sheet maturity transformation vehicles, these were almost completely eliminated in the financial crisis, as banks and other investors became less willing to assume the associated credit and interest rate risks. As a result, many municipal bond issuers replaced auction rate debt and insured VRDOs with uninsured VRDOs supported by liquidity facilities. These facilities generally have terms of three years, and many of the facilities originated in 2008–09 are currently up for renewal (Chart B.2).
Box B: Municipal Debt Market
The municipal bond market provides a critical source of private capital for state and local governments and certain nongovernment issuers.
Chart B.1 Issuance by Tax Status
0
100
200
300
400
500
600
2005 2006 2007 2008 2009 2010 2011*0
100
200
300
400
500
600
B.1 Issuance by Tax StatusBillions of US$ Billions of US$
Tax-ExemptMinimum Tax
Source: Thomson Reuters
Taxable
Note: 2011 is annualized Q1 data.
Chart B.2 ARS and VRDO Funding of Long-Term Muni Bonds
0
10
20
30
40
2000 2002 2004 2006 2008 20100
10
20
30
40
B.2 ARS and VRDO Funding of Long-Term Muni BondsPercent Percent
Source: Securities Data Company
Variable Rate Demand Obligations (VRDO)
Auction Rate Securities (ARS)
Note: Maturity at issuance greater than 13 months.
Following significant dislocations experienced by the municipal market in 2008 and early 2009, the federal government launched the Build America Bonds (BAB) program to stimulate infrastructure spending and ease the pressure on the municipal bond market. The BAB program was designed to broaden the municipal bond investor base beyond those who typically invest in municipal bonds by providing a federal subsidy that allowed municipal borrowers to issue long-term taxable bonds. Specifically, municipal borrowers could issue long-term taxable bonds for capital expenditure instead

Macroeconomic Environment 39
of tax-exempt bonds, with the federal government rebating 35 percent of the taxable interest expense directly back to the issuer.
The program played an important role in increasing the investor base for municipal bonds and indirectly provided support for the long-term tax-exempt municipal market by limiting the amount of tax-exempt supply. During the first three quarters of 2010, borrowing costs for 30-year municipal issuance fell by 45 basis points, and nearly $500 million flowed into municipal bond mutual funds.
However, in advance of the BAB program’s expiry on December 31, 2010, expectations that supply would shift back to the tax-exempt market pressured yields higher. At the same time, widespread press and analyst commentary on the credit conditions of state and local governments began to trigger sharp outflows from retail municipal bond mutual funds (Chart B.3). Muni-to-Treasury yields, which had already become increasingly differentiated, rose further for some issuers to levels well above their long-term average of 85 percent (Chart B.4). Even though most municipal bond investors generally employ negligible levels of leverage, there were reports of forced selling at distressed levels as some mutual funds struggled to meet redemptions.
The increasing speed of redemptions created concern about municipalities’ ability to issue certain short-term debt instruments called revenue anticipation notes, which cover the mismatch between revenue collections and operating expenditures. However, relatively attractive valuations induced investors to enter the tax-exempt space, and demand from crossover institutional buyers helped counteract redemptions from tax-exempt mutual funds, although these have since recovered.
Going forward, structural issues with the municipal bond investor base remain. Long-term debt generally is not attractive to retail investors. As VRDOs expire, and without maturity transformation structures such as ARS and TOB, it is unclear how cost-effective longer term funding will be sourced through the municipal bond market.
Chart B.3 Municipal Bond Flows
-3
-2
-1
0
1
2
3
2000 2002 2004 2006 2008 2010-3
-2
-1
0
1
2
3
B.3 Municipal Bond FlowsPercent of Assets – 3-month MA Percent of Assets – 3-month MA
Source: ICI
Chart B.4 Municipal Tax-Exempt Bond Ratios
Box B: Municipal Debt Market

40 2011 FSOC Annual Report
increases the likelihood of changes in fiscal policy, such as increases in tax revenues or service reductions to close funding gaps.
4.4 External EnvironmentMany advanced economies face high debt levels and an uneven recovery. Growth in emerging market economies has rebounded more quickly, with implications for capital flows and the potential for overheating.
The United States was not alone among advanced countries in experiencing a large increase in government debt during the financial crisis, while private sector debt shrank or grew at much slower rates than in previous years (Charts 4.0.3 and 4.0.4). For some countries, the direct cost of support to the financial sector has been a large contributor to the increase in government debt.
Starting in early 2010, financial markets began to apply additional pressure on certain peripheral European countries through sharply higher government funding costs. Amid considerable market turmoil in the spring of 2010, concerns over sovereign credit risk came to the forefront (Chart C.2). European authorities working with the International Monetary Fund have developed financial assistance packages for three countries and established mechanisms to resolve future debt problems in the euro area (see Box C: Country Support Developments in Europe).
The abilities of advanced countries to service their debts without provoking sharp market concerns are not exclusively related to total public debt or current fiscal deficits. The size of a country’s net external liabilities, the size of the financial sector relative to GDP, and the share of government debt held externally are other considerations (Chart 4.4.1). Lingering balance sheet weaknesses in the advanced economies are limiting the pace of their recoveries. The natural disaster in Japan has not had widespread impacts on capital flows, as markets effectively absorbed this exogenous shock; but it has interrupted some international supply chains.
Chart 4.4.1 Indebtedness and Leverage in Selected Advanced Economies (April 2011)4.4.2 Indebtedness and Leverage in Selected Advanced Economies (April 2011)
Source: IMF Global Financial Stability Report
Government Net Debt,
2011
Primary Balance,
2011
Government debt held abroad
(% of net debt)
Nonfinancial Corporates’
Debt over Equity (percent)
Bank Leverage (tangible common equity)
Total Economy
Net External Liabilities
US 72 -9 44 105 13 19Japan 128 -8.6 13 176 23 -55UK 75 -5.5 30 89 24 14Canada 35 -4.1 48 72 18 7Euro area 67 -1.7 38 106 26 13Belgium 82 -0.5 80 43 30 -43France 78 -3.5 72 76 26 11Germany 55 -0.3 77 105 32 -39Greece N/A -0.9 N/A 218 17 99Ireland 95 -7.5 71 113 18 102Italy 101 0.2 56 135 20 20Portugal 86 -1.6 60 145 17 106Spain 53 -4.6 60 152 19 90
Note: As a percent of 2010 GDP, unless otherwise noted.
Chart 4.4.2 Real GDP Growth
-10
-8
-6
-4
-2
0
2
4
6
8
10
2005 2006 2007 2008 2009 2010 2011-10
-8
-6
-4
-2
0
2
4
6
8
10
4.4.3 Real GDP Growth% Change – SAAR % Change - SAAR
Source: National Authorities and FRBNY
Advanced Economies
Emerging Economies
Chart 4.4.3 Emerging Markets: Public Debt to GDP
0
10
20
30
40
50
60
70
80
90
1997 1999 2001 2003 2005 2007 20090
10
20
30
40
50
60
70
80
90
4.4.4 Emerging Markets: Public Debt to GDPPercent of GDP Percent of GDP
Source: National Authorities, CEIC Data, EMED, FSOC calculations
European Time Zone
Latin America
EM Asia
European Time Zone excluding Russia
European Time Zone: Hungary, Poland, Russia, South Africa, Turkey, Ukraine; EM Asia: China, Korea, Indonesia, Malaysia, Philippines, Thailand; Latin America: Argentina, Brazil, Chile, Colombia, Ecuador, Mexico, Peru, Venezuela

Macroeconomic Environment 41
In contrast, most emerging market economies (EMEs) have recovered strongly from the global recession (Chart 4.4.2). Moreover, most EMEs currently do not exhibit the macroeconomic and balance sheet vulnerabilities that have been associated with past EME crises, such as large fiscal or current account deficits, banking sector weaknesses, heavy debt burdens, or significant currency and maturity mismatches. However, some countries in emerging Europe are still working through the aftermath of abrupt reversals in financial and economic conditions (Charts 4.4.3 and 4.4.4).
Nonetheless, prospects for sustained strong capital inflows and moderately strong credit growth in some EMEs present challenges. A number of EMEs are now experiencing record private capital inflows, spurred by their strong growth prospects and by low interest rates in the advanced economies (Chart 4.4.5).
To head off the risks of overheating, authorities in many EMEs are tightening policy through a number of channels, including interest rate increases and macroprudential measures such as restrictions on LTV ratios, stricter lending criteria, and restraints on credit growth. However, some policy actions pose difficult trade-offs; for example, they may encourage further capital inflows. Against this backdrop, many countries continue to add to their large holdings of foreign exchange reserves while running current account surpluses, reflecting a desire to limit currency appreciation against the U.S. dollar (Chart 4.4.6).
Chart 4.4.4 Emerging Markets: Current Account
-10
-5
0
5
10
15
20
1994 1996 1998 2000 2002 2004 2006 2008 2010-10
-5
0
5
10
15
20
4.4.4 Emerging Markets: Current Account
Percent of GDP Percent of GDP
Source: CEIC Data and EMED
Latin America
EM Asia
China
European Time Zone
Oil Producers
Oil producers: Russia, Saudi Arabia, UAE, Venezuela; EM Asia: India, Indonesia, Korea, Malaysia, Philippines, Thailand; Latin America: Argentina, Brazil, Chile, Colombia, Ecuador, Mexico, Peru; European Time Zone: Hungary, Poland, South Africa, Turkey, Ukraine
Chart 4.4.5 Private Capital Flows to Emerging Markets
-200
-100
0
100
200
300
400
500
600
1998 2000 2002 2004 2006 2008 2010-200
-100
0
100
200
300
400
500
600
4.4.5 Private Capital Flows to Emerging Markets
Billions of US$ Billions of US$
Source: BIS, EMED, CEIC Data, and FSOC calculations
Bank Loans
Foreign Direct Investment
Net Debt Securities
Portfolio Equity
Chart 4.4.6 EM Foreign Exchange Reserves Coverage
0
200
400
600
800
China
Philipp
ines
Taiwan
Brazil
Malays
iaInd
ia
Russia
Thaila
nd
Mexico Peru
Indon
esia
Colombia
Korea
Singap
ore
Argenti
na
South
AfricaChil
e
Hunga
ry
Poland
Venez
uela
Turke
y
Hong K
ong
0
200
400
600
800
4.4.7 EM Foreign Exchange Reserves CoveragePercent Percent
Source: CEIC Data, EMED, IMF, FSOC calculations Note: As of 2010.
Official Reserves as a Percent of Total Public and Private Debt
Due in the Next Year

42 2011 FSOC Annual Report
Chart C.1 2009 Gross General Government Debt & Deficits
0
25
50
75
100
125
150
0 2 4 6 8 10 12 14 160
25
50
75
100
125
150
C.1 2009 Gross General Government Debt & DeficitsPercent of GDP Percent of GDP
Source: IMF Fiscal Monitor
Greece
Ireland
UK
Spain
Latvia
Lithuania
Italy
Belgium
HungaryGermany
Finland
Estonia Bulgaria
Czech Republic
France
Slovakia
Romania
Netherlands
Portugal
Poland
Slovenia
Austria
Note: Vertical and horizontal lines represent Maastricht Treaty criteria.
Box C: Country Support Developments in Europe
In the wake of the financial crisis, several European countries have experienced severe macroeconomic and financial challenges. These challenges have exposed tensions within the European Monetary Union and limitations in the pre-crisis set of tools available to European policymakers to respond to economic and financial stress.
The European Union (EU), supported by the International Monetary Fund (IMF), committed to lend €255.5 billion to help Greece, Ireland, and Portugal address their vulnerabilities through adjustment programs. In addition, European leaders have agreed on a more comprehensive response that includes increased emergency financing, new EU economic governance rules, and member country commitments to take measures to support fiscal sustainability and competitiveness.
Vulnerabilities differ across the supported European countries. Greece’s crisis has stemmed from unsustainable growth in the public sector, fueled by low-cost cross-border finance that has led to very large fiscal deficits and public debt (Chart C.1). Portugal’s public debt is more moderate, but its private and bank debt is large. Even during periods of vibrant global expansion, Portugal’s growth rates have been anemic, and the structure of the economy is skewed toward low value added industries. In Ireland, the collapse of the property sector and a deep and prolonged recession produced very large banking sector losses and structural fiscal deficits. Irish government support for the banking system has amounted to 46 percent of GDP, which along with large fiscal deficits, has pushed public debt close to 100 percent of GDP.
As of early 2008, markets were not significantly differentiating among euro area countries, with 10-year yields for Greece, Portugal, and Ireland trading at just 10 to 30 basis points above those for Germany. But Greek bond spreads surged following a late 2009 announcement by the Greek government that its budget deficit would be more than three times the original forecast (Chart C.2). Spreads have since increased sharply in Ireland and Portugal. Markets remain attentive to the risk of further contagion.
In May 2010, Europe launched a multipronged effort to address the crisis, making two emergency financing vehicles available to member states: the European
Financial Stability Facility (EFSF), with an initial effective lending capacity of €255 billion, and the European Financial Stability Mechanism (EFSM), with a capacity of €60 billion. Adjustment programs are to be undertaken jointly with the IMF.
In March 2011, European leaders announced broad agreement on a more comprehensive debt crisis response, which must be ratified by national parliaments. The agreement covers three broad areas: (1) an increase in emergency financing; (2) new EU economic governance rules; and (3) a commitment by countries to take additional policy measures on fiscal sustainability and competitiveness.
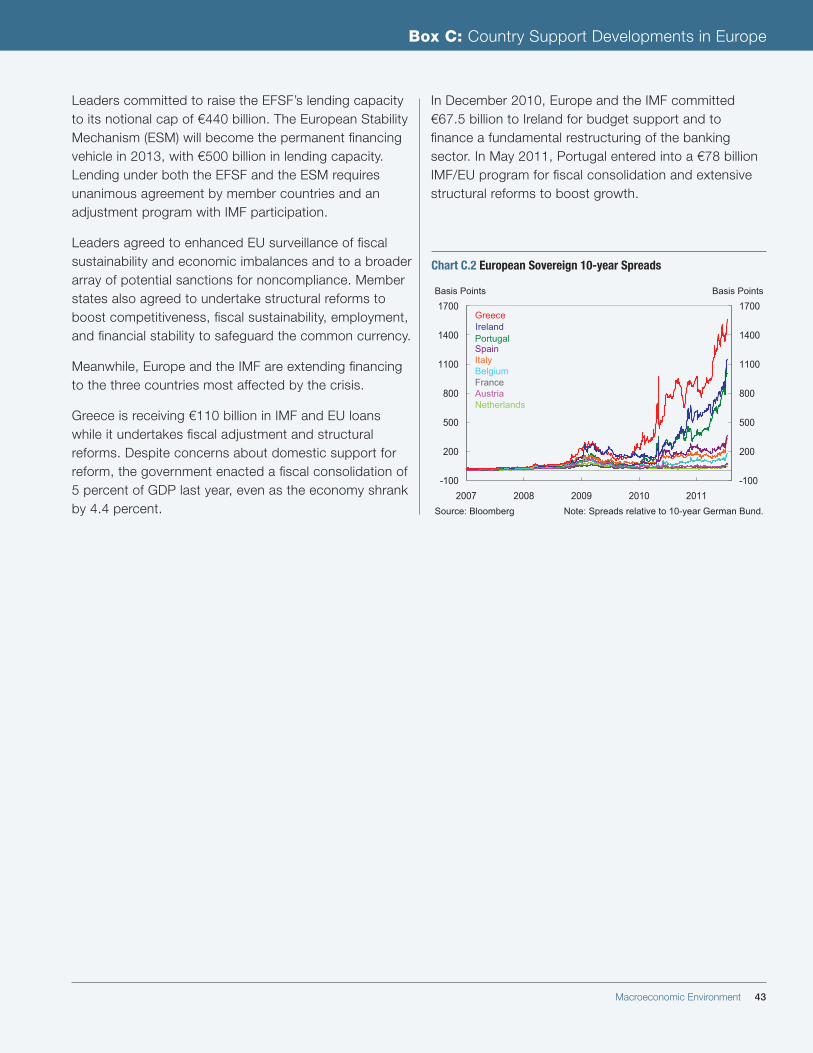
Macroeconomic Environment 43
Leaders committed to raise the EFSF’s lending capacity to its notional cap of €440 billion. The European Stability Mechanism (ESM) will become the permanent financing vehicle in 2013, with €500 billion in lending capacity. Lending under both the EFSF and the ESM requires unanimous agreement by member countries and an adjustment program with IMF participation.
Leaders agreed to enhanced EU surveillance of fiscal sustainability and economic imbalances and to a broader array of potential sanctions for noncompliance. Member states also agreed to undertake structural reforms to boost competitiveness, fiscal sustainability, employment, and financial stability to safeguard the common currency.
Meanwhile, Europe and the IMF are extending financing to the three countries most affected by the crisis.
Greece is receiving €110 billion in IMF and EU loans while it undertakes fiscal adjustment and structural reforms. Despite concerns about domestic support for reform, the government enacted a fiscal consolidation of 5 percent of GDP last year, even as the economy shrank by 4.4 percent.
In December 2010, Europe and the IMF committed €67.5 billion to Ireland for budget support and to finance a fundamental restructuring of the banking sector. In May 2011, Portugal entered into a €78 billion IMF/EU program for fiscal consolidation and extensive structural reforms to boost growth.
Box C: Country Support Developments in Europe
Chart C.2 European Sovereign 10-year Spreads4.4.1 European Sovereign 10-year Spreads
Source: Bloomberg
-100
200
500
800
1100
1400
1700
2007 2008 2009 2010 2011-100
200
500
800
1100
1400
1700Basis Points Basis Points
Note: Spreads relative to 10-year German Bund.
Italy
GreeceIrelandPortugalSpain
AustriaFrance
Netherlands
Belgium