4 Key Components of Demand Driven Supply Chain · 2018-01-31 · Key Components of Demand Driven...
95
4 Key Components of Demand Driven Supply Chain: In this chapter, it will be briefly reviewed the supply chain processes based on the work developed by Lambert (2008), then it will be presented the 3 Demand Driven Supply Chain components proposed by the author, followed by a literature review for each one of the components. The reason to choose Lambert’s processes review was due to its broad coverage of supply chain processes, including customers and suppliers. 4.1 Supply Chain Processes Lambert (2008) states that empirical research has led to the conclusion that the structure of activities within and between companies is a critical cornerstone of creating unique and superior supply chain performance, and therefore, corporate success requires a change from managing individual functions to integrating activities into supply chain management processes. He also emphasizes the importance of having standard business processes across the members of the supply chain, in order to have a “common language” that allows integrating processes from different companies. Lambert (2008) describes that the Global Supply Chain Forum proposes the framework presented in the figure 12 to integrate and manage business processes across the supply chain: PUC-Rio - Certificação Digital Nº 0511118/CA
Transcript of 4 Key Components of Demand Driven Supply Chain · 2018-01-31 · Key Components of Demand Driven...

4
Key Components of Demand Driven Supply Chain:
In this chapter, it will be briefly reviewed the supply chain processes based on the
work developed by Lambert (2008), then it will be presented the 3 Demand
Driven Supply Chain components proposed by the author, followed by a literature
review for each one of the components. The reason to choose Lambert’s
processes review was due to its broad coverage of supply chain processes,
including customers and suppliers.
4.1
Supply Chain Processes
Lambert (2008) states that empirical research has led to the conclusion that the
structure of activities within and between companies is a critical cornerstone of
creating unique and superior supply chain performance, and therefore, corporate
success requires a change from managing individual functions to integrating
activities into supply chain management processes.
He also emphasizes the importance of having standard business processes
across the members of the supply chain, in order to have a “common language”
that allows integrating processes from different companies.
Lambert (2008) describes that the Global Supply Chain Forum proposes the
framework presented in the figure 12 to integrate and manage business
processes across the supply chain:
PU
C-R
io -
Cert
ific
ação D
igital N
º 0511118/C
A

58
Figure 12 – Supply Chain Processes (Lambert, 2008)
This framework presents eight key processes that are common to all companies
in a supply chain, as summarized below:
• Customer relationship management provides the structure for how the
relationship with customers will be developed and maintained. The goal is
to segment customers based on their value over time and increase
customer loyalty of target customers by providing customized products
and services. Cross-functional customer teams tailor Product and Service
Agreements (PSA) to meet the needs of key accounts and other business
segments, and also work together to improve processes and reduce
demand variability and non-value added activities.
• Customer service management is the process that deals with the
administration of the PSAs developed by customer teams as part of the
customer relationship management process. Customer service managers
monitor the PSAs and proactively intervene on the customer’s behalf if
there is going to be a problem to deliver the promise that has been made.
The goal is to solve problems before they affect the customers.
• Demand management is the process that balances the customers’
requirements with the capabilities of the supply chain. With the right
process in place, management can match supply with demand proactively
PU
C-R
io -
Cert
ific
ação D
igital N
º 0511118/C
A

59
and execute the plan with minimal disruptions. A good demand
management process uses point-of-sale and key customer data to reduce
uncertainty and provide efficient flows throughout the supply chain.
• Order fulfillment includes all activities necessary to design a network
and enable the firm to meet customer demand while minimizing the total
delivery cost. In this case, much of the actual work will be performed by
the logistics function, but it also requires coordination with key suppliers
and customers.
• Manufacturing flow management is the process that includes all
activities necessary to obtain, implement and manage manufacturing
flexibility in the supply chain to move products into, through and out of the
plants. Manufacturing flexibility reflects the ability to make a wide variety
of products in a timely manner at the lowest possible cost.
• Supplier relationship management provides the structure for how
relationships with suppliers will be developed and maintained. Close
relationships are developed with a small subset of suppliers based on the
value that they provide to the organization, and more traditional
relationships are maintained with others. Supplier teams negotiate PSAs
with each key supplier, and for less critical suppliers, a standard PSA is
provided and it is not negotiable.
• Product development and commercialization is the process that
provides the structure for developing and bringing to market products
jointly with customers and suppliers. Effective implementation of the
process not only enables management to coordinate the efficient flow of
new products across the supply chain, but also assists other members of
the supply chain with the ramp-up of manufacturing, logistics, marketing,
and other activities necessary to support the commercialization of the
product.
• Returns management is the process by which activities associated with
returns, reverse logistics, gate keeping, and avoidance are managed
within the firm and across key members of the supply chain. The correct
implementation of this process enables management not only manage the
reverse product flow efficiently, but also identify opportunities to reduce
unwanted returns and control reusable assets, such as containers, empty
bottles, etc.
PU
C-R
io -
Cert
ific
ação D
igital N
º 0511118/C
A

60
4.2
Components of Demand Driven Supply |Chain
Table 7 below compares the characteristics of a Demand Driven Supply Chain
described in the literature review presented in chapter 2 with the Supply Chain
Processes described by Lambert (2008) in section 4.1, and it can be seen that
the supply chain processes represent a possible way to categorize the DDSC
components.
Table 7 – Author’s Comparison of DDSC Characteristics and SC Processes
For the sake of simplicity and due to the interrelations of some processes, like
customer relationship and customer service management, the author proposes to
categorize the 8 processes from Lambert (2008) in 3 key components, as
explained below:
• Demand Management, which encompasses all aspects related to
reading, sensing, shaping and synchronizing customer demand.
PU
C-R
io -
Cert
ific
ação D
igital N
º 0511118/C
A

61
• Supply and Operations Management, which covers all aspects of
providing right product with right quantity, based on actual demand signal
and with low cost. This component should encompass:
o Procurement (Supplier Relationship Management).
o Manufacturing Flow Management.
o Order Fulfillment and Return Management, which will be
considered as Logistics Management.
o Customer Service Management and Customer Relationship
Management, which will be considered as Sales Management.
• Product Lifecycle Management, which comprehends new product
introduction and product sunset, in order to reduce supply chain
complexity and allow becoming agile.
It is important to mention that each one of the 3 components above will be
detailed and characterized in the sections below, and based on these
characteristics and the author experience, a Demand Driven Maturity Model will
be developed and used to assess the current state of organizations in light of
Demand Driven concepts.
4.3
Demand Management
In this section, it will be performed a literature review for each one of the 4
categories of the Demand management – Statistical Forecast, Sales and
Operations Planning (S&OP), Collaborative Planning and Forecasting
Replenishment (CPFR) and Vendor managed Inventory (VMI). This review
allowed identify the DDSC characteristics for each category which was used to
develop the 5 level maturity model.
Based on Croxton et al (2002), the demand management process is concerned
with balancing the customers’ requirements with the supply chain capabilities.
This includes forecasting demand and synchronizing it with production,
procurement, and distribution capabilities. A good demand management process
can enable a company to be more proactive to anticipated demand.
An important component of demand management is finding ways to reduce
demand variability and improve operational flexibility. They argue that reducing
demand variability aids in consistent planning and reduce costs, and that
increasing flexibility helps the firm respond quickly to internal and external events.
PU
C-R
io -
Cert
ific
ação D
igital N
º 0511118/C
A

62
Most customer-driven variability is unavoidable, but one of the goals of demand
management is to eliminate management practices that create noise and
increase variability, and to introduce policies that foster smooth demand patterns.
Another key part of demand management is developing and executing
contingency plans when there are interruptions to the operational plans. The goal
of demand management is to meet customer demand in the most effective and
efficient way.
The demand management process can have a significant impact on the
profitability of a firm, its customers and suppliers. Some examples are:
• Having the right product on the shelves will increase sales and customer
loyalty
• Improved forecasting can reduce raw materials and finished goods
inventories
• Smoother operational execution will reduce logistics costs and improve
asset utilization.
For Croxton et al (2002), demand management is about forecasting and
synchronizing, and has both strategic and operational sub-processes, as shown
in figure 13:
Figure 13 – Demand Management Framework based on Croxton et al (2002)
When Croxton et al. (2002) detailed the sub-process of “determine forecasting
procedures”, they explain that the first step is to understand what type of forecast
is needed, then what data is available, and finally, select a forecasting method
+which will depend on the environment that the forecasting is taking place. They
PU
C-R
io -
Cert
ific
ação D
igital N
º 0511118/C
A

63
presented a two-by-two matrix to show which forecast approach is appropriate
based on demand variability and demand volume, as shown in figure 14 below:
Figure 14 – Two by Two Matrix (Croxton et al, 2002)
This matrix shows that products with high variability and high volume require
more human input from sales or customers, as the statistical quantitative
methods alone will not be able to provide good forecast accuracy.
The second case is when a product has low volume and high variability, which in
this case a make-to-order production strategy (or pull system) should be used,
which avoids the need for an SKU level forecast.
The last case is when a product has low demand variability, and in this case, a
data driven statistical forecast should be applied, as it will allow capture the
benefits of a push system. The approach described above brings light to help
define when a company should be “demand driven” or “forecast driven”. Based
on Croxton et al (2002), it is proposed to expand the matrix to also include the
tools and approaches that can be used in each one of the three situations, as
detailed below and illustrated in figure 15:
• For “data driven forecast”, it is suggested to apply statistical forecast
models, which will generate good forecast accuracy results, and will also
automate the forecasting calculation, saving demand planners’ time to
devote to more complicated and/or variable SKUs.
• For “make to order”, it is suggested to apply Vendor Managed Inventory
(VMI) and demand visibility to sense the demand signals and quickly react
to fulfill it.
PU
C-R
io -
Cert
ific
ação D
igital N
º 0511118/C
A

64
• For “people driven forecast”, it is suggested to apply Sales and
Operations Planning (S&OP) and Collaborative Planning and Forecast
Replenishment (CPFR), as they represent structured and formal
processes to align demand figures across different functional areas and
different organizations.
Make to Order or Pull System
People Driven Forecast
Data Driven Forecast
Vendor Managed Inv.Demand Visibility
Sales &Operations Planning CPFR
Statistical Forecast
Demand
Variability
Demand Volume HighLow
Low
High
Figure 15 – Author’s Proposed Expanded 2x2 Matrix
Each one of the proposed tools & processes showed in figure 14 will be
described in detail in the next sections.
4.3.1
Statistical Forecast
4.3.1.1
Introduction
In management and administrative situations, the need for planning is great
because the lead time (time lag between awareness of an event and the
occurrence of that event) for decision making ranges from several years (for the
case of capital investments) to a few days or hours (for transportation or
production scheduling) to a few seconds (for telecommunication routing), and
forecasting is an important aid in effective and efficient planning.
PU
C-R
io -
Cert
ific
ação D
igital N
º 0511118/C
A

65
The trend to be able to more accurately predict a wider variety of events,
particularly those in the economic/business environment, will continue to provide
a better base from which to plan, and formal forecasting methods are the means
by which this improvement is possible.
Makridakis (1998) states that a wide variety of forecasting methods are available
to management and range from the most naïve methods to highly complex
approaches, such as neural nets and econometric systems of simultaneous
equations.
Chatfield (2004) pointed out that it is also important to realize that no single
method is universally applicable. Rather, the analyst must choose the procedure
that is most appropriate for a given set of conditions. Forecasts are conditional
statements about the future based on specific assumptions, and thus, forecasts
are not sacred and the analyst should always be prepared to modify them as
necessary in the light of any external information. For long-term forecasting, it
can be helpful to produce a range of forecasts based on different sets of
assumptions, so that, alternative “scenarios” can be explored.
Moon et al (1998) state that a sales forecasting is a management function that
companies often fail to recognize as a key contributor to corporate success. From
a top-line perspective, accurate sales forecasts allow a company to provide high
levels of customer service, delivering volume in a timely and efficient manner,
keeping both channel partners and final customers satisfied. Accurate forecasts
help a company avoid lost sales or stock-out situations, and prevent customers
from going to competitors. At the bottom line, the effect of accurate forecasts can
be profound. Raw materials and component parts can be purchased much more
cost-effectively, logistical services can be obtained at a lower cost and inventory
levels can be reduced.
In order to get senior management support to develop the demand planning
function inside the organization is critical to know how to measure the impact of
forecast error on the company finance results. Mentzer (1999) states that senior
levels are not concerned about the forecast accuracy results, but for the impact
that improved forecasting accuracy can have on shareholder value. To that end,
he proposed to use the “Du Pont Model” of financial performance. (The Du Pont
Model is a framework for viewing the impact of changes in sales, capital, and
operating expenses on return on net assets). The figure 16 below shows an
example of the Du Pont Model:
PU
C-R
io -
Cert
ific
ação D
igital N
º 0511118/C
A

66
Figure 16 – Du Pont Model Proposed by Mentzer (1999)
Another key successful factor in forecasting is to have the right organizational
structure, which means, the right number of people, with the right skills and
performance metrics, and with the right report level.
Lapide (2003) argues that a combination of skills, organization and corporate
culture form the cocktail that drives the success of any demand planning
department. He describes the following critical skills:
• Quantitative skills because forecasting often involves the use of statistical
forecasting methods and algorithms.
• Computer skills, since demand forecasts are often need to be done at the
SKU (Stock Keeping Unit) level for multiple periods of time, which usually
generate tens or hundreds of thousands of entities.
• Interpersonal skills to be able to communicate with other departments in
order to gather the market intelligence needed to develop and adjust the
baseline forecast.
• Understand the business in order to read market signals and identify
demand variations.
• Process management skills to ensure to get a one number forecast. This
entails getting a cross-functional team to come to a consensus on the
forecasts.
PU
C-R
io -
Cert
ific
ação D
igital N
º 0511118/C
A

67
Mentzer and Cox reported a study to analyze the corporate and forecast factors
which affect forecast accuracy. The research revealed that the most important
corporate factor was formal training of forecast personnel, which means more
formal training received the greater achieved forecast accuracy.
Mentzer and Davis (2007) propose a theory-based sales forecasting
management (SFM) framework, as illustrated in figure 17, consisting of four
components (sales forecasting climate, capability, performance outcomes, and
performance measurement), to facilitate the exploration of the effects of
organizational factors in sales forecasting. They argue that a firm’s sales
forecasting climate influences its sales forecasting capability, which in turn
determines performance outcomes.
Figure 17 – Sales Forecasting Management proposed by Mentzer and Davis
(2007)
Mentzer and Moon (2005) propose to have “multidimensional metrics”, in other
words, metrics that cover three dimensions to sales forecasting performance, in
order to clear define for those responsible for sales forecasting what needs to be
improved. Each of the three dimensions is described below:
1) Accuracy, which comprehends actual measures like the Mean Error (ME),
Mean Absolute Error (MAE), Mean Squared Error (MSE), and Measures relative
to a Perfect Forecast like the Percent Error (PE) and the Mean Absolute Percent
Error (MAPE).
PU
C-R
io -
Cert
ific
ação D
igital N
º 0511118/C
A

68
2) Costs, which comprehend operations costs, related to production and logistics,
and marketing costs, related to trade promotions, ineffective advertising, and
product development without adequate demand, wrong pricing that does not
maximize profit contribution.
3) Customer Satisfaction which comprehends customer surveys to determine
their satisfaction with all company activities. It should cover customers’
perception of the timeliness, availability and condition of the distribution service
they receive, and finally, the overall customer satisfaction process.
Taylor (2000) developed an approach to eliminate demand amplification. The
approach developed had the objective to be sufficiently straightforward to be
easily applied by staff that has day-by-day responsibility for managing demand
along a supply chain. There are 7 steps to be followed:
• Identify and quantify demand amplification
• Analyze the specific causes of the effect in the supply chain under study
• Education and awareness raising with relevant personnel
• Creation of a demand management team from across the supply chain
• Development and application of detailed policies to address the effect in
selected trial value streams
• Monitoring and evaluation of supply chain performance during the trial
• Roll out the policy to other value streams, modifying in light of the trial.
4.3.1.2
Forecast Models
Chatfield (2004) states that forecasting methods can be broadly classified into
three group as follows:
1. Subjective:
Forecasts can be made on a subjective basis using judgment, intuition,
commercial knowledge or any other relevant information. Methods range
widely, like the Delphi technique, in which a group of forecasters tries to
obtain a consensus forecast with controlled feedback of other analysts’
predictions and opinions, and other relevant information.
2. Univariate:
Forecasts of a given variable demand are based on a model fitted only to
present and past observations of a given time series. There are several
different univariate models, like Extrapolation of Trend Curves, Simple
PU
C-R
io -
Cert
ific
ação D
igital N
º 0511118/C
A

69
Exponential Smoothing, Holt Method, Holt-Winters Method, Box-Jenkins
Procedure, and Stepwise Auto-regression, which can be regarded as a
subset of the Box-Jenkins Procedure.
3. Multivariate:
Forecasts of a given variable depend at least partly on values of one or
more additional variables, called explanatory variables. Models of this
type are usually called “causal models”, and include Multiple Regression,
and Econometric Models.
Makridakis (1998) classifies the forecasting techniques into two categories:
1. Quantitative to be considered when sufficient quantitative information is
available. In this case, it can be sub-divided into:
a. Time Series, which is a collection of observations made
sequentially through time. In this class of models, prediction of the
future is based on past values of a variable and / or past error, but
not on explanatory variables.
b. Explanatory, which assumes that the variable to be forecasted
exhibits an explanatory relationship with one or more independent
variables.
2. Qualitative to be considered when little or no quantitative information is
available, but sufficient qualitative knowledge exists.
He also states that quantitative forecasting can be applied when three conditions
exist:
• Information about the past is available
• This information can be quantified in the form of numerical data
• It can be assumed that some aspects of the past pattern will continue into
the future.
Armstrong (2001) proposes a methodology tree to classify forecast models in
different categories as detailed in figure 18:
PU
C-R
io -
Cert
ific
ação D
igital N
º 0511118/C
A

70
Figure 18 – Methodology Tree Proposed by Armstrong (2001)
It is not the objective of this thesis to review in detail each one of the forecast
models currently available, but instead, list the key models that should be used in
forecasting for business and operations. For a detailed explanation of each
forecast model, please refer to the work developed by Mentzer and Moon (2005),
Makridakis (1998) or Oliveira Junior (2004).
Regarding the steps required to perform a statistical forecast, Makridakis (1998)
proposes 5 steps to forecast when quantitative data is available as detailed in
figure 19:
PU
C-R
io -
Cert
ific
ação D
igital N
º 0511118/C
A

71
.
Figure 19 – Steps to forecast based on Quantitative Models (Makridakis, 1998)
4.3.1.3
How to Improve Forecast Accuracy
Moon et al (1998) proposed seven key points that companies should pay close
attention to in order to improve its forecasting performance. The table 8
summarizes each principle:
PU
C-R
io -
Cert
ific
ação D
igital N
º 0511118/C
A

72
Table 8 – Seven Principles to Better Forecast (Moon et al., 1998)
Armstrong (2001) summarizes knowledge about forecasting in one hundred and
thirty nine principles. The principles cover formulating a problem, obtaining
information about it, selecting and applying methods, evaluating methods, and
using forecasts. Each principle is described along with its purpose, the conditions
under which it is relevant, and the strength and sources of evidence, and a
checklist of principles is provided to assist in auditing the forecast process.
These principles will also be considered as a key input to develop the maturity
model.
PU
C-R
io -
Cert
ific
ação D
igital N
º 0511118/C
A

73
4.3.2
Sales and Operations Planning
4.3.2.1
Introduction
Based on Wallace (2004), Sales and Operations Planning (S&OP) is a business
process that helps companies keep demand and supply in balance. It does that
by focusing on aggregate volumes (e.g. product families or product groups), so
that, mix issues (individual products and customer orders) can be handled more
readily. It occurs on a monthly cycle and displays information in both units and
dollars, thus it integrates operational and financial planning.
S&OP links the company’s strategic plans and business plan to its detailed
processes – order entry, master scheduling, plant scheduling, and purchasing.
S&OP enables the company’s managers to view the business holistically, and
gives them a window into the future, to avoid lack of operational capacity to meet
customer demand.
S&OP is cross-functional, involving general management, sales, demand
planning, manufacturing, logistics, finance, and product development. It occurs at
multiple levels within the company, up to and including the executive in charge of
the business unit (e.g. division president, business unit general manager, etc.).
S&OP is an integral part of the Supply Chain Management. A given supply chain
will not work well if its various members do not have good volume plans in the
first place, and if they are slow to react to the inevitable changes in volume. In
companies without S&OP process, there is frequently a disconnection between
the strategic plans and the detailed plans and schedules. In other words, the
plans developed and authorized by senior management are not connected to the
plans and schedules that drive day-to-day activities on the plant floor.
The framework in figure 20 clearly shows the importance of the S&OP process,
as it links the strategic and business plans together with the detailed planning
process at the shop floor level.
PU
C-R
io -
Cert
ific
ação D
igital N
º 0511118/C
A

74
Strategic Planning
Business Planning
VolumeSales & Operations
Planning
Sales
PlanOperations
Plan
Forecasting & Demand
Mgmt
Capacity Planning
MIXMaster Scheduling
Detailed Planning & Execution Systems
Demand Supply
Figure 20 – Wallace (2004) Resource Planning Model
4.3.2.2
Detailed S&OP Process
Sales and Operations Planning is a monthly process that comprehends 6 steps,
as illustrated and described in figure 21:
Demand
Planning
Capacity analysis
Consensus of Demand
and Operational Plan
Data Gathering
Unconstraint
Forecast
Alignment with
Marketing and Sales
Send to
S&OP Group
S&OP
Analysis
Pre S&OP
Meeting
Goals Defined and
Communicated Executive
S&OP Meeting
1
2
3
4
5
6
Figure 21 – Author’s Monthly Sales & Operations Planning Process
PU
C-R
io -
Cert
ific
ação D
igital N
º 0511118/C
A

75
Step 1: Data Gathering
Most of this activity occurs within the Information System and/or Demand
Planning departments, and happens shortly after the end of the month. It consists
of three elements:
• Update the files (e.g. sales, revenue, etc.) with data from the month just
ended;
• Generate information for Sales and Marketing people to use in developing
the new forecast: Sales analysis data, statistical forecast reports, etc.
• Disseminate the information to the appropriate people.
Step 2: Unconstraint Statistical Forecast
The second step is to generate the unconstraint forecast, and consists of two
elements:
• Run statistical forecast models to predict future volumes, open by
business unit, geographic regions, product family, SKU;
• Apply appropriate forecast techniques for New Products (e.g. Regression,
Market Research, Sales Forecast, Conjoint Analysis)
Step 3: Demand Planning
The third step is one of the most important, and refers to the alignment of the
demand figures that will be used by all departments for analyzing capacity
availability and operational impacts, and consists of 3 elements:
• Sales people review the information received in step 2, analyze, discuss
and generate the forecast figures for the next period (e.g. Special for key
customers like Supermarkets, where promotions have a great impact).
• New Product department review and adjust timing and volumes for new
product launches.
• Document key assumptions that underlie the forecasts.
Step 4: S&OP Analysis
The forth step refers to the supply (capacity) analysis and will be performed by
each functional area (e.g. manufacturing, warehousing, inventory, distribution,
transportation, etc.), and consists of 2 elements:
• Each functional area should analyze operational capacity to fulfill demand
volumes:
o Production capacity (master plan);
o Warehousing and storage capacity;
o Inventory availability (Fill Rate);
o Supplier capacity for key raw materials;
PU
C-R
io -
Cert
ific
ação D
igital N
º 0511118/C
A

76
o Distribution capacity (delivery);
o Transportation capacity (long haul)
• Estimate company’s financial results based on the forecast:
o Net Operating Profit After Tax (NOPAT), Earnings Before Interest,
Taxes, Depreciation and Amortization (EBITDA), and Earnings per
Share (EPS), just to give some examples.
Outputs from the S&OP analysis are the standard graphics comparing required
vs. available capacity for each process, and also a list of any supply problem that
cannot be resolved by the functional area or that require senior manager
decision. (In some cases, demand can highly exceed supply capacity and the
constraints cannot be overcome within the allowable time, requiring, for instance,
extra investment).
In some companies, they prefer to conduct a formal meeting for supply planning,
while others find it more effective to simply work the process informally on a one
by one basis.
Step 5: Pre S&OP Meeting
The fifth step refers to the S&OP meeting, where each area will present their
findings and results, and have 4 objectives:
• Make decisions regarding the balancing of demand and supply;
• Identify areas where agreement cannot be reached, and determine how
the situation will be presented in the Executive S&OP meeting;
• Develop, where appropriate, alternative scenarios with different courses
of action to solve a given problem;
• Set the agenda for the Executive S&OP meeting
The key players in this meeting typically include several different positions like,
demand manager, logistics manager, customer service, supply planning
manager, production manager, and finance planning manager, sales manager
and marketing manager.
Step 6: Executive S&OP Meeting
This is the culminating event in the monthly S&OP cycle and has the following
objectives:
• Make decisions about demand and operational plans (accept the
recommendation from the Pre-S&OP team or choose another course of
action);
• Authorize changes in production, procurement, distribution, where
significant costs are involved;
PU
C-R
io -
Cert
ific
ação D
igital N
º 0511118/C
A

77
• Analyze the dollar version of the S&OP against Business Plan targets
The key players in this meeting include CEO, director of sales, marketing, supply
chain, logistics, finance and human resources. Outputs from this meeting should
include the meeting notes, which spell out the decisions made, and modifications
to the business plan, if required.
4.3.2.3
S&OP Successful Factors
Lapide (2004) proposed a list of dozen factors that can help to implement an
effective S&OP process that maintains exceptional supply chain operational
performance over time. The factors are listed below and are detailed in the
reference provided:
• Ongoing, routine S&OP meetings
• Structured meeting agendas
• Pre-work to support meeting inputs
• Cross-functional participation
• Participants empowered to make decisions
• An unbiased, responsible organization to run a disciplined process
• Internal collaborative process leading to consensus and accountability
• An unbiased baseline forecast to start the process
• Joint supply and demand planning to ensure balance
• Measurement of the process
• Supported by integrated supply-demand planning technology
• External inputs to the process.
4.3.2.4
S&OP Maturity Model
Lapide (2005) proposed a 4 step maturity model to help companies assess their
current performance in terms of process and enabling technology, as described
in figure 22:
PU
C-R
io -
Cert
ific
ação D
igital N
º 0511118/C
A

78
Figure 22 – 4 Step Maturity Model (Lapide, 2005)
4.3.2.5
Benefits from S&OP Implementation
Based on Wallace (2004), the implementation of S&OP process usually results in
the following benefits:
• More stable production rates and less overtime, leading to higher
productivity
• Better visibility into future capacity problems, covering both over and
under capacity
• Enhanced teamwork among middle-management from different areas like
sales, operations, finance, etc.
• Enhanced teamwork within the executive group
• Greater accountability regarding actual performance to plan
• Better demand & supply balance across the company’s supply chain
• Ability to make changes quickly off of that common game plan
• For make to stock companies: Higher customer service, and often lower
finished goods inventories, at the same time
PU
C-R
io -
Cert
ific
ação D
igital N
º 0511118/C
A

79
• For make to order companies: Higher customer service, and often smaller
customer order backlogs and hence shorter lead times, at the same time
• For finish-to-order companies: Higher customer service, quicker
response, and often lower component inventories, at the same time.
• The establishment of “one set of numbers”, which will be the base to run
the business.
Several companies, from different industries and business segments in Brazil,
had already started implementation of S&OP process and concepts, as described
by ILOS institute (2009) in figure 23:
Figure 23 – Status of S&OP Implementation in Brazil (ILOS, 2009)
Companies that implemented S&OP process achieved significant business and
operational results, as listed below:
• SPP-Nemo achieved 40% increase in forecast accuracy with a 40%
eduction in inventories and 27% reduction in total time to plan operations.
• RECKITT BENCKISER achieved 35% reduction in forecast error based
on Mean Average Percentage Error (MAPE) from 23% to 15%, and also
increased visibility of customer demand, generating a unique demand
plan for the whole organization.
• ARNO achieved 30% reduction in forecast error based on Mean Average
Percentage Error (MAPE) from 54% to 38%, and also get greater
commitment from the sales team to the planning process.
PU
C-R
io -
Cert
ific
ação D
igital N
º 0511118/C
A

80
• DIMED achieved 35% reduction in forecast error based on Mean Average
Percentage Error (MAPE) from 54% to 35%, and also 50% reduction in
inventory of low turn products, which generated a cost avoidance of
U$1MM/year
• MICHELIN reported an 18% reduction on average inventory levels, and
also reduction of expedite imports using transportation.
ILOS (2009) also reported the benefits of S&OP implementation based on
research of 94 companies in Brazil, as described in figure 24:
Figure 24 – Benefits of S&OP Implementation (ILOS, 2009)
4.3.3
Collaborative Planning, Forecasting and Replenishment (CPFR):
4.3.3.1
Introduction
Based on VICS (Voluntary Interindustry Commerce Standards) definition, CPFR
is a business practice that combines the intelligence of multiple trading partners
in the planning and fulfillment of customer demand. CPFR links sales and
marketing best practices, such as category management, to supply chain
planning and execution processes to increase product availability while reducing
inventory, transportation and logistics costs.
PU
C-R
io -
Cert
ific
ação D
igital N
º 0511118/C
A

81
The CPFR model has a general framework, illustrated in figure 25, by which a
buyer and seller can use collaborative planning, forecasting, and replenishing
processes in order to meet customer demand. To increase performance, the
buyer and seller are involved in four collaboration activities that are listed in
logical order, but companies often engage in these activities simultaneously.
Figure 25 – VICS CPFR Model
Strategy and Planning
The first collaboration task under this activity is Collaboration Arrangement, which
is a method for defining the relationship in terms of establishing business goals,
defining the scope, and assigning checkpoints and escalation procedures, roles,
and responsibilities. The retailer task related to this collaboration task is Vendor
Management, and the manufacturer task is Account Planning.
The second collaboration task is Joint Business Plan. This task pinpoints the
major actions that affect supply and demand in the planning period. Examples of
these are introducing new products, store openings and closings, changing
inventory policy, and promotions. The retailer task associated with this is
Category Management and the manufacturer task is Market Planning.
Demand and Supply Management
Sales forecasting, which projects point-of-sale consumer demand, is one of the
collaboration tasks associated with this activity. The retailer task here is Point of
PU
C-R
io -
Cert
ific
ação D
igital N
º 0511118/C
A

82
Sale (POS) Forecasting and the manufacturer task is Market Data Analysis. The
other collaboration task is Order Planning/Forecasting which uses factors, such
as transit lead times, sales forecast, and inventory positions to determine future
product ordering and requirements for delivery. The associated retailer task is
Replenishment Planning, and Demand Planning is the associated manufacturer
task.
Execution
The first collaboration task under the Execution activity is Order Generation. This
task transitions forecasts to demand for the firm. The retailer task related to this
collaboration task is Buying/Replenishing, and the manufacturer task is
Production and Supply. The second collaboration task is Order Fulfillment, and
this is the preparation of products for customer purchase through the process of
producing, shipping, delivery, and stocking. In this case, both the retailer and
manufacturer task is Logistics/Distribution.
Analysis
Exception Management, which oversees the planning and operations for
conditions that are out-of-bounds, is one of the collaboration tasks associated
with this activity. The retailer task is Store Execution, and the manufacturer task
is Execution Monitoring.
The other collaboration task is Performance Assessment which calculates
important metrics in order to discover trends, develop other strategies, and
assess the attainment of business goals. The retailer task here is Supplier
Scorecard, and the manufacturer task is Customer Scorecard. The model
described above is a two-tiered model. However, this model can be extended to
include more than two layers in the supply chain. VICS calls this “N-tier
Collaboration”, which is a relationship that develops from retailers through
manufacturers/distributors to suppliers.
4.3.3.2
Detailed CPFR Process
With CPFR, trading partners agree to develop a collaborative business
relationship based on exchanging information to support the synchronization of
activities and to deliver products in response to market demand.
The following nine steps illustrated in figure 26 for CPFR implementation are
based on VICS CPFR Voluntary Guidelines. Broadly, the nine steps can be
PU
C-R
io -
Cert
ific
ação D
igital N
º 0511118/C
A

83
further classified under three different phases – 1) Planning, 2) Forecasting and
3) Execution. The planning stage involves preparation to evaluate a company’s
internal requirements and capabilities, trading partner segmentation, and
implementation strategy. The forecasting phase involves steps, such as creation
of sales and order forecast, and exception handling, which is an ongoing iterative
process. In the third phase, order execution and delivery are handled. In all three
phases, trading partners work together to achieve common goals defined in the
initial phase
Figure 26 – VICS CPFR Business Model
PU
C-R
io -
Cert
ific
ação D
igital N
º 0511118/C
A

84
Phase 1: Planning
Step 1 – Develop CPFR Front-end Agreement
The entities involved in a collaborative relationship (suppliers and buyers)
establish guidelines and rules for the collaborative relationship. The front-end
agreement addresses each party’s expectations, and the actions and resources
necessary for success. To accomplish this, the two parties co-develop a general
business agreement that includes the overall understanding and objective of the
collaboration, confidentiality agreements, and the empowerment of resources
(both actions and commitment) to be employed throughout the CPFR process.
Step 2 – Create Joint Business Plan
In this step of the CPFR process, the entities (suppliers and buyers) exchange
information about their corporate strategies and business plans in order to
collaborate on developing a joint business plan. The partners first create a
partnership strategy, and then, define category roles, objectives, and tactics. The
item management profiles (e.g., order minimums and multiples, lead times, order
intervals) for items to be collaborated on are established.
Phase 2: Forecasting
Step 3 – Create Sales Forecast
In this step, retailer point of sale (POS) data, causal information, and information
on planned events are used to create a sales forecast that supports the joint
business plan. Table 9 describes that in scenarios A, B, and C, this step is
carried out by the retailer/distributor (or buyer), and in Scenario D, the
manufacturer (or seller) is responsible for creating the sales forecast.
Table 9 – Key Scenarios Lead Role (VICS)
The sales forecast is generated by either or both parties for a given period with
forecasting tools that use all the relevant information and set guidelines.
PU
C-R
io -
Cert
ific
ação D
igital N
º 0511118/C
A

85
Step 4 – Identify Exceptions for Sales Forecast
This step identifies the items that fall outside the sales forecast constraints set
jointly by the manufacturer and distributor. (The exception criteria for each item
are agreed to in the Front-end agreement).
Step 5 – Resolve/Collaborate on Exception Items
This step involves resolving sales forecast exceptions by querying shared data,
email, telephone conversations, meetings, and so on, and submitting any
resulting changes to the sales forecast. “Collaborative negotiations between
buyer and sellers resolve item exceptions” (VICS, 2002).
Step 6 – Create Order Forecast
In this step, POS data, causal information, and inventory strategies are combined
to generate a specific order forecast that supports the shared sales forecast and
the joint business plan. Actual volume numbers are time-phased and reflect
inventory objectives by product and receiving location. The short-term portion of
the forecast is used for order generation, while the longer-term portion is used for
planning.
Step 7 – Identify Exceptions for Order Forecast
This step determines what items fall outside the order forecast constraints set
jointly by the manufacturer and distributor.
Step 8 – Resolve/Collaborate on Exception Items
This step involves the process of investigating order forecast exceptions through
querying of shared data, email, telephone conversations, meetings, and so on,
and submitting any resulting changes to the order forecast.
Phase 3: Execution
Step 9 – Order Generation
This last step marks the transformation of the order forecast into a committed
order. Order generation can be handled by either the manufacturer or distributor
depending on competencies, systems, and resources. Regardless of who
completes this task, the created order is expected to consume the forecast.
PU
C-R
io -
Cert
ific
ação D
igital N
º 0511118/C
A
86
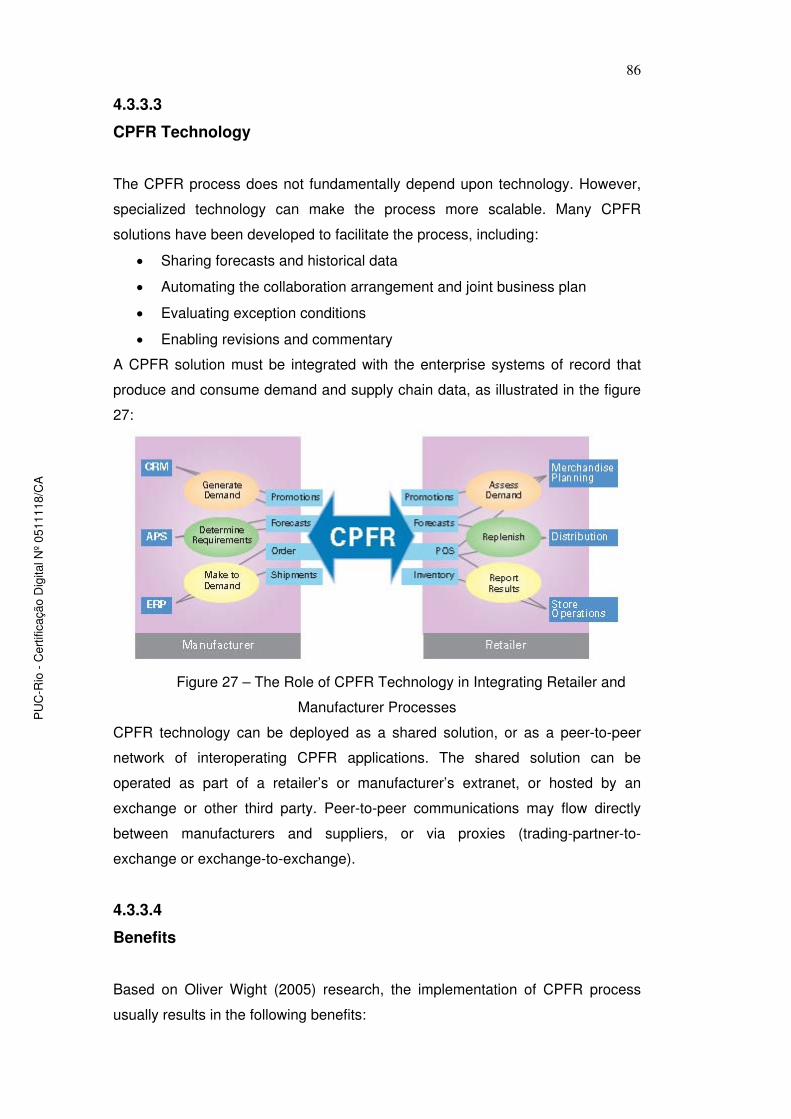
4.3.3.3
CPFR Technology
The CPFR process does not fundamentally depend upon technology. However,
specialized technology can make the process more scalable. Many CPFR
solutions have been developed to facilitate the process, including:
• Sharing forecasts and historical data
• Automating the collaboration arrangement and joint business plan
• Evaluating exception conditions
• Enabling revisions and commentary
A CPFR solution must be integrated with the enterprise systems of record that
produce and consume demand and supply chain data, as illustrated in the figure
27:
Figure 27 – The Role of CPFR Technology in Integrating Retailer and
Manufacturer Processes
CPFR technology can be deployed as a shared solution, or as a peer-to-peer
network of interoperating CPFR applications. The shared solution can be
operated as part of a retailer’s or manufacturer’s extranet, or hosted by an
exchange or other third party. Peer-to-peer communications may flow directly
between manufacturers and suppliers, or via proxies (trading-partner-to-
exchange or exchange-to-exchange).
4.3.3.4
Benefits
Based on Oliver Wight (2005) research, the implementation of CPFR process
usually results in the following benefits:
PU
C-R
io -
Cert
ific
ação D
igital N
º 0511118/C
A

87
• Forecast accuracy improvements of 20% to 30%
• Sales revenue growth of 8% to 10%
• Cost of goods sold reduced 3% to 4%
• Operating costs reduced 1% to 2%
• Lead times and cycle times reduced 25% to 30%
4.3.3.5
CPFR Assessent
The VICS (Voluntary Interindustry Commerce Standards) developed a CPFR
capability assessment to provide a framework for understanding the gap between
a company’s existing practices and CPFR best practices, and also to serve as
the starting point for change and enable realistic expectations for a CPFR
program.
The table 10 below shows the 4 key areas covered in the VICS assessment and
illustrates the increasing difficulty and benefits of progressing vertically through
the processes of Collaboration to Integrated Planning and Forecasting to
Replenishment and finally to Supply Chain Management.
Table 10 – VICS Capability Assessment
PU
C-R
io -
Cert
ific
ação D
igital N
º 0511118/C
A

88
It will not be presented the detailed VICS assessment in the body of this thesis.
However, it will be considered as a key input when developing the Demand
Driven Supply Chain Maturity Model in chapter 5.
4.3.4
Vendor Managed Inventory & Demand Visibility
4.3.4.1
Introduction
VMI is essentially a distribution channel operating system whereby the inventory
at the distributor / retailer is monitored and managed by the manufacturer/vendor.
It includes several tactical activities including, determining appropriate order
quantities, managing proper product mixes, and configuring appropriate safety
stock levels. The rationale is that by pushing the decision making responsibility
further up the supply chain, the manufacturer/vendor will be in a better position to
support the objectives of the entire integrated supply chain, resulting in a
sustainable competitive advantage. Centralizing the replenishment decision also
helps reduce the distortions in ordering introduced when there are several
intermediaries that place orders in a supply chain.
VMI was popularized in the late 1980s by Wal-Mart and Procter & Gamble
(Waller et al., 1999), and then, it was subsequently implemented by many other
leading companies from different industries, such as GlaxoSmithKline (Danese,
2004), Electrolux Italia (De Toni and Zamolo, 2005), Nestle and Tesco (Watson,
2005), etc.
The enabling technology behind successful VMI is Electronic Data Interchange
(EDI) which provides manufacturer/vendor with essentially the same point of
sales (POS) and inventory information retained by the distributor / retailer. As a
result, improved forecasting is possible because the manufacturer/vendor can
observe demand for its product over a wider range of customers and can
incorporate the effects of promotions, competing products, and seasonal
variations in demand. Therefore, successfully integrating systems technology in
the transactions between value chain participants is integral to realize benefits of
VMI.
PU
C-R
io -
Cert
ific
ação D
igital N
º 0511118/C
A

89
4.3.4.2
Detailed VMI & Demand visibility Process
Based on Hall, C. (2000), there are two EDI (Electronic Data Interchange)
transactions at the heart of the process as illustrated in figure 28:
Figure 28 – EDI documents for VMI Implementation
The first is the “Product Activity Record”, frequently referred to as an 852. The
data contained in this document are sales and inventory information. The
inventory data is typically segmented into various groups, such as on hand, on
order, committed, back ordered, and so forth. This transaction is the backbone of
VMI, and is sent by the customer on a prearranged schedule, typically, daily. The
decision to order is based on this data.
The business process fed by this data is relatively simple. The supplier reviews
the information that has been sent in by the customer on the 852 to determine if
an order is needed. This review of the data varies by supplier and the software
being used, but, many things are consistent:
• The first step is to verify if the data is accurate and meaningful. Depending on
the software, much of this verification is automated.
• On a scheduled basis, the software calculates a reorder point for each item
based on the movement data and any overrides contributed by the customer or
supplier. These overrides might include information such as promotions, projects,
seasonality, new items, etc.
• The VMI software compares the quantity available at the customer with the
reorder point for each item at each location (SKU by location). This determines if
an order is needed.
PU
C-R
io -
Cert
ific
ação D
igital N
º 0511118/C
A

90
• The order quantities are then calculated, and typically calculation of order
quantities takes into account such issues as case quantities and transaction
costs. This completes the order build process.
The second VMI transaction informs the customer what product will be delivered
by the supplier. There are two transactions being used for this function. The most
frequently used is the “purchase order acknowledgment”, referred to as the 855.
This document contains the product numbers and quantities ordered by the
supplier on the customer’s behalf. A few customers skip the 855 and rely on the
advance ship notice (ASN), or 856, to alert them to the order and shipment. This
document differs from the 855 in both timing and content. The 856 is sent after
the shipment has been made instead of at the time of the order. The 856 contains
only the part numbers shipped as well as additional information, such as carrier
and waybill information. For the purposes of VMI, either of these documents
works well if properly implemented.
4.3.4.3
Benefits
Based on the working paper from Kellogg Graduate School of Management
(2000), VMI can have a number of benefits, including lowered investment in the
supply chain, due to better forecasting, JIT delivery and less overstocking and
greater inventory turnover. Its primary benefit, however, is improved customer
service due to fewer stock outs and more optimal product mixes. Manufacturer /
vendor also stand to benefit from VMI, as it allows them to schedule production
and transportation more efficiently (including ordering raw materials), to observe
end-user consumption and general market trends more closely, and to develop
closer ties with their customers. In summary, the benefits of VMI Program are
detailed in table 11:
Table 11 – Benefits from VMI Implementation (Kellogg University, 2000)
PU
C-R
io -
Cert
ific
ação D
igital N
º 0511118/C
A

91
The working paper from Kellogg also reports the following benefits out of the VMI
implementation:
• Fred Meyer, the 131-unit chain of supercenters in the Pacific Northwest,
reduced inventories 30% to 40%, while sales rose and service levels
increased to 98%. This was due to a VMI program implemented with two key
food vendors.
• Grand Union, a New Jersey-based grocery retailer with more than 100 stores
and three DCs, improved inventory turns by close to 80% and achieved 99%
service levels. This significantly improved sales by eliminating out-of-stock
conditions and dramatically reduced warehousing costs.
• Oshawa Foods, a $6 billion Canadian food distributor and retailer, had
tremendous success with Pillsbury, Quaker and H.J. Heinz with inventory
turns improving from 3 to 9 times, while achieving customer service levels of
99%.
The author had also implemented a VMI project in the beverage industry with one
key customer from the airline industry to increase customer service level (fill rate)
at the same time that optimizes the inventory levels. Figure 29 illustrates the
relationship between the two companies:
Figure 29 – VMI Project Implemented in the Beverage Industry
The project started in Feb/2008 and 4 months later (June/2008), the project team
was able to measure 55% reduction in inventory level with 100% fill rate in this
period, as illustrated in the figure 30:
PU
C-R
io -
Cert
ific
ação D
igital N
º 0511118/C
A

92
Figure 30 – Daily Demand & Inventory Levels Before and After VMI
Project
4.4
Supply and Operations Management
In this section, it will be performed a literature review for each one of the 5
categories of the Supply & Operations management – Procurement,
Manufacturing, Logistics, Customer Service and Senior Management Support.
This review allowed identify the DDSC characteristics for each category which
was used to develop the 5 level maturity model.
4.4.1
Introduction
Supply and Operations Management refers to the capabilities of the firm to
source, produce, store, sell and delivery its products in the market place. It is a
critical capability both in terms of cost, due to all fixed and variable costs required
to perform the operational activities, and also in terms of customer service, due to
the high pressure of customers towards better and customized services.
Stewart (1997), states that managing supply-chain operations is critical to any
company’s ability to compete effectively, and that success for many companies
PU
C-R
io -
Cert
ific
ação D
igital N
º 0511118/C
A

93
now depends on their ability to balance a stream of product and process changes
with meeting customer demands for delivery and flexibility. Optimally managing
supply-chain operations, has therefore, become critical to companies’ ability to
compete effectively in the global marketplace.
Still based on Stewart (1997), to assist companies in increasing the effectiveness
of their supply chain, and to support the move to process-based management,
two consulting firms – PRTM and Advanced Manufacturing Research (AMR) –
set out to consolidate within a process reference model their experience along
with a group of senior operations, manufacturing and supply chain managers
from many of the leading companies. This group of companies, together with
other leading US and multinational firms, joined together in 1996 to form the
Supply-Chain Council (SCC). The SCC took the reference model and helped
develop, test and finally release it, calling it the Supply Chain Operations
Reference Model (SCOR). SCOR is the first cross-industry framework for
evaluating and improving enterprise-wide supply-chain performance and
management
SCOR is designed to enable companies to communicate, compare and develop
new or improved supply-chain practices from companies both within and outside
of their industry segment. Its key components are:
• Standard descriptions of the process elements that make up complex
management processes.
• Benchmark metrics used to compare process performance to objective,
external points of reference.
• Description of best-in-class management practices.
• Mapping of software products that enable best practices.
SCOR model spans:
• All customer interactions, from order entry through paid invoice.
• All physical material transactions, from the supplier’s supplier to the
customer’s customer, including field service logistics.
• All market interactions, from the understanding of aggregate demand to
the fulfillment of each order.
SCOR model focuses on five basic supply chain processes, as described below:
PU
C-R
io -
Cert
ific
ação D
igital N
º 0511118/C
A

94
• Plan – Demand / Supply Planning and Management
o Balance resources with requirements and establish / communicate
plans for the whole supply chain, including return, and the
execution processes of Source, Make and Deliver.
o Management of business rules, supply chain performance, data
collection, inventory, capital assets, transportation, planning
configuration, regulatory requirements and compliance, and supply
chain risk.
o Align the supply chain unit plan with the financial plan.
• Source – Sourcing Stocked, Make to Order, and Engineer-to-Order
o Schedule deliveries, receive, verify and transfer products, and
authorize supplier payments.
o Identify and select supply sources when not predetermined, as for
engineer-to-order product.
o Manage business rules, assess suppliers’ performance, and
maintain data.
o Manage inventory, capital assets, incoming product, supplier
network, import / export requirements, supplier agreements, and
supply chain source risk.
• Make – Make to Stock, Make to Order, and Engineer to Order
Production Execution
o Schedule production activities, issue product, produce and test,
package, stage product, and release product to deliver.
o Finalize engineering for engineer-to-order product.
o Manage rules, performance, data, work-in-process products
(WIP), equipment and facilities, transportation, production network,
regulatory compliance for production, and supply chain make risk.
• Deliver – Order, Warehouse, Transportation / Distribution
o All order management steps from processing customer inquiries
and quotes to routing shipments and selecting carriers.
o Warehouse management from receiving and picking product to
load and ship product.
o Receive and verify product at customer site, and install, if
necessary.
o Invoicing customer.
PU
C-R
io -
Cert
ific
ação D
igital N
º 0511118/C
A

95
o Manage deliver business rules, performance, information, finished
product inventories, capital assets, transportation, product
lifecycle, import/export requirements, and supply chain deliver risk.
• Return – Return of Raw Materials and Receipt of Returns of Finished
Goods
o All return defective product steps from source – identify product
condition, disposition product, request product return
authorization, schedule product shipment, and return defective
product – and deliver - authorized product return, schedule return
receipt, receive product, and transfer defective product.
o All return excess product steps from source – identify product
condition, disposition product, request product return
authorization, schedule product shipment, and return excess
product – and deliver – authorize product return, schedule return
receipt, receive product, and transfer excess product.
o Manage return business rules, performance, data collection, return
inventory, capital assets, transportation, network configuration,
regulatory requirements and compliance, and supply chain return
risk.
For the sake of supply and operations management in this thesis, the supply
chain processes proposed by SCOR will be covered, but using a different
terminology, as detailed below, in order to be closer to the organization structure
names found in most industries.
4.4.2
Procurement
Lockamy and McCormack (2004) performed an exploratory study to investigate
the link of SCOR planning processes to supply chain performance. In this study,
they showed that supplier transactional collaboration activities have a significant
impact on supply chain performance within the SOURCE decision area. These
activities include the sharing of planning and scheduling information with
suppliers. The source planning process, which includes the documentation of
procurement processes, the establishment of information technology that
supports these processes, and the management of supplier inter-relationships,
also has a significant impact on supply chain performance in this decision area.
PU
C-R
io -
Cert
ific
ação D
igital N
º 0511118/C
A
96
Supplier inter-relationships included in the source planning process include the
management of product and delivery variability, along with metrics for monitoring
such variability. Additionally, the designation of a source planning process owner
is required to ensure its effectiveness. The establishment of a procurement
process planning team was found to have an impact on supply chain
performance within the SOURCE decision area. This team should meet on a
regular basis, and work closely with other functional areas, such as
manufacturing and sales. Supplier operational collaboration also has a significant
impact on supply chain performance. This involves the development of a joint
operational plan that is supportive of strategic sourcing activities, and outlines
how routine transactional activities are to be conducted by the participants.
Supplier strategic collaboration activities also impact supply chain performance in
the Source decision area. These activities include electronic ordering and
supplier-managed inventory. In addition, the presence of on-site employees of
key suppliers facilitates strategic supplier collaboration activities that enhance
overall supply chain performance.
Ayers (2006) provides a 7 steps methodology to allow companies embark on the
journey from purchasing to strategic procurement. The steps are:
• Step 1: Determine your spending. In this step, companies should
quantify how much was spent, who spent the money, where and how was
it spent and what specifically was it spent for.
• Step 2: Prioritize the spend categories. Prioritizing means looking at
the size of the savings opportunities compared to the degree of difficulty
in actually achieving the savings. The degree of difficulty is determined by
such issues as organizational turf, complexity of the product or service,
and the complexity of the actual sourcing process (e.g. vendor selection,
vendor certification, Request for Proposal - RFP, negotiations, etc.). He
suggested to always starting with the “low-hanging fruit”, which are the
opportunities with high savings and that can be achieved with little
difficulty.
• Step 3: Form category teams. These teams are small groups with the
charter to examine the sourcing options for the category and to make
recommendations to senior management. Ideally, especially in a
decentralized organization, teams should have representatives from each
of the key business units to obtain diversified inputs and to build
consensus.
PU
C-R
io -
Cert
ific
ação D
igital N
º 0511118/C
A

97
• Step 4: Develop a sourcing strategy for your categories. Each
category team needs to develop a basic strategy to source its category.
These can range from joint ventures with suppliers when the product or
service being sourced is highly technical, critical to your business, and
only a few suppliers are capable of meeting the specifications to very
competitive bidding situations, when the product is simple and widely
available.
• Step 5: Perform the Request for Proposal (RFP) process and make
the final selection. Identify a list of potential suppliers, starting with your
current suppliers. The category team should reach consensus on the
basic ground rules for awarding the business (e.g. national contract for all
corporation’s office supply) and the criteria (e.g. prices, rebates, breadth
of offering, delivery frequencies, etc.) to use to select the wining proposal.
It is extremely important to reach consensus on these issues before
sending out the RFP (Request for Proposal).
• Step 6: Manage the supplier relationship aggressively. Supplier
management is the area of strategic sourcing with the greatest
opportunity for both success and failure. Too many companies just sign
the contract and forget about the relationship until contract renewal time.
To make the relationship a real success, ensure that the benefits you and
the category team fought so hard to achieve are sustained. Both parties
should be actively involved in monitoring results, reviewing pre-
established performance metrics, partnering on creative ways to mutually
lower costs, and ironing out any contract or performance disputes.
• Step 7: Provide feedback to both suppliers and senior management.
Category team should provide regular feedback to suppliers on both
successes and failures. It is important to make them feel a part of
company’s overall strategic sourcing process and also keep senior
management informed about what the team has accomplished. Present
an annual plan to senior management that recaps savings achieved
during the year and planned activities for the upcoming year.
Harrison (2003) states that there are two extremely different approaches for
managing the relationship with suppliers: On line procurement (also called
“eProcurement”) and Strategic Alliances. He claims that the decision on which
approach to take should be based on the characteristics of the purchased
component and of the marketplace. A summary of the risks and benefits of each
of these two approaches is provided in tables 12 and 13:
PU
C-R
io -
Cert
ific
ação D
igital N
º 0511118/C
A

98
• Risks and Benefits of Strategic Alliances:
Table 12 – Risks and Benefits of Strategic Alliances (Harrison, 2003)
Benefits to Buyer Risks to Buyer Benefits to
Supplier
Risks to Supplier
Decrease total cost
of ownership
Increased
transactions cost
per supplier
Locks in the
business
Limited
opportunities for
new business,
particularly with
alliance partner’s
competitors
Increased quality Supplier becomes
monopolistic, less
responsive
Ability to increase
skill
Capacity locked up
by partner
Faster response Ability to make
long-term
investments
Enhanced new
product
development with
supplier
involvement
Higher margins
Highly skilled
supplier base
Fewer suppliers to
manage
PU
C-R
io -
Cert
ific
ação D
igital N
º 0511118/C
A

99
• Risks and Benefits of On line Procurement (eProcurement):
Table 13 – Risks and Benefits of On Line Procurement (Harrison, 2003)
Benefits to Buyer Risks to Buyer Benefits to
Supplier
Risks to Supplier
Decreased unit
cost
Decreased quality Access to new
business
Lower margins
Decreased
transactions and
processing cost
Loose specifications Use of excess
capacity
Decreased ability to
invest in
improvements
Faster response Fewer suppliers
over the long term
Knowledge of
winning bid
Startup costs for
new software
Alienate suppliers Buyer uses
information to
generate off-line
bids
4.4.3
Manufacturing
Ayers (2006) provides a roadmap to implement demand driven supply chain
concepts in the manufacturing area, which is illustrated in figure 31:
PU
C-R
io -
Cert
ific
ação D
igital N
º 0511118/C
A

100
Figure 31 – 3 Phase Roadmap for Implementing DDSC in Manufacturing (Ayers,
2006)
Evolution to a demand-driven supply chain will likely proceed in the order these
items are listed. Shortening the lead-time is fundamental to changing batch
model economics. Basing decisions on demand comes after adopting the
economics of the flow model. Along the path there is feedback to earlier steps.
4.4.3.1
Cells
Cells are a proven way to save time and reduce cost in both manufacturing and
service companies. The design of any production process will fall into one of two
generic categories:
• Functional design - It is the traditional approach and it has its foundation
in traditional accounting mentality and the associated batch approach to
production. In a functional setup, the work must progress sequentially
through each unit. Because the batch model stresses worker and
machine utilization while ignoring lead-time, the functional design is a
natural response despite not so obvious penalties in terms of lead-time.
• Cell design – Cell design is a component of the Toyota Production
System, or lean manufacturing. In the cellular shop floor, machines of
different types are located together and the focus shifts to the product, not
the means of production. In a cellular paperwork process, small groups do
all operations.
PU
C-R
io -
Cert
ific
ação D
igital N
º 0511118/C
A

101
Cells reduce lead-times and enable products to be produced in small-lot or
single-lot quantities. There are three outcomes from implementing cells in
manufacturing environment: Improvement in flow, density and velocity, as
described below:
• Flow should include simplicity of layout and minimal movement distance
of components around the factory.
• Density is the measure of workspace to total space, that is, how much of
the factory floor is occupied by value-adding activities as a proportion of
total space. Density should be as high as possible.
• Velocity refers to the percent of time spent in value-added operations.
Low velocities are characteristic of high waits for processing – usually in a
batch process.
Cellular manufacturing has other benefits like:
• Improved quality – In a functional batch manufacturing setup, a whole
batch of bad product may be produced before the error is detected. In the
high-velocity cellular environment, the next operation will receive the
product much more quickly, and defects will be caught before more bad
products are produced. Feedback to the operator producing the bad parts
is also fast, facilitating a learning environment.
• Focused factory – Cells also facilitate implementation of the “focused
factory”, a concept developed by Wickham Skinner, and which
characterizes a factory that does not attempt to do much different things.
The analogy is the athlete. To excel in a sport, one must concentrate on
that sport. The multisport professional athlete is relatively rare. Within the
focused factory, each cell can be tailored to customer needs, rather than
operating in a “one-size-fits-all” environment.
4.4.3.2
Agile Enterprise
The agile enterprise line of thinking relates to the need to respond quickly in
dynamic markets. In these markets, opportunities come and go rapidly, and to
respond, managers must design production systems capable of rapid deployment
to meet these opportunities.
The agile enterprise will be able to do two things well:
PU
C-R
io -
Cert
ific
ação D
igital N
º 0511118/C
A

102
• Rapidly reposition internal operations for new opportunities, which mean
structuring internal operations using cells and focused factories.
• Be good at partnerships, which mean be ready to form or participate in
multi-company supply chains.
Agility requires rapid responses. Cell capabilities could be deployed more rapidly
than entire factories, and so, the focus in cell design may be more on building in
the ability to shift market positions rather than defend any particular market
position. Flexibility, rather than cost, should be the primary goal.
The agile enterprise extends the philosophy of cellular manufacturing up into the
organization. It would encompass infrastructure, including control systems, union
contracts, rewards and incentives, information systems, and technology
competencies. This means, in all probability, that the focused factory or cell can
even be dissociated from the enterprise. The agile enterprise will be fast, not only
in putting out product once it is up and running, but also in setting up supply
chains in response to market opportunities.
4.4.3.3
Toyota Production System (Lean Manufacturing)
The Toyota Production system (TPS) is a philosophy of manufacturing that
Toyota credits with its success in producing high quality automobiles. The
concepts behind TPS underpin the “lean manufacturing model”.
We can define Lean as “A systematic approach to identifying and eliminating
waste through continuous improvement, flowing the product at the pull of the
customer in pursuit of perfection”.
The wastes noted above are commonly referred to as “non-valued-added”
activities, and are known to Lean practitioners as the “Eight Wastes”. Taiichi
Ohno (co-developer of the Toyota Production System) suggests that these
account for up to 95% of all costs in non-Lean manufacturing environments.
These wastes are:
• Overproduction – Producing more than the customer demands. The
corresponding Lean principle is to manufacture based upon a pull system,
or producing products just as customers order them. Anything produced
beyond this (buffer or safety stocks, work-in-process inventories, etc.) ties
up valuable labor and material resources that might otherwise be used to
respond to customer demand.
PU
C-R
io -
Cert
ific
ação D
igital N
º 0511118/C
A

103
• Waiting – This includes waiting for material, information, equipment, tools,
etc. Lean demands that all resources are provided on a just-in-time (JIT)
basis – not too soon, not too late.
• Excess of Transportation – Material should be delivered to its point of use.
Instead of raw materials being shipped from the vendor to a receiving
location, processed, moved into a warehouse, and then transported to the
assembly line, Lean demands that the material should be shipped directly
from the vendor to the location in the assembly line where it will be used.
The Lean term for this technique is called “point-of-use-storage” (POUS).
• Non-Value-Added-Processing – Some of the more common examples of
this are reworking (the product or service should have been done
correctly the first time), deburring (parts should have been produced
without burrs, with properly designed and maintained tooling), and
inspecting (parts should have been produced using statistical process
control techniques to eliminate or minimize the amount of inspection
required). A technique called Value Stream Mapping is frequently used to
help identify non-valued-added steps in the process (for both
manufacturers and service organizations).
• Excess of Inventory – Related to Overproduction, inventory beyond that
needed to meet customer demands negatively impacts cash flow and
uses valuable floor space. One of the most important benefits for
implementing Lean Principles in manufacturing organizations is the
elimination or postponement of plans for expansion of warehouse space.
• Defects – Production defects and service errors waste resources in four
ways. First, materials are consumed. Second, the labor used to produce
the part (or provide the service) the first time cannot be recovered. Third,
labor is required to rework the product (or redo the service). Fourth, labor
is required to address any forthcoming customer complaints.
• Excess of Motion – Unnecessary motion is caused by poor workflow, poor
layout, housekeeping, and inconsistent or undocumented work methods.
Value Stream mapping (see above) is also used to identify this type of
waste.
• Underutilized People – This includes underutilization of mental, creative,
and physical skills and abilities, where non-Lean environments only
recognize underutilization of physical attributes. Some of the more
common causes for this waste include – poor workflow, organizational
PU
C-R
io -
Cert
ific
ação D
igital N
º 0511118/C
A

104
culture, inadequate hiring practices, poor or non-existent training, and
high employee turnover
In order to reduce or eliminate the above wastes, Lean practitioners utilize many
tools or Lean Building Blocks. Successful practitioners recognize that, although
most of these may be implemented as stand-alone programs, few have
significant impact when used alone. Additionally, the sequence of implementation
affects the overall impact, and implementing some out of order may actually
produce negative results (for example, you should address quick changeover and
quality before reducing batch sizes). The more common building blocks are listed
below:
• Pull System – The technique for producing parts at customer demand.
Service organizations operate this way by their very nature.
Manufacturers, on the other hand, have historically operated by a Push
System, building products to stock (per sales forecast), without firm
customer orders.
• Kanban – A method for maintaining an orderly flow of material. Kanban
cards are used to indicate material order points, how much material is
needed, from where the material is ordered, and to where it should be
delivered.
• Work Cells – The technique of arranging operations and/or people in a
cell (U-shaped, etc.) rather than in a traditional straight assembly line.
Among other things, the cellular concept allows for better utilization of
people and improves communication.
• Total Productive Maintenance – TPM capitalizes on proactive and
progressive maintenance methodologies and calls upon the knowledge
and cooperation of operators, equipment vendors, engineering, and
support personnel to optimize machine performance. Results of this
optimized performance include elimination of breakdowns, reduction of
unscheduled and scheduled downtime, improved utilization, higher
throughput, and better product quality. Bottom-line results include lower
operating costs, longer equipment life, and lower overall maintenance
costs.
• Total Quality Management – It is a management system used to
continuously improve all areas of a company's operation. TQM is
applicable to every operation in the company and recognizes the strength
of employee involvement.
PU
C-R
io -
Cert
ific
ação D
igital N
º 0511118/C
A

105
• Quick Changeover (Setup Reduction and Single Minute Exchange of
Dies - SMED) – The technique of reducing the amount of time to change
a process from running one specific type of product to another. The
purpose for reducing changeover time is not only for increasing
production capacity, but also to allow more frequent changeovers in order
to increase production flexibility. Quicker changeovers allow for smaller
batch sizes.
• Batch Size Reduction – Historically, manufacturing companies have
operated with large batch sizes in order to maximize equipment utilization,
assuming that changeover times were “fixed” and could not be reduced.
Because Lean calls for the production of parts to customer demand, the
ideal batch size is ONE. However, a batch size of one is not always
practical, so the goal is to practice continuous improvement to reduce the
batch size as low as possible. Reducing batch sizes reduces the amount
of work-in-process (WIP) inventory. Not only does this reduce inventory-
carrying costs, but also production lead-time or cycle time is
approximately directly proportional to the amount of WIP. Therefore,
smaller batch sizes shorten the overall production cycle, enabling
companies to deliver more quickly and to invoice sooner (for improved
cash flow). Shorter production cycles increases inventory turns and allows
the company to operate profitably at lower margins, which enables price
reductions, which increases sales and market share.
• 5S or Workplace Organization – This tool is a systematic method for
organizing and standardizing the workplace. It’s one of the simplest Lean
tools to implement, provides immediate return on investment, crosses all
industry boundaries, and is applicable to every function with an
organization. Because of these attributes, it’s usually the first step
recommended for a company start its journey to Lean manufacturing.
As the name indicates, 5S consists of 5 phases, as described below:
• Sorting – Eliminate all unnecessary tools, parts, instructions.
Team should go through all tools, materials, etc., in the plant and
work area and keep only essential items. Everything else should
be stored or discarded.
• Straightening – There should be a place for everything, and
everything should be in its place. The place for each item should
be clearly labeled or demarcated. Items should be arranged in a
PU
C-R
io -
Cert
ific
ação D
igital N
º 0511118/C
A

106
manner that promotes efficient work flow. Workers should not
have to repetitively bend to access materials. Each tool, part,
supply, piece of equipment, etc. should be kept close to where it
will be used (i.e. straighten the flow path).
• Systematic cleaning – Workplace should be kept tidy and
organized. At the end of each shift, workers should clean the
working area and be sure everything is restored to its place. This
makes it easy to know what goes where and ensures that
everything is where it belongs. A key point is that maintaining
cleanliness should be part of the daily work - not an occasional
activity initiated when things get too messy.
• Standardizing – Work practices should be consistent and
standardized. Everyone should know exactly what his or her
responsibilities are for adhering to the first 3 S's.
• Sustaining – Maintain and review standards. Once the previous 4
S's have been established, they become the new way to operate.
Employees should maintain focus on this new way and do not
allow a gradual decline back to the old ways. While thinking
about the new way, they should also be thinking about better
ways to operate. When an issue arises, such as a suggested
improvement, a new way of working, a new tool or a new output
requirement, review the first 4 S's and make changes as
appropriate.
• Visual Controls – These are simple signals that provide an immediate
and readily apparent understanding of a condition or situation. Visual
controls enable someone to walk into the workplace and know within a
short period of time what’s happening with regards to production
schedule, backlog, workflow, inventory levels, resource utilization, and
quality. These controls should be efficient, self-regulating, and worker
managed, and include visual boards, Kanban cards, lights, color-coded
tools, lines delineating work areas and product flow, etc.
PU
C-R
io -
Cert
ific
ação D
igital N
º 0511118/C
A

107
4.4.3.4
Postponement
Postponement refers to efforts to customize products for delivery as late in the
production process as possible to fulfill the demand cost effectively. It supports
the just in time principle from the Toyota Production System.
Designing for postponements makes the concept easier to implement. These
designs create needed commonality among end products. Assembling common
parts or modules creates each unique product configuration. However,
implementation requires multidepartment collaboration, including operations,
marketing, procurement, and engineering.
Without commonality, plants may be efficient as far as individual products are
concerned. However, total cost, including inventory and shipping, will be high due
to proliferation of specialized parts and finished goods inventory.
Nahmias (2005) provides examples of postponement concept implementation in
Benetton Group, who operates in the fashion clothes industry and also in
Hewlett-Packard (HP), who operates in the printer industry.
4.4.4
Logistics
4.4.4.1
Introduction
Bowersox and Lahowchich (2008) state that Logistics is a critical area in the
responsive supply chain business model. They argue that the logistical structure
include the traditional functional areas of order management, transportation,
inventory, warehousing and material handling. These five dimensions of logistical
performance are integrated in an operating system and a facility network design.
Included within these primary areas are important strategic and tactical matters,
such as protective packaging, building and material handling design, facility
location and network design, as well as reverse movement related to product
warranty, recall, and disposal (commonly called reverse logistics).
PU
C-R
io -
Cert
ific
ação D
igital N
º 0511118/C
A

108
4.4.4.2
Warehouse
Based on Baker and Canessa (2009), warehouses are a key aspect of modern
supply chains and play a vital role in the success, or failure, of businesses today.
Two types of warehouse can be distinguished: distribution warehouses and
production warehouses.
• The function of a distribution warehouse is to store products and to fulfill
external customer orders typically composed of a large number of order
lines (where each order line specifies a quantity of one particular product).
The number of different products in a distribution warehouse may be
large, while the quantities per order line may be small, which often results
in a complex and relatively costly order picking process. Therefore,
distribution warehouse are often optimized for cost-efficient order picking.
The prominent design criterion is the maximum throughput to be reached
at minimum investment and operational costs.
• The function of a production warehouse is to store raw materials, work-in-
process and finished products, associated with a manufacturing and / or
assembly process. Raw materials and finished products may be stored for
long periods. This occurs, for example, when the procurement batch of
incoming parts is much larger than the production batch, or when the
production batch exceeds the customer order quantity of finished
products. Storage of goods for long periods must be cost-efficient, and is
usually done in large quantities in an inexpensive storage system, such as
pallet rack. The prominent design objectives are low investment costs and
operational costs.
Huertas et al. (2007) state that facility layout plays an important role in the
business success of the company, and the most appropriate warehouse layout
depends on its particular operational conditions, and characteristics such as
modularity, adaptability, compactness, distribution of movements, accessibility
and flexibility. Layout design is a problem-dependant, in other words, there is no
best design, methodology or policy for all problems under consideration.
Selecting the best layout for a given case is not trivial, because of the diversity of
factors influencing a warehouse operation, such as docks location, aisles access,
racks types, racks access.
PU
C-R
io -
Cert
ific
ação D
igital N
º 0511118/C
A

109
Baker and Canessa (2009) also provide an overall framework with the key steps
and main tools used, as well as the literature references on warehouse design,
as illustrated in table 14:
Table 14 – Baker and Canessa (2009) Framework, Tools and Key References
Gu et al. (2010) state that warehouse design involves five major decisions:
• Determine the overall structure: The overall structure (or conceptual
design) determines the functional departments, such as how many
storage departments, technology employed and how orders will be
assembled. At this stage of the design, the issues are to meet storage
and throughput requirements, and to minimize costs.
• Department layout: It is the detailed configuration within a warehouse
department, for example, aisle configuration in the retrieval area, pallet
block-stacking pattern in the reserve storage area, and configuration of an
automated storage/retrieval systems (AS/RS)
• Operation strategy: Refers to those decisions about operations that have
global effects on other design decisions, and therefore, need to be
PU
C-R
io -
Cert
ific
ação D
igital N
º 0511118/C
A

110
considered in the design phase. Examples are the decision between
randomized and dedicated storage, or the decision to use zone picking.
• Equipment selection: Determine an appropriate automation level for the
warehouse, and identify equipment types for storage, transportation, order
picking and sorting.
• Sizing and dimensioning:
o Warehouse sizing determines the storage capacity of a
warehouse. There are two scenarios in modeling: 1) inventory
levels are determined externally so the warehouse has no direct
control over when incoming shipments will arrive and their
quantities, and 2) warehouse can directly control the inventory
policy.
o Warehouse dimensioning: It translates capacity into floor space in
order to assess construction and operating costs.
Rouwenhorst et al. (2000) provide three different angles from which a warehouse
may be viewed: Processes, resources and organization. Products arriving at a
warehouse subsequently are taken through a number of steps called processes.
Resources refer to all means, equipment and personnel needed to operate a
warehouse. Finally, organization includes all planning and control procedures
used to run the system.
Warehouse Processes:
The flow of items through the warehouse can be divided in several distinct
phases or processes:
• The receiving process is the first process encountered by an arriving item.
Products arrive by truck or internal transport (in case of a production
warehouse). At this step, the products may be checked or transformed
(e.g. repacked into different storage modules) and wait for transportation
to the next process.
• In the storage process, items are place in storage locations. The storage
area may consist of two parts: The reserve area, where products are
stored in the most economical way (bulk storage), and the forward area,
where products are stored for easy retrieval by an order picker. Products
in the forward area are often stored in smaller amounts in easily to access
storage modules.
• Order picking refers to the retrieval of items from their storage locations
and can be performed manually or (partly) automated. In succession,
PU
C-R
io -
Cert
ific
ação D
igital N
º 0511118/C
A

111
these items may be transported to the sorting and/or consolidation
process.
• At the shipping area, orders are checked, packed and eventually loaded
in trucks, trains or any other carrier.
Warehouse Resources:
A number of resources can be distinguished as listed below:
• Storage unit, which products may be stored. Examples of storage units
are pallets, carton boxes and plastic boxes.
• Storage system, which consist of multiple subsystems that store different
types of products. Storage systems are very diverse, such as are driven
in, case flow racks, shelves, push backs, just to enumerate some
examples.
• The retrieval of items from the storage system can be performed manually
or by means of pick equipment like forklift (e.g. single, double, triple and
quad forklifts) or pallet jack.
• A computer system may be present to enable computer control of the
processes by a warehouse management system.
• The material handling equipment for preparation of the retrieved items for
the expedition includes sorter systems, palletizer and truck loaders.
• Personnel constitutes and important resource, since warehouse
performance largely depends on their availability and commitment.
Chakravorty (2008) shows that the implementation of material handling systems
involves, both human and technical factors, that interact over time, and go
through three overlapping transitional stages. In the first stage, both human and
technical problems exist; however, human problems dominate, and require
conflict management skills to resolve. In the second stage, human problems
improve, but technical problems persist, requiring formal problem-solving
methods to resolve. Finally, in the third stage, both human and technical
problems improve.
Warehouse organization:
Some processes require specific organizational policies:
• At the receiving process, an assignment policy determines the allocation
of trucks to docks.
• At the storage process, items are transported to the storage system and
are allocated to storage locations. Several storage policies exist. A
PU
C-R
io -
Cert
ific
ação D
igital N
º 0511118/C
A

112
dedicated storage policy prescribes a particular location for each product
to be stored, whereas a random storage policy leaves the decision to the
operator. In between, a class based storage system (e.g. ABC Zoning)
allocates zones to specific product groups, often based upon their
turnover rate. Other storage policies include correlated storage or family
grouping, aimed at storing products at nearby positions, if they are often
required simultaneously. If the storage system has a separate reserve
area, a storage policy for the reserve area is also needed.
• At the order picking process, orders are assigned to one or more order
pickers. Various control problems deserve attention. First, the total pick
area may be divided into picking zones, to be served by different order
pickers, through a zoning policy. Two alternative policies exist: Parallel or
Sequential zoning. Second, orders are picked one by one (single order
picking) or in batches (batch picking). If a batch picking policy is selected,
this directly implies that the picked orders must be sorted. Then, two
sorting policies exist: Pick and sort (sequentially) and sort while pick
(simultaneously). Third, a routing policy may define the sequence of
retrievals and the route to visit the retrieval locations.
• At the shipping process, orders and trucks are allocated to docks by a
dock assignment policy.
• Finally, allocation of tasks to personnel and equipment are addressed by
operator and equipment assignment policies.
Performance Management Execution:
Ellinger et al. (2005) state that the success of many firms is becoming
increasingly linked to the growth, development, and retention of human capital.
Accordingly, managers and leaders are being urged to promote a more people-
oriented approach to management, where communication is paramount and,
every employee’s contribution is viewed as a significant factor in the firm’s
ongoing efforts to satisfy customer price, quality, and service demands. However,
logistics organizations have been particularly guilty of not placing sufficient
emphasis on the growth and development of personnel. This is illustrated by the
difficulties that firms have in retaining truck drivers and warehouse workers who
are often modestly compensated, and must perform relatively mundane and
repetitive tasks.
They presented managerial coaching, which is a leadership style based on the
provision of constructive feedback that is designed to get the most out of people,
PU
C-R
io -
Cert
ific
ação D
igital N
º 0511118/C
A

113
in other words, improve work performance by showing them that they are
respected and valued. Managerial coaching occurs as part of the day-to-day
relationship between employee and supervisor, and is one of the strongest
retention tools in a manager’s arsenal.
Managerial coaching skills include questioning, listening, giving and receiving
feedback, communicating and motivating, rather than the more traditionally
recognized skills and qualities of a successful leader/manager like
competitiveness, being in control, solving problems, and being seen as an expert.
Successful manager / coaches are also proficient delegators who are prepared to
accept short-term failures, if they lead to long–term development.
Numerous prescriptive works outline methodologies for effective managerial
coaching. The following list outlines behavioral practices drawn from interviews
with “best of breed” manager-coaches in business and industry contexts:
• providing observational, reflective and constructive feedback to
subordinates;
• seeking feedback from subordinates about their progress on the job;
• providing resources, information, and materials for subordinates and
removing external factors and obstacles that may be impeding
performance;
• talking things through together to come up with options;
• stepping into subordinates’ shoes to experience their perspectives and
encouraging subordinates to see other perspectives;
• role-playing, personalizing learning situations with examples, and using
analogies and scenarios;
• setting goals, outlining expectations and communicating their importance
to subordinates;
• posing context-specific questions that encourage subordinates to think
through issues themselves;
• mentally holding back and consciously not providing answers, solutions,
or telling subordinates what to do; and not taking over employees’
responsibilities but rather shifting them back to employees and holding
them accountable
Ellinger et al. (2005) argue that managerial coaching has enormous benefits for
firms and for the individuals they employ, as people who feel valued and
respected by their employers tend to be more loyal and hard-working, because
they get more out of their jobs. Without coaching and feedback, effective
PU
C-R
io -
Cert
ific
ação D
igital N
º 0511118/C
A

114
performance is not reinforced, ineffective performance is not identified, and
employees will not know if their performances are meeting the expectations of
their managers or supervisor, or the requirements of the firm’s customers.
Warehouse Metrics:
Huertas et al. (2007) propose a set of metrics to evaluate warehouse
performance as described below:
• Quality: Accuracy in storage, Accuracy in picking and Inventory
• Finance: Operational costs and Total storage costs per unit
• Cycle time: Commodity cycle time and Order cycle time
• Productivity: Labor productivity (employees / moved unit), Resource
consumption (space, equipment, labor), Flow (moved units through the
system in a given period), Throughput volume (moved units per day), and
Productivity ratio (handled units per day / working hours per day)
It is important to mention that all concepts presented are valid for both a company
owned or an outsourced warehouse operation and the decision for outsource or
not, should be aligned with the company’s strategic direction, financial objectives,
and core function analysis. For more information on how to structure an
outsource process, please refer to Greaver (1999) and Power (2008).
4.4.4.3
Distribution
A well run distribution operation is one operation that maximizes delivery asset
(e.g. trucks) utilization at the same time that minimizes labor (e.g. drivers and
delivery helpers) and delivers the expected customer service level (e.g. order or
case fill rate).
In order to achieve the above objectives, companies need to establish the right
fleet size and fleet composition, need to optimize daily vehicle routing to reduce
distance traveled and drivers’ working hours and also implement a performance
management execution process. Each one of these three areas (fleet size,
vehicle routing optimization and performance management) will be reviewed in
detail below:
Fleet Size and Composition:
The fleet size and composition problem was first studied by Kirby (1959), and
then by Wyatt (1961), and both of them, considered a homogenous fleet to be
defined, taken into consideration seasonal demand, and the fact that deliveries
PU
C-R
io -
Cert
ific
ação D
igital N
º 0511118/C
A

115
should be done preferable by an internal fleet, but if the demand exceeds
capacity, spot fleet could be hired to fulfill the demand.
Gould (1969) brought a new view for the fleet size problem, as he considered the
heterogeneous fleet for both fleet type and size.
More recently, Beaujon and Turnquist (1991) presented a research that attempts
to integrate vehicle fleet sizing decisions with optimization of vehicle utilization. A
model is formulated to optimize both sets of decisions simultaneously under
dynamic and uncertain conditions. They showed how the expected value
formulation can be approximated as a nonlinear network programming problem,
and propose a procedure for solving the network approximation.
Jin and Kite-Powell (2000) state that replacement theory deals with the optimal
life of an equipment. In this context, optimal life is defined as the period between
the time the equipment enters service and the time when it should be replaced for
economic reasons. They argue that optimal life and replacement policy are
important topics in the management of capital equipment. Generally, the
operating cost of a piece of capital equipment rises as its condition deteriorates
over time. When the cost reaches a certain level, the long-run cost associated
with investing in a new piece of equipment becomes less than that of keeping the
old equipment. At that point, replacement is called for. Thus, a basic replacement
analysis usually examines both the trend in operating cost and the net cost of
replacement, which is defined as the difference between the cost of the new
equipment and the salvage value of the old one.
List et al. (2003) proposed a formulation and a solution procedure for fleet sizing
under two situations: Uncertainty in future demands, that are to be served by
vehicle fleet, and the productivity of individual vehicles, reflecting uncertainty in
future operating conditions.
Wu et al. (2005) describe a fleet sizing problem in the context of the truck rental
industry. They examine both operational decisions (including demand allocation
and empty truck repositioning) and tactical decisions (including asset
procurement and sales) in a linear programming model to determine the optimal
fleet size and mix. The method uses a time-space network, common to fleet
management problems, but also includes capital cost decisions. A two phase
solution approach is developed to solve large-scale instances of the problem
using Benders decomposition in the first phase, and Lagrangian relaxation in the
second phase.
Zhang and Li (2007) presented an article that analyzes multi-periodic vehicle fleet
size and routing problem, and dynamic vehicle fleet size. The authors
PU
C-R
io -
Cert
ific
ação D
igital N
º 0511118/C
A

116
decompose the model with Dantzig-Wolf decomposition method, and derive an
exact algorithm for the model based on simplex method, dynamic programming
method, and branch and bound method.
Manuela (2008) studied the fleet sizing and composition problem, and compared
the Bin Packing approach with an Integer linear programming model, as
illustrated in table 15. Based on the simulation performed, the integer linear
programming generated lower costs for all instances compared with the Bin
Packing model, except in one day.
Table 15 – Fleet Sizing Model Comparison (Manuela, 2008)
Based on the literature review, there are different approaches available to size
and define the right fleet composition that companies should consider and apply,
as well as they should define their fleet renew policy to ensure the fleet operation
is a key enabler to deliver the customer service, cost effectively.
Vehicle Routing Optimization:
Based on Toth and Vigo (2002), the vehicle routing problem (VRP) consists to
determine a set of routes, each performed by a single vehicle, that starts and
ends at its own depot, and ensure that all the requirements of the customers are
fulfilled, all the operational constraints are satisfied, and the global distribution
cost is minimized. They also presented the main components of the VRP, as
summarized below:
• Road network – It is usually described through a graph, whose arcs
represent the road sections, and whose vertices correspond to the road
junctions, and to the depot and customer locations. The arcs can be
directed or undirected, depending on whether they can be traversed in
only one direction (for instance, because of the presence of one-way
PU
C-R
io -
Cert
ific
ação D
igital N
º 0511118/C
A

117
streets, typical of urban or motorway networks) or in both directions. Each
arc is associated with a cost, which generally represents its length, and a
travel time, which is possibly dependent on the vehicle type or on the
period during which the arc is traversed.
• Customers – Typical characteristics of customers are:
o Vertex of the road graph in which the customer is located
o Amount of goods (demand), possibly of different types, which must
be delivered or collected at the customer
o Periods of the day during which the customer can be served (time
windows)
o Times required to deliver or collect the goods at the customer
location (e.g. unloading or loading times, respectively), possibly
dependent on the vehicle type
o Subset of the available vehicles that can be used to serve the
customer
• Vehicle fleet – Typical characteristics of the vehicles are:
o Capacity of the vehicle, expressed as the maximum weight, or
volume, or number of pallets, the vehicle can load
o Possible subdivision of the vehicle into compartments, each
characterized by its capacity, and by the types of goods that can
be carried
o Material handling equipments for the loading and unloading
operations
o Subset of arcs of the road graph which can be traversed by the
vehicle
o Costs associated with vehicle utilization (e.g. per distance unit, per
time unit, per route, etc.)
• Drivers – Drivers operate the vehicles, and must satisfy several
constraints laid down by union contracts and company regulations, such
as working periods during the day, number and duration of breaks during
service, maximum duration of driving periods, overtime, etc.
Several and often contrasting, objectives can be considered for the vehicle
routing problem, and the typical ones are:
• Minimization of the global transportation cost, dependent on the global
distance traveled (or on the global travel time), and on the fixed costs
associated with the used vehicles (and with the corresponding drivers)
PU
C-R
io -
Cert
ific
ação D
igital N
º 0511118/C
A

118
• Minimization of the number of vehicles (or drivers) required to serve all
customers
• Balancing the routes, for travel time and vehicle load
• Minimization of the penalties associated with partial service of the
customers.
• Minimization of total travel time
• Maximize volume delivered per mile
Figure 32 provides an overview of the basic vehicle routing problems, and then,
each type of problem is briefly described:
Figure 32 – Basic VRP problems and their interconnections (Toth and Vigo,
2002)
Capacitated Vehicle Routing Problem (CVRP):
The CVRP consists of finding a collection of exactly “K” simple circuits or routes
(being “K” a set of identical vehicles available at the depot, each with available
capacity “C”) with minimum cost, defined as the sum of the costs of the arcs
belonging to the routes, such that:
• Each route visits the depot vertex
• Each customer vertex is visited by exactly one route
• The sum of the demands of the vertices (customers) visited by a route
does not exceed the vehicle capacity (C).
The CVRP is known to be NP-hard and generalizes the Traveling Salesman
Problem (TSP), which can be defined as “given a list of cities and their pair wise
PU
C-R
io -
Cert
ific
ação D
igital N
º 0511118/C
A

119
distances, the objective is to find a shortest possible tour that visits each city
exactly once”.
One variant of CVRP is the so-called “Distance-Constrained VRP” (DCVRP),
where for each route, the capacity constraint is replaced by a maximum length (or
time) constraint. In particular, a nonnegative length is associated with each arc,
and the total length of the arcs of each route cannot exceed the maximum route
length.
Vehicle Routing Problem with Backhauls (VRPB):
The VRP with Backhauls is the extension of the CVRP in which the customer set
is partitioned into two subsets. The first subset, “L”, contains “n” Line haul
customers, each requiring a given quantity of product to be delivered. The
second subset, “B”, contains “m” Backhaul customers, where a given quantity of
inbound product must be picked up.
The VRPB consists of finding a collection of exactly “K” simple circuits or routes
with minimum cost, such that:
• Each route visits the depot vertex
• Each customer vertex is visited by exactly one route
• The sum of the demands of the line haul and backhaul customers visited
by a route do not exceed, separately, the vehicle capacity (C)
• In each route, all the line haul customers precede the backhaul
customers, if any.
The case of VRPB in which time windows are present is called “VRP with
Backhauls and Time Windows” (VRPBTW).
Vehicle Routing Problem with Time Windows (VRPTW):
The VRP with Time Windows is the extension of the CVRP in which capacity
constraints are imposed and each customer is associated with a time interval [ai,
bi], called a time window. The time instant in which the vehicles leave the depot,
the travel time for each arc, and an additional service time “si” for each customer
should also be given.
The VRPTW consists of finding a collection of exactly “K” simple circuits or routes
with minimum cost, such that:
• Each route visits the depot vertex
• Each customer vertex is visited by exactly one route
• The sum of the demands of the vertices (customers) visited by a route
does not exceed the vehicle capacity (C)
PU
C-R
io -
Cert
ific
ação D
igital N
º 0511118/C
A
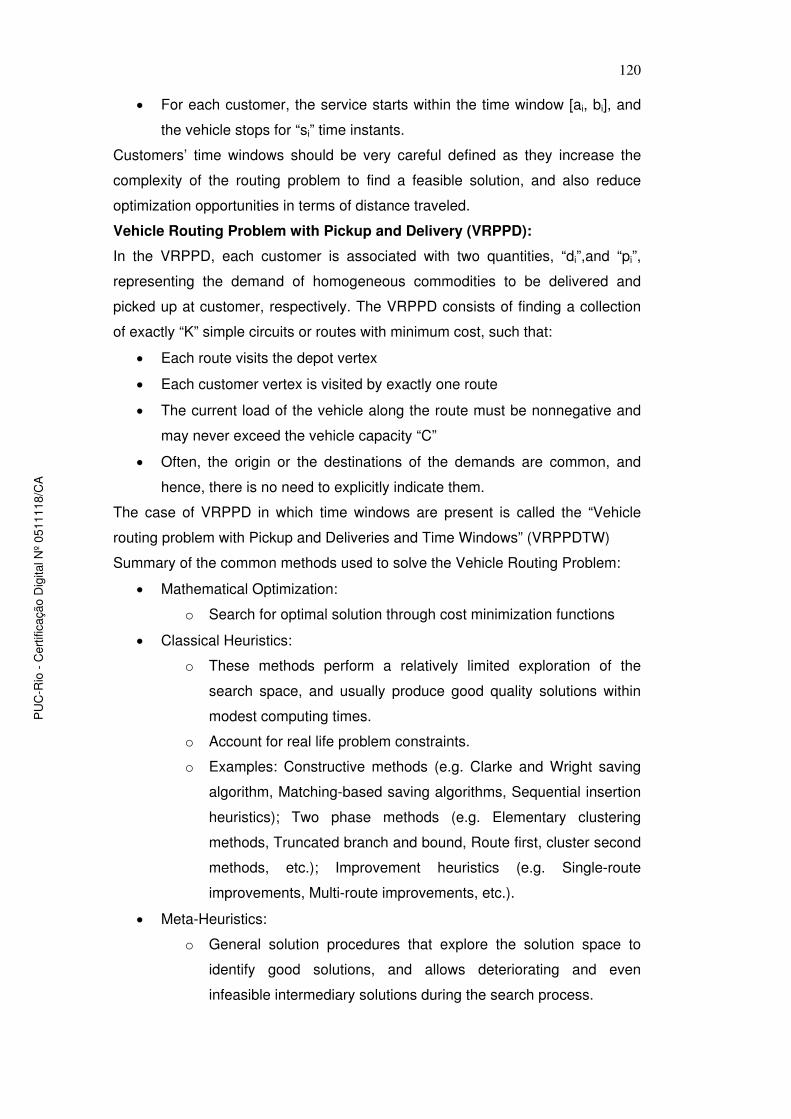
120
• For each customer, the service starts within the time window [ai, bi], and
the vehicle stops for “si” time instants.
Customers’ time windows should be very careful defined as they increase the
complexity of the routing problem to find a feasible solution, and also reduce
optimization opportunities in terms of distance traveled.
Vehicle Routing Problem with Pickup and Delivery (VRPPD):
In the VRPPD, each customer is associated with two quantities, “di”,and “pi”,
representing the demand of homogeneous commodities to be delivered and
picked up at customer, respectively. The VRPPD consists of finding a collection
of exactly “K” simple circuits or routes with minimum cost, such that:
• Each route visits the depot vertex
• Each customer vertex is visited by exactly one route
• The current load of the vehicle along the route must be nonnegative and
may never exceed the vehicle capacity “C”
• Often, the origin or the destinations of the demands are common, and
hence, there is no need to explicitly indicate them.
The case of VRPPD in which time windows are present is called the “Vehicle
routing problem with Pickup and Deliveries and Time Windows” (VRPPDTW)
Summary of the common methods used to solve the Vehicle Routing Problem:
• Mathematical Optimization:
o Search for optimal solution through cost minimization functions
• Classical Heuristics:
o These methods perform a relatively limited exploration of the
search space, and usually produce good quality solutions within
modest computing times.
o Account for real life problem constraints.
o Examples: Constructive methods (e.g. Clarke and Wright saving
algorithm, Matching-based saving algorithms, Sequential insertion
heuristics); Two phase methods (e.g. Elementary clustering
methods, Truncated branch and bound, Route first, cluster second
methods, etc.); Improvement heuristics (e.g. Single-route
improvements, Multi-route improvements, etc.).
• Meta-Heuristics:
o General solution procedures that explore the solution space to
identify good solutions, and allows deteriorating and even
infeasible intermediary solutions during the search process.
PU
C-R
io -
Cert
ific
ação D
igital N
º 0511118/C
A

121
o More time consuming.
o Examples: Simulated annealing, Tabu search, Ant algorithms,
Neural networks etc.
It is not the goal of this thesis to develop a detail review of the solution methods
available for the vehicle routing problem. For more information about each one of
the above methods, please refer to Toth and Vigo (2002).
Ballou (1999) provides several principles for good routing and scheduling as
detailed below:
• Load trucks with stop volumes that are in the closest proximity to
each other:
Truck routes should be formed around clusters of stops that are nearest
each other, in order to minimize the interstop travel between them, which
will also minimize the total travel time on the route. Figure 33 provides two
examples of cluster routing.
Figure 33 – Example of weak and good cluster routing (Ballou, 1999)
• Narrow customer time window restrictions should be avoided:
Time window restrictions usually force route sequencing away from ideal
pattern. Avoid asking your customers on what time they want to receive
our products.
• Stops on different days should be arranged to produce tight
clusters:
When stops are to be served during different days of the week, the stops
should be segmented into separate routing and scheduling problems for
each day of the week, as illustrated in figure 34.
PU
C-R
io -
Cert
ific
ação D
igital N
º 0511118/C
A

122
Figure 34 – Example of clustering routes in different days of the week (Ballou,
1999)
• Pickups should be mixed into delivery routes rather than assigned to
the end of routes:
Pickups should be made, as much as possible, during the course of the
deliveries to minimize the amount of path crossing that can occur when
such stops are served after all deliveries are made. The extent to which
this can be done will depend on the configuration of the vehicle, the size
of the pickup volumes, and the degree to which they may block access to
the delivery volumes inside the vehicle.
• The most efficient routes are built using the largest vehicles
available:
Ideally, using a vehicle large enough to handle all stops in one route will
minimize total distance, or time, traveled to serve the stops. Therefore, the
largest vehicles among the multiple sizes in a fleet should be allocated
first, providing that good utilization for them can be realized.
Daganzo (2010) also confirms that in any practical situation, large
vehicles should be used first in order to minimize the transportation costs.
He suggested using vehicle capacity as large as the highway network
would allow.
• The sequence of stops on a truck route should form a teardrop
pattern:
Stops should be sequenced so that no paths of the route cross, and the
route appears to have a teardrop shape.
PU
C-R
io -
Cert
ific
ação D
igital N
º 0511118/C
A

123
Track and Trace Systems:
Giaglis et al. (2004) state that real-time vehicle management is important in
supporting supply chain execution systems, and also in minimizing related
logistics risks. He argues that it has been demonstrated that a good, near-
optimal, distribution plan is necessary but not sufficient for high performance
distribution. This needs to be complemented by the ability to make and
implement sophisticated decisions in real-time, in order to respond effectively to
unforeseen events. The emergence of technologies and information systems
allowing for seamless mobile and wireless connectivity between delivery vehicles
and distribution facilities is paving the way for innovative approaches in
addressing this requirement.
Cheung et al. (2008) developed a mathematical model for dynamic fleet
management that takes into consideration dynamic data, such as vehicle
locations, travel time, and incoming customer orders. The model is able to
efficient re-optimize the route plan as dynamic information arrives, and it includes
a genetic algorithm procedure for solving the static vehicle routing problem, and a
quick heuristic procedure for dynamic updates of the vehicle routes as new data
arrive.
A track and trace system can be defined as a logistics IT system that allows
companies to track delivery trucks during the route in real time, and manage the
operation in order to solve problems as they happen during the course of the
delivery operation. These systems work integrated with routing optimization
solutions, like UPS Roadnet or Descartes Roadshow, and use the route plan as
the key input that drivers need to follow to reduce miles driven and missed time
windows.
Example of functionalities for a track and trace solution:
• Track and manage individual performance by driver and by day
• Ability to provide closed loop system, comparing actual to schedule
(hours, km) in order to improve routing planning integrity
• Ability to provide Estimated Time of Arrival (ETA) and send Advanced
Shipping Notice (ASN) to customers
• Track service failures by reason code, and provide route and customer
level detail, thus delivering "perfect order" report card capability
• Ability to provide delivery information to all different functional areas inside
the organization (e.g. tell sell, customer service department, etc.) using
web-based solution
PU
C-R
io -
Cert
ific
ação D
igital N
º 0511118/C
A

124
• Allow drivers to receive planned information, and view route map and stop
location on mobile device
• Ability to see planned and actual route in the same map, including
playback past day routes
• Allows driver to inform in real time arrivals and departures from customers
• Allows driver to inform quantities delivered and payment information
• Allows driver to inform exceptions, sending messages (pre-defined or free
messages)
• Helps fine tune customer geo-coding information (e.g. latitude and
longitude)
• Have a control panel to monitor the operation in real time during the day
• Ability to create dashboard with customized set of KPIs
• Ability to track trucks during the route off line, and on line in real time,
identifying exceptions in distance traveled, time stopped in a customer,
arrive earlier or late, etc. All of the exceptions should be parameters
defined by users.
In figure 35, the key components of a delivery track and trace system are
presented. The first component is the mobile equipment (e.g. cell phone or hand
held) which is used by drivers to enter delivery information as they perform the
operation (e.g. arrival and departure from customers, product returns, etc.). The
second component is GPS equipment that is responsible to send truck position in
a pre-defined frequency (e.g. every 1 minute). Both GPS information and drivers
input is sent to a control operational center in the warehouse facility, where route
planners can visualize exceptions to the planned route in a dashboard, as
illustrated in figure 36, and work with the drivers and delivery supervisors to solve
the problems or escalate them to the right person inside the organization.
PU
C-R
io -
Cert
ific
ação D
igital N
º 0511118/C
A

125
Figure 35 – Example of Architecture for a Track and Trace Solution
Figure 36 – Example of UPS Mobile Cast Track and Trace Dashboard
Based on the author’s experience on implementing track and trace systems in
several different delivery operations in the beverage industry, the typical benefits
of these systems are:
• Effectively manage delivery operation during the day, managing
exceptions based on standard operating procedures.
PU
C-R
io -
Cert
ific
ação D
igital N
º 0511118/C
A

126
• Improve customer service through increased order fill rate, order visibility,
on time delivery.
• Improve routing planning through a closed loop system that will keep an
updated set of parameters (service time, street speed, etc.).
• Improve logistics execution and reduce distribution costs (usually 10% to
15% reduction in km driven).
• Manage drivers’ working time to reduce lawsuit possibilities due to
overtime.
Performance Management Execution:
In the same way that was stated in the warehouse operation, performance
management execution is also very important to the distribution operation as
labor cost is almost 50% of the operational cost. To that end, it is proposed to
apply the same managerial coaching approach, which is a leadership style based
on the provision of constructive feedback that is designed to get the most out of
people, in other words, improve work performance by showing them that they are
respected and valued. Managerial coaching should occur as part of the day-to-
day relationship between employee and distribution supervisor and is one of the
strongest retention tools in a manager’s arsenal. For more information about
managerial coaching, please refer to section 5.4.4.2.
It is important to mention that all concepts presented for distribution optimization
are valid for both a company owned or an outsourced distribution operation and
the decision for outsource or not, should be aligned with the company’s strategic
direction, financial objectives, and core function analysis.
4.4.5
Customer Service
Ballou (1999) presents the elements of customer service according to when the
transaction between the supplier and customer take place. These elements can
be grouped into three categories, as detailed below:
• Pre-transaction elements establish a climate for good customer service,
providing a written statement of customer service policy, such as when
goods will be delivered after an order is place, the procedure for handling
returns and back orders, methods of shipment, and procedures for
prioritizing product allocation when there is a shortage, just to name a few
examples. Establishing contingency plans for times when labor strikes or
PU
C-R
io -
Cert
ific
ação D
igital N
º 0511118/C
A

127
natural disasters affect normal service, creating organizational structures
to implement customer service policy, and providing technical training and
manuals for customers also contribute to good customer relations.
• Transaction elements are those that directly result in the delivery of the
product to the customer. Setting stock levels, selecting transportation and
delivery modes, and establishing order-processing procedures are
examples. These elements, in turn, affect delivery times, accuracy of
order filling, condition of goods on receipt and stock availability.
• Post-transaction elements represent the array of services needed to
support the product in the field, to protect consumers from defective
products, to provide for the return of packages (e.g. returnable bottles,
pallets, etc.), and to handle claims, complaints, and returns. These take
place after the sale of the product, but they must be planned for in the
pre-transaction and transaction stages.
Corporate customer service is the sum of all these elements because customers
react to the total mix.
Segmentation is one of the key strategies to deliver a high customer service
level, cost effectively, and can be defined as the process of splitting customers or
potential customers within a market into different groups, or segments, within
which customers share a similar level of interest in the same, or comparable, set
of needs satisfied by a distinct marketing proposition.
McDonald and Dunbar (2007) provide a brief review of the predetermined
approaches frequently used to perform market segmentation, and basically, there
are 5 approaches:
• Product and services
• Demographics
• Geography
• Channel
• Psychographics
There are different types of customer service organizational structures. However,
two types are predominant in place nowadays:
• Single point of contact with support from multifunctional teams. In
this type of structure, there is one single point of contact with all
customers to solve operational requirements, like changing delivery dates
and frequencies, developing customized solutions, etc. The person in
charge of the contact will collect customer request and will work closely
PU
C-R
io -
Cert
ific
ação D
igital N
º 0511118/C
A

128
with each functional area of the company to review and implement the
appropriate solution. Figure 37 provides an example of single point of
contact structure.
Figure 37 – Author’s Example of Single Point of Contact Structure
• Dedicated Multifunctional Cell structure. In this type of structure,
representatives of different functional areas like Marketing, Logistics,
Finance, IT, and Commercial work in the same office to serve a pre-
defined customer or group of customers. This is a more specialized
approach and is found in some companies of the consumer product
industry, like Procter and Gamble. Figure 38 provides an example of
multifunctional cells.
Figure 38 – Author’s Example of Dedicated Cell Structure
PU
C-R
io -
Cert
ific
ação D
igital N
º 0511118/C
A

129
A well defined and executed customer service policy can have a deep impact in
the company financial returns, as illustrated in the figure 39 below:
Figure 39 – Potential Impact of a well Executed Customer Service Policy
4.4.6
Senior Management Support
Bossidy and Charan (2002) state that there are seven leadership behaviors that
form the building block of execution:
• Leaders should know their people and their business
• Insist on realism
• Set clear goals and priorities
• Follow through to confirm that actions and plans are executed
• Reward the “doers”
• Expand people’s capabilities
• Leaders should know themselves
Nalamalapu (2004) argues that leaders should have the following characteristics
and behaviors:
• Admit their own mistakes
• Be able to adapt to new situations
• Be empathetic
PU
C-R
io -
Cert
ific
ação D
igital N
º 0511118/C
A

130
• Leaders should sacrifice for and dedicate themselves to their missions
• Leaders should be disciplined
• Be effective communicators
• Lead by example
Fiedler’s contingency theory shows the relationship between the leader’s
orientation or style and group performance under different situational conditions.
Fiedler found that task oriented leaders were more effective in low and moderate
control situations and relationship oriented managers were more effective in
moderate control situations.
(http://www.valuebasedmanagement.net/methods_contingency_theory.html
visited on Sept/25-2010).
In order to move towards a demand driven supply and operations management, it
is important to have senior management support and engagement to make the
necessary changes in term of tools, processes and organizational culture, as
detailed below:
• Tools – It is necessary to implement new IT systems that will share
demand and supply information, first inside the organization, and then,
across the supply chain with customers and suppliers to allow sense and
respond to real time demand.
• Processes – As the company moves towards a pull operation, new
processes and operating procedures should be developed and
implemented, which will require sufficient employee training and
management leadership to ensure that new processes will be engrained
into the shop floor. Senior management support is crucial to provide
enough resources and leadership during this transition period.
• Organizational culture – The transition from a reactive push operation to a
pro-active pull operation requires a change in the organizational culture,
and senior management support is fundamental to allow HR design and
implement required programs to embed the new culture in the
organization.
Supply chain directors should also perform educational workshops with other
directors and the CEO (chief executive officer) to allow them understands the
differences between a “pure push” operation to a hybrid or a “pure pull” operation,
depending on the objectives of the company.
PU
C-R
io -
Cert
ific
ação D
igital N
º 0511118/C
A

131
4.5
Product Lifecycle Management (PLM)
In this section, it will be performed a literature review for each one of the 6
categories of Product Lifecycle management – New Product Forecast, Supply
chain Approach for New Product, Risk Assessment and Management, Product
Tracking & Visibility, Portfolio Optimization, Senior Management Support. This
review allowed identify the DDSC characteristics for each category which was
used to develop the 5 level maturity model.
4.5.1
Introduction
Based on Kahn (2005), product innovation – the development of new and
improved products – is crucial to the survival and prosperity of the modern
corporation. He stated that according to an American Productivity and Quality
Control (APQC) benchmarking study, new products launched three years before
the study, accounted for 27,5 of company sales, on average (American
Productivity and Quality Center, 2003), and product lifecycles are getting shorter
with a 400 percent reduction over the last 50 years as a result of an accelerating
pace of product innovation. However, many products do not succeed, as only
56% of businesses’ new product development projects achieve their financial
goals, and only 51% are launched on time.
To cope with this new scenario, product lifecycle management as the integrated,
information - driven approach to all aspects of a product's life, from concept to
design, manufacturing, maintenance and removal from the market, has become a
strategic priority in many company's boardrooms (Teresko, 2004).
For example, in the pharmaceutical industry, the development time for new drugs
has almost doubled over the last 30 years, and the average drug development
costs exceed US$ 800 million. Reshaping the lifecycle curve, so that, profitability
starts earlier and maturity ends later is seen as a matter of survival (Daly &
Kolassa, 2004).
The automotive industry is another vivid example of where success or failure is
strongly influenced by the company's ability to proactively manage product
lifecycles (Korth, 2003). Increased product complexity, greater reliance on
outsourcing and a growing need for collaboration with a rapidly expanding list of
business partners are the specific PLM challenges the industry faces (Teresko,
PU
C-R
io -
Cert
ific
ação D
igital N
º 0511118/C
A
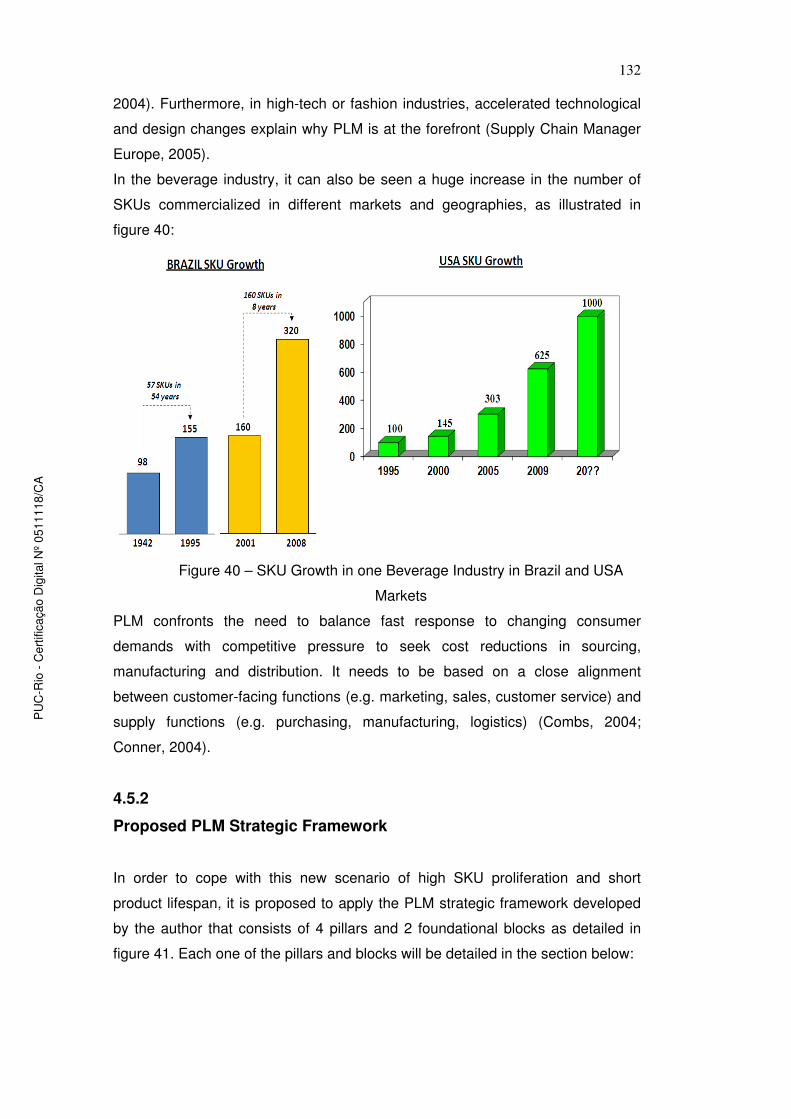
132
2004). Furthermore, in high-tech or fashion industries, accelerated technological
and design changes explain why PLM is at the forefront (Supply Chain Manager
Europe, 2005).
In the beverage industry, it can also be seen a huge increase in the number of
SKUs commercialized in different markets and geographies, as illustrated in
figure 40:
Figure 40 – SKU Growth in one Beverage Industry in Brazil and USA
Markets
PLM confronts the need to balance fast response to changing consumer
demands with competitive pressure to seek cost reductions in sourcing,
manufacturing and distribution. It needs to be based on a close alignment
between customer-facing functions (e.g. marketing, sales, customer service) and
supply functions (e.g. purchasing, manufacturing, logistics) (Combs, 2004;
Conner, 2004).
4.5.2
Proposed PLM Strategic Framework
In order to cope with this new scenario of high SKU proliferation and short
product lifespan, it is proposed to apply the PLM strategic framework developed
by the author that consists of 4 pillars and 2 foundational blocks as detailed in
figure 41. Each one of the pillars and blocks will be detailed in the section below:
PU
C-R
io -
Cert
ific
ação D
igital N
º 0511118/C
A

133
Figure 41 – Author’s Proposed PLM Strategic Framework
4.5.2.1
New Product Forecast Models
New product forecast is an important capability to guarantee product availability
in the early phases of introduction in the market. However, benchmarking
research shows that new product forecast accuracy is only slightly above 50% on
average one year after the launch.
Common issues related to new product forecasting are:
• Low accuracy (high forecast error) and high variability
• Low forecast credibility inside the organization and a lot of complaints
from other areas
• Limited amount of data available for analysis or to be used in the forecast
process (usually, sales data is available only for regular products)
• Slow operational process to adjust or change based on market / demand
signals
• Inability to fully capture market complexity, cannibalization, market
penetration rate, etc.
• Limited amount of time for analysis & forecast
• Information about new product introduction usually is not provided in
appropriate time
• Operational problems usually increase forecast error (raw material
availability, Out-of-Stocks in the market, inventory problems, etc.)
Kahn (2006) provides direction on how new product forecasting should be
performed. He states that the first step is to establish the forecasting objective, as
PU
C-R
io -
Cert
ific
ação D
igital N
º 0511118/C
A

134
this will clarify the purpose and intent of the forecast so that a meaningful forecast
can be made. Once the forecasting objective is established, consideration is
needed regarding the forecasting level, time horizon, interval and form.
• Forecasting level refers to the focal point in the corporate hierarchy where
the new product forecast applies. Common levels include the stock
keeping unit (SKU) level, stock keeping unit per location (SKUL), product
line, strategic business unit (SBU) level, company level, and industry
level.
• Forecasting time horizon refers to the time frame for how far out one
should forecast. New product forecasts may correspond to a single point
in the future or a series of forecasts extending out for a length of time.
Examples include a one to two year time horizon for most fashion
products, two to five years for most consumer products goods, and ten-
plus years for pharmaceutical products.
• Forecasting time interval refers to the granularity of the new product
forecast with respect to the time bucket as well as to how often the
forecast might be updated. For example, a series of forecasts can be
provided on a weekly, monthly, quarterly, or annual basis.
• Forecasting form refers to the unit of measure for the forecast. Typically,
early new product forecasts are provided in monetary form (e.g. U.S.
dollars) and later provided in terms of unit volume for production
purposes.
There are seven different types of new products, as described below:
• New products focused on cost reductions are products that do not
have dramatic changes, but have changes that can influence consumer
purchase behavior, especially when connected with implementing a new
pricing policy or sustaining a cost advantage.
• Product improvements are product enhancements that improve the
product’s form or function and are often labeled as “new and improved” or
“better flavor”
• Line extensions retain standard features of an original product (or set of
products) and add unique features that the original product (or original set
of products) does not have. The distinction between a product
improvement and line extension is that the product improvement replaces
the original product, so customers are migrated to the new product, while
PU
C-R
io -
Cert
ific
ação D
igital N
º 0511118/C
A

135
in the case of a line extension both the original and new products are
available for purchase.
• New market products are when a company takes its product to a new
market where the product had not been offered.
• New uses are original products positioned in new markets without
changing or only slightly changing the original product.
• New category entries are products that are new to the company, but as
a category, not new to the consumer.
• New to the world products are technological innovations that create a
completely new market that previously did not exist.
Kahn (2006) provides the Product-Market Matrix in figure 42 which organizes
these seven types above into 2 dimensions (Market and Product), and states 4
different strategies:
• Market penetration strategy has the objective to increase market share
or increase product usage. Cost reductions and product improvements
are characteristic of a market penetration strategy.
• Product development strategy derives from an objective to capitalize on
existing product technology and offer more options to the customer base.
In this way, the company with a more diverse product line can fend off
competitors. Line extensions are characteristically associated with a
product development strategy.
• Market development strategy stems from a desire to expand sales
volume of existing products through new markets. This would include
geographic expansions, including international markets and targeting new
market segments within the domestic market. New uses and new market
products are characteristic of a market development strategy.
• Diversification strategy is pursued when the company wishes to expand
its business into related businesses and unrelated businesses. A
company pursuing this strategy confronts complexities associated with
new customer markets and new product technologies. New categories
entries and new to the world products are examples of diversification
strategy.
PU
C-R
io -
Cert
ific
ação D
igital N
º 0511118/C
A

136
Figure 42 – Product-Market Matrix (Kahn, 2006)
There are five categories of new product forecasting techniques, as detailed
below:
• Judgment Techniques represent those techniques that attempt to turn
experience, judgment, and intuition into formal forecasts. There are 6
popular techniques within this category:
o Jury of executive opinion: Top-down forecasting technique where
the forecast is arrived at through the ad hoc combination of
opinions and predictions made by informed executives and
experts.
o Sales force composite: Bottom-up forecasting technique where
individuals (typically salespeople) provide their forecasts. These
forecasts are then aggregated to calculate a higher level forecast.
o Scenario analysis: Analysis involving the development of
scenarios to predict the future. Two types of scenario analysis
could be used – Exploratory which starts in the present and moves
out to the future based on current trends, and Normative which
leaps out to the future and works back to determine what should
be done to achieve what is expected to occur.
o Delphi method: Technique based on subjective expert opinion
gathered through several structured anonymous rounds of data
collection. The objective is to capture the advantages of multiple
experts in a committee, while minimizing the effects of social
PU
C-R
io -
Cert
ific
ação D
igital N
º 0511118/C
A

137
pressures to agree with the majority, ego pressure, and influence
of a dominant individual.
o Decision tree: Probabilistic approach to forecasting where various
contingencies and their associated probability of occurring are
determined.
o Assumptions based modeling: Technique that attempts to model
the behavior of the relevant market environment by breaking the
market down into market drivers, and then by assuming values for
these drivers, forecasts are generated.
• Customer / Market Research Techniques include those approaches
that collect data on the customer / market and then systematically analyze
these data to draw inferences on which to make forecasts. Four general
classes of techniques are available:
o Concept testing: Process by which customers (current and
potential ones) evaluate a new product concept and give their
opinions on whether the concept is something that they might
have an interest in and would be likely to buy. The purpose of
concept testing is to proof the new product concept.
o Product use testing: Process by which customers (current and
potential ones) evaluate a product’s functional characteristics and
performance. The purpose of product use testing is to proof the
product’s functionality.
o Market testing: Process by which targeted customers evaluate the
marketing plan for a new product in a market setting. The purpose
of market testing is to proof the proposed marketing plan and the
“final” new product.
o Premarket testing: Procedure that uses syndicated data and
primary consumer research to estimate the sales potential of new
product initiatives.
• Time Series Techniques analyze sales data to detect historical sales
patterns and construct a representative graph or formula to project sales
into the future. Time series techniques used in association with new
product forecasting include:
o Trend analysis: A line is fit to a set of data. This is done either
graphically or mathematically based on the actual demand as it
occurs.
PU
C-R
io -
Cert
ific
ação D
igital N
º 0511118/C
A

138
o Moving average: Technique that averages only a specified number
of previous sales periods.
o Looks-like analysis: Technique that attempts to map sales of other
products onto the product being forecast. Looks-like analysis is a
popular technique applied to line extensions by using sales of
previous product line introductions to profile sales of the new
product.
o Autoregressive Moving Average (ARMA) / Autoregressive
Integrated Moving Average (ARIMA) models: A set of advanced
statistical approaches to forecasting that incorporate key elements
of both time series and regression model building. Three basic
activities (or stages) are considered: 1) identifying the model, 2)
determining the model’s parameters, 3) testing / applying the
model.
• Regression Analysis Techniques use exogenous or independent
variables, and through statistical methods, develop formula correlating
these with a dependent variable. Four popular techniques are used:
o Linear Regression: Statistical methodology that assesses the
relation between one or more managerial variables and a
dependent variable (sales), strictly assuming that these
relationships are linear in nature.
o Event modeling: Linea regression-based methodology that
assesses the relation between one or more events, whether
company-initiated or nonaffiliated with the company, and a
dependent variable (sales).
o Nonlinear regression: Statistical methodology that assesses the
relation between one or more managerial variables and a
dependent variable (sales), but these relationships are not
necessarily assumed to be linear in nature.
o Logistic regression: Statistical methodology that assesses the
relation between one or more managerial variables and a binary
outcome, such as purchase versus non purchase. A logistic
regression model calculates the probability of an event occurring
or nor occurring.
• Other quantitative techniques proposed by Kahn (2006) include those
techniques that employ unique methodologies or represent a hybrid of
PU
C-R
io -
Cert
ific
ação D
igital N
º 0511118/C
A

139
time series and regression techniques. Examples of these forecasting
techniques are:
o Expert systems: Typically computer-based heuristics or rules for
forecasting. These rules are determined by interviewing
forecasting experts and then constructing “if-then” statements.
o Simulation: Approach to incorporate market forces into a decision
model. A typical simulation model is Monte Carlo simulation, which
employs randomly generated events to drive the model and
assess outcomes.
4.5.2.2
Supply Chain Approach for Innovative Products
Fisher (1997) proposes a framework to define what is the best supply chain
strategy for a company’s product. He argues that the first step in devising an
effective supply chain strategy is to consider the nature of the demand for the
products. In this case, many aspects are important, for example, product
lifecycle, demand predictability, product variety, market standards for lead times
and service (the percentage of demand filled from instock goods). He suggests
classifying products into “functional” or “innovative”, in order to ensure a perfect
match between the type of the product and the type of supply chain. Below is a
summary describing the characteristics of Functional and Innovative Products:
Functional Products:
¯ Product do not change much over time;
¯ Have stable and predictable demand;
¯ Long life cycles;
¯ Lower potential growth.
Innovative Products:
¯ Great variety of products;
¯ Increase unpredictability (volatile demand);
¯ Short life cycles;
¯ Higher potential growth.
The next step is to decide whether the company’s supply chain should be
“Physically Efficient” or “Responsive to the Market”, as described in the table
16:
PU
C-R
io -
Cert
ific
ação D
igital N
º 0511118/C
A

140
Table 16 – Physically Efficient vs. Market Responsive Supply Chains (Fisher,
1997)
Physically Efficient Process
Primary purpose
Manufacturing focus
Inventory strategy
Lead time focus
Approach to choosingsuppliers
Product-design strategy
Market Responsive Process
Supply predictable demand efficiently at the lowest possible cost
Respond quickly to unpredictable demand in order to minimize stock outs and obsolete inventory
Maintain high average utilization rate (reduce setups)
Deploy excess buffer capacity
Generate high turns and minimize inventory throughout the chain
Deploy significant buffer stocks or end products in the chain
Shorten lead time as long as it does not increase cost
Invest aggressively in ways to reduce lead time
Select primarily for cost and quality criteria
Select primarily for speed, flexibility, and quality
Maximize performance and minimize cost
Try to postpone product differentiation for as long as possible in the supply chain
After determining the nature of the product demand (e.g. functional and
innovative products) and the supply chain priorities (e.g. responsive or efficient),
managers can employ a matrix to formulate the ideal supply chain strategy.
Fisher proposes to plot the nature of the demand for each of the product families
and its supply chain priorities, as illustrated in figure 43, in order to allow identify
whether the process used for supplying products is well matched to the product
type, which means, an efficient process for functional products and a responsive
process for innovative products.
PU
C-R
io -
Cert
ific
ação D
igital N
º 0511118/C
A

141
Figure 43 – Fisher (1997) Approach for Matching Supply Chains with Products
When thinking about innovative products, uncertainty about demand is intrinsic to
this type of products and should be accept by companies. Once a company has
accepted the uncertainty of demand, it can employ three coordinated strategies
to manage that uncertainty:
• First, company can continue to strive to reduce uncertainty by, for
example, finding sources of new data that can serve as leading indicators
or by having different products share common components as much as
possible, so that, the demand for components becomes more predictable.
• Second, company can avoid uncertainty by cutting lead times and
increasing the supply chains’ flexibility so that it can product to order or at
least manufacture the product at a time closer to when demand
materializes and can be accurately forecast.
• Third, once uncertainty has been reduced or avoided as much as
possible, it can hedge against the remaining residual uncertainty with
buffers of inventory or excess capacity.
Lee (2002) expanded the framework developed by Fisher (1997) and introduced
the concept of supply uncertainty. He argues that uncertainties around the supply
side of the product are equally important drivers for the right supply chain
strategy.
A stable supply process is one where the manufacturing process and the
underlying technology are mature and the supply base is well established. On the
other hand, an “evolving” supply process is where the manufacturing process and
PU
C-R
io -
Cert
ific
ação D
igital N
º 0511118/C
A

142
the underlying technology are still under early development and are rapidly
changing, and as a result, the supply base may be limited in both size and
experience.
In a stable supply process, manufacturing complexity tends to be low or
manageable. Stable manufacturing processes tend to be highly automated, and
long-term supply contracts are prevalent. In an evolving supply process, the
manufacturing process requires a lot of fine-tuning and is often subject to
breakdowns and uncertain yields. The supply base may not be as reliable, as the
suppliers themselves are going through process innovations.
The figure 44 provides some examples of products that have different demand
and supply uncertainties. Lee’s advocates that it is more challenging to operate a
supply chain that is in the right column of the figure below than in the left column,
and similarly, it is more challenging to operate a supply chain that is in the lower
row of the figure below than in the upper row. He argues that before setting up a
supply chain strategy, it is necessary to understand the sources of the underlying
uncertainties and explore ways to reduce these uncertainties.
Figure 44 – Examples of Products with Demand and Supply Uncertainty (Lee,
2002)
Lee (2002) suggests strategies to reduce demand and supply uncertainties, as
detailed below:
• Demand uncertainty:
Information sharing and tight coordination can allow companies to regain
control of supply chain efficiency. Sharing of demand information and
synchronized planning across the supply chain are crucial for this
objective.
• Supply uncertainty:
Free exchanges of information - starting with the product development
stage and continuing with the mature and end-of-life phases of the
PU
C-R
io -
Cert
ific
ação D
igital N
º 0511118/C
A

143
product life cycle – have been found to be highly effective in reducing the
risks of supplier failure.
Sharing product rollover plans with suppliers is a key way to manage the
risks of product transitions. Another way to reduce supply uncertainty
downstream is to collaborate in the early phases of product design.
4.5.2.3
Risk Assessment & Management
Kahn (2005) states that a well planned and executed risk assessment and
analysis should be part of any significant product development project. Risk
assessment and analysis serve as the project manager’s binoculars to see into
the future. By spending time and money early to examine what might go wrong
and how it might happen, managers can make effective plans to avoid those
problems and / or minimize their impact, while staying on schedule and budget
for the launch. He also states that project manager should apply a robust risk
analysis approach to identify general potential problems in the early phase of the
new product development, and later, in the development process, should use
Failure Mode and Effects Analysis (FMEA), in order to have a more detailed view
of each part of the design and ensure that it is aligned with the plan.
The author developed and proposes to apply the risk assessment detailed below
as part of the analysis in the early phases of new product launch:
• Consider 10 standard risk factors to be evaluated by project manager.
These factors were identified based on the author’s experience and
should include Level of innovation, product coverage in the market,
forecast complexity, time to market, product shelf life, manufacturing
complexity, raw material characteristics, storage and operational
requirements, distribution complexity, expected profitability, etc. (detail
description of each factor is available in table 17)
• Use a pre-defined scale to weight each risk factor. A weight of 5 means a
high risk, a 3 means medium risk, and a 1 means a low risk
• For each risk factor, there is a pre-defined functional area inside the
company that will be responsible to give the score for the factor in one
particular project.
• Maximum score is calculated as the Σ (Highest score for each factor x
Weight for each factor)
PU
C-R
io -
Cert
ific
ação D
igital N
º 0511118/C
A

144
• Final risk score for a specific new product launch is calculated as the Sum
of the weighted scores for each factor / Maximum score
• Based on risk assessment results, identify the level of risk for the project
as defined below:
o Less than 50% - Launch with LOW risk
o Between 50% and 70% - Launch with MEDIUM risk
o Greater than 70% - Launch with HIGH risk
• Project team should identify the areas with more critical potential risks and
develop mitigating actions to reduce exposure.
• Apply Failure Mode and Effects Analysis (FMEA) technique for each
project with high risk during the project development. FMEA is a 6-Sigma
technique that can be applied to new product development and will allow
the project team to systematically examine each important aspect of the
product launch to identify, prioritize and set mitigation strategies for
potential gaps / weaknesses in the new product introduction, avoiding
potential future problems.
Table 17 – Author’s Proposed List of Risk Factors
PU
C-R
io -
Cert
ific
ação D
igital N
º 0511118/C
A

145
4.5.2.4
Product Tracking & Visibility
One of the key characteristics of demand driven supply chains is the ability to
read and sense the demand, and have an agile supply network capable of
reacting very fast to fulfill market demand. In order to achieve this desired state, it
is critical to establish processes and implement tools that will allow having
visibility of demand levels in the market and also tracking product performance in
the market to compare planed vs. actual performance in different dimensions.
Based on the author’s experience, it is suggested to consider the following
examples of tracking:
• Total volume evolution
• Volume mix by market channel
• Repeat purchase frequency evolution
• Repeat purchase frequency by market channel
• Price compliance
When moving to a more mature demand driven state, companies can benefit
from tools like CPFR, VMI, Inventory visibility, which provide actual demand and
inventory information between customers and the company increasing agility and
flexibility to adjust production and distribution based on real demand signals.
4.5.2.5
Portfolio Optimization with Stage & Gate Approach
Portfolio optimization is an analytical process used to determine the merits of
adding, retaining, or deleting items from the product portfolio of a business. It can
be summarized as a way to make sure that a company does not keep what they
don’t need. Portfolio optimization is important as all SKUs become liabilities to an
organization at some point in their lifecycles. The key is to establish repeatable
processes to identify when that point is reached and execute plans to capture as
much revenue and profit as possible, before discontinuing each item. The aim is
to separate underperforming SKUs from those that contribute significantly to the
business results.
Portfolio optimization is used in the following situations:
PU
C-R
io -
Cert
ific
ação D
igital N
º 0511118/C
A

146
• To make room for Innovation: Convince company’s customers to add new
products to the category and find a place for a new item on the crowded
shelf in their stores.
• To increase competitiveness: Straggling competitive SKUs can take up
space and bring down the profitability and productivity of the entire
category, lowering the category’s utility in the minds of buyers and putting
the entire category’s space allocation at risk.
A proactive portfolio optimization exercise not only introduces the
opportunity to eliminate competitive items, but also can enhance the
overall vitality of the category.
• To correct out of stock issues: Large size and high volume items can
suffer from out-of-stock issues which lower potential sales. Portfolio
optimization is critical to free up space for the items going out-of-stock.
The high velocity items will benefit through increased profitability due to
customers not being forced to go to other locations to find the high
demand item.
Kahn (2005) states that a systematic new product framework such as a Stage –
Gate™ process is the solution that many companies have turned to in order to
overcome the deficiencies that plague their new product programs. Stage –
Gate™ frameworks are simply roadmaps for driving new products from idea to
launch successfully and efficiently. He argues that about 68 percent of U.S.
product developers have adopted Stage – Gate™ frameworks, according to the
1997 PDMA best practice study. The 2003 APQC benchmarking study reveals
that 73% of businesses employ such a framework and identified a stage-and-gate
process as the strongest best practice, employed by almost every best
performing business.
Follow below a typical 5 stage-gate process:
• Stage 1 – Scoping: A quick investigation and sculpting of the project.
This first and inexpensive homework stage has the objective of
determining the project’s technical and marketplace merits. Stage 1
involves desk research or detective work – little or no primary research is
done here. Prescribed activities include preliminary market, technical
assessment, and business assessment.
• Stage 2 – Build the business case: The detailed homework and upfront
investigation work. This second homework stage includes actions, such
as a detailed market analysis, user needs and wants studies to build
PU
C-R
io -
Cert
ific
ação D
igital N
º 0511118/C
A

147
“voice of the customer”, competitive benchmarking, concept testing,
detailed technical assessment, source of supply assessment, and a
detailed financial and business analysis. The result is a business case –
a defined product, a business justification, and a detailed plan of action for
the next stages.
• Stage 3 – Development: The actual design and development of the new
product. Stage 3 witnesses the implementation of the development plan
and the physical development of the product. Lab tests, in-house tests, or
alpha tests ensure that the product meets requirements under controlled
conditions. The “deliverable” at the end of stage 3 is a prototype product
that has been lab tested and partially tested with the customer.
• Stage 4 – Testing & validation: The verification and validation of the
proposed new product, its marketing and production. This stage tests and
validates the entire viability of the project: the product itself via customer
tests, beta tests, or field trials; the production process via trial or limited
production runs; customer acceptance by way of a test market or a trial
sell. Also, the financial justification required prior to full launch is obtained.
• Stage 5 – Launch: Full commercialization of the product – the beginning
of full production and commercial launch and selling. The post-launch
plan – monitoring and fixing – is implemented, along with early elements
of the life-cycle plan (new variants and releases, continuous
improvements).
12 – 18 months after the launch, the post launch review occurs. The performance
of the project versus expectations is assessed, along with reasons why events
occurred and what lessons were learned. The team is disbanded and recognized
and the project team is terminated
Preceding each stage is a gate. These are the quality control checkpoint in the
process, opening the door for the project to proceed to the next stage. Here, the
project team meets with senior management, the gatekeepers, seeking approval
and resources for their project. Each “go/kill” specifies deliverables (what the
project team must deliver for that gate review), criteria for a go decision (for
example, a scorecard as outlined above, upon which the “go/ill” and prioritization
decisions are based), and outputs (an action plan for the next stage, and
resources approved).
Two types of gates are possible:
• The first type of gate is called a rigid gate where all necessary criteria
must be passed in order to continue the project. Indeed, it is possible in
PU
C-R
io -
Cert
ific
ação D
igital N
º 0511118/C
A

148
the case of a rigid gate that the failure to reach even a single threshold
could derail a new project.
• The second type of gate is called a flexible or permeable gate, which
allows a limited number of tasks, frequently those with long lead times, to
move forward to the next stage without having to pass all criteria.
Kahn (2005) presents the top 6 gate criteria used by gate, as detailed in the table
18 (numbers represent the percentage of firms in sample reporting to use each
criterion):
Table 18 – Kahn (2005) Criteria used by Gate
Gate 1 Gate 2 Gate 3
Market potential (86%) Technical Feasibility
(85%)
Product Performance
(86%)
Strategic Fit (85%) Sales Objectives (81%) Sales Objectives (79%)
Technical Feasibility
(84%)
Product Performance
(79%)
Quality Objectives (78%)
Sales Objectives (81%) Product Advantage (77%) Profit Potential (75%)
Product Advantage
(79%)
Strategic Fit (76%) Customer Acceptance
(73%)
Profit Potential (71%) ROI (73%) Product Advantage (72%)
Benefits of a Stage-Gate™ Approach:
• Puts discipline into a somewhat ad-hoc, chaotic process
• A visible process - known & understood by all stakeholders inside the
operation
• A roadmap for the Project Leader - defines his/her duties and deliverables
• Forces more attention to quality of execution - the Gates become quality
control check points for product launch / retire
• Makes for a complete process - no critical errors of omission; no missing
steps
PU
C-R
io -
Cert
ific
ação D
igital N
º 0511118/C
A

149
• Multifunctional - inputs from all sides involved in the launching / retiring
processes
• A faster process via parallel processing
Practical lessons to improve gate decisions based on author’s experience:
• Gatekeeper team should consist of a different set of individuals than those
actually conducting the product launch/retirement. (Individuals that spend
months or years working on a project tend to get emotionally attached to
it, making it difficult to view progress objectively.
• Have clearly defined criteria (marketing, supply chain, commercial and
financial) that must be met both overall and at each stage.
• Communicate Gate decisions to the entire organization to increase
awareness and commitment. (Have a standard “meeting notes” format to
document all decisions).
• Have project continuation / termination decisions made by a cross-
functional team rather than one person. Team generally makes better
decisions than individuals acting alone.
• More innovative new products should require a higher level of tracking
and monitoring (e.g. more stringent criteria, consider adding extra review
points, etc.)
4.5.2.6
Senior Management Support & Organizational Culture
APQC (2004) performed a benchmark study to identify best practices in new
product development with 105 companies from different industries and business
segments, and one of the key findings were the importance of senior
management support and commitment to develop a innovative culture inside the
organization (79% of best performers have this practices implemented in their
organizations), and also 65% provide strong support and empowerment to the
team members, as detailed in the figure 45:
PU
C-R
io -
Cert
ific
ação D
igital N
º 0511118/C
A

150
Figure 45 – APQC (2004) study shows the percentage of businesses where
senior management demonstrates commitment to new product development
Another finding from the benchmark study is that an innovative climate inside the
organization is seen as one of the most important drivers of successful product
development. 12 elements were identified and split into two main factors or
themes – the first is the general climate and the second centers on specific
actions and programs to promote a positive climate. The graphics in figures 46
and 47 present each one of the elements:
Figure 46 – APQC (2004) study shows the percentage of businesses that have
each element of a positive climate for innovation
PU
C-R
io -
Cert
ific
ação D
igital N
º 0511118/C
A

151
Figure 47 – APQC (2004) study shows the percentage of businesses with
specific actions and programs to promote positive climate for innovation
Key points for senior management attention based on author’s experience:
• Provide proper direction and leadership: Senior management should
foster a climate of open communication, high motivation, involvement with
the project launch or retirement, and willingness from each functional area
to cooperate with the project team.
• Foster an innovative culture: To really succeed with new products, senior
management should align annual objectives, rewards and recognitions
programs and performance management in a way that motivates and
align the whole organization towards proposing and implementing
innovative ideas, services and products.
• Create a culture of “don’t be Afraid to try”: It is very important that all
employees feel that they will not be punished if they try solutions “out of
the box” to help the organization increase sales volume and profitability.
• Have clear metrics to support decision making: Establish a PLM
dashboard to track performance of both new product introduction and
product retirement aligned with business plan goals.
PU
C-R
io -
Cert
ific
ação D
igital N
º 0511118/C
A