4. ACHIEVEMENTS OF A COHORT OF URBAN … OF A COHORT OF URBAN PUPILS IN THE 1997 JUNIOR CERTIFICATE...
36
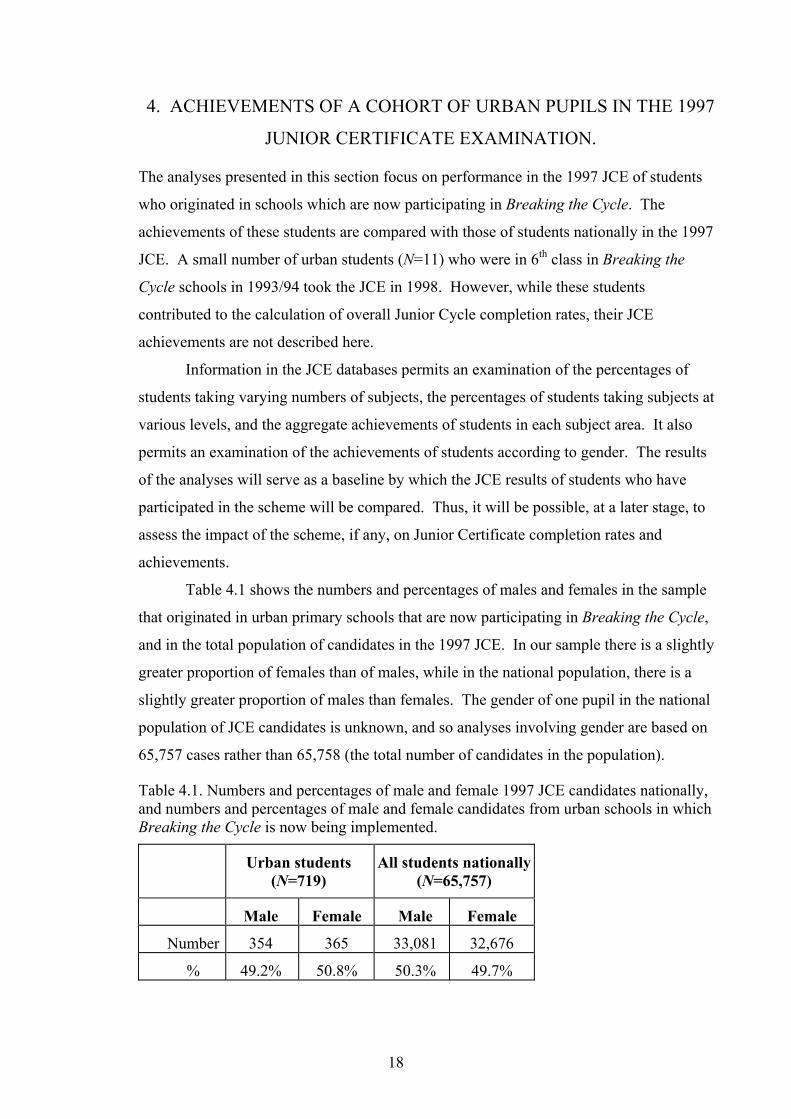
4. ACHIEVEMENTS OF A COHORT OF URBAN PUPILS IN THE 1997 JUNIOR CERTIFICATE EXAMINATION. The analyses presented in this section focus on performance in the 1997 JCE of students who originated in schools which are now participating in Breaking the Cycle. The achievements of these students are compared with those of students nationally in the 1997 JCE. A small number of urban students (N=11) who were in 6 th class in Breaking the Cycle schools in 1993/94 took the JCE in 1998. However, while these students contributed to the calculation of overall Junior Cycle completion rates, their JCE achievements are not described here. Information in the JCE databases permits an examination of the percentages of students taking varying numbers of subjects, the percentages of students taking subjects at various levels, and the aggregate achievements of students in each subject area. It also permits an examination of the achievements of students according to gender. The results of the analyses will serve as a baseline by which the JCE results of students who have participated in the scheme will be compared. Thus, it will be possible, at a later stage, to assess the impact of the scheme, if any, on Junior Certificate completion rates and achievements. Table 4.1 shows the numbers and percentages of males and females in the sample that originated in urban primary schools that are now participating in Breaking the Cycle, and in the total population of candidates in the 1997 JCE. In our sample there is a slightly greater proportion of females than of males, while in the national population, there is a slightly greater proportion of males than females. The gender of one pupil in the national population of JCE candidates is unknown, and so analyses involving gender are based on 65,757 cases rather than 65,758 (the total number of candidates in the population). Table 4.1. Numbers and percentages of male and female 1997 JCE candidates nationally, and numbers and percentages of male and female candidates from urban schools in which Breaking the Cycle is now being implemented. Urban students (N=719) All students nationally (N=65,757) Male Female Male Female Number 354 365 33,081 32,676 % 49.2% 50.8% 50.3% 49.7% 18
Transcript of 4. ACHIEVEMENTS OF A COHORT OF URBAN … OF A COHORT OF URBAN PUPILS IN THE 1997 JUNIOR CERTIFICATE...
4. ACHIEVEMENTS OF A COHORT OF URBAN PUPILS IN THE 1997
JUNIOR CERTIFICATE EXAMINATION.
The analyses presented in this section focus on performance in the 1997 JCE of students
who originated in schools which are now participating in Breaking the Cycle. The
achievements of these students are compared with those of students nationally in the 1997
JCE. A small number of urban students (N=11) who were in 6th class in Breaking the
Cycle schools in 1993/94 took the JCE in 1998. However, while these students
contributed to the calculation of overall Junior Cycle completion rates, their JCE
achievements are not described here.
Information in the JCE databases permits an examination of the percentages of
students taking varying numbers of subjects, the percentages of students taking subjects at
various levels, and the aggregate achievements of students in each subject area. It also
permits an examination of the achievements of students according to gender. The results
of the analyses will serve as a baseline by which the JCE results of students who have
participated in the scheme will be compared. Thus, it will be possible, at a later stage, to
assess the impact of the scheme, if any, on Junior Certificate completion rates and
achievements.
Table 4.1 shows the numbers and percentages of males and females in the sample
that originated in urban primary schools that are now participating in Breaking the Cycle,
and in the total population of candidates in the 1997 JCE. In our sample there is a slightly
greater proportion of females than of males, while in the national population, there is a
slightly greater proportion of males than females. The gender of one pupil in the national
population of JCE candidates is unknown, and so analyses involving gender are based on
65,757 cases rather than 65,758 (the total number of candidates in the population).
Table 4.1. Numbers and percentages of male and female 1997 JCE candidates nationally, and numbers and percentages of male and female candidates from urban schools in which Breaking the Cycle is now being implemented.
Urban students (N=719)
All students nationally (N=65,757)
Male Female Male Female
Number 354 365 33,081 32,676
% 49.2% 50.8% 50.3% 49.7%
18

4.1 NUMBER OF EXAMINATION SUBJECTS TAKEN BY STUDENTS
A first step in the description of student performance in the JCE is to describe the number
of subjects taken by candidates. As Table 4.2 shows, on average, urban students took
slightly fewer subjects (8.31) than did candidates nationally (8.92).
Table 4.2. Numbers of subjects taken in the 1997 JCE by students from urban schools in which Breaking the Cycle is now being implemented, and by all students nationally.
Urban students (N=719)
All students nationally (N=65,758)
Number % Number %
12 Subjects - - 31 0.0%
11 Subjects - - 829 1.3%
10 Subjects 15 2.1% 11,877 18.1%
9 Subjects 371 51.6% 39,288 59.7%
8 Subjects 233 32.4% 11,037 16.8%
7 Subjects 68 9.5% 1,694 2.6%
6 Subjects 19 2.6% 444 0.7%
5 Subjects 4 0.6% 175 0.3%
4 Subjects - - 62 0.1%
3 Subjects 1 0.1% 52 0.1%
2 Subjects 3 0.4% 74 0.1%
1 Subject 5 0.7% 195 0.3% Mean 8.31 8.92 Mode 9 9
When the number of subjects taken is examined according to gender of
candidate, it is found that female students from urban schools, on average, took
slightly more subjects than did their male counterparts (8.38 vs 8.24) (Table 4.3). This
pattern is repeated in the national population, where female students took an average
of 8.96 subjects and male students an average of 8.87 subjects (Table 4.4).
19

Table 4.3. Numbers and percentages of male and female students from urban schools in which Breaking the Cycle is now being implemented that took varying numbers of subjects in the 1997 JCE (N=719).
Male (N=354)
Female (N=365)
Number % Number % 12 Subjects - - - - 11 Subjects - - - - 10 Subjects 4 1.1% 11 3.0% 9 Subjects 173 48.9% 198 54.2% 8 Subjects 125 35.3% 108 29.6% 7 Subjects 33 9.3% 35 9.6% 6 Subjects 13 3.7% 6 1.6% 5 Subjects 1 0.3% 3 0.8% 4 Subjects - - - - 3 Subjects - - 1 0.3% 2 Subjects 1 0.3% 2 0.6% 1 Subject 4 1.1% 1 0.3% Mean 8.24 8.38 Mode 9 9
Table 4.4. Numbers and percentages of male and female students nationally that took varying numbers of subjects in the 1997 JCE (N=65,757).
Male (N=33,081)
Female (N=32,676)
Number % Number % 12 Subjects 8 0.0% 23 0.1% 11 Subjects 426 1.3% 403 1.2% 10 Subjects 5,792 17.5% 6,085 18.6% 9 Subjects 19,090 57.7% 20,197 61.8% 8 Subjects 6,126 18.5% 4,911 15.0% 7 Subjects 1,033 3.1% 661 2.0% 6 Subjects 292 0.9% 152 0.5% 5 Subjects 110 0.3% 65 0.2% 4 Subjects 39 0.1% 23 0.1% 3 Subjects 33 0.1% 19 0.1% 2 Subjects 43 0.1% 31 0.1% 1 Subject 89 0.3% 106 0.3% Mean 8.87 8.96 Mode 9 9
20

4.2 POPULARITY OF EXAMINATION SUBJECTS TAKEN BY STUDENTS
Mathematics and English were equally popular among candidates nationally, with
99.5% of students taking these subjects (Table 4.5 and Figure 4.1). A similar level of
uptake of English was found among students in the urban cohort, while slightly smaller
percentages of these students took Mathematics and Irish.
Table 4.5. Numbers and percentages of urban students from Breaking the Cycle schools and all students nationally taking various subjects in the 1997 JCE.
Urban students (N=719)
All students nationally (N=65,758)
Number % Number % English 712 99.1% 65,447 99.5% Mathematics 710 98.8% 65,423 99.5% Irish 681 94.7% 63,328 96.3% Geography 620 86.2% 60,728 92.4% History 643 89.4% 60,379 91.8% Science 549 76.4% 56,308 85.6% French 426 59.2% 47,107 71.6% Business Studies 396 55.1% 43,950 66.8% Home Economics 303 42.1% 22,369 34.0% Art, Craft, Design 273 37.9% 23,293 35.4% Materials technology 161 22.4% 16,220 24.7% Music 103 14.3% 8,787 13.4% German 98 13.6% 16,165 24.6% Technical graphics 94 13.2% 17,349 26.4% Metalwork 83 11.5% 9,099 13.8% Environmental & Social Studies 41 5.7% 648 1.0% Spanish 28 3.9% 1,974 3.0% Technology 23 3.2% 3,409 5.2% Typewriting 22 3.1% 725 1.1% Classical Studies 8 1.1% 603 0.9% Italian 3 0.4% 242 0.4% Science (local) - - 1,957 3.0% Latin - - 711 1.1% ESP – Geography - - 38 0.1% Greek - - 30 0.0% Hebrew - - 4 0.0% History - Syllabus 2 - - - - ESP – History - - - - Geography - Syllabus 2 - - - -
21

Figure 4.1. Percentages of urban students from Breaking the Cycle schools and all students nationally taking various subjects in the 1997 JCE (with the exception of Classical Studies, Italian, Science (local), ESP Geography, Greek, Hebrew and Latin, which were all taken by less than 1% of urban students).
0
10
20
30
40
50
60
70
80
90
100
Eng
lish
Mat
hem
atic
s
Irish
Geo
grap
hy
His
tory
Sci
ence
Fren
ch
Bus
ines
s S
tudi
es
Hom
e E
c
Art,
Cra
ft, D
esig
n
Mat
eria
ls te
ch -
woo
d
Mus
ic
Ger
man
Tech
gra
phic
s
Met
alw
ork
E &
S S
tudi
es
Spa
nish
Tech
nolo
gy
Type
writ
ing
Perc
enta
ge
U rban A ll
As can be seen from Table 4.5 and Figure 4.1, there are some differences
between urban students and students nationally in terms of subject popularity in the
1997 JCE. While the observed differences may reflect the choices of individual
students, they may equally reflect the courses of study available to students in different
kinds of second-level school (e.g., single-sex, vocational). Proportionately more
students in our sample than students nationally sat examination papers in Home
Economics (42.1% vs 34.0%), and in Art, Craft and Design (37.9% vs 35.4%). On the
other hand, greater percentages of students nationally took French (71.6% vs 59.2%),
22

Business Studies (66.8% vs 55.1%), Science (85.6% vs 76.4%), and Geography
(92.4% vs 86.2%).
There were some differences in the percentages of male and female urban students
taking particular subjects (Table 4.6). Home Economics was the subject in which the
male-female disparity was greatest among former students of Breaking the Cycle schools,
with 65.2% of female students taking this subject compared with only 18.4% of males.
Other subjects with a greater proportion of female candidates were Art, Craft and Design
(42.5% of females vs 33.3% of males), and Music (17.3% vs 11.3%). Conversely, male
students from urban schools took Science with much greater frequency than did females
(90.7% and 62.5%). Other subjects which showed large discrepancies favouring males
were Materials Technology (30.2% of males vs 14.8% of females) and Technical
Graphics (20.9% of males vs 5.6% of females). Since the latter two subject areas could
be thought of as traditionally male-typed areas, and Home Economics as a female-typed
subject area, the observed gender differences are not unexpected.
Gender differences in subject choice were also observed in the national sample of
JCE candidates, and the observed differences mirror largely those found among urban
students (Table 4.7). Home Economics (which is the subject associated with the largest
gender difference among students nationally), was taken by 60.7% of female students and
by only 7.7% of male students. However, this difference of 53.0% is larger than that
observed in our sample, where the difference between the percentage of males and the
percentage of females taking Home Economics is 46.8%. In male-typed subject areas in
which the percentage of male candidates outnumbers that of females (such as Technical
Graphics and Materials Technology), the gender differences in subject uptake are not as
large among urban students as in the national population. This may suggest that urban
students are less susceptible to choosing gender-typed subjects in the JCE than are
students nationally. However, as mentioned earlier, it may equally reflect the choices
available to students in different types of schools.
23

Table 4.6. Numbers and percentages of urban male and female students from Breaking the Cycle schools taking various subjects in the 1997 JCE.
Male (N=354)
Female (N=365)
Total number
Number % Number %
English 349 98.6% 363 99.5% 712
Mathematics 349 98.6% 361 98.9% 710
Geography 305 96.2% 315 86.3% 620
Irish 329 92.9% 352 96.4% 681
History 321 91.0% 322 88.2% 643
Science 321 90.7% 228 62.5% 549
French 202 57.1% 224 61.4% 426
Business Studies 183 51.7% 213 58.4% 396
Materials technology 107 30.2% 54 14.8% 161
Art, Craft, Design 118 33.3% 155 42.5% 273
Technical graphics 74 20.9% 20 5.6% 94
Home Economics 65 18.4% 238 65.2% 303
Metalwork 64 18.1% 19 5.2% 189
German 46 13.0% 52 14.2% 98
Music 40 11.3% 63 17.3% 103
Technology 13 3.7% 10 2.7% 23
Spanish 5 1.4% 23 6.3% 28
Environmental & Social Studies 20 5.6% 21 5.8% 41
Italian 3 0.8% - - 3
Typewriting 3 0.8% 19 5.2% 22
Classical Studies - - 8 2.2% 8
Science (local) - - - - -
Latin - - - - -
ESP – History - - - - -
ESP – Geography - - - - -
History -Syllabus 2 - - - - -
Geography- Syllabus 2 - - - - -
Hebrew - - - - -
Greek - - - - -
24

Table 4.7. Numbers and percentages of all male and female students nationally taking various subjects in the 1997 JCE.
Male (N=33,081)
Female (N=32,676)
Total number
Number % Number %
Irish 31,578 95.5% 31,749 97.2% 63,327
English 32,922 99.5% 32,524 99.5% 65,446
Mathematics 32,920 99.5% 32,502 99.5% 65,422
Geography 29,959 90.6% 30,768 94.2% 60,727
History 29,706 89.8% 30,672 93.9% 60,378
Science 29,688 89.7% 26,619 81.5% 56,307
French 21,415 64.7% 25,691 78.6% 47,106
Business Studies 19,690 59.5% 24,259 74.2% 43,949
Technical graphics 15,596 47.1% 1,753 5.4% 17,349
Materials Technology 14,555 44.0% 1,665 5.1% 16,220
Art, Craft, Design 9,375 28.3% 13,918 42.6% 23,293
Metalwork 8,539 25.8% 560 1.7% 9,099
German 7,215 21.8% 8,950 27.4% 16,165
Home Economics 2,533 7.7% 19,835 60.7% 22,368
Technology 2,451 7.4% 958 2.9% 3,409
Music 1,916 5.8% 6,871 21.0% 8,787
Science (local) 1,145 3.5% 812 2.5% 1,957
Spanish 854 2.6% 1,120 3.4% 1,974
Latin 455 1.4% 256 0.8% 711
Environmental & Social Studies 376 1.1% 272 0.8% 648
Classical Studies 368 1.1% 235 0.7% 603
Typewriting 92 0.3% 633 1.9% 725
Italian 89 0.3% 153 0.5% 242
Greek 30 0.1% - - 30
ESP – Geography 13 0.0% 25 0.0% 38
Hebrew 3 0.0% 1 0.0% 4
ESP – History - - - - -
History -Syllabus 2 - - - - -
Geography -Syllabus 2 - - - - -
25

4.3 LEVEL OF EXAMINATION SUBJECTS TAKEN
While the aggregate achievements of former students of schools now in the Breaking the
Cycle scheme and students nationally in each subject area will be described later in this
section, performance according to the percentage of students taking examination papers at
various levels will be considered first.
In all subject areas in the JCE, papers may be taken at either Ordinary or Higher
Level. It is possible to take English, Irish and Mathematics at three levels: Foundation,
Ordinary, and Higher. The Foundation Level option is intended to cater for students who
are seeking a basic qualification in a subject area. Table 4.8 and Figure 4.2 show that in
the case of English, Irish and Mathematics, the percentages of Breaking the Cycle students
taking Foundation Level papers was much higher than among students nationally. This
was particularly true in the case of Mathematics, with more than one-third of all students in
our sample taking Mathematics at Foundation Level.
Table 4.8. Numbers and percentages of urban students from Breaking the Cycle schools and all students nationally taking English, Irish and Mathematics at Foundation Level in the 1997 JCE.
Urban students (N=719)
All students nationally (N=65,758)
Number % Number %
Irish 225 31.3% 5,940 9.0%
English 107 14.9% 2,200 3.3%
Mathematics 273 38.0% 8,134 12.4%
Figure 4.2. Percentage of urban students and all students nationally taking Irish, English and Mathematics at Foundation level in the 1997 JCE.
0
5
10
15
20
25
30
35
40
Irish English Mathematics
Perc
enta
ge
Urban All
26

When the proportions of students in our sample taking papers at Foundation
Level is examined according to student gender (Table 4.9), indications are that about the
same proportion of males as females took Irish and English at Foundation Level, while
proportionately more females than males took Foundation Level Mathematics (43.8% of
females and 31.9% of males respectively). It is noteworthy that the uptake of
Foundation Level Mathematics is four times as high among female students in our
sample as it is among female students in the national population (Table 4.10). Further,
the direction of the gender difference in the uptake of Mathematics at Foundation Level
contrasts with that found in the national population, where a greater proportion of males
took Mathematics at Foundation Level. Furthermore, more than twice as many males as
females in the national population took Foundation Level Irish and English, while there
were only slight gender differences in uptake of these subjects among urban students. It
seems, therefore, that female students who originated in Breaking the Cycle schools
have higher than expected rates of uptake of subjects at Foundation Level compared to
females nationally.
Table 4.9. Numbers and percentages of male and female urban students from Breaking the Cycle schools taking English, Irish and Mathematics at Foundation Level in the 1997 JCE (N=719).
Males (N=354)
Females (N=365)
Total number
Number % Number % Irish 107 30.2% 118 33.5% 225 English 56 15.8% 51 14.0% 107 Mathematics 113 31.9% 160 43.8% 273
Table 4.10. Numbers and percentages of male and female students nationally taking English, Irish and Mathematics at Foundation Level in the 1997 JCE (N=65,757).
Males (N=33,081)
Females (N=32,676)
Total number
Number % Number % Irish 4,058 12.3% 1,882 5.8% 5,940 English 1,531 4.6% 669 2.1% 2,200 Mathematics 4,657 14.1% 3,477 10.6% 8,134
27

There are also differences between students in the urban cohort and students
nationally in the percentages taking examination subjects at Ordinary Level (Table
4.11 and Figure 4.3).
Table 4.11. Numbers and percentages of urban students from Breaking the Cycle schools and all students nationally taking various subjects at Ordinary Level in the 1997 JCE.
Urban students (N=719)
All students nationally (N=65,758)
Number % Number % Irish 389 54.1% 31,645 48.1% English 422 58.7% 23,136 35.2% History 377 52.4% 16,121 24.5% Geography 348 48.8% 13,394 20.4% Mathematics 345 48.0% 33,779 51.4% Science 332 46.2% 18,411 28.0% French 269 37.4% 14,172 21.6% Business Studies 225 31.3% 13,216 20.1% Art, Craft, Design 195 27.1% 10,075 15.3% Home Economics 194 27.0% 4,788 7.3% Materials technology 121 16.8% 5,472 8.3% Technical graphics 73 10.2% 8,218 12.5% Metalwork 42 5.8% 3,119 4.7% German 38 5.3% 3,274 5.0% Music 36 5.0% 1,726 2.6% Environmental & Social Studies 30 4.2% 479 0.7% Typewriting 20 2.8% 458 0.7% Technology 16 2.2% 947 1.4% Spanish 11 1.5% 538 0.8% Classical Studies 5 0.4% 84 0.1% Italian 2 0.3% 84 0.1% Science (local) - - 1,247 1.9% Latin - - 59 0.1% ESP – History - - - - ESP – Geography - - 1 0.0% History -Syllabus 2 - - - - Geography- Syllabus 2 - - - - Hebrew - - 1 0.0% Greek - - 2 0.0%
With the exception of Mathematics (in which a very high proportion of urban
students took Foundation Level papers), greater percentages of former students of
Breaking the Cycle schools took papers at Ordinary Level than did students nationally
in the most popular subject areas (i.e., in Irish, English, History, Geography, Science,
28

French, Business Studies, Art, Craft, and Design, Home Economics and Materials
Technology). The difference in the percentages of students in both groups taking
Ordinary Level papers ranges from 28.4% more urban students taking Ordinary Level
Geography to 8.5% more taking Materials Technology at Ordinary Level.
Figure 4.3. Percentages of urban students from Breaking the Cycle schools and all students nationally taking various subjects at Ordinary Level in the 1997 JCE (with the exception of Classical Studies, Italian, Science (local), ESP- Geography, Latin, Hebrew and Greek, which were all taken by less than 0.5% of urban students).
Table 4.12 shows the numbers and percentages of male and female urban
students who took papers at Ordinary Level in the 1997 JCE. Proportionately more
male than female students took Ordinary Level Mathematics, Science, Materials
010
2030
4050
607
Irish
Engl
ish
His
tory
Geo
grap
hy
Mat
hem
atic
s
Sci
ence
Fren
ch
Bus
ines
s S
tds
Art,
Cra
ft, D
esig
n
Hom
e E
c
Mat
eria
ls te
ch
Tech
gra
phic
s
Met
alw
ork
Ger
man
Mus
ic
E &
S S
tudi
es
Type
writ
ing
Tech
nolo
gy
Span
ish
Perc
enta
ge
Urban All
0
29

Technology, and Technical Graphics, while proportionately more female students took
English, History, Geography, French, Business Studies, Art, Craft and Design, and
Home Economics at Ordinary Level.
Table 4.12. Numbers and percentages of male and female students from urban Breaking the Cycle schools taking various subjects at Ordinary Level in the 1997 JCE (N=719).
Males (N=354)
Females (N=365)
Number % Number %
Total number
English 194 54.8% 228 62.5% 422 Irish 191 54.0% 198 54.2% 389 History 175 49.4% 202 55.3% 377 Mathematics 182 51.4% 163 45.2% 345 Geography 156 44.1% 192 52.6% 348 Science 196 55.4% 136 37.3% 332 French 122 34.5% 147 40.3% 269 Business Studies 104 29.4% 121 33.2% 225 Art, Craft, Design 76 21.5% 119 32.6% 195 Home Economics 47 13.3% 147 40.3% 194 Materials technology 82 23.2% 39 10.7% 121 Technical graphics 58 16.4% 15 4.1% 73 Metalwork 34 9.6% 8 2.2% 42 Music 4 1.1% 32 8.8% 36 German 19 5.4% 19 5.2% 38 Environmental & Social Studies 14 4.0% 16 4.4% 30 Typewriting 3 0.8% 17 4.7% 20 Technology 6 1.7% 10 2.7% 16 Spanish 5 1.4% 6 1.6% 11 Classical Studies - - 5 1.4% 5 Italian 2 0.6% - - 2 ESP – History - - - - - ESP – Geography - - - - - History -Syllabus 2 - - - - - Geography -Syllabus 2 - - - - - Hebrew - - - - - Latin - - - - - Science (local) - - - - - Greek - - - - -
Among students nationally (with the exception of Mathematics), proportionately
fewer female students than males took Ordinary Level papers in the more popular
subject areas (Table 4.13). This contrasts somewhat with the pattern of subject uptake
among male and female urban students, among whom, at Ordinary Level, the most
30

popular subjects were taken by greater percentages of female students. However, there
is some commonality between the two student groups: in both groups, gender
differences in subject uptake at Ordinary Level are in the same direction for Science,
Business Studies, Art, Craft and Design, Home Economics, and Materials Technology.
Table 4.13. Numbers and percentages of male and female students nationally taking various subjects at Ordinary Level in the 1997 JCE (N=65,757).
Males (N=33,081)
Females (N=32,676)
Number % Number %
Total Number
Mathematics 16,716 50.5% 17,062 52.2% 33,778 Irish 16,991 51.4% 14,653 44.8% 31,644 English 13,609 41.1% 9,527 29.2% 23,136 Science 11,073 33.5% 7,338 22.5% 18,411 History 8,563 25.9% 7,558 23.1% 16,121 French 7,819 23.6% 6,353 19.4% 14,172 Geography 7,054 21.3% 6,340 19.4% 13,394 Business Studies 6,307 19.1% 6,909 21.1% 13,216 Art, Craft, Design 4,593 13.8% 5,482 16.8% 10,075 Technical graphics 7,298 22.1% 920 2.8% 8,218 Materials technology 4,680 14.1% 792 2.4% 5,472 Home Economics 1,272 3.8% 3,516 10.8% 4,788 German 1,933 5.8% 1,341 4.1% 3,274 Metalwork 2,850 8.6% 269 0.8% 3,119 Music 553 1.7% 1,173 3.6% 1,726 Science (local) 812 2.5% 435 1.3% 1,247 Technology 608 1.8% 339 1.0% 947 Spanish 314 0.9% 224 0.7% 538 Environmental & Social Studies 286 0.9% 193 0.6% 479 Typewriting 61 0.2% 397 1.2% 458 Classical Studies 41 0.1% 43 0.1% 84 Italian 44 0.1% 40 0.1% 84 Latin 30 0.1% 29 0.1% 59 Greek 2 0.0% - - 2 ESP – Geography 1 0.0% - - 1 Hebrew 1 0.0% - - 1 ESP – History - - - - - History -Syllabus 2 - - - - - Geography- Syllabus 2 - - - - -
As Table 4.14 and Figure 4.4 show, in the 15 most popular subject areas, fewer
urban students than students nationally took Higher Level papers. The largest
discrepancy arose in the area of English, where 61% of candidates nationally took the
Higher Level paper, while only 25.5% of candidates in our sample did so. Other
31

subjects which showed large discrepancies were Geography (in which 72% of
candidates nationally took the Higher paper compared with 37.8% of urban students),
History, (67.3% vs 37%), Irish (39.1% vs 9.3%), and French (50.1% vs 21.8%).
Table 4.14. Numbers and percentages of urban students from Breaking the Cycle schools and all students nationally taking various subjects at Higher Level in the 1997 JCE.
Urban students (N=719)
All students nationally (N=65,758)
Number % Number % Geography 272 37.8% 47,334 72.0% History 266 37.0% 44,258 67.3% Science 217 30.2% 37,897 57.6% English 183 25.5% 40,111 61.0% Business Studies 171 23.8% 30,734 46.7% French 157 21.8% 32,935 50.1% Home Economics 109 15.2% 17,581 26.7% Mathematics 92 12.8% 23,510 35.8% Art, Craft, Design 78 10.8% 13,218 20.1% Irish 67 9.3% 25,743 39.1% Music 67 9.3% 7,061 10.7% German 60 8.3% 12,891 19.6% Metalwork 41 5.7% 5,980 9.1% Materials technology 40 5.6% 10,748 16.3% Technical graphics 21 2.9% 9,131 13.9% Spanish 17 2.4% 1,436 2.1% Environmental & Social Studies 11 1.5% 169 0.3% Technology 7 1.0% 2,462 3.7% Classical Studies 3 0.4% 519 0.8% Typewriting 2 0.3% 267 0.4% Italian 1 0.1% 158 0.2% Science (local) - - 710 1.1% Latin - - 652 1.0% ESP- Geography - - 37 0.0% Greek - - 28 0.0% Hebrew - - 3 0.0% History -Syllabus 2 - - - - Geography- Syllabus 2 - - - - ESP- History - - - -
32

Figure 4.4. Percentages of urban students from Breaking the Cycle schools and all students nationally taking various subjects at Higher Level in the 1997 JCE (with the exception of Classical Studies, Typewriting, Italian, Science (local), ESP- Geography, Greek and Hebrew, which were all taken by less than 0.5% of urban students).
0
10
20
30
40
50
60
70
80
Geo
grap
hy
His
tory
Scie
nce
Engl
ish
Bus
ines
s S
tds
Fren
ch
Hom
e E
c
Mat
hem
atic
s
Art,
Cra
ft, D
esig
n
Irish
Mus
ic
Ger
man
Met
alw
ork
Mat
eria
ls te
ch
Tech
gra
phic
s
Span
ish
E &
S St
udie
s
Tech
nolo
gy
Perc
enta
ge
Urban All
Table 4.15 shows that more male than female students in the urban cohort took
Higher Level papers in the most popular subject areas. Exceptions to this were Business
Studies, Irish, German, and the more traditionally female-oriented area of Home
Economics. This contrasts with the picture nationally, where greater proportions of
female students than males took Higher papers in all of the most popular subject areas
(Table 4.16).
33

Table 4.15. Numbers and percentages of urban male and female students from Breaking the Cycle schools taking various subjects at Higher Level in the 1997 JCE (N=719).
Males (N=354)
Females (N=365)
Total Number
Number % Number % Geography 149 42.1% 123 33.7% 272 History 146 41.2% 120 32.9% 266 Science 125 35.3% 92 25.2% 217 English 99 28.0% 84 23.0% 183 Business Studies 79 22.3% 92 25.5% 171 French 80 22.6% 77 21.1% 157 Home Economics 18 5.1% 91 25.0% 109 Mathematics 54 15.3% 38 10.4% 92 Art, Craft, Design 42 11.9% 36 9.9% 78 Irish 31 8.8% 36 9.9% 67 Music 36 10.2% 31 8.5% 67 German 27 7.6% 33 9.0% 60 Metalwork 30 8.5% 11 3.0% 41 Materials technology 25 7.1% 15 4.1% 40 Technical graphics 16 4.5% 5 1.4% 21 Spanish - - 17 4.7% 17 Environmental & Social Studies 6 1.7% 5 1.4% 11 Technology 7 2.0% - - 7 Classical Studies - - 3 0.8% 3 Typewriting - - 2 0.5% 2 Italian 1 0.0% - - 1 Latin - - - - - Science (local) - - - - - ESP – History - - - - - ESP – Geography - - - - - History -Syllabus 2 - - - - - Geography- Syllabus 2 - - - - - Hebrew - - - - - Greek - - - - -
34

Table 4.16. Numbers and percentages of all male and female students nationally taking various subjects at Higher Level in the 1997 JCE (N=65,757).
Males (N=33,081)
Females (N=32,676)
Total number
Number % Number % Geography 22,905 69.2% 24,428 74.8% 47,333 History 21,143 63.9% 23,114 70.7% 44,257 English 17,782 53.8% 22,328 68.3% 40,110 Science 18,615 56.3% 19,281 59.0% 37,896 French 13,596 41.1% 19,338 59.2% 32,934 Business Studies 13,383 40.5% 17,350 53.1% 30,733 Irish 10,529 31.8% 15,214 46.6% 25,743 Mathematics 11,547 34.9% 11,963 36.6% 23,510 Home Economics 1,261 3.8% 16,319 49.9% 17,580 Art, Craft, Design 4,782 14.5% 8,436 25.8% 13,218 German 5,282 16.0% 7,609 23.3% 12,891 Materials technology 9,875 29.9% 873 2.7% 10,748 Technical graphics 8,298 25.1% 833 2.5% 9,131 Music 1,363 4.1% 5,698 17.4% 7,061 Metalwork 5,689 17.2% 291 0.9% 5,980 Technology 1,843 5.6% 619 1.9% 2,462 Spanish 540 1.6% 896 2.7 1,436 Science (local) 333 1.0% 377 1.2% 710 Latin 425 1.3% 227 0.7% 652 Classical Studies 327 1.0% 192 0.6% 519 Typewriting 31 0.1% 236 0.7% 267 Environmental & Social Studies 90 0.3% 79 0.2% 169 Italian 45 0.1% 113 0.3% 158 ESP – Geography 12 0.0% 25 0.1% 37 Greek 28 0.1% - - 28 Hebrew 2 0.0% 1 0.0% 3 ESP – History - - - - - History -Syllabus 2 - - - - - Geography- Syllabus 2 - - - - -
35

4.4 OVERALL PERFORMANCE IN THE JUNIOR CERTIFICATE EXAMINATION
In this section, student performance is sometimes described using an overall performance
scale (OPS) which has been adopted directly from that used by Kellaghan and Dwan
(1995) in their analysis of the 1994 Junior Certificate results. The OPS scale involves the
allocation of numerical values to the alphabetical grades awarded to candidates, which
when summed, produce an index of a candidate’s general scholastic achievement (Table
4.17). The OPS score is based on a student’s performance in the seven subjects in which
he or she performed best. The maximum possible OPS score is 84 (which is achieved by
a student who is awarded seven “A” grades on Higher Level papers), while the lowest
possible OPS score is 0 (where a student fails to achieve at least a grade “F” on any of
his/her best seven papers).
In the practical application of the scale, a student with an OPS score of 56 may
have achieved seven “E” grades on Higher Level papers, or seven “B” grades on
Ordinary Level papers. It should be noted that in the allocation of weights assigned to
grades, it is assumed, for example, that the difference between an “A” and a “B” grade on
a Higher Level paper is the same as the difference between an “A” and “B” grade on an
Ordinary Level (or Foundation Level) paper. Another assumption is that an “A” grade on
a Higher Level paper (which attracts a score of 12) is 12 times as meritorious as an “F”
grade on a Foundation Level paper (which attracts a score of 1). Furthermore, all
subjects are treated as equivalent, whereas, in reality, it may be more difficult to achieve
a high grade in some subject areas than in others. In spite these considerations, the OPS
score may be taken as a useful broad measure of a candidate’s achievements in the JCE.
Table 4.17. Overall performance scale (OPS) scores corresponding to grade categories at each examination level.
Higher Ordinary Foundation OPS score A 12 B 11 C 10 D A 9 E B 8 F C 7 D A 6 E B 5 F C 4 D 3 E 2 F 1
36

Of the 719 former students of Breaking the Cycle schools who sat the JCE in
1997, 687 (95.5%) sat seven subjects or more. Thus, it was possible to compute OPS
scores1 for this group of students to compare their achievements with those of candidates
nationally. Table 4.18 shows that there is a considerable difference in the overall mean
achievement in the 1997 JCE of students who originated in urban schools that are now
participating in Breaking the Cycle and students in the national population. The former,
as a group, performed more poorly in the JCE (mean OPS=53.7) than did students in the
national population (mean OPS=65.3). When expressed in terms of grades achieved in
the JCE, the mean OPS score achieved by students nationally could be described as
slightly better than an average of seven “D” grades on Higher Level papers, or seven “A”
grades on Ordinary Level papers (as both of these outcomes in the JCE would attract an
OPS score of 63). In reality, of course, the OPS score of students in the urban cohort and
students nationally is derived from a range of grades achieved at Foundation, Ordinary
and Higher Levels. In the urban cohort, the mean OPS score achieved by the students
could be described as an average of seven “E” grades on Higher papers or seven “B”
grades on Ordinary Level papers, as both of these patterns of results would attract an OPS
score of 56. In fact, the achievements of the students are slightly lower than this, as their
mean OPS is 53.7.
Table 4.18. Mean OPS score achieved by students from urban Breaking the Cycle schools and by all students nationally in the 1997 JCE.
Group Mean OPS score
Urban Breaking the Cycle students (N=687) 53.7 (11.8)
All students nationally (N=64,756) 65.3 (11.4)
Table 4.19 shows that, among the national population of students, females
achieved higher mean OPS scores than did males. However, there is no discernible
difference between the mean OPS scores achieved by males and females who had
attended Breaking the Cycle schools.
1 Where descriptions of student performance involve OPS scores, the analyses are based on data from students with at least seven subjects in the 1997 JCE. Descriptions of performance which do not involve OPS scores are based on the total sample (N=719).
37

Table 4.19. Mean OPS score achieved by male and female students from urban Breaking the Cycle schools and by male and female students nationally in the 1997 JCE.
Urban students (N=687) All students nationally (N=64,755)
Males (N=335) Females (N=352) Males (N=32,475) Females (N=32,280)
53.6 (11.8) 53.9 (11.9) 63.7 (11.6) 66.9 (11.0)
Student achievement also differs on the basis of school type: a examination of
Tables 4.20 and 4.21 shows that, in the case of both urban students and students
nationally, students in Secondary schools outperformed students in other school types in
the 1997 JCE. It is clear from Tables 4.20 and 4.21 that female students enrolled in
Secondary schools achieved the highest mean OPS scores, both among the national
population and among the sample of students from Breaking the Cycle schools.
Table 4.20. Mean OPS score in the 1997 JCE achieved by students from urban Breaking the Cycle schools according to school type and gender (N=687).
Mean OPS score
Type of school Males Females Total
Secondary 56.3 (12.0) (n=178) 56.4 (13.1) (n=182) 56.4 (12.6) (n=360)
Vocational 50.3 (9.9) (n=88) 51.9 (9.2) (n=107) 51.2 (9.5) (n=195)
Comprehensive 54.9 (12.0) (n=27) 45.3 (8.8) (n=15) 51.5 (11.8) (n=42)
Community 48.2 (13.6) (n=42) 51.4 (10.5) (n=48) 49.9 (10.9) (n=90)
53.6 (11.8) (n=335) 53.9 (11.9) (n=352) 53.7 (11.8) (N=687)
Table 4.21. Mean OPS score in the 1997 JCE achieved by students nationally according to school type and gender (N=64,755).
Mean OPS score
Type of school Males Females Total
Secondary 66.1 (10.9) (n=18,652) 68.3 (10.4) (n=22,381) 67.3 (10.7) (n=41,033)
Vocational 59.3 (11.7) (n=8,524) 62.5 (11.9) (n=5,471) 60.5 (11.9) (n=13,995)
Comprehensive 65.0 (10.8) (n=795) 66.0 (10.9) (n=766) 65.5 (10.9) (n=1,561)
Community 62.0 (11.7) (n=4,504) 65.2 (11.2) (n=3,662) 63.5 (11.6) (n=8,166)
63.7 (11.6) (n=32,475) 66.9 (11.0) (n=32,280) 65.3 (11.4) (N=64,755)
As it was deemed pertinent to the current study, performance in the JCE was
also examined on the basis of whether the post-primary school attended by students had
been designated as disadvantaged. Table 4.22 shows the mean OPS scores of urban
38

students from Breaking the Cycle schools according to whether or not they were
enrolled in schools that were designated as disadvantaged. For comparison purposes,
the performance of the national population is also examined according to disadvantaged
status of the school attended (Table 4.23).
Table 4.22. Performance of students from urban Breaking the Cycle schools in the 1997 JCE, according to whether they attended post-primary schools that were, or were not, designated as disadvantaged (N=687).
Designated status Disadvantaged
(N=604) Non-disadvantaged
(N=83) Mean overall performance score (OPS) 53.4 (11.6) 56.2 (12.9) Mean no. of subjects taken 8.4 (0.7) 8.7 (0.7) Mean no. of subjects taken at Ordinary level 5.0 (2.4) 4.8 (2.7) Mean no. of subjects taken at Higher level 2.6 (3.0) 3.4 (3.3) Mean no. of subjects taken at Foundation level 0.8 (1.1) 0.6 (0.9)
Table 4.23. Performance of students nationally in the 1997 JCE, according to whether they attended post-primary schools that were, or were not, designated as disadvantaged (N=64,755).
Designated status Disadvantaged
(N=16,547) Non-disadvantaged
(N=48,208) Mean overall performance score (OPS) 60.6 (12.1) 66.9 (10.7) Mean no. of subjects taken 8.8 (0.8) 9.0 (0.7) Mean no. of subjects taken at Ordinary level 4.0 (2.7) 2.8 (2.7) Mean no. of subjects taken at Higher level 4.4 (3.3) 6.1 (3.2) Mean no. of subjects taken at Foundation level 0.4 (0.9) 0.2 (0.5)
As Tables 4.22 and 4.23 show, at the time of taking the JCE, almost one student in
nine (87.9%) in the urban cohort was enrolled in a post-primary school that was designated
as disadvantaged. In contrast, only 25.6% of students nationally were enrolled in schools
which were thus designated. Furthermore, there are differences in the characteristics of
candidates depending on whether or not they were enrolled in schools that were designated
as disadvantaged. Among both the urban cohort and the national population of candidates,
students in designated schools achieved lower mean OPS scores than did students in non-
designated schools. The extent of the difference between the mean OPS score of
disadvantaged and non-disadvantaged students was, however, greater among the national
population (60.6 vs 66.9 respectively) than it was among the Breaking the Cycle sample
(53.4 vs 56.2 respectively). Students in designated and non-designated schools also
39

differed on other characteristics: students in schools that were designated as disadvantaged,
on average, took fewer subjects in the JCE than did their non-disadvantaged counterparts.
Furthermore, students enrolled in designated schools took a greater number of subjects at
Foundation and Ordinary Level, and fewer subjects at Higher Level than did students in
non-designated schools (see also Figure 4.5). However, it should be noted that, because
the numbers of students in the urban cohort that were enrolled in non-designated post-
primary schools are very small (N=83), conclusions drawn about their performance are, at
best, tentatative.
Figure 4.5. Mean number of subjects taken at Ordinary, Higher, and Foundation Level and all levels in the 1997 JCE by students from urban Breaking the Cycle schools, according to whether they were enrolled in schools that were, or were not, designated as disadvantaged.
0
1
2
3
4
5
6
7
8
9
10
All Levels O rdinary subjects H igher subjects Foundation subjects
Mea
n no
of s
ubje
cts t
aken
DisadvNon-disadv
Table 4.24 summarizes the performance of urban students in both designated
and non-designated post-primary schools, according to student gender. However, as
already stated, the numbers of students in the urban cohort that were enrolled in non-
designated post-primary schools are very small, and further subdividing them by gender
reduces the numbers involved in any comparisons even further. This makes it difficult
to compare the performance of male and female students within schools that were
designated as disadvantaged and those that were not. However, it is possible to
compare the performance of males and females in the Breaking the Cycle cohort who
were enrolled in disadvantaged post-primary schools at the time of taking the JCE.
Table 4.24 shows that females performed at about the same level as did males. This is
at odds with the national pattern, where in designated (and non-designated) schools,
female students outperformed males (Table 4.25).
40

Table 4.24. Performance of male and female students from urban Breaking the Cycle schools in the 1997 JCE, according to whether they attended post-primary schools that were, or were not, designated disadvantaged (N=687).
Disadvantaged
(N=604) Non-disadvantaged
(N=83)
Males (N=286)
Females (N=318)
Males (N=49)
Females (N=34)
Mean overall performance score (OPS) 53.3 (11.6) 53.5 (11.7) 55.4 (12.7) 57.4 (13.2)
Mean number of subjects taken 8.4 (0.7) 8.5 (0.7) 8.7 (0.6) 8.8 (0.8)
Mean number of subjects taken at Ordinary level 4.8 (2.4) 5.1 (2.4) 4.7 (2.6) 5.0 (2.8)
Mean number of subjects taken at Higher level 2.8 (3.0) 2.5 (3.0) 3.5 (3.3) 3.2 (3.4)
Mean number of subjects taken at Foundation level 0.8 (1.1) 0.9 (1.1) 0.5 (0.8) 0.6 (1.0)
Table 4.25. Performance of male and female students nationally the 1997 JCE, according to whether they attended post-primary schools that were, or were not, designated disadvantaged (N=64,755).
Disadvantaged
(N=16,547) Non-disadvantaged
(N=48,208)
Males (N=7,974)
Females (N=8,573)
Males (N=24,501)
Females (N=23,707)
Mean overall performance score (OPS) 58.6 (12.0) 62.4 (11.0) 65.4 (10.9) 68.5 (10.1)
Mean number of subjects taken 8.8 (0.8) 8.8 (0.8) 9.0 (0.7) 9.1 (0.7)
Mean number of subjects taken at Ordinary level 4.4 (2.6) 3.6 (2.7) 3.1 (2.8) 2.5 (2.7)
Mean number of subjects taken at Higher level 3.8 (3.2) 4.8 (3.4) 5.7 (3.2) 6.5 (3.0)
Mean number of subjects taken at Foundation level 0.6 (0.9) 0.3 (0.7) 0.2 (0.6) 0.1 (0.4)
4.5 STUDENTS’ ACHIEVEMENTS IN INDIVIDUAL SUBJECTS.
The achievements of former students of Breaking the Cycle schools in individual
subject areas are described in this section. In the same way that an overall OPS score
can be computed for the best seven subjects taken by a student in the JCE, an OPS score
is available for each student in every subject area. The individual subject OPS is
computed by assigning the numerical value specified in Table 4.17 to the grade
41

achieved by the student in an individual paper (for example, a “C” grade on a Higher
paper attracts an OPS score of 10). The individual OPS scores can then be aggregated
to produce an overall index of achievement in a given subject area for students in the
urban cohort and for the national population. The mean OPS of urban pupils in English
is considerably lower than that of students nationally (Table 4.26).
Table 4.26. Mean OPS score of urban students from Breaking the Cycle schools and of students nationally in English in the 1997 JCE.
Subject Urban students All students nationally
English 7.3 (2.0) (N=712)
8.75 (1.8) (N=65,447)
An OPS score of 8.75 (which describes the achievements of students nationally
in Table 4.26) represents an average of a “D” grade on the Higher Level English paper,
or an “A” grade on an Ordinary Level paper. Students in the urban cohort achieved a
lower mean OPS of 7.3, which may be thought of as an average of an “F” grade on a
Higher Level paper, or a “C” grade on an Ordinary Level paper. While the average
OPS score serves as a useful general indicator of student achievement, it is also of
interest to examine student achievement by looking at the precise derivation of the OPS
score. This may be done by examining the percentage of students from Breaking the
Cycle schools and the percentage of students nationally who were awarded various
grades at Foundation, Ordinary and Higher Levels. Tables 4.27 to 4.29 show the
percentage of students in the two groups who were awarded each of the seven available
grades at Foundation, Ordinary and Higher Levels in the JCE in English in 1997.
As may be seen from Table 4.27, the spread of grades in Foundation Level
English is greater among the national population of students than among students in the
urban cohort. Also, proportionately fewer students in the latter cohort achieved high
grades (“A”s and “B”s) and proportionately more students achieved low grades (“D”s
and “E”s) in Foundation Level English than did students nationally. At Ordinary Level,
the achievements of urban students were only slightly below those of students
nationally, although, again, there was a tendency for them to achieve slightly fewer high
grades and slightly more low grades (Table 4.28). At Higher Level, students in the
national population of candidates were awarded more “A”, “B” and “C” grades and
fewer “D” and “E” grades than were their counterparts in the urban cohort (Table 4.29).
It should be also be remembered that a much smaller proportion of students in the urban
42

cohort took English at Higher Level (25.5% of all candidates) than did students
nationally (61% of all candidates). If it is the case that only the most able of the urban
students took English at Higher Level, then their achievements relative to candidates
nationally appear fairly weak.
Table 4.27. Foundation Level English results, by grade, for all students nationally and for urban students from Breaking the Cycle schools in the 1997 JCE.
% A % B % C % D % E % F % NG
Students nationally (N=2,200)
7.9% 32.5% 35.4% 18.0% 3.5% 2.1% 0.5%
Urban Breaking the Cycle students (N=107) 4.4% 16.4% 33.9% 38.8% 6.6% - -
Table 4.28. Ordinary Level English results, by grade, for all students nationally and for urban students from Breaking the Cycle schools in the 1997 JCE.
% A % B % C % D % E % F % NG
Students nationally (N=23,136) 6.3% 25.7% 43.8% 21.9% 2.1% 0.2% -
Urban Breaking the Cycle students (N=422) 6.2% 22.3% 42.9% 26.5% 2.1% - -
Table 4.29. Higher Level English results, by grade, for all students nationally and for urban students from Breaking the Cycle schools in the 1997 JCE.
% A % B % C % D % E % F % NG
Students nationally (N=40,111) 5.1% 21.0% 41.1% 29.7% 2.9% 0.2% -
Urban Breaking the Cycle students (N=183) 4.4% 16.4% 33.9% 38.8% 6.6% - -
In the subject area of Irish, students in the national population clearly
outperformed students in the urban cohort (Table 4.30). The mean OPS score achieved
by students nationally corresponds most closely to an “E” grade on a Higher Level
paper or a “B” grade on an Ordinary Level paper. However, the mean OPS achieved by
students in our sample corresponds to slightly less than a “D” grade on an Ordinary
Level paper or to an “A” grade on a Foundation level paper. The respective mean OPS
scores achieved both by students in our sample and by students nationally also indicate
43
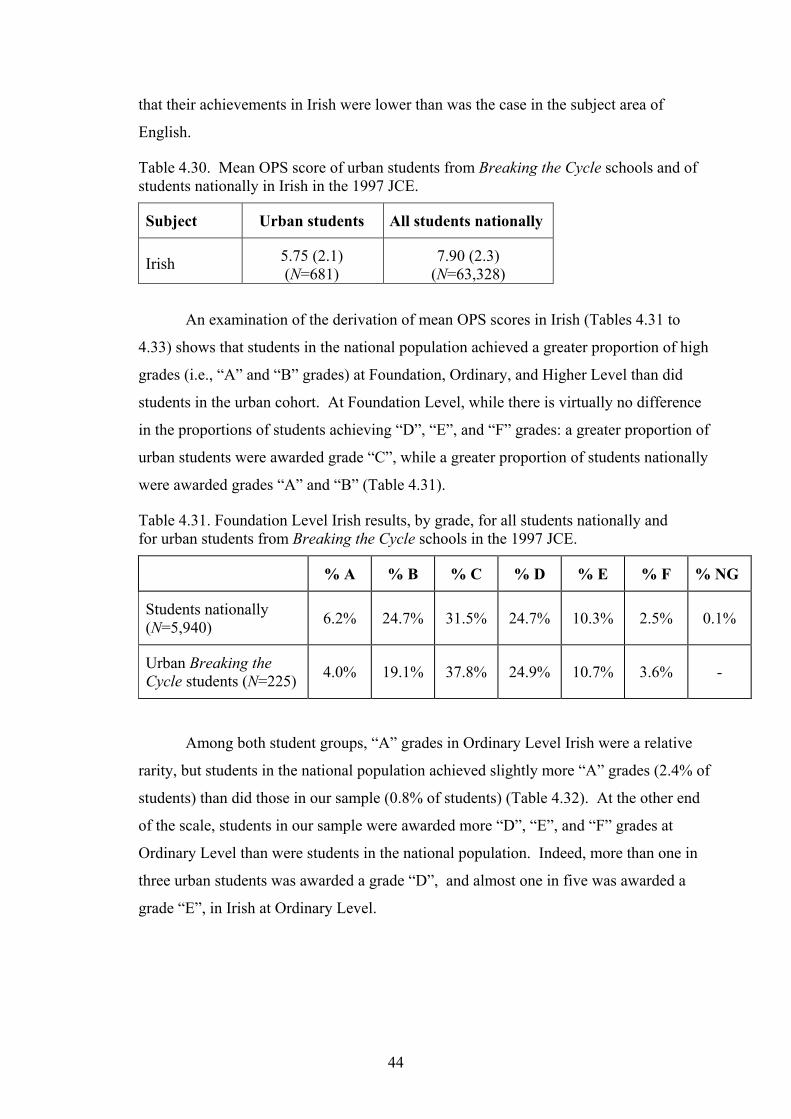
that their achievements in Irish were lower than was the case in the subject area of
English.
Table 4.30. Mean OPS score of urban students from Breaking the Cycle schools and of students nationally in Irish in the 1997 JCE.
Subject Urban students All students nationally
Irish 5.75 (2.1) (N=681)
7.90 (2.3) (N=63,328)
An examination of the derivation of mean OPS scores in Irish (Tables 4.31 to
4.33) shows that students in the national population achieved a greater proportion of high
grades (i.e., “A” and “B” grades) at Foundation, Ordinary, and Higher Level than did
students in the urban cohort. At Foundation Level, while there is virtually no difference
in the proportions of students achieving “D”, “E”, and “F” grades: a greater proportion of
urban students were awarded grade “C”, while a greater proportion of students nationally
were awarded grades “A” and “B” (Table 4.31).
Table 4.31. Foundation Level Irish results, by grade, for all students nationally and for urban students from Breaking the Cycle schools in the 1997 JCE.
% A % B % C % D % E % F % NG
Students nationally (N=5,940) 6.2% 24.7% 31.5% 24.7% 10.3% 2.5% 0.1%
Urban Breaking the Cycle students (N=225) 4.0% 19.1% 37.8% 24.9% 10.7% 3.6% -
Among both student groups, “A” grades in Ordinary Level Irish were a relative
rarity, but students in the national population achieved slightly more “A” grades (2.4% of
students) than did those in our sample (0.8% of students) (Table 4.32). At the other end
of the scale, students in our sample were awarded more “D”, “E”, and “F” grades at
Ordinary Level than were students in the national population. Indeed, more than one in
three urban students was awarded a grade “D”, and almost one in five was awarded a
grade “E”, in Irish at Ordinary Level.
44

Table 4.32. Ordinary Level Irish results, by grade, for all students nationally and for urban students from Breaking the Cycle schools in the 1997 JCE.
% A % B % C % D % E % F % NG
Students nationally (N=31,645) 2.4% 23.3% 37.2% 27.0% 8.2% 1.9% 0.1%
Urban Breaking the Cycle students (N=389) 0.8% 9.8% 30.1% 38.0% 17.5% 3.6% 0.3%
Proportionately fewer students from Breaking the Cycle schools (9.3%) than
students nationally (39.1%) took Irish at Higher Level. However, the performance of
those who did is weaker than that of students in the national population (Table 4.33).
While differences in the proportions of candidates in both student groups achieving “C”
and “D” grades is not great, there are quite large differences, which favour students
nationally, in the proportions achieving “A” and “B” grades.
Table 4.33. Higher Level Irish results, by grade, for all students nationally and for urban students from Breaking the Cycle schools in the 1997 JCE.
% A % B % C % D % E % F % NG
Students nationally (N=25,743) 11.3% 28.0% 34.6% 21.8% 3.8% 0.4% -
Urban Breaking the Cycle students (N=67) 6.0% 16.4% 37.3% 23.9% 14.9% 1.5% -
In the subject area of Mathematics, the performance of students in the urban cohort
was, again, poorer than that of their national counterparts (Table 4.34). The mean OPS
score achieved by students nationally corresponds most closely to an “E” grade on a
Higher Level paper or a “B” grade on an Ordinary Level paper. However, the mean OPS
achieved by students in the urban cohort corresponds to slightly less than a “D” grade on
an Ordinary Level paper or to an “A” grade on a Foundation level paper. It is of interest
that there are no discernible differences between students nationally and those in the urban
cohort in terms of the proportions that were awarded grade “C” at Foundation, Ordinary
and Higher Levels. Rather, differences in overall performance appear to be explained by
the fact that greater proportions of students in the national population achieved high grades
(“A”s and “B”s) and smaller proportions achieved low grades (“D”s, and “E”s) at all levels
in Mathematics than did students in the urban cohort (Tables 4.35 to 4.37).
45
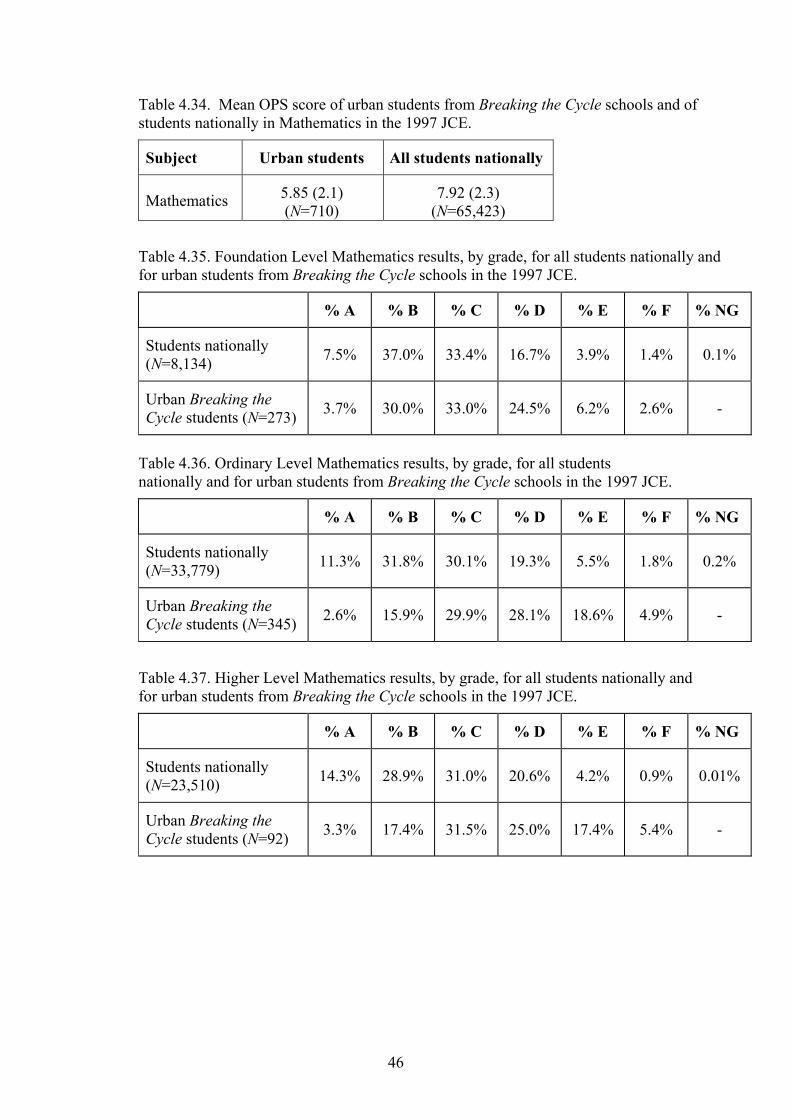
Table 4.34. Mean OPS score of urban students from Breaking the Cycle schools and of students nationally in Mathematics in the 1997 JCE.
Subject Urban students All students nationally
Mathematics 5.85 (2.1) (N=710)
7.92 (2.3) (N=65,423)
Table 4.35. Foundation Level Mathematics results, by grade, for all students nationally and for urban students from Breaking the Cycle schools in the 1997 JCE.
% A % B % C % D % E % F % NG
Students nationally (N=8,134) 7.5% 37.0% 33.4% 16.7% 3.9% 1.4% 0.1%
Urban Breaking the Cycle students (N=273) 3.7% 30.0% 33.0% 24.5% 6.2% 2.6% -
Table 4.36. Ordinary Level Mathematics results, by grade, for all students nationally and for urban students from Breaking the Cycle schools in the 1997 JCE.
% A % B % C % D % E % F % NG
Students nationally (N=33,779) 11.3% 31.8% 30.1% 19.3% 5.5% 1.8% 0.2%
Urban Breaking the Cycle students (N=345) 2.6% 15.9% 29.9% 28.1% 18.6% 4.9% -
Table 4.37. Higher Level Mathematics results, by grade, for all students nationally and for urban students from Breaking the Cycle schools in the 1997 JCE.
% A % B % C % D % E % F % NG
Students nationally (N=23,510) 14.3% 28.9% 31.0% 20.6% 4.2% 0.9% 0.01%
Urban Breaking the Cycle students (N=92) 3.3% 17.4% 31.5% 25.0% 17.4% 5.4% -
46

To examine student performance in non-core (but, nevertheless, popular) subject
areas, the Ordinary and Higher Level grades achieved by urban students and students
nationally in the seven next most popular areas are reported in Tables 4.38 and 4.39. An
interesting observation may be made from an examination of these tables: without
exception, proportionately fewer students in the urban cohort were awarded “A” and “B”
grades, and proportionately more were awarded “D” and “E” grades than were students in
the national population at both Ordinary and Higher Levels in all subjects. However,
performance among both student groups differed depending on the subject area. For
example, Ordinary Level French was the subject which had the highest percentages of
students failing to achieve a passing grade. Among students nationally, 14.3% did not
pass Ordinary Level French, while in the urban cohort, the failure rate was more than
double that at 29%. Ordinary Level French was also the subject in which students in both
groups achieved the fewest high grades. Indeed, not one of the 269 urban students who
took Ordinary Level French was awarded an “A” grade, and only 3.3% were awarded
“B” grades. While “A” grades were also a relative rarity among students nationally
(0.8% of students), proportionately more of these students (15.7%) achieved a “B” grade.
The subject with the next highest failure rate at Ordinary Level was History, with 11.2%
of students nationally and 17% of those in the urban cohort failing to pass this subject.
The strongest performances at Ordinary Level among students in both groups
were recorded in Geography, Business Studies and Home Economics. Almost half of
students nationally (44.7%) received “A” or “B” grades in Geography, as did almost one
in three urban students (29.3%). Students also achieved well in Business Studies at
Ordinary Level, where 42.9% of students nationally and 30.7% of urban students were
awarded “A” or “B” grades. Finally, 41% of students nationally and 27.3% of urban
students were awarded “A” or “B” grades in Home Economics. Home Economics had
the lowest failure rate of all Ordinary Level subjects among both student groups, with
only 3.8% of students nationally and 5.6% of urban students failing to achieve a passing
grade in this subject.
47

Table 4.38. Percentages of grades awarded to all students nationally and to urban students from Breaking the Cycle schools who took Ordinary Level History, Geography, Science, French, Business Studies, Art, Craft and Design, and Home Economics in the 1997 JCE.
Subject Group %A %B %C %D %E %F %NG
History Students nationally (N=16,121) 7.8% 25.5% 31.0% 24.5% 6.9% 3.5% 0.8%
Urban students (N=377) 4.0% 20.7% 28.4% 30.0% 9.0% 6.4% 1.6%
Geography Students nationally (N=13,394) 9.1% 35.6% 34.5% 16.6% 3.4% 0.8% -
Urban students (N=348) 3.2% 26.1% 35.6% 27.0% 7.2% 0.9% -
Science Students nationally (N=18,411) 4.8% 27.9% 37.3% 22.1% 6.0% 1.8% 0.1%
Urban students (N=332) 2.1% 24.4% 36.4% 23.5% 9.9% 3.3% 0.3%
French Students nationally (N=14,172) 0.8% 14.9% 36.4% 33.6% 12.0% 2.3% -
Urban students (N=269) - 3.3% 21.9% 45.7% 24.9% 4.1% -
Business Studies
Students nationally (N=13,216) 7.9% 35.0% 33.8% 17.4% 4.3% 1.5% 0.1%
Urban students (N=225) 1.8% 28.9% 33.3% 27.6% 4.9% 3.6% -
Art, Craft, Design
Students nationally (N=10,075) 10.2% 21.3% 36.3% 23.6% 5.9% 2.4% 0.3%
Urban students (N=195) 6.2% 15.9% 34.9% 26.2% 8.2% 7.7% 1.0%
Home Economics
Students nationally (N=4,788) 1.9% 39.1% 44.7% 10.5% 2.2% 1.2% 0.4%
Urban students (N=194) 1.0% 26.3% 50.0% 17.0% 4.1% 0.5% 1.0%
As Table 4.39 shows, Home Economics is the area in which both urban
students and those in the national population achieved the greatest proportion of top
grades at Higher Level. Indeed, more than half (53.2%) of students nationally who
took Home Economics at this level were awarded an “A” or “B” grade. The figure for
candidates in the urban cohort is somewhat lower at 32.1%. Also notable is the area of
Art, Craft and Design, which is the subject in which the largest proportion of Higher
Level “A” grades were awarded. Among the national population, over one-fifth of
students (21.1%) were awarded an “A” grade in this subject, while a smaller
percentage (5.1%) of students in the urban cohort achieved “A” grades. In contrast,
48

some Higher Level subject areas had relatively large numbers of students that failed to
achieve a passing grade: almost one-quarter of students in the urban cohort did not
achieve a passing grade in French at Higher Level, while 15.6% did not achieve a pass
in Higher Level Science. French and Science were also the subject areas in which the
failure rate was highest among students nationally at Higher Level, with 7.5% failing
to pass Science and 6.1% failing to pass French. Home Economics was the subject
with the lowest recorded failure rate, with tiny percentages of students nationally and
in the urban cohort failing to pass this subject (0.4% and 0.9% respectively).
Table 4.39. Percentages of grades awarded to all students nationally and to urban students from Breaking the Cycle schools who took Higher Level History, Geography, Science, French, Business Studies, Art, Craft and Design, and Home Economics in the 1997 JCE.
Subject Group %A %B %C %D %E %F %NG
History Students nationally (N=44,258) 15.4% 30.5% 29.5% 18.8% 4.8% 0.9% -
Urban students (N=266) 4.9% 19.9% 32.0% 31.2% 10.5% 1.5% -
Geography Students nationally (N=47,334) 8.9% 36.6% 37.5% 15.6% 1.2% 0.1% -
Urban students (N=272) 3.7% 18.4% 44.9% 28.3% 4.0% 0.7% -
Science Students nationally (N=37,897) 13.6% 26.7% 30.2% 21.9% 6.1% 1.3% 0.1%
Urban students (N=217) 7.4% 12.9% 27.2% 36.9% 9.7% 4.1% 1.8%
French Students nationally (N=32,935) 8.3% 25.5% 35.3% 24.7% 5.3% 0.7% 0.1%
Urban students (N=157) 3.8% 10.2% 22.9% 40.1% 17.8% 3.2% 1.9%
Business Studies
Students nationally (N=30,734) 9.4% 35.2% 37.0% 16.1% 1.9% 0.4% -
Urban students (N=171) 5.3% 19.3% 41.5% 29.2% 4.7% - -
Art, Craft, Design
Students nationally (N=13,218) 21.1% 26.9% 33.9% 15.2% 2.5% 0.4% -
Urban students (N=78) 5.1% 20.5% 34.6% 32.1% 6.4% 1.3% -
Home Economics
Students nationally (N=17,581) 7.3% 45.9% 37.8% 8.5% 0.4% - -
Urban students (N=109) 1.8% 30.3% 43.1% 23.9% 0.9% - -
49

Table 4.40 provides a summary of the performance of both student groups using
the aggregate OPS score in each of the most popular subject areas (i.e., overall
performance is described without reference to level at which the examination was taken,
but by using the numerical system of ascribed values described in Table 4.17). In terms
of performance in individual subject areas, the strongest aggregate performance by
students nationally was in the area of Home Economics, in which their achievements
correspond to just below a Higher Level “C” grade. The average achievement of urban
students in Home Economics corresponds to just above a grade “E” on a Higher Level
paper, or a grade “B” on an Ordinary Level paper. The strongest performance by urban
students was in Geography and Business Studies, in each of which they received an
average of between a Higher Level “E” and a Higher Level “D” grade. Despite a strong
performance relative to other subjects by urban students in these areas, their
achievements are poorer than those of students nationally, whose achievements may be
thought of as an average of between a grade “C” and a grade “D” on a Higher Level
paper.
At the lower end of the performance scale, the poorest overall performances
among both student groups were in Irish and Mathematics. Among students in the urban
cohort, Irish, followed by Mathematics, attracted the lowest aggregate OPS score when
compared with all other subjects, whereas students nationally performed at the same level
in both subjects. The OPS scores of urban students in Irish and Mathematics correspond
to an average of almost a grade “D” at Ordinary Level, or to an “A” grade at Foundation
Level. Students nationally achieved an average of almost an “E” grade at Higher Level,
or an “B” grade at Ordinary Level. It is in these subject areas that the largest
discrepancies in performance between urban students and students nationally occurred.
Another subject area in which the performance of students in both groups was weak
relative to other subjects was French. It is of interest that two of the three subjects in
which the lowest OPS scores were recorded among urban students and students
nationally were in the area of languages.
50

Table 4.40. Mean OPS score for urban students from Breaking the Cycle schools and for all students nationally, taking English, Irish, Mathematics, History, Geography, Science, French, Art, Craft and Design, Business Studies, and Home Economics in the 1997 JCE.
Subject Urban students All students nationally
English 7.3 (2.0)
(N=712)
8.7 (1.8)
(N=65,447) Irish 5.7 (2.1)
(N=681)
7.9 (2.3)
(N=63,328) Mathematics 5.8 (2.1)
(N=710)
7.9 (2.3)
(N=65,423) History 7.8 (2.1)
(N=643)
9.4 (1.9)
(N=60,379) Geography 8.2 (1.8)
(N=620)
9.7 (1.6)
(N=60,728) Science 7.8 (1.9)
(N=549)
9.1 (1.9)
(N=56,308) French 7.1 (1.9)
(N=426)
9.0 (1.9)
(N=47,107) Business Studies 8.2 (1.8)
(N=396)
9.4 (1.7)
(N=43,950) Home Economics 8.1 (1.8)
(N=303)
9.8 (1.6)
(N=22,369) Art, Craft & Design 7.5 (2.0)
(N=273)
9.0 (2.1)
(N=23,293)
4.6 OVERVIEW OF THE JUNIOR CERTIFICATE PERFORMANCE OF
STUDENTS IN THE URBAN COHORT
Students from Breaking the Cycle schools, on average, took a slightly smaller number
of subjects in the 1997 Junior Certificate Examination than did students nationally.
They also took, on average, more subjects at Foundation and Ordinary Level, and fewer
subjects at Higher Level than their national counterparts. The proportion of female
students from urban schools that took Mathematics at Foundation Level (43.8%) was
much greater than that of males (31.9%), while similar proportions of males and
females took Foundation Level English and Irish. This gender difference in uptake of
subjects at Foundation Level contrasts with the picture at national level, where greater
proportions of boys took the Foundation Level option in all three subject areas. At the
51

other end of the scale, greater proportions of male students from urban schools took
subjects at Higher Level in comparison with female students. This pattern is also at
odds with the national data, where female candidates took a greater number of subjects
at Higher Level. Some subjects were more popular among urban students than among
the national population of candidates. For example, Home Economics and Art, Craft
and Design were taken by greater proportions of urban students than by students
nationally, while smaller proportions of these students sat papers in French, Business
Studies, Science, and Geography.
There is a substantial difference in the overall examination performance (based on
the best seven subjects) of urban students and those in the national population, with the
groups respectively achieving mean Overall Performance Scale (OPS) scores of 53.7 and
65.3. This difference is quite large. An OPS of 65.3 (achieved by students nationally)
may be thought of as slightly better than an average of a “D” grade at Higher Level, or an
“A” grade at Ordinary Level, on each of a student’s best seven papers. The average OPS
score achieved by students in the urban cohort, on the other hand, corresponds to slightly
less than an average of an “E” grade at Higher Level (or a “B” grade at Ordinary Level),
on each of their best seven papers. Therefore, there is an average difference of more than
one grade between students nationally and those in the urban cohort on each of a
student’s best seven papers. This finding is consistent with the view that students in the
urban cohort originated in primary schools which cater for pupils who were educationally
disadvantaged. The finding also serves to validate the notion that the schools currently
participating in Breaking the Cycle serve high concentrations of disadvantaged pupils.
Gender differences in overall performance were observed in the national
population of candidates, where female students achieved a higher mean OPS score
based on their best seven subjects (OPS=66.9) than did males (OPS=63.7). However,
there was no discernible difference between the mean OPS score of female students
(OPS=53.9) and male students (OPS= 53.6) in the urban cohort. Thus, while the
relatively weak performance of these students as a group is acknowledged, it seems that
females who originated in Breaking the Cycle schools may be under-performing when
their Junior Certificate performance is compared to females in the national population.
Achievement levels were also related to the type of post-primary school attended
by students at the time of taking the JCE. Students enrolled in Secondary schools
achieved higher mean OPS scores than did students in Vocational, Comprehensive and
52

Community schools. This finding applied equally to students from Breaking the Cycle
schools and in the national population.
Finally, student performance in the JCE was related to whether or not the post-
primary school attended by the candidate was designated as disadvantaged. At the time
of taking the JCE, 87.9% of students who had attended Breaking the Cycle schools, and
25.6% of students in the national population, were enrolled in post-primary schools that
were designated as disadvantaged by the Department of Education and Science. In both
groups, students enrolled in designated schools at the time of taking the JCE had lower
mean OPS scores than those that were attending non-designated schools. In addition,
candidates attending designated schools took fewer subjects overall, took fewer subjects
at Higher Level, took more subjects at Foundation Level, and took more subjects at
Ordinary Level, than students enrolled in schools that were not designated. These
characteristics that are associated with disadvantaged status of school attended applied
equally to students who had attended Breaking the Cycle schools and to students in the
national population.
53