4 2012 ˘ , ˘ ˘ ˘ ˇ RESEARCH ARTICLE % $’!(!˙ˆ# && ˆ ... · of Swiss ETFs is affected by...
30
52 AESTI TIO MA RESEARCH ARTICLE aestimatio, the ieb international journal of finance, 2012. 4: 52-81 © 2012 aestimatio, the ieb international journal of finance an empirical look at swiss exchange Traded Funds Market Rompotis, Gerasimos G. RECEIVED : 3 AUGUST 2011 ACCEPTED : 22 JANUARY 2012 Abstract In this paper, we study the performance and trading characteristics of Swiss Exchange Traded Funds. The first finding is that the Swiss ETFs underperform the underlying in- dexes in terms of average daily returns. On the other hand, the ETFs load investors with greater risk in comparison to indexes. Afterwards, we reveal that the Swiss ETFs do not follow full replication strategies in regard to the components of the benchmark port- folios. Furthermore, we estimate a significant tracking error, which is attributed to the non-full replication policy, the management fees, and the risk of ETFs. Moreover, we find a negative relationship between expenses and performance as well as a positive correlation between expenses and risk. In the next step, we find that the trading volume of Swiss ETFs is affected by the intraday price volatility, the number of the executed or- ders and their trading frequency. Finally, we find that Swiss ETFs are inferior to their US counterparts as far as return, risk, replication strategy, tracking error and volume are considered. Keywords: ETFs, Swiss Market, Performance, Risk, Tracking Error, Volume. JEL classification: E22, C23 Rompotis, G.G. Assistant Manager Auditor- BDO Greece. PhD Student- Department of Economics, National and Kapodistrian University of Athens, Greece. 25 Ypsilantou Street. Peristeri, Athens, Greece. GR 121 31. +0030 210 5776510. E-mail: [email protected]
Transcript of 4 2012 ˘ , ˘ ˘ ˘ ˇ RESEARCH ARTICLE % $’!(!˙ˆ# && ˆ ... · of Swiss ETFs is affected by...

52
A E S T I T I OM A
RE
SEA
RC
H A
RT
ICLE aestimatio, the ieb international journal of finance, 2012. 4: 52-81
© 2012 aestimatio, the ieb international journal of finance
an empirical look at swiss exchange Traded Funds Market
Rompotis, Gerasimos G.
� RECEIVED : 3 AUGUST 2011
� ACCEPTED : 22 JANUARY 2012
Abstract
In this paper, we study the performance and trading characteristics of Swiss ExchangeTraded Funds. The first finding is that the Swiss ETFs underperform the underlying in-dexes in terms of average daily returns. On the other hand, the ETFs load investors withgreater risk in comparison to indexes. Afterwards, we reveal that the Swiss ETFs do notfollow full replication strategies in regard to the components of the benchmark port-folios. Furthermore, we estimate a significant tracking error, which is attributed to thenon-full replication policy, the management fees, and the risk of ETFs. Moreover, wefind a negative relationship between expenses and performance as well as a positivecorrelation between expenses and risk. In the next step, we find that the trading volumeof Swiss ETFs is affected by the intraday price volatility, the number of the executed or-ders and their trading frequency. Finally, we find that Swiss ETFs are inferior to theirUS counterparts as far as return, risk, replication strategy, tracking error and volumeare considered.
Keywords:
ETFs, Swiss Market, Performance, Risk, Tracking Error, Volume.
JEL classification:
E22, C23
Rompotis, G.G. Assistant Manager Auditor- BDO Greece. PhD Student- Department of Economics, National and KapodistrianUniversity of Athens, Greece. 25 Ypsilantou Street. Peristeri, Athens, Greece. GR 121 31. +0030 210 5776510. E-mail: [email protected]
53
A E S T I T I OM A
53
aestimatio, the ieb international journal of finance, 2012. 4: 52-81
© 2012 aestimatio, the ieb international journal of finance
un estudio empírico del mercado de fondos negociados en la Bolsa suiza
Rompotis, Gerasimos G.
Resumen
En este artículo se estudia el rendimiento y las características de negociación de losfondos negociados en la Bolsa suiza. La primera conclusión es que tienen menor ren-tabilidad que los índices subyacentes en términos de rendimientos medios diarios.Por otra parte, cargan inversores con mayor riesgo en comparación a los índices. Sepone de manifiesto que no siguen estrategias de replicación completa en lo que serefiere a los componentes de las carteras objetivo. Se estima un error de seguimientosignificativo, que se atribuye a la política de replicación no completa, a los gastos degestión y al riesgo de tales fondos. Se encuentra una relación negativa entre gastos yrentabilidad, así como una correlación positiva entre gastos y riesgo. En la siguienteetapa, se encuentra que el volumen negociado de los fondos objeto de análisis estáafectado por la volatilidad de los precios intra-día, el número de ordenes ejecutadasy su frecuencia de negociación. Finalmente, se concluye que los fondos negociadosen la Bolsa suiza son inferiores a sus homólogos americanos en cuanto a rentabilidad,riesgo, estrategia de replicación, error de seguimiento y volumen.
Palabras clave:
Fondos negociados en la Bolsa suiza, mercado suizo, rentabilidad, riesgo, error deseguimiento, volumen.

54
A E S T I T I OM A
an
empi
rica
l lo
ok
at s
wis
s ex
chan
ge t
rade
d fu
nds
mar
ket.
Rom
potis
, G. G
. a
est
ima
tio
, th
eie
bin
ter
na
tio
na
ljo
ur
na
lo
ffi
na
nc
e, 20
12. 4
: 52-
81
n 1. Introduction
The inception of the Standard and Poor’s Depository Receipts (SPDRs) on the American
Exchange in 1993 and the subsequent rapid growth of Exchange Traded Funds (ETFs)
with products known as Qubes (QQQ), Diamonds, and iShares, have enhanced
investment choices and brought new challenges to the professional portfolio manager.
This paper studies this alternative type of mutual funds in Switzerland.
ETFs are investment hybrids of ordinary corporate stocks and open-ended mutual
funds. They are baskets of shares aimed to closely replicate the performance and risk
levels of specific indexes. They are subject to exchange trading rules offering flexibility
to investors along with the ability to buy or sell the entire market with a single
transaction at any time during the trading hours.
The paper focuses on the ETFs traded in the Swiss Stock Exchange to examine a
number of testable hypotheses related to: (1) the ability of ETF managers to replicate
the behavior and performance of the underlying index, (2) the magnitude of the
tracking error, (3) the role that expenses play on the ETF performance, and (4) the
factors that affect the trading behavior of ETFs. Empirical evidence on some of these
hypotheses exists on ETFs trading in the U.S., Canada, Australia, and Asian markets
but academic research on Swiss ETFs is absent. The Swiss Stock Exchange is one of
the four major players in the European ETF market with a turnover of 6.2 billion euros
in 2005 and constantly growing with 99 ETFs currently traded. In addition, the Swiss
market is of particular interest as Switzerland is considered to be the treasury of the
global wealth and, therefore, the interest of international investors in investment
products available in the Swiss market is very intense.
By analyzing the trading behavior of Swiss ETFs we not only provide market participants
with information on the workings of the market but we allow for comparisons with
ETFs in other developed markets. On that basis, both private and institutional
investors, either in Switzerland or abroad, may benefit from our analysis because it
will provide them with insights into alternative investment choices they can have.
Insights relating to performance, risk, costs, trading activity and other institutional
factors of Swiss ETFs will make investors acquainted with a new market they may have
not already taken into consideration and may make them consider to channel some
of their funds to this market exploiting of any particular local advantages of Swiss
market over the US one or other national and international ETF markets.
The investors’ needs to take positions in the entire market rather than in a specific
portfolio is the result of empirical evidence on mutual funds that active management,
on the average, does not produce above-normal returns. A number of authors
55
A E S T I T I OM A
an em
pirical loo
k at swiss exchange traded funds m
arket. Rom
potis, G. G
. a
estim
at
io, t
he
iebin
ter
na
tio
na
ljo
ur
na
lo
ffin
an
ce, 2012. 4
: 52-81
(Malkiel (1995), Gruber (1996)) attribute the managerial inability to “beat the
market” to the increased expenses incurred by the managers in an effort to do so. As
a result, the above-normal returns thus achieved on a gross level are reduced to the
normal level after expenses are deducted. This realization made investors direct most
of their money to mutual funds that track a market index rather than search for a
mutual fund that practices active management. These investors’ preferences led to
the growth of index funds making index providers the world’s largest asset managers.
Yet, besides tracking the market, investors have shown strong preference to take
positions in and out of the entire market quickly with just one order, with minimum
transactions costs, lower tax burden and with greater risk diversification and flexibility.
The attempt to incorporate these features in a product led to the development of ETFs.
The benefits and advantages ETFs offer to investors has been analyzed in an array of de-
veloped markets like the U.S., and Australia [Gastineau (2001), Carty (2001), Gallagher
and Segara (2005)]. They find that their advantages like flexibility, risk diversification,
tax efficiency and lower costs have contributed to their successful proliferation. A number
of other studies have focused on the ETF pricing and performance [Ackert and Tian
(2000), Elton, Gruber, Comer and Li (2002), Poterba and Shoven (2002)] suggesting
that ETF pricing does not differ from their net asset value.
Following previous research, we estimate the risk, return, and performance of 36 Swiss
ETFs available in the period 2001-2006. We provide three measures of tracking error,
examine the tracking ability of ETF managers and assess the trading activity of ETFs
and the factors which are likely to explain the growing activity of trading volume. In
the last step, we perform a comparison of Swiss ETFs to competitive US ETFs
benchmarked to the same indexes. The comparison regards return, risk, tracking error,
volume and management fees. The rest of the paper is organized as follows: In Section
2 we develop the methodology followed in the empirical analysis and provide the
rationale for regression relationships across tracking error, performance, risk,
management fees and trading volume. Sample and data employed are described in
Section 3 and Section 4 presents the discussion of the empirical results. In the final
section 5 we summarize the main findings of the paper and offer some concluding
comments and ideas for future research.
n 2. Methodology
In this section we develop the methodology that will be followed to examine a number
of issues surrounding the Swiss ETF like statistical characteristics, tracking error,
performance, expenses, risk, volume, and their interactions.

2.1 Statistical Characteristics We first calculate the average daily percentage return and risk of Swiss ETFs and their
corresponding indexes. We compute the percentage return of ETFs, using equation (1):
Ri =TVi –TVi–1 *100 (1)
where, Ri refers to the percentage return on day i, and TVi refers to the trading price
of ETF on day i.
The risk of ETFs and of the indexes is expressed by the standard deviation of returns:
s 2 = (2)
and s = s 2 (3)
where, s 2 denotes the variance of an ETF’s return around the average return –R and s
expresses the percentage risk of portfolio in terms of returns’ standard deviation. We
also estimate the risk/return ratio by dividing the mean standard deviation of returns
by the average percentage return. This ratio calculates the risk per unit of return, a
useful measure when making comparisons across ETFs.
Next, we introduce regression models to analyze the interrelationships among the
average daily trading turnover, the number of the mean executed trades, the volume
of traded shares, the percentage management fee and the trading frequency of ETFs.
2.2 Regression AnalysisIn this section, we perform an Ordinary Least Squares (OLS) simple regression in
order to examine a variety of interesting issues. The OLS regression method adopted
is the standard method used in the relevant financial literature. In addition, as it will
be shown in Table 1, the return series of ETFs and indexes are stationary and, thus,
can be used in an OLS regression model. The single index model is presented in
equation (4):
Rpt = αi + βi Rbt + εpt (4)
where: Rpt indicates the raw return of the ETF on day t, Rbt presents the return of the
tracking index portfolio on day t, and εpt is the residual error on that day. In this
regression, the alpha (α) coefficient estimates the return an ETF could achieve above
the return that relates to the index portfolio. However, since ETFs pursue a passive
investment approach, alpha estimations are not expected to be statistically significant.
56
A E S T I T I OM A
an
empi
rica
l lo
ok
at s
wis
s ex
chan
ge t
rade
d fu
nds
mar
ket.
Rom
potis
, G. G
. a
est
ima
tio
, th
eie
bin
ter
na
tio
na
ljo
ur
na
lo
ffi
na
nc
e, 20
12. 4
: 52-
81
TVi–1
N
∑ (Ri – –R)2
i=l N–1
The beta (β) coefficient in equation (4) is an estimate for the systematic risk to which
an ETF is exposed and reflects the aggressiveness of management strategy. Beta
estimations are also viewed as indicators of an ETF’s replication strategy. A beta of
unity suggests a full replication strategy whereby the ETF invests to all components
of the tracking index in the same weights. In contrast, a beta coefficient which
significantly differs from unity represents a departure from a full replication strategy.
In this case the ETF manager rather implements selection techniques choosing stocks
expected to outperform.
2.3 Tracking ErrorThe deviation of the performance of index funds from the performance of corresponding
indexes is defined as “tracking error” and this issue has attracted great interest in the
literature. The most common issue in passive portfolio management is that fund
managers usually fail to replicate accurately the return of their corresponding indexes.
Among the early studies on tracking error, Roll (1992) argued that the major challenge
faced by the portfolio manager is the minimization of the tracking error. Roll argues
that the derived portfolios under this strategy are efficient if the benchmark portfolio
is efficient. However, such portfolios bear greater systematic risk than the
benchmark’s portfolio, which implies a beta greater than unity. Pope and Yadav
(1994) investigate the restrictions in tracking error estimation which derive from the
usage of high-frequency data like the daily or weekly returns. The major impact of
high-frequently data is that they induce negative serial correlation with respect to the
difference between the fund return and its benchmark. They suggest that unless the
portfolio’s composition exactly replicates the components of the tracking index, the
return differences would be negatively serially correlated.
The impact of a portfolio’s components on its tracking performance relative to a
selected benchmark’s return is the focus of a study by Larsen and Resnick (1998).
Their investigation on both high and low-capitalization portfolios reveals that the
high-capitalization portfolios present inferior tracking error and volatility than the
low-capitalization counterparts. They also find that the magnitude of tracking error
approximates zero when the composition of the stocks’ portfolio reaches the absolute
synthesis of the index portfolio.
Frino and Gallagher (2001) present the major factors that enlarge the size of tracking
error such as the dividend payments arising from the stocks of an index as well as the
size and the timing of index’s rebalancing. They conclude that index funds face market
frictions that hurt their ability to replicate exactly the performance of the underlying
indexes which do not face any frictions at all. They also discover a seasonality effect
in tracking error magnitude.
57
A E S T I T I OM A
an em
pirical loo
k at swiss exchange traded funds m
arket. Rom
potis, G. G
. a
estim
at
io, t
he
iebin
ter
na
tio
na
ljo
ur
na
lo
ffin
an
ce, 2012. 4
: 52-81
Kostovetsky (2003) demonstrates that index funds and ETFs’ tracking error is affected
by common as well as by different elements. The main factors that induce the tracking
error of index funds are the bid-ask spreads, the obligation of index funds to maintain
a significant amount of money in cash to meet redemptions, the dividend policies
and the transaction costs arising from index changes or corporate activity. The cash
drag effect is applicable to ETFs too, even if it is much smaller. ETFs performance is
affected by the dividend policies, which usually obligate the ETFs managers to keep
the received dividends from the index’s stocks in non-bearing accounts.
Finally, Blume and Edelen (2004) study the impact of S&P 500 composition’s change
to the abnormal returns of index funds. These abnormal returns are attainable if the
indexer chooses to adjust his portfolio immediately at the opening price on the
consequent day of the change’s announcement, rather than waiting until the closure
on the day of change. This strategy induces the observed tracking error.
The literature suggests a variety of methods in tracking error estimations. For example,
Ammann and Zimmermann (2001) recommend the correlation coefficient between
the tracking portfolio and the benchmark. In our study, we choose the three most
commonly used methods of tracking error measurement. The first one, TE1,P , is
straightforward and defined as the standard error of regression (4).
The second one, TE2,P , computes the tracking error by calculating the average of
absolute differences between the returns of ETFs and the corresponding indexes. We
take into account the absolute value of returns’ differences because either a positive
or a negative difference reflects performance deviation. This estimation is expressed
in equation (5):
TE2,P = (5)
where |ePt| is the absolute return difference in day t.
Finally, the third method, TE3,P , computes the standard deviation of return dif -
ferences between ETFs and their indexes. This is the most commonly used method
and, according to Pope and Yadav (1994), produces the same results in comparison
to the first method only if equation’s (4) beta is equal to unity. The estimation of this
tracking error is presented in equation (6):
TE3,P= (ept – e–p )2 (6)
where ept is the difference of returns in day t and e–p is the average return’s difference
over n days.
58
A E S T I T I OM A
an
empi
rica
l lo
ok
at s
wis
s ex
chan
ge t
rade
d fu
nds
mar
ket.
Rom
potis
, G. G
. a
est
ima
tio
, th
eie
bin
ter
na
tio
na
ljo
ur
na
lo
ffi
na
nc
e, 20
12. 4
: 52-
81
n
∑ |ePt|t=1
n
n
∑t=1
1n–1
4.4 Performance, Expenses and RiskAfter estimating ETFs risk and return and the related tracking error components,
attention is turned to the management expenses and their impact on ETFs ability to
accurately replicate the performance of the selected benchmarks. The literature
denotes that expenses count for a big portion of ETFs tracking error.1
As a proxy of Swiss ETFs expenses we use the published ratio of management fee.2
The impact of expenses on ETFs performance is assessed with cross-sectional
regression analysis. In the first step, we apply a single OLS regression of ETFs average
daily return on their percentage management fee ratio with the method. This
regression is appropriate, since the managerial fees are subtracted daily on a
percentage basis. We expect the coefficient of fees to be negative and statistically
significant since the expenses found on ETFs are reducing their performance relatively
to the benchmark’s performance which does not carry any expenses.
In addition, we estimate the quantitative relation between the tracking error measure -
ments and the management fees. We perform single OLS regressions of tracking error
on management fee ratio. We apply three distinct regressions for each one of the three
tracking error estimates. Since management fees apply only to ETFs and not to the
underlying index, the greater the management fees the greater the tracking error is
expected to be and the coefficient of management fee ratio to be positive.
In our analysis of expenses, we consider the risk as a determinant factor of the fees
imposed on an ETF investor. As the related risk of an investment increases, the
imposed fees are expected to also increase. This influence is more evident in ETFs
tracking benchmark indexes of international markets, which usually bear the higher
expense ratios. We estimate the impact of risk on management fees by regressing the
fee ratio on the standard deviation of ETF returns with the OLS method In the last
step of our analysis, we assume that price risk affects the tracking ability of ETFs. We
expect risk and tracking error to be positively related and explore this relation by
regressing the three ETF tracking error estimates on the calculated level of risk with
the OLS method.
2.5 Determinants of VolumeIn this segment, we investigate the determinants of the daily volume of Swiss ETFs.
The combination of trading volume and total assets under management reflects the
attractiveness of ETFs and their acceptance by the investing community.
59
A E S T I T I OM A
an em
pirical loo
k at swiss exchange traded funds m
arket. Rom
potis, G. G
. a
estim
at
io, t
he
iebin
ter
na
tio
na
ljo
ur
na
lo
ffin
an
ce, 2012. 4
: 52-81
1 See for example, Elton, Gruber, Comer and Li (2002).
2 Unfortunately, we are not provided with any information on transaction costs or brokerage commissions and it is not defined if themanagement fee ratio used here includes any of these costs. Further, we are not supplied with data concerning the bid and askprices of ETFs shares on Swiss Exchange. This lack of data on expenses restricts our investigation only to management fees.
The daily volume of ETFs shares is influenced by various factors. Elton, Gruber, Comer
and Li (2002) connect volume size with market volatility and the arbitrage opportunity
of ETFs. In a similar manner we treat the intraday volatility of ETFs as a determinant
factor of volume in order to incorporate the inherent trading trend of ETFs. The
intraday volatility is estimated by the ratio of the difference between the daily highest
and the daily lowest price on any given day to the closing ETF price on that day.
The conventional hypothesis is that the number of trades has a positive effect on
volume. Normally, both purchases and sales of ETFs induce the volume’s configuration,
implying a straightforward correlation among ETFs volume and the number of trades.
Furthermore, one could assume that the return of ETFs on the previous trading day
would probably induce the size of today’s volume. This assumption is applicable both
for short and long investors. Therefore, we expect a positive relationship between ETF
volume and ETF one day lagged performance.
We examine the determination of Swiss ETFs volume with a time-series regression for
each ETF that combines ETF volatility, the number of trades, and the lagged return.
The OLS regression applied is as follows:
LnVi = a0 + a1DHi –DLi + a2 TRi + a3 LagReti + ei (7)
ICi
The LnVi variable refers to the natural logarithm of the daily volume for the ith ETF.
DHi , DLi and ICi denote the intraday highest, lowest and closing price of the ith
ETF, respectively. The (DHi – DLi)/ICi ratio estimates the ETF’s intraday volatility.
TRi is the number of executed trades for the ith ETF. Finally, LagReti refers to the
return in the previous day of the ith ETF.
Besides the above factors, we assume that trading frequency also influences the
volume of ETFs. We examine this issue for the overall sample’s ETFs by a cross-
sectional regression. The model also includes the average ETFs volatility and the
average number of trades as in equation (7). However, the average lagged return is
not applicable and therefore not embodied in the regression. The trading frequency
is noted as FREQ and is defined as the rate of the actual trading days of ETFs to the
total actual trading days of the indexes. These influences are estimated in the
following OLS regression:
LnVi = b0 + b1DHi –DLi + b2 TRi + b3 FREQi + ui (8)
ICi
60
A E S T I T I OM A
an
empi
rica
l lo
ok
at s
wis
s ex
chan
ge t
rade
d fu
nds
mar
ket.
Rom
potis
, G. G
. a
est
ima
tio
, th
eie
bin
ter
na
tio
na
ljo
ur
na
lo
ffi
na
nc
e, 20
12. 4
: 52-
81

2.6 Comparison of Swiss and US ETFsThe last issue examined concerns the competition between the Swiss ETFs and the
corresponding US listed ETFs tracking the same indexes. In this respect, we find 10ETFs in the sample having corresponding US ETFs. In other words, the 10 Swiss ETFs
and 10 US ETFs considered in this comparison in pairs track the same indexes. The
comparison is performed in terms of the main trading statistics such as return, risk,
systematic risk, tracking error, trading volume and management fees.
We note that there are some differences in the trading history between Swiss and US
ETFs, namely there are working days in Switzerland on which the US market is closed
and vice versa. So as to avoid any bias in the results of the comparison, we adjust the
data for the two samples to each other. Thus, the results that will e reported only
concern the days on which both the markets are open.
n 3. Data
We use daily data for a sample of 36 ETFs traded on the Swiss Stock Exchange during
the period of August 2001 to April 2006. We note that this number does not reflect
all available Swiss ETFs over that period. Particularly, the Swiss exchange offers trading
opportunities for 49 ETFs of various investment styles, like equities, bonds or
commodities. The majority of the non-included ETFs suffer from illiquid trading or
were restrictions collecting the historical prices of the underlying indexes.
Beyond the listed Swiss ETFs, the sample encompasses four ETFs that do not currently
trade on the Swiss exchange. These ETFs ceased their trading activity approximately
at the end of 2004, but their previous history is significantly voluminous and cannot
be ignored. We decided to include these non-survived ETFs, thus mitigating the
survivorship bias problem. Overall, the sample of this study contains 36 ETFs that
are mainly equity ETFs, while two bond ETFs are also included.
The trading data of the surviving and non-surviving ETFs were available at the Swiss
exchange’s webpage. The dataset encompasses historical information about the daily
ETFs closing values, intraday high and low prices and the volume of the traded shares.
Swiss exchange’s webpage also offers data about the names of ETFs, tracking indexes
and their management fee ratios.
The sample ETFs track various European, US and Asian indexes in growth and
emerging capital or bond markets. A large part of the sample’s ETFs try to replicate
the performance of Morgan Stanley’s international indexes. The daily closing values
of these indexes are collected from the Morgan Stanley’s webpage. Further, another
61
A E S T I T I OM A
an em
pirical loo
k at swiss exchange traded funds m
arket. Rom
potis, G. G
. a
estim
at
io, t
he
iebin
ter
na
tio
na
ljo
ur
na
lo
ffin
an
ce, 2012. 4
: 52-81

large part of the sample’s ETFs follow the return of major regional or sector Dow
Jones indexes. The Dow Jones webpage makes available the values of these indexes.
Moreover, the sample includes ETFs that track four principal equity and bond indexes
of Swiss markets, the data of which are collected from the web database of the Swiss
exchange. Accordingly, one ETF follows the Nasdaq 100 index, one tracks the S&P
500 index and the other two track the movements of FTSE 100 and FTSEurofirst 100index. The closing values of the above indexes are collected from finance.yahoo.
n 4. Empirical Results
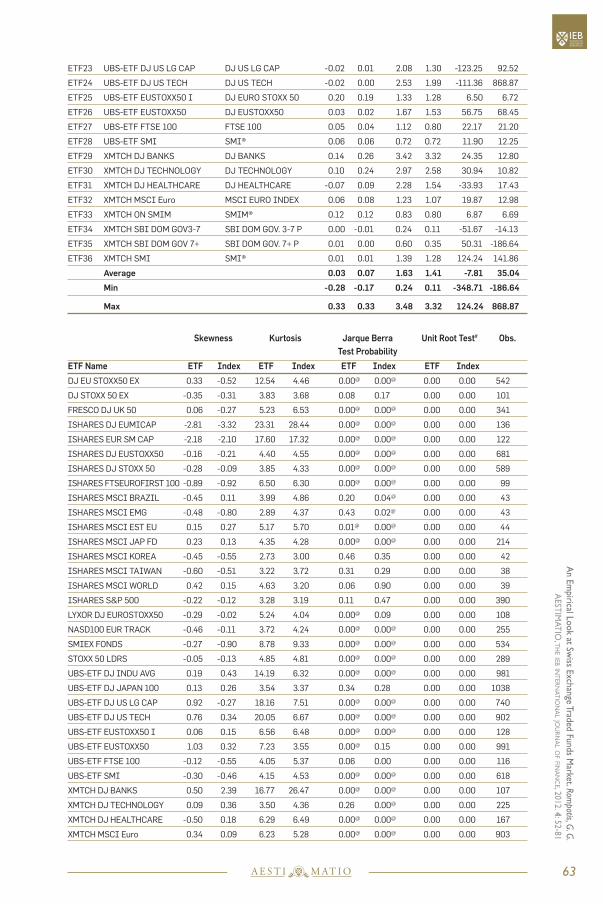
4.1 Descriptive Statistics Table 1 presents the risk and return characteristics of the sample. Results show that
the average daily percentage return of the sample’s ETFs is positive and equal to 3
basis points (b.p.). The average return of the corresponding indexes is a little higher
than the average return of ETFs and equals 7 b.p. This comparison suggests that the
sample’s ETFs underperform, on the average, the return of the underlying indexes by
an amount of 4 b.p.
l Table 1. Percentage Daily Return and Risk of ETFs and IndexesThis table presents the calculations of ETFs and underlying indexes’ average percentage return and risk. As the column of the numberof observations implies the availability of ETFs data varies, reflecting the different inception day and trading activity of each one. Thetable also reports the risk/return ratio, which indicates the risk of one unit of return. In our estimations of return and risk we use dailydata on trading days with nonzero trading volume.
Return Risk Risk/Return RatioETF No ETF Name Underlying Index ETF Index ETF Index ETF Index
ETF1 DJ EU STOXX50 EX DJ EU STOXX50 0.07 0.07 1.17 0.93 15.85 13.36
ETF2 DJ STOXX 50 EX DJ STOXX 50 0.33 0.33 1.80 1.74 5.47 5.34
ETF3 FRESCO DJ UK 50 DJ UK 50 -0.04 -0.02 2.40 1.93 -60.32 -101.07
ETF4 ISHARES DJ EUMICAP DJ Euro STOXX MC 0.19 0.19 1.43 1.43 7.62 7.69
ETF5 ISHARES EUR SM CAP DJ Euro STOXX SC 0.23 0.23 1.68 1.38 7.28 6.03
ETF6 ISHARES DJ EUSTOXX50 DJ EUSTOXX50 0.05 0.05 0.97 0.85 17.89 15.96
ETF7 ISHARES DJ STOXX 50 DJ STOXX 50 0.05 0.05 0.90 0.82 17.40 16.77
ETF8 ISHARES FTSEUROFIRST 100 FTSEurofirst 100 0.20 0.20 1.24 1.26 6.12 6.27
ETF9 ISHARES MSCI BRAZIL MSCI BRAZIL -0.28 -0.17 3.48 2.97 -12.49 -17.07
ETF10 ISHARES MSCI EMG MSCI EMERG. MARK. -0.24 -0.07 1.50 1.57 -6.35 -24.17
ETF11 ISHARES MSCI EST EU MSCI EAST. EUROPE -0.20 0.02 2.78 2.76 -13.81 125.16
ETF12 ISHARES MSCI JAP FD MSCI JAPAN 0.13 0.12 1.39 1.29 10.95 10.87
ETF13 ISHARES MSCI KOREA MSCI KOREA -0.11 0.08 1.55 1.54 -13.79 18.39
ETF14 ISHARES MSCI TAIWAN MSCI TAIWAN -0.05 0.19 1.47 1.33 -32.44 7.05
ETF15 ISHARES MSCI WORLD MSCI WORLD -0.19 -0.02 1.02 0.77 -5.32 -44.24
ETF16 ISHARES S&P 500 S&P 500 0.02 0.03 1.05 0.72 47.73 22.30
ETF17 LYXOR DJ EUROSTOXX50 DJ EURO STOXX 50 0.17 0.17 1.41 1.32 8.07 7.84
ETF18 NASD100 EUR TRACK NASDAQ 100 0.03 0.05 1.47 1.14 42.26 24.39
ETF19 SMIEX FONDS SMI® 0.05 0.04 1.79 1.78 36.00 43.14
ETF20 STOXX 50 LDRS DJ STOXX 50 -0.03 -0.06 2.47 2.23 -96.62 -39.88
ETF21 UBS-ETF DJ INDU AVG DJ INDU AVG 0.00 0.02 1.73 1.10 -348.71 57.53
ETF22 UBS-ETF DJ JAPAN 100 DJ JAPAN 100 0.03 0.05 1.57 1.31 52.35 28.06
62
A E S T I T I OM A
an
empi
rica
l lo
ok
at s
wis
s ex
chan
ge t
rade
d fu
nds
mar
ket.
Rom
potis
, G. G
. a
est
ima
tio
, th
eie
bin
ter
na
tio
na
ljo
ur
na
lo
ffi
na
nc
e, 20
12. 4
: 52-
81
ETF23 UBS-ETF DJ US LG CAP DJ US LG CAP -0.02 0.01 2.08 1.30 -123.25 92.52
ETF24 UBS-ETF DJ US TECH DJ US TECH -0.02 0.00 2.53 1.99 -111.36 868.87
ETF25 UBS-ETF EUSTOXX50 I DJ EURO STOXX 50 0.20 0.19 1.33 1.28 6.50 6.72
ETF26 UBS-ETF EUSTOXX50 DJ EUSTOXX50 0.03 0.02 1.67 1.53 56.75 68.45
ETF27 UBS-ETF FTSE 100 FTSE 100 0.05 0.04 1.12 0.80 22.17 21.20
ETF28 UBS-ETF SMI SMI® 0.06 0.06 0.72 0.72 11.90 12.25
ETF29 XMTCH DJ BANKS DJ BANKS 0.14 0.26 3.42 3.32 24.35 12.80
ETF30 XMTCH DJ TECHNOLOGY DJ TECHNOLOGY 0.10 0.24 2.97 2.58 30.94 10.82
ETF31 XMTCH DJ HEALTHCARE DJ HEALTHCARE -0.07 0.09 2.28 1.54 -33.93 17.43
ETF32 XMTCH MSCI Euro MSCI EURO INDEX 0.06 0.08 1.23 1.07 19.87 12.98
ETF33 XMTCH ON SMIM SMIM® 0.12 0.12 0.83 0.80 6.87 6.69
ETF34 XMTCH SBI DOM GOV3-7 SBI DOM GOV. 3-7 P 0.00 -0.01 0.24 0.11 -51.67 -14.13
ETF35 XMTCH SBI DOM GOV 7+ SBI DOM GOV. 7+ P 0.01 0.00 0.60 0.35 50.31 -186.64
ETF36 XMTCH SMI SMI® 0.01 0.01 1.39 1.28 124.24 141.86
Average 0.03 0.07 1.63 1.41 -7.81 35.04
Min -0.28 -0.17 0.24 0.11 -348.71 -186.64
Max 0.33 0.33 3.48 3.32 124.24 868.87
Skewness Kurtosis Jarque Berra Unit Root Test# Obs.Test Probability
ETF Name ETF Index ETF Index ETF Index ETF Index
DJ EU STOXX50 EX 0.33 -0.52 12.54 4.46 0.00@ 0.00@ 0.00 0.00 542
DJ STOXX 50 EX -0.35 -0.31 3.83 3.68 0.08 0.17 0.00 0.00 101
FRESCO DJ UK 50 0.06 -0.27 5.23 6.53 0.00@ 0.00@ 0.00 0.00 341
ISHARES DJ EUMICAP -2.81 -3.32 23.31 28.44 0.00@ 0.00@ 0.00 0.00 136
ISHARES EUR SM CAP -2.18 -2.10 17.60 17.32 0.00@ 0.00@ 0.00 0.00 122
ISHARES DJ EUSTOXX50 -0.16 -0.21 4.40 4.55 0.00@ 0.00@ 0.00 0.00 681
ISHARES DJ STOXX 50 -0.28 -0.09 3.85 4.33 0.00@ 0.00@ 0.00 0.00 589
ISHARES FTSEUROFIRST 100 -0.89 -0.92 6.50 6.30 0.00@ 0.00@ 0.00 0.00 99
ISHARES MSCI BRAZIL -0.45 0.11 3.99 4.86 0.20 0.04@ 0.00 0.00 43
ISHARES MSCI EMG -0.48 -0.80 2.89 4.37 0.43 0.02@ 0.00 0.00 43
ISHARES MSCI EST EU 0.15 0.27 5.17 5.70 0.01@ 0.00@ 0.00 0.00 44
ISHARES MSCI JAP FD 0.23 0.13 4.35 4.28 0.00@ 0.00@ 0.00 0.00 214
ISHARES MSCI KOREA -0.45 -0.55 2.73 3.00 0.46 0.35 0.00 0.00 42
ISHARES MSCI TAIWAN -0.60 -0.51 3.22 3.72 0.31 0.29 0.00 0.00 38
ISHARES MSCI WORLD 0.42 0.15 4.63 3.20 0.06 0.90 0.00 0.00 39
ISHARES S&P 500 -0.22 -0.12 3.28 3.19 0.11 0.47 0.00 0.00 390
LYXOR DJ EUROSTOXX50 -0.29 -0.02 5.24 4.04 0.00@ 0.09 0.00 0.00 108
NASD100 EUR TRACK -0.46 -0.11 3.72 4.24 0.00@ 0.00@ 0.00 0.00 255
SMIEX FONDS -0.27 -0.90 8.78 9.33 0.00@ 0.00@ 0.00 0.00 534
STOXX 50 LDRS -0.05 -0.13 4.85 4.81 0.00@ 0.00@ 0.00 0.00 289
UBS-ETF DJ INDU AVG 0.19 0.43 14.19 6.32 0.00@ 0.00@ 0.00 0.00 981
UBS-ETF DJ JAPAN 100 0.13 0.26 3.54 3.37 0.34 0.28 0.00 0.00 1038
UBS-ETF DJ US LG CAP 0.92 -0.27 18.16 7.51 0.00@ 0.00@ 0.00 0.00 740
UBS-ETF DJ US TECH 0.76 0.34 20.05 6.67 0.00@ 0.00@ 0.00 0.00 902
UBS-ETF EUSTOXX50 I 0.06 0.15 6.56 6.48 0.00@ 0.00@ 0.00 0.00 128
UBS-ETF EUSTOXX50 1.03 0.32 7.23 3.55 0.00@ 0.15 0.00 0.00 991
UBS-ETF FTSE 100 -0.12 -0.55 4.05 5.37 0.06 0.00 0.00 0.00 116
UBS-ETF SMI -0.30 -0.46 4.15 4.53 0.00@ 0.00@ 0.00 0.00 618
XMTCH DJ BANKS 0.50 2.39 16.77 26.47 0.00@ 0.00@ 0.00 0.00 107
XMTCH DJ TECHNOLOGY 0.09 0.36 3.50 4.36 0.26 0.00@ 0.00 0.00 225
XMTCH DJ HEALTHCARE -0.50 0.18 6.29 6.49 0.00@ 0.00@ 0.00 0.00 167
XMTCH MSCI Euro 0.34 0.09 6.23 5.28 0.00@ 0.00@ 0.00 0.00 903
63
A E S T I T I OM A
an em
pirical loo
k at swiss exchange traded funds m
arket. Rom
potis, G. G
. a
estim
at
io, t
he
iebin
ter
na
tio
na
ljo
ur
na
lo
ffin
an
ce, 2012. 4
: 52-81

XMTCH ON SMIM -0.14 0.09 16.61 7.67 0.00@ 0.00@ 0.00 0.00 372
XMTCH SBI DOM GOV3-7 -0.90 -1.05 6.44 7.47 0.00@ 0.00@ 0.00 0.00 502
XMTCH SBI DOM GOV 7+ -0.04 1.01 4.19 9.04 0.00@ 0.00@ 0.00 0.00 233
XMTCH SMI -1.33 0.15 10.99 7.57 0.00@ 0.00@ 0.00 0.00 1257
Average -0.22 -0.19 7.75 6.90 0.06 0.08 0.00 0.00 387
Min -2.81 -3.32 2.73 3.00 0.00 0.00 0.00 0.00 38
Max 1.03 2.39 23.31 28.44 0.46 0.90 0.00 0.00 1257@ The hypothesis of normal distribution of returns is rejected.# The Unit Root Test performed is the Augmented Dickey-Fuller Test and the reported values are the probabilities of the relevant t-tests
for the rejection of the null hypothesis of the existence of a unit root in return series. Probability<0.05 implies no unit root in returns.
The lowest return relates to the iShares MSCI Brazil and it counts for -0.28%. At the
same time, the corresponding index presents the poorest return equal to -0.17%. On
the contrary, the best average performer is the DJ Stoxx 50 whose return amounts to
33 b.p. exactly as much as its corresponding ETF.
Regarding the ETFs risk, we find that the daily ETFs standard deviation is 1.63% while
indexes present a risk which is equal to 1.41%. The less risky ETF is the XMTCH SBI
DOM GOV3-7, and the most risky is the iShares MSCI Brazil, also the one with the
weakest performance. In this case, the common belief that the high risk usually
compensates investors with higher returns on an ex ante basis, does not hold ex post.
The average ETF risk/return ratio is quantified to -7.81, while we observe a large range
between the minimum and the maximum values. Specifically, the lowest risk/return
ratio is equal to -348.71, related to the UBS-ETF DJ INDU AVG. This low value of the
ratio emerges as an outlier when the daily average ETF risk of 1.73% is divided by a
very minimal negative return of almost zero. On the other side, the maximum
risk/return ratio concerns the XMTCH SMI which tracks the general index of the Swiss
exchange market.
When it comes to the skewness in returns, Table 2 shows that skewness is not the
case in our sample. On the contrary, kurtosis in returns is an issue in our sample. In
particular, the average kurtosis for ETFs and indexes amounts to 7.75 and 6.90,
respectively indicating that the return series are leptokurtic. As a result, the Jarque
Berra Test performed on the normality in returns’ distributions rejects this hypothesis,
namely the returns of ETFs and indexes are not normally distributed for the majority
of the sample’s ETFs and indexes. However, the results of the Augmented Dickey-
Fuller Test performed for examining the stationarity of return series indicate that there
is no such problem in returns and can be used in a standard OLS regression analysis.
In Table 2, we find that the average daily turnover is equal to CHF 1,299,604.32. The
minimum average daily turnover is connected with the XMTCH DJ HEALTHCARE.
We notice that this ETF does not currently exist; this termination of ETF’s trading
activity could well be attributed to the lack of substantial daily turnover. In contrast,
64
A E S T I T I OM A
an
empi
rica
l lo
ok
at s
wis
s ex
chan
ge t
rade
d fu
nds
mar
ket.
Rom
potis
, G. G
. a
est
ima
tio
, th
eie
bin
ter
na
tio
na
ljo
ur
na
lo
ffi
na
nc
e, 20
12. 4
: 52-
81
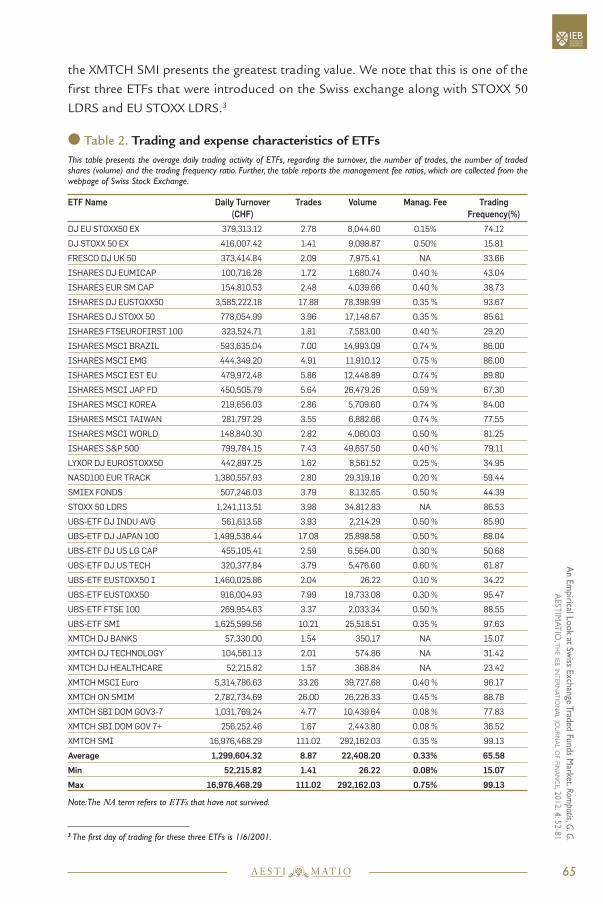
the XMTCH SMI presents the greatest trading value. We note that this is one of the
first three ETFs that were introduced on the Swiss exchange along with STOXX 50LDRS and EU STOXX LDRS.3
l Table 2. Trading and expense characteristics of ETFsThis table presents the average daily trading activity of ETFs, regarding the turnover, the number of trades, the number of tradedshares (volume) and the trading frequency ratio. Further, the table reports the management fee ratios, which are collected from thewebpage of Swiss Stock Exchange.
ETF Name Daily Turnover Trades Volume Manag. Fee Trading(CHF) Frequency(%)
DJ EU STOXX50 EX 379,313.12 2.78 8,044.60 0.15% 74.12
DJ STOXX 50 EX 416,007.42 1.41 9,098.87 0.50% 15.81
FRESCO DJ UK 50 373,414.84 2.09 7,975.41 NA 33.66
ISHARES DJ EUMICAP 100,716.28 1.72 1,680.74 0.40 % 43.04
ISHARES EUR SM CAP 154,810.53 2.48 4,039.66 0.40 % 38.73
ISHARES DJ EUSTOXX50 3,585,222.18 17.88 78,398.99 0.35 % 93.67
ISHARES DJ STOXX 50 778,054.99 3.96 17,148.67 0.35 % 85.61
ISHARES FTSEUROFIRST 100 323,524.71 1.81 7,583.00 0.40 % 29.20
ISHARES MSCI BRAZIL 593,635.04 7.00 14,993.09 0.74 % 86.00
ISHARES MSCI EMG 444,349.20 4.91 11,910.12 0.75 % 86.00
ISHARES MSCI EST EU 479,972.48 5.86 12,448.89 0.74 % 89.80
ISHARES MSCI JAP FD 450,505.79 5.64 26,479.26 0.59 % 67.30
ISHARES MSCI KOREA 219,656.03 2.86 5,709.60 0.74 % 84.00
ISHARES MSCI TAIWAN 281,797.29 3.55 6,882.66 0.74 % 77.55
ISHARES MSCI WORLD 148,840.30 2.82 4,060.03 0.50 % 81.25
ISHARES S&P 500 799,784.15 7.43 49,657.50 0.40 % 79.11
LYXOR DJ EUROSTOXX50 442,897.25 1.62 8,561.52 0.25 % 34.95
NASD100 EUR TRACK 1,380,557.93 2.80 29,319.16 0.20 % 59.44
SMIEX FONDS 507,246.03 3.79 8,132.65 0.50 % 44.39
STOXX 50 LDRS 1,241,113.51 3.98 34,812.83 NA 86.53
UBS-ETF DJ INDU AVG 561,613.58 3.93 2,214.29 0.50 % 85.90
UBS-ETF DJ JAPAN 100 1,499,536.44 17.08 25,898.58 0.50 % 88.04
UBS-ETF DJ US LG CAP 455,105.41 2.59 6,564.00 0.30 % 50.68
UBS-ETF DJ US TECH 320,377.84 3.79 5,476.60 0.60 % 61.87
UBS-ETF EUSTOXX50 I 1,460,025.86 2.04 26.22 0.10 % 34.22
UBS-ETF EUSTOXX50 916,004.93 7.99 19,733.08 0.30 % 95.47
UBS-ETF FTSE 100 269,954.63 3.37 2,033.34 0.50 % 88.55
UBS-ETF SMI 1,625,599.56 10.21 25,518.51 0.35 % 97.63
XMTCH DJ BANKS 57,330.00 1.54 350.17 NA 15.07
XMTCH DJ TECHNOLOGY 104,561.13 2.01 574.86 NA 31.42
XMTCH DJ HEALTHCARE 52,215.82 1.57 368.84 NA 23.42
XMTCH MSCI Euro 5,314,786.63 33.26 39,727.68 0.40 % 96.17
XMTCH ON SMIM 2,782,734.69 26.00 26,226.33 0.45 % 88.78
XMTCH SBI DOM GOV3-7 1,031,769.24 4.77 10,439.64 0.08 % 77.83
XMTCH SBI DOM GOV 7+ 256,252.46 1.67 2,443.80 0.08 % 36.52
XMTCH SMI 16,976,468.29 111.02 292,162.03 0.35 % 99.13
Average 1,299,604.32 8.87 22,408.20 0.33% 65.58
Min 52,215.82 1.41 26.22 0.08% 15.07
Max 16,976,468.29 111.02 292,162.03 0.75% 99.13
Note: The NA term refers to ETFs that have not survived.
65
A E S T I T I OM A
an em
pirical loo
k at swiss exchange traded funds m
arket. Rom
potis, G. G
. a
estim
at
io, t
he
iebin
ter
na
tio
na
ljo
ur
na
lo
ffin
an
ce, 2012. 4
: 52-813 The first day of trading for these three ETFs is 1/6/2001.

Besides the daily turnover, the numbers of trades and the volume of shares also reflect
the marketability of ETFs. The average values of these variables are respectively 8.87and 22,408.20. The maximum values of these factors reconfirm the trading superiority
of XMTCH SMI.
The mean management fee ratio of 32 existed ETFs is equal to 33 b.p. Unfortunately,
the data about the fees for four ETFs that no longer exist are not available. The lowest
ETF expense ratios are these of the bond ETFs whose fee ratio amounts to 8 b.p. The
highest fee ratios are associated with the ETFs which track the international indexes
of Morgan Stanley. Finally, regarding the percentage trading frequency, it ranges from
15.07% to 99.13%, while the average trading frequency is 65.58%.
4.2 Regression AnalysisIn this section, we present the results of the time-series performance regression (4) in
Table 3. The mean alpha estimate of the entire ETF sample is negative and statistically
significant at the 5% level or better. However, only two of the 36 ETFs have alphas
statistically different from zero at the 10% level. This finding is in accordance with
our expectations, since all of the sample’s ETFs are passive indexers and they do not
have any material trading flexibility to produce superior returns than their indexes.
l Table 3. Performance Regression Results
Rpt = αi + βi Rbt + εpt (4)
This table presents the results of performance regression. Particularly, we regress the ETF’s daily return on the return of the un-derlying index.
ETF Name α T-stat β T-stat R2 Heteroske Lags Obs.dasticity Test
DJ EU STOXX50 EX 0.01 0.52 1.01 0.39 0.62 0.46 4 542
DJ STOXX 50 EX 0.04 0.87 0.91 -1.47 0.80 0.03^ 3 101
FRESCO DJ UK 50 -0.01 -0.29 0.96 -1.00 0.59 0.41 3 341
ISHARES DJ EUMICAP 0.01 0.50 0.95*** -1.76 0.88 0.67 2 136
ISHARES EUR SM CAP -0.03 -0.78 1.05 1.22 0.79 0.31 2 122
ISHARES DJ EUSTOXX50 0.00 0.06 1.01 0.51 0.75 0.77 3 681
ISHARES DJ STOXX 50 0.01 0.49 0.90* -3.85 0.58 0.01^ 3 589
ISHARES FTSEUROFIRST 100 0.02 0.64 0.92 -1.43 0.70 0.61 3 99
ISHARES MSCI BRAZIL -0.08 -0.41 0.88 -1.42 0.48 0.00^ 2 43
ISHARES MSCI EMG -0.19*** -1.87 0.72* -3.34 0.64 0.92 3 43
ISHARES MSCI EST EU -0.22 -1.33 0.93 -1.14 0.84 0.52 0 44
ISHARES MSCI JAP FD 0.06 0.98 0.68* -5.84 0.42 0.54 1 214
ISHARES MSCI KOREA -0.17 -0.99 0.71** -2.55 0.49 0.38 0 42
ISHARES MSCI TAIWAN -0.21 -1.32 0.85 -1.28 0.59 0.91 0 38
ISHARES MSCI WORLD -0.18 -1.28 0.71 -1.56 0.28 0.14 0 39
ISHARES S&P 500 0.01 0.29 0.32* -8.42 0.52 0.02^ 1 390
LYXOR DJ EUROSTOXX50 0.01 0.35 1.03 0.67 0.79 0.08 1 108
NASD100 EUR TRACK 0.00 0.03 0.71* -4.33 0.29 0.04^ 1 255
SMIEX FONDS 0.01 1.04 0.96*** -1.87 0.78 0.00^ 4 534
66I N T E R N AT I O N A L
J O U R N A L O F F I N A N C E
A E S T I T I OM ATHE I E B
an
empi
rica
l lo
ok
at s
wis
s ex
chan
ge t
rade
d fu
nds
mar
ket.
Rom
potis
, G. G
. a
est
ima
tio
, th
eie
bin
ter
na
tio
na
ljo
ur
na
lo
ffi
na
nc
e, 20
12. 4
: 52-
81

STOXX 50 LDRS 0.03*** 1.81 1.01* 0.43 0.77 0.14 4 289
UBS-ETF DJ INDU AVG -0.02 -0.73 0.76* -4.70 0.21 0.00^ 4 981
UBS-ETF DJ JAPAN 100 -0.04 -0.71 1.06 1.59 0.84 0.32 1 1038
UBS-ETF DJ US LG CAP -0.03 -0.81 0.80* -2.98 0.26 0.00^ 3 740
UBS-ETF DJ US TECH -0.03 -0.84 0.81* -3.87 0.31 0.00^ 4 902
UBS-ETF EUSTOXX50 I 0.07 1.07 0.63* -3.43 0.34 0.00^ 3 128
UBS-ETF EUSTOXX50 0.01 1.00 1.02 1.16 0.76 0.00^ 1 991
UBS-ETF FTSE 100 0.02 0.63 0.82** -2.54 0.59 0.36 3 116
UBS-ETF SMI 0.01 1.29 0.92* -4.75 0.79 0.03^ 4 618
XMTCH DJ BANKS -0.07 -0.66 0.88 -1.63 0.79 0.01^ 1 107
XMTCH DJ TECHNOLOGY -0.10 -1.01 0.84* -3.01 0.48 0.95 2 225
XMTCH DJ HEALTHCARE -0.14 -1.43 0.76** -1.99 0.33 0.00^ 2 167
XMTCH MSCI Euro -0.01 -0.29 0.84* -4.52 0.53 0.00^ 2 903
XMTCH ON SMIM 0.00 0.49 1.00 0.00 0.91 0.00^ 4 372
XMTCH SBI DOM GOV3-7 0.04 0.73 1.08 1.15 0.35 0.00^ 4 502
XMTCH SBI DOM GOV 7+ 0.01 0.90 1.09 0.87 0.40 0.00^ 3 233
XMTCH SMI 0.00 0.42 0.97 -0.78 0.81 0.79 1 1257
Average -0.03 -0.02 0.88 -1.87 0.59 0.26 2 386.94
t-test -2.48** -4.78* -11.77*
Note:
The t-tests of the entire alpha and beta columns test the hypothesis whether the average alpha and beta are statistically different
from zero. The t-test for R 2 column reflects the possibility the average R 2 to be statistically different from unity.
For Heteroskedasticity the reported values are the probabilities on the significance of the relevant F-statistics. Lags refer to the ARs in-
cluded in the model for the correction of autocorrelation.
* Statistically significant at the 1% level. **Statistically significant at the 5% level. ***Statistically significant at the 10% level.
^ Heteroskedasticity corrected with White correction.
In contrast to alpha values, the estimations of all beta coefficients are economically
significant and statistically differ from zero at the 1% level. The mean measurement
of beta is equal to 0.88, indicating that the sample’s ETFs, on average, are more
conservative in comparison to their related benchmarks. Furthermore, t-statistics
indicate that a good number of ETF betas are different from unity. This result suggests
that many Swiss ETFs do not follow a full replication strategy. Possibly, this
insufficient replication of indexes explains partially the underperformance of ETFs
relative to the corresponding index returns which was discussed in subsection 7.1.
Viewing the individual beta estimations, we see that the most substantial beta
deviation from unity concerns mainly the ETFs which track the international capital
indexes of Morgan Stanley. Moreover, the S&P 500 index, the Nasdaq 100 index and
some of the Dow Jones sector indexes seem to not be fully replicated by the relevant
ETFs. This fact implies that the regional, geographic and time differences between
the Swiss listed ETFs and their corresponding indexes restrict ETFs from efficient
replication of index portfolios.
As a last examination of ETFs replication policy, we use the value of R-square. The
average R-square is 0.59, which implies a very good regression fit. On the other hand,
the difference of the average R-square from unity, statistically significant at the 1%
level, indicates that Swiss ETFs are not fully invested on the assets of their underlying
67I N T E R N AT I O N A L
J O U R N A L O F F I N A N C E
A E S T I T I OM ATHE I E B
an em
pirical loo
k at swiss exchange traded funds m
arket. Rom
potis, G. G
. a
estim
at
io, t
he
iebin
ter
na
tio
na
ljo
ur
na
lo
ffin
an
ce, 2012. 4
: 52-81

index portfolio. The size of the average R-square confirms the deviation of ETFs
components from those of their respective indexes.
When it comes to the value of the results just presented, we should refer to the results
of the Heteroskedasticity test applied as well as the number of lags included in the model
for the correction of autocorrelation in returns when necessary. Heteroskedasticity was
corrected in 18 out of 36 cases with the White method while the average number of
lags used for the correction of autocorrelation is two. Therefore, our results are
meaningful and powerful in any statistical sense.
4.3 Tracking ErrorThis segment of the study presents the three different estimates of the tracking error
in Table 4. The first three columns show the results of each one of the three types and
the fourth column is the average tracking error of the three estimates. The last column
exhibits the number of trading observations for each one of the ETFs in the sample.
l Table 4. Trading and expense characteristics of ETFsThis table presents the estimations of Tracking Error, which reflects the deviation between the return of ETFs and their underlyingindexes. We apply three distinct methods in tracking error estimating, labeling them as TE1, TE2, and TE3.
AverageETF Name TE1 TE2 TE3 TE(1+2+3) Obs.
DJ EU STOXX50 EX 0.72 0.60 0.89 0.74 542
DJ STOXX 50 EX 0.81 0.70 0.80 0.77 101
FRESCO DJ UK 50 1.56 1.26 1.73 1.52 341
ISHARES DJ EUMICAP 0.51 0.44 0.60 0.52 136
ISHARES EUR SM CAP 0.79 0.62 0.88 0.76 122
ISHARES DJ EUSTOXX50 0.49 0.39 0.55 0.48 681
ISHARES DJ STOXX 50 0.58 0.50 0.67 0.58 589
ISHARES FTSEUROFIRST 100 0.70 0.64 0.84 0.73 99
ISHARES MSCI BRAZIL 2.69 2.05 3.14 2.63 43
ISHARES MSCI EMG 0.95 0.76 1.09 0.93 43
ISHARES MSCI EST EU 1.11 0.90 1.11 1.04 44
ISHARES MSCI JAP FD 1.06 0.88 1.20 1.05 214
ISHARES MSCI KOREA 1.12 0.92 1.20 1.08 42
ISHARES MSCI TAIWAN 0.95 0.83 0.96 0.91 38
ISHARES MSCI WORLD 0.88 0.69 0.90 0.82 39
ISHARES S&P 500 1.03 0.95 1.22 1.07 390
LYXOR DJ EUROSTOXX50 0.66 0.58 0.79 0.68 108
NASD100 EUR TRACK 1.24 1.10 1.40 1.25 255
SMIEX FONDS 0.82 0.70 1.10 0.87 534
STOXX 50 LDRS 1.21 1.15 1.52 1.29 289
UBS-ETF DJ INDU AVG 1.54 1.28 1.78 1.53 981
UBS-ETF DJ JAPAN 100 0.81 0.74 0.96 0.84 1038
UBS-ETF DJ US LG CAP 1.80 1.39 1.99 1.73 740
UBS-ETF DJ US TECH 2.11 1.74 2.59 2.15 902
UBS-ETF EUSTOXX50 I 1.07 0.87 1.25 1.06 128
UBS-ETF EUSTOXX50 0.81 0.71 0.97 0.83 991
UBS-ETF FTSE 100 0.74 0.71 0.93 0.79 116
68I N T E R N AT I O N A L
J O U R N A L O F F I N A N C E
A E S T I T I OM ATHE I E B
an
empi
rica
l lo
ok
at s
wis
s ex
chan
ge t
rade
d fu
nds
mar
ket.
Rom
potis
, G. G
. a
est
ima
tio
, th
eie
bin
ter
na
tio
na
ljo
ur
na
lo
ffi
na
nc
e, 20
12. 4
: 52-
81

UBS-ETF SMI 0.33 0.30 0.41 0.35 618
XMTCH DJ BANKS 1.60 1.36 1.75 1.57 107
XMTCH DJ TECHNOLOGY 2.13 1.91 2.44 2.16 225
XMTCH DJ HEALTHCARE 1.89 1.67 2.08 1.88 167
XMTCH MSCI Euro 0.86 0.68 0.90 0.81 903
XMTCH ON SMIM 0.26 0.25 0.33 0.28 372
XMTCH SBI DOM GOV3-7 0.19 0.08 0.20 0.16 502
XMTCH SBI DOM GOV 7+ 0.47 0.24 0.51 0.41 233
XMTCH SMI 0.60 0.28 0.78 0.55 1257
Average 1.03 0.86 1.18 1.02 386.94
Min 0.19 0.08 0.20 0.16 38
Max 2.69 2.05 3.14 2.63 1,257.00
Note: TE1 refers to the standard errors of regression (4). TE2 is the average of the absolute return difference between ETF andindex. TE3 is the standard deviation of the return difference between ETF and index.
Depending on the method of estimation, the average tracking error ranges from 0.86
to 1.18. The mean tracking error of the three estimates is equal to 1.02 considered to
be significant, reflecting the substantial deviation in the performance of the ETFs and
the corresponding indexes.
The existence of large tracking errors is partially attributed to the inadequate replication
of index components by Swiss ETFs. It may also be attributed to the trading infrequency
of some ETFs.4 Regarding individual ETFs, the minimum tracking error concerns XMTCH
SBI DOM GOV3-7, which tracks the DOM GOV3-7 bond index. The mean tracking
error of this ETF counts for 16 b.p. The fact that a bond ETF, in relevance to the equity
ETFs, presents the minimum tracking error is reasonable, since a bond index’s price
exhibits lower fluctuation than an equity index. From the bundle of equity ETFs, XMTCH
ON SMIM is the best tracker, with an average tracking error of 28 b.p. In parallel, the
percentage trading frequency of XMTCH ON SMIM in Table 3 reaches 89%, suggesting
that trading frequency is likely to reduce the tracking error.
The maximum tracking error relates to ETFs that track non-European indexes.
Specifically, the weakest tracker of the sample is the Barclay’s iShares which tracks the
Brazilian index of Morgan Stanley. The average tracking error of this ETF is significantly
high and counts for 263 b.p. and the large trading frequency of iShares MSCI BRAZIL
does not seem to assist in a better replication of the tracking index’s return.
The fact that the ETFs tracking non-European indexes are associated with large
tracking error is not surprising, since the international ETFs face some restrictions
that negatively influence ETF efforts to replicate their benchmark’s performance. Chief
among these restrictions is the time delay between the European and the US and
69I N T E R N AT I O N A L
J O U R N A L O F F I N A N C E
A E S T I T I OM ATHE I E B
an em
pirical loo
k at swiss exchange traded funds m
arket. Rom
potis, G. G
. a
estim
at
io, t
he
iebin
ter
na
tio
na
ljo
ur
na
lo
ffin
an
ce, 2012. 4
: 52-81
4 We applied a single cross-sectional regression of tracking error estimations on the records of trading frequency. The coefficient oftrading frequency was negative being in line with our assumption, but the statistical significance of estimation was weak.

Asian markets. The time delay results in a lag in formations’ inflow, which constrains
the trading ability of ETFs. Further, the international ETFs are associated with greater
management fee ratios. In the following section, we report statistical evidence that
confirm the direct relationship between tracking error and expenses.
4.4 Performance, Expenses, Risk and Tracking ErrorThe influence of expenses on ETF performance is crucial. In Table 5 we report the
results of a single cross-sectional regression of ETF percentage return on management
fees. The results show a negative impact of expenses on performance with a regression
coefficient of -0.35, statistically significant at the 1% level. This finding means that
an increase of expenses per one unit results in a reduction of the return by 0.35 units.
It should be noted that the results do not suffer from any Heteroskedasticity,
autocorrelation and ARCH effect bias as indicated by the reported relevant figures in
Table 5. In addition to the regression, we have also performed a Granger Causality
Test in order to determine if the one variable is useful in forecasting the other. The
results show that no such issue exists.
l Table 5. Performance, Tracking Error, Risk and Management Fees of ETFs
This table presents the estimations of various cross section regressions between return, tracking error, risk, and management fees of ETFs.
Estimated Model α T-stat β T-stat R2 Heteros Autocor LM Numberkedasticity relation ARCH of
Test Test Test funds
Ri = ai + bi MFi + εi 0.18* 3.42 -0.35* -3.08 0.25 0.74 0.84 0.65 31
Granger Causality Test Results
Null Hypothesis F-Statistic Probability
MF does not Granger Cause R 0.47 0.63
R does not Granger Cause MF 0.29 0.75
TE1i = ai + bi MFi + εi 0.42*** 2.03 1.18** 2.63 0.19 0.34 0.43 0.76 31
TE2i = ai + bi MFi + εi 0.33*** 1.99 1.00* 2.82 0.22 0.48 0.17 0.68 31
TE3i = ai + bi MFi + εi 0.52** 2.09 1.28** 2.40 0.17 0.21 0.36 0.79 31
Average 0.42 2.04 1.15 2.62 0.19 0.34 0.32 0.74 31
Granger Causality Test Results
Null Hypothesis F-Statistic Probability
MF does not Granger Cause TE1 0.13 0.88
TE1 does not Granger Cause MF 0.88 0.43
MF does not Granger Cause TE2 0.16 0.85
TE2 does not Granger Cause MF 0.71 0.50
MF does not Granger Cause TE3 0.23 0.80
TE3 does not Granger Cause MF 0.60 0.56
MFi = ai + bi RISKi + εi 0.22* 2.84 0.15* 3.44 0.46 0.88 0.76 0.34 31
Granger Causality Test Results
Null Hypothesis F-Statistic Probability
RISK does not Granger Cause MF 0.54 0.59
MF does not Granger Cause RISK 0.31 0.74
70I N T E R N AT I O N A L
J O U R N A L O F F I N A N C E
A E S T I T I OM ATHE I E B
an
empi
rica
l lo
ok
at s
wis
s ex
chan
ge t
rade
d fu
nds
mar
ket.
Rom
potis
, G. G
. a
est
ima
tio
, th
eie
bin
ter
na
tio
na
ljo
ur
na
lo
ffi
na
nc
e, 20
12. 4
: 52-
81

TE1i = ai + bi RISKi + εi -0.08 -0.53 0.69* 5.84 0.70 0.65 0.80 0.70 31
TE2i = ai + bi RISKi + εi -0.04 -0.34 0.55* 6.34 0.68 0.53 0.44 0.52 31
TE3i = ai + bi RISKi + εi -0.09 -0.49 0.79* 5.04 0.68 0.59 0.99 0.59 31
Average -0.07 -0.45 0.68 5.74 0.69 0.59 0.74 0.60 31
Granger Causality Test Results
Null Hypothesis F-Statistic Probability
RISK does not Granger Cause TE1 0.36 0.70
TE1 does not Granger Cause RISK 0.52 0.60
RISK does not Granger Cause TE2 0.48 0.62
TE2 does not Granger Cause RISK 0.58 0.57
RISK does not Granger Cause TE3 0.28 0.76
TE3 does not Granger Cause RISK 0.64 0.54
Note:R is the average daily return of ETFs.MF represents the management fee ratio of ETFs.TE1 is the tracking error defined as the standard errors of regression (4).TE2 is the tracking error defined as the average of the absolute return difference between ETF and its corresponding index.TE3 is the tracking error defined as the standard deviation of the return difference between ETF and its corresponding index.RISK is the standard deviation of daily returns.For Heteroskedasticity, autocorrelation (serial correlation LM test) and ARCH effect the reported values are the probabilities on the
significance of the relevant F-statistics. *Statistical significant at the 1% level. **Statistical significant at the 5% level. ***Statistical significant at the 10% level.
Prior literature considers that a large part of the tracking error is due to ETF expenses.
To examine the magnitude of management fees’ effect on ETFs tracking error, we
apply a single model of tracking error’s estimations on the management fee ratio
(MF). We run the regression separately for each one of the three estimation methods
of tracking error. The results in Table 6 indicate that management fees affect positively
the size of tracking error with statistical significance at the 1% or 5% level. The average
regression estimation is equal to 1.15, implying that the management fees count for
a large slice of ETFs tracking error.5 It should be pointed out that the results on the
relationship between tracking error and expenses do not suffer from any
Heteroskedasticity, autocorrelation and ARCH effect bias as indicated by the reported
relevant figures in Table 5. Going further, the results of the Granger Causality Test
performed between management fees and tracking error reveal that there is no such
kind of relation between these factors.
Next, we introduce the risk of an ETF’s return as a basic determinant of management
expenses. We investigate the relation between risk and expenses by regressing the
management fee of ETFs against the return’s standard deviation (RISK). According
to the results, the coefficient of risk which is statistically significant at the 1% level is
equal to 0.15, implying that when the risk of an investment increases the investor
bears increased administrative expenses. The results of the Heteroskedasticity,
autocorrelation and ARCH effect tests indicate the lack of any such issue. Moreover,
the outcomes of the Granger Causality Test demonstrate that there is no such
relationship between risk and expenses.
71I N T E R N AT I O N A L
J O U R N A L O F F I N A N C E
A E S T I T I OM ATHE I E B
an em
pirical loo
k at swiss exchange traded funds m
arket. Rom
potis, G. G
. a
estim
at
io, t
he
iebin
ter
na
tio
na
ljo
ur
na
lo
ffin
an
ce, 2012. 4
: 52-81
5 The average regression coefficient of the three regressions is approximately equal to the regression estimation when we regress theaverage three types of ETFs tracking error.
In the last step, we explore the relationship between ETFs tracking error and risk by
regressing the three tracking error measurements to the standard deviation of ETFs
returns. According to the results, the coefficients of risks are significant at the 1%
level. The average estimation of beta is 0.68, suggesting that the presence of risk
affects the replication ability of ETFs. The results of the Heteroskedasticity,
autocorrelation and ARCH effect tests indicate the lack of any such impact on the
examined set of variables. In addition to these results, the Granger Causality Test
applied results in no causality impact from tracking error to risk and vice versa.
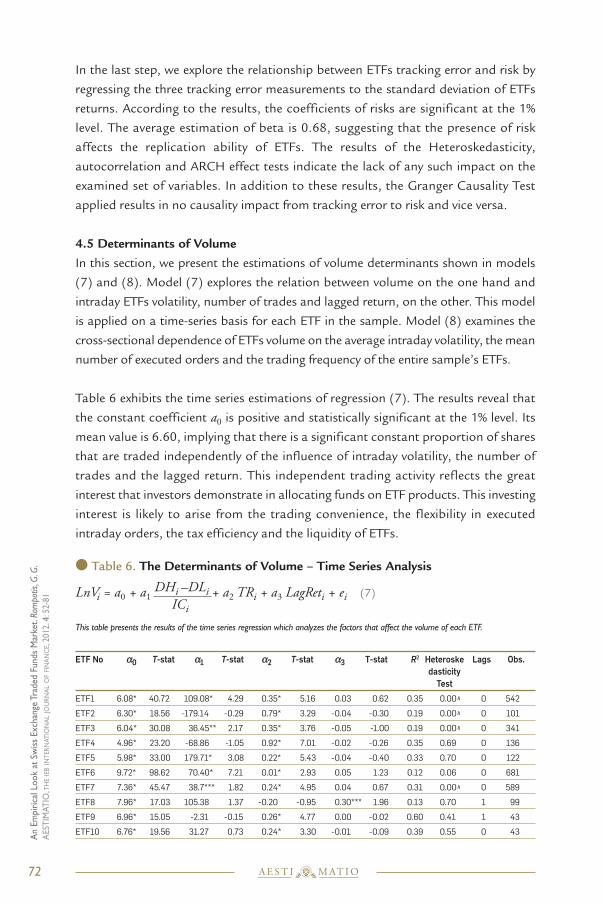
4.5 Determinants of VolumeIn this section, we present the estimations of volume determinants shown in models
(7) and (8). Model (7) explores the relation between volume on the one hand and
intraday ETFs volatility, number of trades and lagged return, on the other. This model
is applied on a time-series basis for each ETF in the sample. Model (8) examines the
cross-sectional dependence of ETFs volume on the average intraday volatility, the mean
number of executed orders and the trading frequency of the entire sample’s ETFs.
Table 6 exhibits the time series estimations of regression (7). The results reveal that
the constant coefficient a0 is positive and statistically significant at the 1% level. Its
mean value is 6.60, implying that there is a significant constant proportion of shares
that are traded independently of the influence of intraday volatility, the number of
trades and the lagged return. This independent trading activity reflects the great
interest that investors demonstrate in allocating funds on ETF products. This investing
interest is likely to arise from the trading convenience, the flexibility in executed
intraday orders, the tax efficiency and the liquidity of ETFs.
l Table 6. The Determinants of Volume – Time Series Analysis
LnVi = a0 + a1DHi –DLi + a2 TRi + a3 LagReti + ei (7)
ICi
This table presents the results of the time series regression which analyzes the factors that affect the volume of each ETF.
ETF No α0 T-stat α1 T-stat α2 T-stat α3 T-stat R2 Heteroske Lags Obs.dasticityTest
ETF1 6.08* 40.72 109.08* 4.29 0.35* 5.16 0.03 0.62 0.35 0.00^ 0 542
ETF2 6.30* 18.56 -179.14 -0.29 0.79* 3.29 -0.04 -0.30 0.19 0.00^ 0 101
ETF3 6.04* 30.08 36.45** 2.17 0.35* 3.76 -0.05 -1.00 0.19 0.00^ 0 341
ETF4 4.96* 23.20 -68.86 -1.05 0.92* 7.01 -0.02 -0.26 0.35 0.69 0 136
ETF5 5.98* 33.00 179.71* 3.08 0.22* 5.43 -0.04 -0.40 0.33 0.70 0 122
ETF6 9.72* 98.62 70.40* 7.21 0.01* 2.93 0.05 1.23 0.12 0.06 0 681
ETF7 7.36* 45.47 38.7*** 1.82 0.24* 4.95 0.04 0.67 0.31 0.00^ 0 589
ETF8 7.96* 17.03 105.38 1.37 -0.20 -0.95 0.30*** 1.96 0.13 0.70 1 99
ETF9 6.96* 15.05 -2.31 -0.15 0.26* 4.77 0.00 -0.02 0.60 0.41 1 43
ETF10 6.76* 19.56 31.27 0.73 0.24* 3.30 -0.01 -0.09 0.39 0.55 0 43
72I N T E R N AT I O N A L
J O U R N A L O F F I N A N C E
A E S T I T I OM ATHE I E B
an
empi
rica
l lo
ok
at s
wis
s ex
chan
ge t
rade
d fu
nds
mar
ket.
Rom
potis
, G. G
. a
est
ima
tio
, th
eie
bin
ter
na
tio
na
ljo
ur
na
lo
ffi
na
nc
e, 20
12. 4
: 52-
81

ETF11 7.33* 32.31 4.07 0.58 0.25* 6.64 0.05 1.10 0.62 0.40 0 44
ETF12 8.14* 47.90 51.39* 2.61 0.17* 6.43 0.03 0.63 0.48 0.00^ 2 214
ETF13 6.13* 15.66 34.57 0.89 0.49* 3.96 -0.03 -0.21 0.37 0.33 0 42
ETF14 6.47* 13.15 56.59 1.11 0.34* 3.20 0.02 0.12 0.37 0.01^ 0 38
ETF15 5.66* 26.77 128.1** 2.63 0.39* 6.82 0.19 1.37 0.72 0.72 0 39
ETF16 8.21* 53.19 266.69* 7.70 0.02*** 1.76 0.07 0.73 0.34 0.00^ 1 390
ETF17 5.11* 15.69 53.69 0.78 1.06* 6.05 -0.05 -0.33 0.34 0.80 0 108
ETF18 6.31* 27.55 23.55 0.70 0.72* 10.56 0.00 0.02 0.40 0.01^ 0 255
ETF19 6.96* 56.92 93.388* 4.90 0.04* 4.35 -0.03 -0.52 0.14 0.06 1 534
ETF20 7.60* 37.16 33.41* 2.78 0.15* 2.68 0.01 0.15 0.30 0.00^ 1 289
ETF21 6.84* 49.88 21.34** 2.41 0.00 -0.14 -0.03 -0.99 0.08 0.99 4 981
ETF22 6.19* 24.21 1.50 0.05 0.35* 4.13 -0.08 -1.33 0.37 0.00^ 1 1038
ETF23 5.84* 48.18 14.68 1.27 0.38* 8.85 -0.04 -1.00 0.28 0.00^ 1 740
ETF24 6.23* 69.80 27.89* 4.05 0.23* 8.76 0.01 0.38 0.38 0.00^ 4 902
ETF25 1.73* 12.08 39.98 0.89 0.10* 3.37 -0.25** -2.52 0.18 0.00^ 0 128
ETF26 7.76* 65.71 4.16 0.92 0.14* 13.43 0.03 1.32 0.33 0.46 0 991
ETF27 4.79* 20.49 52.7*** 1.94 0.35* 5.23 0.00 -0.03 0.36 0.00^ 0 116
ETF28 8.22* 57.96 -5.40 -0.65 0.10* 10.19 -0.10 -1.52 0.26 0.00^ 4 618
ETF29 5.59* 19.03 -13.97 -0.46 -0.46** -2.45 -0.03 -0.73 0.11 0.20 0 107
ETF30 4.62* 32.63 26.73** 2.19 0.25* 4.99 0.00 0.12 0.27 0.87 1 225
ETF31 4.11* 23.38 -25.55 -1.09 0.61* 5.15 0.02 0.44 0.19 0.79 0 167
ETF32 8.15* 49.60 4.89 0.97 0.04* 10.85 -0.02 -0.46 0.36 0.00^ 2 903
ETF33 9.31* 66.53 11.33 1.02 0.01*** 1.84 0.08 1.31 0.11 0.00^ 4 372
ETF34 6.33* 37.97 68.23 0.78 0.22* 6.98 -0.32 -1.02 0.27 0.89 2 502
ETF35 4.96* 24.73 6.46 0.12 0.68* 6.15 -0.25 -1.37 0.18 0.94 0 233
ETF36 10.88* 114.9 0.26 0.10 0.01* 18.91 -0.02 -1.64 0.57 0.00^ 0 1257
Average 6.60 38.5 36.15 1.62 0.27 5.51 -0.01 -0.10 0.32 0.29 1 387
Note:LnVi is the natural logarithm of the daily shares volume of ETFi . DHi is the daily intraday high price of ETFi . DIi is the daily intraday low price of ETFi . ICi is the daily closing price of ETFi . TRi is the daily number of trades of ETFi . LagReti is the one-lagged return of ETFi . For Heteroskedasticity the reported values are the probabilities on the significance of the relevant F-statistics. Lags refer to the ARs in-
cluded in the model for the correction of autocorrelation. *Statistically significant at the 1% level. **Statistically significant at the 5% level. ***Statistically significant at the 10% level.^Heteroskedasticity corrected with White correction.
The mean of the α1 coefficient of regression (7) is positive and equal to 36.15,
indicating a positive influence of intraday volatility on the determination of ETFs
volume. Looking at the statistical importance of the estimations, we see that a
sufficient number of the individual α1 coefficients are positive and statistically
significant at the 1%, 5% or 10% level. Furthermore, the majority of the non-significant
estimations are also positive, confirming the positive influence of volatility to volume.
In accordance with our expectations, the coefficients of the number of trades are
positive and statistically significant at the 1% level. The mean of α2 coefficient of
model (7) is equal to 0.27, indicating that an increase of the executed orders by one
unit, on the average, could increase ETFs volume by 0.27 units.
Concerning the lagged return’s coefficient α3 , there is no statistical evidence that the
previous trading day affect the magnitude of ETFs volume. The significance of the
73I N T E R N AT I O N A L
J O U R N A L O F F I N A N C E
A E S T I T I OM ATHE I E B
an em
pirical loo
k at swiss exchange traded funds m
arket. Rom
potis, G. G
. a
estim
at
io, t
he
iebin
ter
na
tio
na
ljo
ur
na
lo
ffin
an
ce, 2012. 4
: 52-81

estimations is poor, suggesting that the previous return does not sufficiently motivate
the investors to trade on an ETF. This finding is in line with the nature of ETFs whereby
investors can trade freely within the day and not only at the end of the day as it is the
case with conventional mutual funds. As a result, the previous day price change carries
no significant information that may bolster trading during the day. Finally, the
R-square of all time-series regressions are significant with an overall average of 0.32implying a good regression fit.
As far as the value of the reported regression results on the determination of volume
is concerned, we should refer to the results of the Heteroskedasticity test applied as
well as the number of lags included in the model for the correction of autocorrelation
in the regression’s results when necessary. Heteroskedasticity was corrected in 18 out
of 36 cases with the White method whereas, on average, we had to use one lag to
correct autocorrelation. Autocorrelation was an issue in 15 out of 36 cases. Given
the corrections we made, our results are meaningful in statistical sense.
The cross-sectional estimations of regression (8) are presented in Table 7. Viewing the
regression results of Table 7, we see that the constant coefficient b0 is equal to 6.52
and is statistically significant at the 1% level. This value is just 8 b.p. less than the average
a0 on Table 7. So, we reconfirm that there is a definite trading activity of ETFs not related
to other factors but due probably to their unique trading characteristics.
l Table 7. The Determinants of Volume – Cross-sectional Analysis
LnVi = b0 + b1DHi –DLi + b2 TRi + b3 FREQi + ui (8)
ICi
This table presents the results of the cross-sectional regression, which combines the factors that affect the average volume of thesample’s ETFs.
PANEL A: Regression Results
Variable Coefficient T-statistic
Constant 6.52* 10.99
ETFs Volatility -23.82 -0.31
Number of Trades 0.03** 2.19
Trading Frequency 0.03* 3.11
R2 0.48
Heteroskedasticity Test 0.71
Autocorrelation Test 0.40
LM ARCH Τest 0.46
Obs. 36
PANEL B: Granger Causality Test Results
Null Hypothesis F-Statistic Probability
LNVOLU does not Granger Cause ETFVOL 1.57 0.23
TRADES does not Granger Cause LNVOLU 0.90 0.42
LNVOLU does not Granger Cause TRADES 0.73 0.49
FREQ does not Granger Cause LNVOLU 0.02 0.98
LNVOLU does not Granger Cause FREQ 0.96 0.39
74I N T E R N AT I O N A L
J O U R N A L O F F I N A N C E
A E S T I T I OM ATHE I E B
an
empi
rica
l lo
ok
at s
wis
s ex
chan
ge t
rade
d fu
nds
mar
ket.
Rom
potis
, G. G
. a
est
ima
tio
, th
eie
bin
ter
na
tio
na
ljo
ur
na
lo
ffi
na
nc
e, 20
12. 4
: 52-
81

TRADES does not Granger Cause ETFVOL 2.28 0.12
ETFVOL does not Granger Cause TRADES 0.72 0.49
FREQ does not Granger Cause ETFVOL 1.23 0.31
ETFVOL does not Granger Cause FREQ 0.51 0.61
FREQ does not Granger Cause TRADES 0.87 0.43
TRADES does not Granger Cause FREQ 0.40 0.68
Note:LnVi is the natural logarithm of the daily shares volume of the ith ETF.DHi is the average daily intraday high price of the ith ETF.DLi is the average daily intraday low price of the ith ETF.IC is the average daily closing price of the ith ETF.TRi is the daily number of trades of the ith ETF.FREQi is the percentage trading frequency of the ith ETF, which is expressed by the rate of trading days of an ETF to the trading days of
its benchmark index. For Heteroskedasticity, autocorrelation (serial correlation LM test) and ARCH effect the reported values are the probabilities on the signif-
icance of the relevant F-statistics. In the case of Granger Causality Test, probabilities >0.05 reflect no rejection of the null hypothesis and vice versa. * Statistically significant at the 1% level. **Statistically significant at the 5% level.
Further, the coefficient of ETFs mean intraday volatility is negative but insignificant at
any acceptable statistical level. In contrast to the adequately positive estimations of
individual ETFs in Table 6, we relate the insignificance of the cross-sectional estimation
to the fact that the intraday volatility for all ETFs in Table 7 is not entirely influential.
The statistical significance for the coefficient of the average number of trades indicates
that the increase of executed orders induce the overall volume of the sample’s ETFs.
This finding is similar to the time-series results of Table 6 although the magnitude of
estimates differs. Finally, the last determinant examined in Table 7 is the trading
frequency of ETFs. The coefficient of trading frequency is equal to 0.03 and it is
statistically significant at the 1% level, indicating that the percentage of trading
frequency is an important determinant of trading volume.
It should be noted that the regression results on the cross-sectional determination of
ETFs’ volume, we should note they are biased by any Heteroskedasticity, auto -
correlation and ARCH effect as indicated by the reported relevant figures in Table 7.
In addition to these tests, we have also performed a Granger Causality Test in order
to examine if there is any such relationship among volume, volatility, number of trades
and trading frequency. The outcomes of the tests lead us to accept the hypothesis of
non-Granger Causality among the variables.
4.6 Comparison of Swiss and US ETFsThe final researching issue of this paper concerns the comparison between Swiss and
US ETFs. The comparison is applied for a set of 10 couples of Swiss and US ETFs that
track the same indexes. The comparison’s results are reported in Table 8. The table
presents the average daily return and risk, the beta coefficients from the estimation of
model (4), the calculations of tracking error, the average daily volume, the management
fees and the number of trading observations for both Swiss and US ETFs.
75I N T E R N AT I O N A L
J O U R N A L O F F I N A N C E
A E S T I T I OM ATHE I E B
an em
pirical loo
k at swiss exchange traded funds m
arket. Rom
potis, G. G
. a
estim
at
io, t
he
iebin
ter
na
tio
na
ljo
ur
na
lo
ffin
an
ce, 2012. 4
: 52-81

l Table 8. Comparison of Swiss and US ETFs Statistic Characteristics The Table presents a quantitative comparison between Swiss and US ETFs that track the same indexes.
PANEL A
ETF Name Return Risk Beta TE1
Swiss US Underlying Index Swiss US Swiss US Swiss US Swiss US
UBS-ETF DJ INDU AVG DIA DJ INDU AVG 0.00 0.02 1.73 1.10 *0.75 *1.00 1.54 0.26
ISHARES MSCI JAP EWJ MSCI JAPAN 0.13 0.13 1.39 1.43 *0.68 *0.95 1.06 0.86
ISHARES MSCI TAIWAN EWT MSCI Taiwan -0.05 0.14 1.47 1.77 *0.85 *1.00 0.95 1.08
ISHARES MSCI BRAZIL EWZ MSCI Brazil -0.34 -0.18 3.67 3.51 *0.83 *1.06 2.52 0.89
ISHARES DJ STOXX 50 FEU DJ STOXX 50 0.05 0.07 0.90 0.96 *0.90 *0.59 0.59 0.83
ISHARES DJ EUROST 50 FEZ DJ EURO STO 50 0.06 0.05 0.98 0.87 *1.00 *0.72 0.49 0.84
ISHARES S&P 500 IVV S&P 500 0.02 0.03 1.05 0.74 *0.32 *1.01 1.03 0.14
NASD100 EUR TRACK QQQ NASDAQ 100 0.03 0.04 1.47 1.10 *0.71 *0.98 1.24 0.13
ISHARES S&P 500 RSP S&P 500 0.02 0.06 1.05 0.79 *0.32 *1.07 1.03 0.21
ISHARES S&P 500 SPY S&P 500 0.02 0.03 1.05 0.73 *0.32 *1.00 1.03 0.15
Average -0.01 0.04 1.48 1.30 0.67 0.94 1.15 0.54
T-statistic2 ***-2.07 ***2.13 **-2.31 **2.79
PANEL B
TE2 TE3 Average TE Volume Management Fee Observations1
Swiss US Swiss US Swiss US Swiss US Swiss US Swiss US
1.28 0.18 1.78 0.36 1.53 0.27 4,209.23 7,052,195.37 0.50 0.18 979 979
0.89 0.84 1.21 1.12 1.51 0.94 26,388.81 21,896,207.18 0.59 0.74 209 209
0.83 0.86 0.96 1.10 0.91 1.02 6,882.66 3,452,663.16 0.74 1.03 38 38
2.20 0.68 3.56 0.94 2.76 0.84 14,305.57 4,591,689.19 0.74 0.74 38 38
0.50 0.70 0.68 0.91 0.59 0.81 16,533.99 8,899.46 0.35 0.32 558 558
0.39 0.72 0.56 0.92 0.48 0.83 75,347.70 157,724.59 0.35 0.32 667 667
0.95 0.12 1.22 0.16 1.07 0.14 49,657.50 483,454.81 0.40 0.09 390 390
1.10 0.10 1.40 0.15 1.25 0.13 29,319.16 94,723,733.49 0.20 0.20 255 255
0.95 0.16 1.22 0.21 1.07 0.20 49,657.50 332,863.59 0.40 0.40 390 390
0.95 0.13 1.22 0.17 1.07 0.15 49,657.50 59,331,992.05 0.40 0.10 390 390
1.00 0.45 1.38 0.60 1.22 0.53 32,195.96 19,203,142.29 0.47 0.41 391.40 391.40
**2.79 **2.62 **3.02 ***-1.88 0.861 We use common daily data of real trading days in our estimations of return and risk for both Swiss and US ETFs. Real data regards
the days which record non-zero trading volume. 2 We use t-tests in order to examine if the deviations between the statistical characteristics of Swiss and US ETFs are economically
significant. * Statistically significant at the 1% level. **Statistically significant at the 5% level. ***Statistically significant at the 10% level.
We note that the records in Table 8 concerning Swiss ETFs are not similar to those the
results of Tables 1 and 2 due to the modification we implemented so that the Swiss
and US trading data can be comparable to each other avoiding any possible bias.
Regarding the percentage return, we see that the Swiss ETFs display negative average
return, while the US ETFs have positive performance. Furthermore, the performance
76I N T E R N AT I O N A L
J O U R N A L O F F I N A N C E
A E S T I T I OM ATHE I E B
an
empi
rica
l lo
ok
at s
wis
s ex
chan
ge t
rade
d fu
nds
mar
ket.
Rom
potis
, G. G
. a
est
ima
tio
, th
eie
bin
ter
na
tio
na
ljo
ur
na
lo
ffi
na
nc
e, 20
12. 4
: 52-
81

of Swiss ETFs is associated to superior standard deviation as compared to the US
competitors. The return and risk deviations between Swiss and US ETFs are
statistically significant at the 10% level. Therefore, we infer that Swiss ETFs are less
efficient, more risky and finally less preferable for a global asset allocation strategy.
The beta’s coefficients indicate that Swiss ETFs are less fully-invested in the
components of the underlying indexes in relation to the US peers. The average beta
for the ETF Swiss sample is equal to 0.67, since the mean beta for US ETFs
approximates the unity, implying a a full replication strategy. The deviation between
Swiss and US ETFs betas is significant at the 5% level. The lagged replication of Swiss
ETFs partially explains the deviation in performance between Swiss and US ETFs.
Considering tracking efficiency, the tracking errors of Swiss ETFs are higher than the
respective computations for US ETFs. The average Swiss tracking error is equal to
1.22 while the average tracking error in US ETF market is substantially lower being
equal to 0.53. Likewise, the average tracking error for Swiss ETFs derived from each
individual method is greater than the corresponding estimations for the US ETFs. The
large divergence between the tracking errors of Swiss and US ETFs is partially
attributed to the different replication strategy adopted by these investment products.
Going further, the average volume of Swiss ETFs is found to be significantly lower
than the volume of US ETFs. An average number of 32,195.96 ETF shares daily trade
on Swiss exchange. The respective figure for US ETFs equals the 19,203,142.29
shares. The difference in volumes between the two markets is statistically significant
at the 10% level.
The last trading factor considered concerns the management fees. In accordance
to the records in Table 8, the average expense ratio of Swiss ETFs is equal to 0.47%
while the mean management fee ratio of US ETFs is equal to 0.41%. The difference
of 6 b.p. in expense ratios of Swiss and US ETFs is not significant at any accepta-
ble level.
n 5. Conclusion
Most of the literature on Exchange Traded Funds focuses on US ETFs while some also
cover the Asian and Australian ETFs. This paper focuses on a European ETF market,
the Swiss ETFs. We first investigate the percentage risk and return of Swiss ETFs in
relation to the return and risk of their tracking indexes. We find that ETFs
underperform their benchmarks, while they burden their investors with greater risk
than the risk of the underlying indexes. These disparities suggest that Swiss ETFs do
77I N T E R N AT I O N A L
J O U R N A L O F F I N A N C E
A E S T I T I OM ATHE I E B
an em
pirical loo
k at swiss exchange traded funds m
arket. Rom
potis, G. G
. a
estim
at
io, t
he
iebin
ter
na
tio
na
ljo
ur
na
lo
ffin
an
ce, 2012. 4
: 52-81

not adopt full replication strategies with respect to the composition of their
benchmarks. In fact, lower than unity beta estimates suggest that while ETFs are
protected during bear markets, they do not fully replicate the benchmark’s
components, a fact that contributes to their underperformance.
Regarding the magnitude of tracking error of Swiss ETFs we find that it is substantial
to an approximate average of 1.02%. The value of tracking error is statistically
significant to any acceptable level and reflects the effect of incomplete replication on
indexes’ composition. Further, we find that the tracking error is positively related to
the management fees and the risk of ETFs.
Regarding the impact of expenses on ETFs performance, we find that expenses
influence negatively ETF investor returns. Applying regression analysis, we estimate
that a one unit increase in expenses produces a deduction of ETFs return by 0.35
units. Besides, we find that the level of ETFs management fee depend on the level of
ETF risk. As an example of this relationship, ETFs that track non-European indexes
which face the greatest risk also experience the higher risk and tracking error.
In other regression results we found that the volume of Swiss ETFs is positively affected
by the intraday price volatility, the number of trades, and the trading frequency, meaning
that an increase in these factors generates a greater volume of shares. Interestingly
enough, we also denote that the lagged return of Swiss ETFs is not a crucial determinant
of volume, in line to the ETF nature of continuous trading within the day.
Finally, we compare 10 couples of Swiss and US ETFs that track exactly the same
indexes. The main inference of this comparison is that Swiss ETF market is inferior to
the US one. More specifically, we find out that the average return of Swiss ETFs is
negative, while the performance of the respective US ETFs is positive. Moreover, Swiss
ETFs report superior risk and tracking error records than the US counterparts. They
also display less trading activity as reflected in average volumes.
Overall, the empirical findings on Swiss ETFs are in line with those reported in the
literature for other ETF markets. Like Elton et al. (2002) we find that ETFs
underperform their benchmark counterparts and that management expenses count
for a large portion of ETFs tracking error. Like Kostovetsky (2003) and Frino and
Gallagher (2001), our estimates for tracking error are large and significant and ETFs
do not fully replicate their corresponding indexes.
Furthermore, our results provide new evidence on the interactions between
performance, expenses and risk. As expected, expenses have a negative impact on
performance but they themselves are positively affected by the risk of ETFs. This
78I N T E R N AT I O N A L
J O U R N A L O F F I N A N C E
A E S T I T I OM ATHE I E B
an
empi
rica
l lo
ok
at s
wis
s ex
chan
ge t
rade
d fu
nds
mar
ket.
Rom
potis
, G. G
. a
est
ima
tio
, th
eie
bin
ter
na
tio
na
ljo
ur
na
lo
ffi
na
nc
e, 20
12. 4
: 52-
81

further suggests that the conventional ex ante positive relationship between
performance and risk emerges from the subtle influence that risk exerts on
administrative expenses. New evidence is also the finding that in the case of ETFs the
negative relationship between return and expenses is not one-for-one, as in studies
on mutual funds, but one third-for-one.
A last contribution of this paper is in identifying the factors that determine the trading
volume of ETFs. We find that a significant part of volume is due to factors unrelated
to the trading activity of each ETF or its price change on the previous day. We think
that this part of trading volume arises from the unique characteristics that make ETFs
attractive to investors.
In conclusion, we should note that this is just a first attempt of studying one emerging
ETF market such as the Swiss one. Further investigation can be devoted either on the
Swiss ETFs or, more importantly, on the German ETF market, which is the most
significant market ETF in Europe in terms of products availability, assets invested and
daily turnover. Furthermore, additional researching issues can be addressed such as
the validation of “the law of one price” in the case of ETFs written on the same indexes
but traded in different markets with different institutional frameworks, currencies and
trading hours. Finally, in this respect, limitations in international arbitrage execution
could be accentuated.
n References
n Ammann, M. and Zimmermann, H. (2001). Tracking Error and Tactical Asset Allocation, Financial
Analysts Journal 57(2), pp. 32-43.
n Ackert, F.L. and Tian, Y.S. (2000). Arbitrage and Valuation in the Market for Standard and Poor’s
Depository Receipts, Financial Management, 29(3), pp. 71-88.
n Blume, E.M. and Edelen, R.M. (2004). S&P 500 Indexers, Tracking Error and Liquidity, Journal of
Portfolio Management, 30(3), pp. 37-46.
n Carty, C.M. (2001). ETFs From A to Z, Financial Planning, May 1, pp. 102-106.
n Elton, J.E., Gruber, M.J., Comer, G. and Li, K. (2002), Spiders: Where are the Bugs?, Journal of
Business, 75(3), pp. 453-473.
n Frino, A. and Gallagher, D.R. (2001). Tracking S&P 500 Index Funds, Journal of Portfolio
Management, 28(1), pp. 44-55.
n Gastineau, L. Gary, 2001, “Exchange-Traded Funds: An Introduction”, Journal of Portfolio
Management, Vol. 27(3), pp. 88-96.
79I N T E R N AT I O N A L
J O U R N A L O F F I N A N C E
A E S T I T I OM ATHE I E B
an em
pirical loo
k at swiss exchange traded funds m
arket. Rom
potis, G. G
. a
estim
at
io, t
he
iebin
ter
na
tio
na
ljo
ur
na
lo
ffin
an
ce, 2012. 4
: 52-81
n Gastineau, L. Gary, 2004, “The Benchmark Index ETF Performance Problem”, Journal of Portfolio
Management, Vol. 30(2), pp. 96-104.
n Gallagher, R. David and Reuben Segara, 2005, “The Performance and Trading Characteristics of
Exchange-Traded Funds”, working paper, The University of New South Wales.
n Gruber, Martin J., 1996, “Another Puzzle: The Growth in Actively Managed Mutual Funds,” Journal
of Finance, Vol. 51, pp. 783-810.
n Kostovetsky, Leonard, 2003, “Index Mutual Funds and Exchange Traded Funds”, Journal of Portfolio
Management, Vol.29 (4), pp.80-92.
n Larsen Jr, Glen A. and Bruce G. Resnick, 1998, “Empirical Insights on Indexing”, Journal of Portfolio
Management, Vol. 25(1), pp. 51-60.
n Malkiel, Burton G., 1995, “Returns from Investing in Equity Mutual Funds 1971-1991,” Journal of
Finance, Vol. 50, pp. 549-572.
n Pope, F. Peter and Pradeep K. Yadav, 1994, “Discovering Errors in Tracking Error”, Journal of Portfolio
Management, Vol. 20(2), pp. 27-32.
n Poterba, M. James and John B. Shoven, 2002, “Exchange Traded Funds: A New Investment Option
for Taxable Investors”, American Economic Review, Vol. 92, pp. 422-427.
n Roll, Richard, 1992, “A Mean/Variance Analysis of Tracking Error”, Journal of Portfolio Management,
Vol. 18(4), pp.13-22.
80I N T E R N AT I O N A L
J O U R N A L O F F I N A N C E
A E S T I T I OM ATHE I E B
an
empi
rica
l lo
ok
at s
wis
s ex
chan
ge t
rade
d fu
nds
mar
ket.
Rom
potis
, G. G
. a
est
ima
tio
, th
eie
bin
ter
na
tio
na
ljo
ur
na
lo
ffi
na
nc
e, 20
12. 4
: 52-
81

n
81I N T E R N AT I O N A L
J O U R N A L O F F I N A N C E
A E S T I T I OM ATHE I E B