4 - 1 © 2001 prentice-Hall, Inc. Behavioral Statistics Discrete Random Variables Chapter 4.
41
4 - 4 - 1 1 © 2001 © 2001 prentice-Hall, prentice-Hall, Inc. Inc. Behavioral Statistics Behavioral Statistics Discrete Random Variables Discrete Random Variables Chapter 4 Chapter 4
-
Upload
marvin-gray -
Category
Documents
-
view
221 -
download
1
Transcript of 4 - 1 © 2001 prentice-Hall, Inc. Behavioral Statistics Discrete Random Variables Chapter 4.

4 - 4 - 11
© 2001 © 2001 prentice-Hall, Inc.prentice-Hall, Inc.
Behavioral StatisticsBehavioral Statistics
Discrete Random VariablesDiscrete Random VariablesChapter 4Chapter 4

4 - 4 - 22
© 2001 © 2001 prentice-Hall, Inc.prentice-Hall, Inc.
Learning ObjectivesLearning Objectives
1.1. Distinguish Between the Two Types of Distinguish Between the Two Types of Random VariablesRandom Variables
2.2. Compute the Expected Value & Compute the Expected Value & Variance of Discrete Random VariablesVariance of Discrete Random Variables
3.3. Describe the Binomial and PoissonDescribe the Binomial and Poisson
4.4. Calculate Probabilities for Discrete Calculate Probabilities for Discrete Random VariablesRandom Variables

4 - 4 - 33
© 2001 © 2001 prentice-Hall, Inc.prentice-Hall, Inc.
Thinking ChallengeThinking Challenge
You’re taking a You’re taking a 3333 question multiple choice question multiple choice test. Each question has test. Each question has 4 4 choiceschoices. Clueless on . Clueless on 11 question, you decide to question, you decide to guess. What’s the chance guess. What’s the chance you’ll get it right?you’ll get it right?
If you guessed on all If you guessed on all 3333 questions, what would be questions, what would be your grade? pass?your grade? pass?
4 - 4 - 44
© 2001 © 2001 prentice-Hall, Inc.prentice-Hall, Inc.
Data TypesData Types
Data
Numerical Qualitative
Discrete Continuous
Data
Numerical Qualitative
Discrete Continuous
4 - 4 - 55
© 2001 © 2001 prentice-Hall, Inc.prentice-Hall, Inc.
Discrete Random Discrete Random VariablesVariables

4 - 4 - 66
© 2001 © 2001 prentice-Hall, Inc.prentice-Hall, Inc.
Discrete Discrete Random VariableRandom Variable
1. 1. Random VariableRandom Variable A Numerical Outcome of an ExperimentA Numerical Outcome of an Experiment Example: Number of Tails in 2 Coin TossesExample: Number of Tails in 2 Coin Tosses
2. Discrete Random Variable 2. Discrete Random Variable Whole Number (0, 1, 2, 3 etc.)Whole Number (0, 1, 2, 3 etc.) Obtained by CountingObtained by Counting Usually Finite Number of ValuesUsually Finite Number of Values
Poisson Random Variable Is Exception (Poisson Random Variable Is Exception ())

4 - 4 - 77
© 2001 © 2001 prentice-Hall, Inc.prentice-Hall, Inc.
Discrete Random Discrete Random Variable ExamplesVariable Examples
ExperimentExperiment RandomRandomVariableVariable
PossiblePossibleValuesValues
Make 100 Sales CallsMake 100 Sales Calls # # SalesSales 0, 1, 2, ..., 1000, 1, 2, ..., 100
Inspect 70 RadiosInspect 70 Radios # # DefectiveDefective 0, 1, 2, ..., 700, 1, 2, ..., 70
Answer 33 QuestionsAnswer 33 Questions # # CorrectCorrect 0, 1, 2, ..., 330, 1, 2, ..., 33
Count Cars at TollCount Cars at TollBetween 11:00 & 1:00Between 11:00 & 1:00
# # CarsCarsArrivingArriving
0, 1, 2, ..., 0, 1, 2, ...,

4 - 4 - 88
© 2001 © 2001 prentice-Hall, Inc.prentice-Hall, Inc.
Discrete Discrete Probability Probability DistributionDistribution
1.1. List of All possible [List of All possible [xx, , pp((xx)] pairs)] pairs xx = Value of Random Variable (Outcome) = Value of Random Variable (Outcome) pp((xx) = Probability Associated with Value) = Probability Associated with Value
2.2. Mutually Exclusive (No Overlap)Mutually Exclusive (No Overlap)
3.3. Collectively Exhaustive (Nothing Left Out)Collectively Exhaustive (Nothing Left Out)
4. 4. 0 0 pp((xx) ) 1 1
5. 5. pp((xx) = 1) = 1

4 - 4 - 99
© 2001 © 2001 prentice-Hall, Inc.prentice-Hall, Inc.
Discrete Probability Discrete Probability Distribution Distribution
ExampleExample
Probability DistributionProbability Distribution
Values, Values, xx Probabilities, Probabilities, pp((xx))
00 1/4 = .251/4 = .25
11 2/4 = .502/4 = .50
22 1/4 = .25 1/4 = .25
Experiment: Toss 2 Coins. Count # Tails.Experiment: Toss 2 Coins. Count # Tails.
© 1984-1994 © 1984-1994 T/Maker Co.T/Maker Co.

4 - 4 - 1010
© 2001 © 2001 prentice-Hall, Inc.prentice-Hall, Inc.
Visualizing Discrete Visualizing Discrete Probability Probability
DistributionsDistributions
{ (0, .25), (1, .50), (2, .25) }{ (0, .25), (1, .50), (2, .25) }{ (0, .25), (1, .50), (2, .25) }{ (0, .25), (1, .50), (2, .25) }
ListingListing TableTable
GraphGraph EquationEquation
# # TailsTails f(xf(x))CountCount
p(xp(x))
00 11 .25.2511 22 .50.5022 11 .25.25
pp xxnn
xx nn xxpp ppxx nn xx(( ))
!!
!! (( )) !!(( ))
11
.00.00
.25.25
.50.50
00 11 22xx
p(x)p(x)

4 - 4 - 1111
© 2001 © 2001 prentice-Hall, Inc.prentice-Hall, Inc.
Summary MeasuresSummary Measures
1.1. Expected ValueExpected Value Mean of Probability DistributionMean of Probability Distribution Weighted Average of All Possible ValuesWeighted Average of All Possible Values = = EE((XX)) = = xx pp((xx))
2.2. VarianceVariance Weighted Average Squared Deviation Weighted Average Squared Deviation
about Mean about Mean 22 = = EE[ ([ (xx ((xx pp((xx))

4 - 4 - 1212
© 2001 © 2001 prentice-Hall, Inc.prentice-Hall, Inc.
Summary Measures Summary Measures Calculation TableCalculation Table
xx p(xp(x)) xx p(xp(x )) xx - - ((xx --))22((xx --))22 p(p(xx ))
TotalTotal xx p(xp(x )) ((xx --))22 p(p(xx ))
4 - 4 - 1313
© 2001 © 2001 prentice-Hall, Inc.prentice-Hall, Inc.
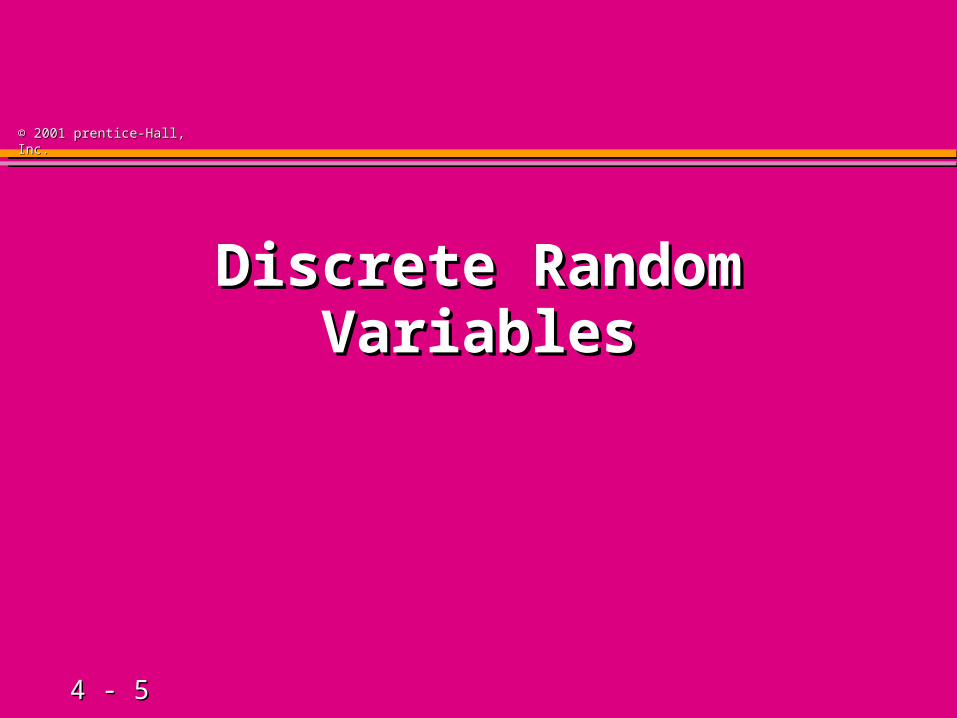
Thinking ChallengeThinking Challenge
You toss 2 coins. You’re You toss 2 coins. You’re interested in the numberinterested in the number of tails. What are the of tails. What are the expected valueexpected value & & standard deviationstandard deviation ofof this random variable, this random variable, number of tails?number of tails?
© 1984-1994 T/Maker Co.

4 - 4 - 1414
© 2001 © 2001 prentice-Hall, Inc.prentice-Hall, Inc.
Expected Value & Expected Value & Variance Solution*Variance Solution*
00 .25.25 00 -1.00-1.00 1.001.00 .25.25
11 .50.50 .50.50 00 00 00
22 .25.25 .50.50 1.001.00 1.001.00 .25.25
= 1.0= 1.0 22 = .50= .50
xx p(xp(x)) xx p(xp(x )) xx - - ((xx --))22((xx --))22 p(p(xx ))

4 - 4 - 1515
© 2001 © 2001 prentice-Hall, Inc.prentice-Hall, Inc.
Discrete Probability Discrete Probability Distribution FunctionDistribution Function

4 - 4 - 1616
© 2001 © 2001 prentice-Hall, Inc.prentice-Hall, Inc.
Discrete Probability Discrete Probability Distribution Distribution
FunctionFunction
1.1. Type of ModelType of Model Representation of Some Representation of Some
Underlying phenomenonUnderlying phenomenon
2.2. Mathematical Formula Mathematical Formula
3.3. Represents Discrete Represents Discrete Random VariableRandom Variable
4.4. Used to Get Exact Used to Get Exact ProbabilitiesProbabilities
P X x
x
( )
!
x e-

4 - 4 - 1717
© 2001 © 2001 prentice-Hall, Inc.prentice-Hall, Inc.
Discrete Probability Discrete Probability Distribution ModelsDistribution Models
B in om ia l P o isson
D isc re teP rob ab ilityD is trib u tion

4 - 4 - 1818
© 2001 © 2001 prentice-Hall, Inc.prentice-Hall, Inc.
Binomial DistributionBinomial Distribution

4 - 4 - 1919
© 2001 © 2001 prentice-Hall, Inc.prentice-Hall, Inc.
Discrete Probability Discrete Probability Distribution ModelsDistribution Models
B in om ia l P o isson
D isc re teP rob ab ilityD is trib u tion
4 - 4 - 2020
© 2001 © 2001 prentice-Hall, Inc.prentice-Hall, Inc.
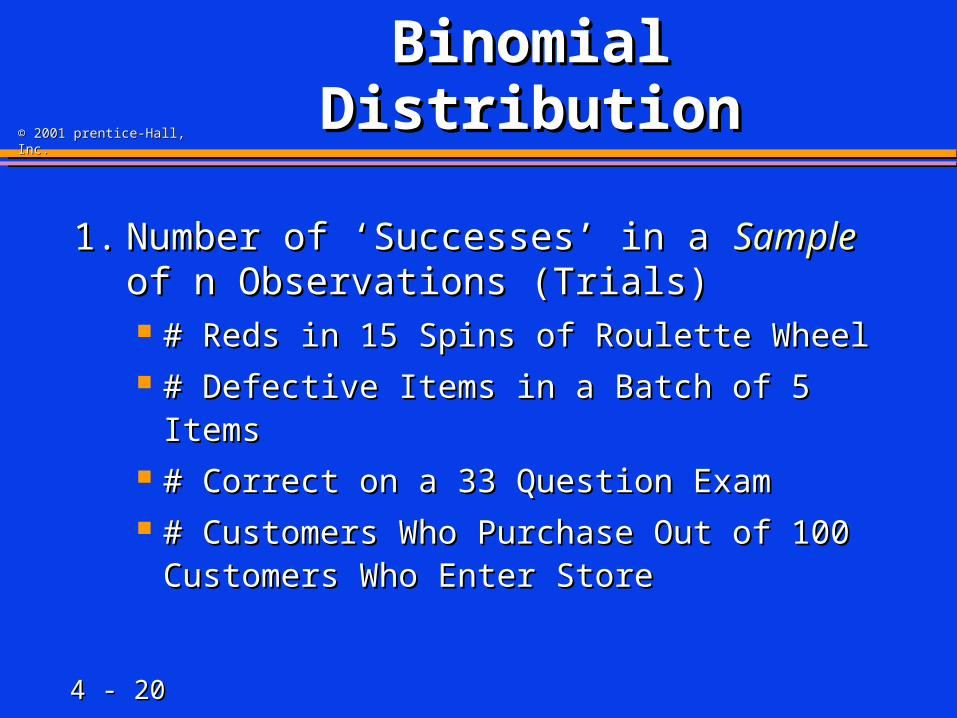
Binomial Binomial DistributionDistribution
1.1. Number of ‘Successes’ in a Number of ‘Successes’ in a SampleSample of of n Observations (Trials)n Observations (Trials) # Reds in 15 Spins of Roulette Wheel# Reds in 15 Spins of Roulette Wheel # Defective Items in a Batch of 5 Items# Defective Items in a Batch of 5 Items # Correct on a 33 Question Exam# Correct on a 33 Question Exam # Customers Who Purchase Out of 100 # Customers Who Purchase Out of 100
Customers Who Enter StoreCustomers Who Enter Store

4 - 4 - 2121
© 2001 © 2001 prentice-Hall, Inc.prentice-Hall, Inc.
Binomial Binomial Distribution Distribution PropertiesProperties
1.1. Two Different Sampling MethodsTwo Different Sampling Methods InfiniteInfinite Population Population WithoutWithout Replacement Replacement FiniteFinite Population Population WithWith Replacement Replacement
2.2. Sequence of Sequence of nn Identical Trials Identical Trials
3.3. Each Trial Has 2 OutcomesEach Trial Has 2 Outcomes ‘‘Success’ (Desired Outcome) or ‘Failure’Success’ (Desired Outcome) or ‘Failure’
4.4. Constant Trial ProbabilityConstant Trial Probability
5.5. Trials Are Independent Trials Are Independent

4 - 4 - 2222
© 2001 © 2001 prentice-Hall, Inc.prentice-Hall, Inc.
Binomial Probability Binomial Probability Distribution Distribution
FunctionFunction
xnxxnx ppxnx
nqp
x
nxp
)1(
)!(!
!)( xnxxnx pp
xnx
nqp
x
nxp
)1(
)!(!
!)(
pp((xx) = Probability of ) = Probability of x x ‘Successes’‘Successes’
nn == SampleSample Size Size
pp == Probability of ‘Success’Probability of ‘Success’
xx == Number of ‘Successes’ in Number of ‘Successes’ in SampleSample ( (xx = 0, 1, 2, ..., = 0, 1, 2, ..., n n))

4 - 4 - 2323
© 2001 © 2001 prentice-Hall, Inc.prentice-Hall, Inc.
Binomial Probability Binomial Probability Distribution Distribution
ExampleExample
p xn
x n xp p
p
x n x( )!
!( )!( )
( )!
!( )!. ( . )
1
35
3 5 35 1 5
0
3 5 3
.3125
p xn
x n xp p
p
x n x( )!
!( )!( )
( )!
!( )!. ( . )
1
35
3 5 35 1 5
0
3 5 3
.3125
Experiment: Toss 1 Coin 5 Times in a Row. Experiment: Toss 1 Coin 5 Times in a Row. Note # Tails. What’s the Probability of 3 Tails?Note # Tails. What’s the Probability of 3 Tails?

4 - 4 - 2424
© 2001 © 2001 prentice-Hall, Inc.prentice-Hall, Inc.
Binomial Probability Binomial Probability Table (Portion)Table (Portion)
n = 5 p
k .01 … 0.50 … .99
0 .951 … .031 … .000
1 .999 … .188 … .000
2 1.000 … .500 … .000
3 1.000 … .812 … .001
4 1.000 … .969 … .049
n = 5 p
k .01 … 0.50 … .99
0 .951 … .031 … .000
1 .999 … .188 … .000
2 1.000 … .500 … .000
3 1.000 … .812 … .001
4 1.000 … .969 … .049
Cumulative ProbabilitiesCumulative Probabilities

4 - 4 - 2525
© 2001 © 2001 prentice-Hall, Inc.prentice-Hall, Inc.
Binomial Binomial Distribution Distribution
CharacteristicsCharacteristics
.0
.2
.4
.6
0 1 2 3 4 5
X
P(X)
.0
.2
.4
.6
0 1 2 3 4 5
X
P(X)
.0
.2
.4
.6
0 1 2 3 4 5
X
P(X)
.0
.2
.4
.6
0 1 2 3 4 5
X
P(X)
n = 5 p = 0.1
n = 5 p = 0.5
E x np
np p
( )
( )1
E x np
np p
( )
( )1
MeanMean
Standard DeviationStandard Deviation

4 - 4 - 2626
© 2001 © 2001 prentice-Hall, Inc.prentice-Hall, Inc.
Binomial Binomial Distribution Distribution
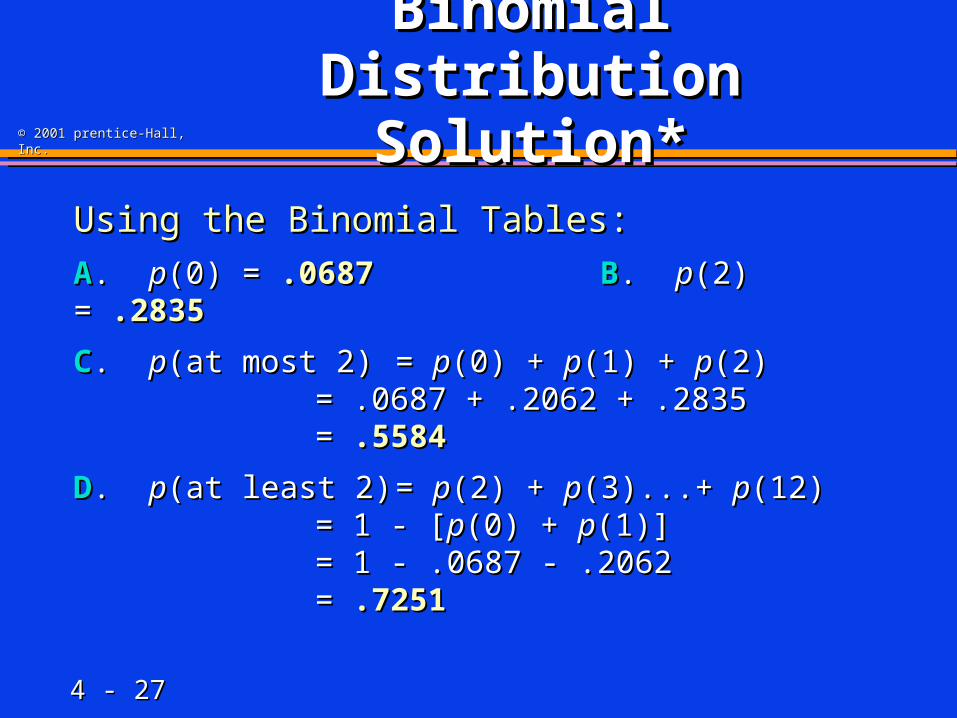
Thinking ChallengeThinking ChallengeYou’re a telemarketer selling You’re a telemarketer selling service contracts for Macy’s. service contracts for Macy’s. You’ve sold 20 in your last You’ve sold 20 in your last 100 calls (100 calls (pp = .20 = .20). If you ). If you call call 1212 people tonight, people tonight, what’s the probability ofwhat’s the probability ofA. No sales?A. No sales?
B. Exactly 2 sales?B. Exactly 2 sales?
C. At most 2 sales? C. At most 2 sales?
D. At least 2 sales?D. At least 2 sales?
4 - 4 - 2727
© 2001 © 2001 prentice-Hall, Inc.prentice-Hall, Inc.
Binomial Binomial Distribution Distribution
Solution*Solution*Using the Binomial Tables:Using the Binomial Tables:
AA. . pp(0) = (0) = .0687.0687 BB. . pp(2) = (2) = .2835.2835
CC. . pp(at most 2)(at most 2) = = pp(0) + (0) + pp(1) + (1) + pp(2)(2)= .0687 + .2062 + .2835= .0687 + .2062 + .2835= = .5584.5584
DD. . pp(at least 2)(at least 2) = = pp(2) + (2) + pp(3)...+ (3)...+ pp(12)(12)= 1 - [= 1 - [pp(0) + (0) + pp(1)] (1)] = 1 - .0687 - .2062= 1 - .0687 - .2062= = .7251.7251

4 - 4 - 2828
© 2001 © 2001 prentice-Hall, Inc.prentice-Hall, Inc.
Poisson DistributionPoisson Distribution

4 - 4 - 2929
© 2001 © 2001 prentice-Hall, Inc.prentice-Hall, Inc.
Discrete Probability Discrete Probability Distribution ModelsDistribution Models
B in om ia l P o isson
D isc re teP rob ab ilityD is trib u tion

4 - 4 - 3030
© 2001 © 2001 prentice-Hall, Inc.prentice-Hall, Inc.
Poisson DistributionPoisson Distribution
1.1. Number of Events that Occur in an Number of Events that Occur in an Interval Interval Events Events Per UnitPer Unit
Time, Length, Area, SpaceTime, Length, Area, Space
2.2. ExamplesExamples # Customers Arriving in 20 minutes# Customers Arriving in 20 minutes # Strikes Per Year in the U.S.# Strikes Per Year in the U.S. # Defects Per Lot (Group) of VCR’s# Defects Per Lot (Group) of VCR’s
4 - 4 - 3131
© 2001 © 2001 prentice-Hall, Inc.prentice-Hall, Inc.
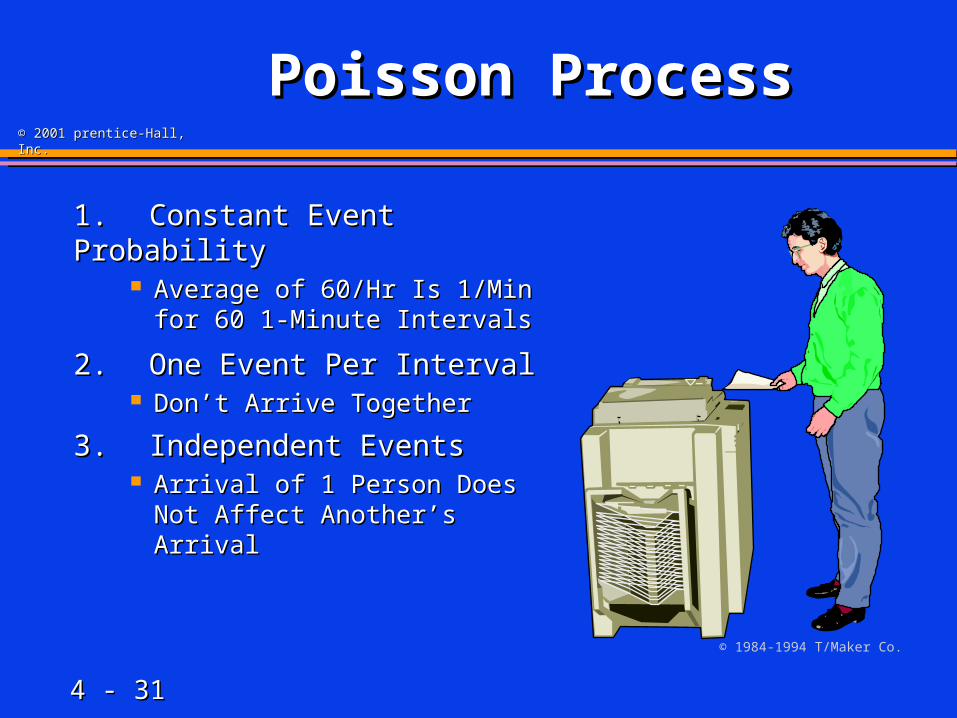
Poisson ProcessPoisson Process
1.1. Constant Event Constant Event ProbabilityProbability
Average of 60/Hr Is 1/Min Average of 60/Hr Is 1/Min for 60 1-Minute Intervalsfor 60 1-Minute Intervals
2.2. One Event Per IntervalOne Event Per Interval Don’t Arrive TogetherDon’t Arrive Together
3.3. Independent EventsIndependent Events Arrival of 1 Person Does Arrival of 1 Person Does
Not Affect Another’s ArrivalNot Affect Another’s Arrival
© 1984-1994 T/Maker Co.

4 - 4 - 3232
© 2001 © 2001 prentice-Hall, Inc.prentice-Hall, Inc.
Poisson Probability Poisson Probability Distribution Distribution
FunctionFunction
pp((xx) = Probability of ) = Probability of x x Given Given == Expected (Mean) Number of ‘Successes’Expected (Mean) Number of ‘Successes’
ee == 2.71828 (Base of Natural Logs)2.71828 (Base of Natural Logs)
xx == Number of ‘Successes’ Number of ‘Successes’ Per UnitPer Unit
pp xxxx
(( ))!!
xx ee--

4 - 4 - 3333
© 2001 © 2001 prentice-Hall, Inc.prentice-Hall, Inc.
Poisson Distribution Poisson Distribution CharacteristicsCharacteristics
.0
.2
.4
.6
0 1 2 3 4 5
X
P(X)
.0
.2
.4
.6
0 1 2 3 4 5
X
P(X)
.0
.2
.4
.6
0 2 4 6 8 10
X
P(X)
.0
.2
.4
.6
0 2 4 6 8 10
X
P(X)
= 0.5= 0.5
= 6= 6
E x
x p xi
N
( )
( )1
E x
x p xi
N
( )
( )1
MeanMean
Standard DeviationStandard Deviation

4 - 4 - 3434
© 2001 © 2001 prentice-Hall, Inc.prentice-Hall, Inc.
Poisson Distribution Poisson Distribution ExampleExample
Customers arrive at a Customers arrive at a rate of rate of 7272 per hour. per hour. What is the What is the probability of probability of 44 customers arriving in customers arriving in 33 minutes? minutes? © 1995 Corel Corp.

4 - 4 - 3535
© 2001 © 2001 prentice-Hall, Inc.prentice-Hall, Inc.
Poisson Distribution Poisson Distribution SolutionSolution
72 72 Per Hr. = 1.2 Per Min. = 3.6 Per 3 Min. IntervalPer Hr. = 1.2 Per Min. = 3.6 Per 3 Min. Interval
0.1912
!4
e6.3)4(
!
e)(
.63-4
-
p
xxp
x
0.1912
!4
e6.3)4(
!
e)(
.63-4
-
p
xxp
x
4 - 4 - 3636
© 2001 © 2001 prentice-Hall, Inc.prentice-Hall, Inc.
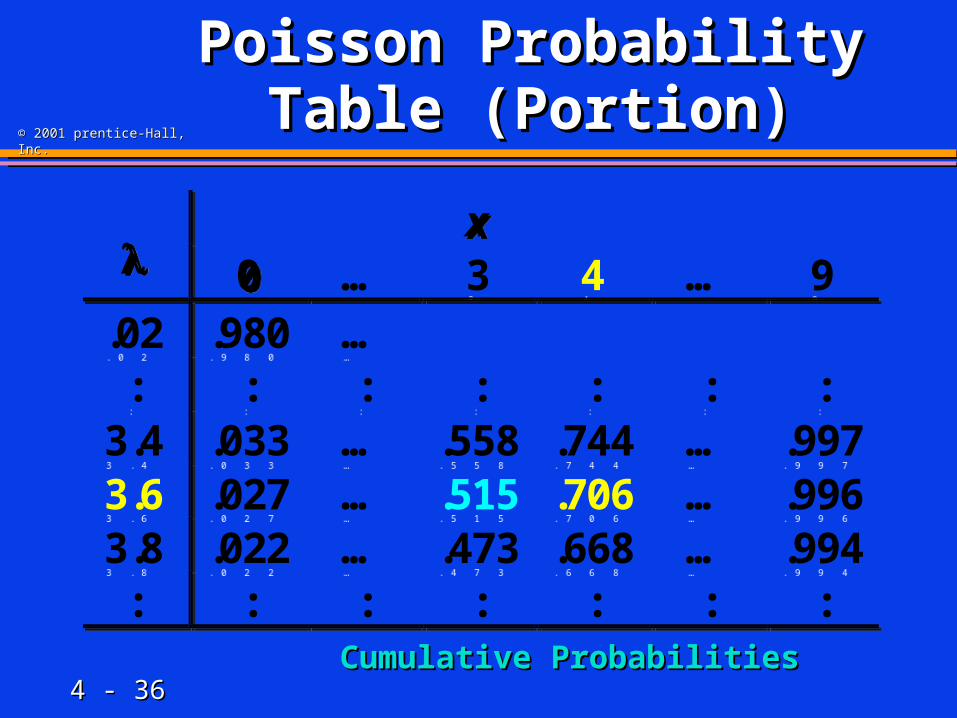
Poisson Probability Poisson Probability Table (Portion)Table (Portion)
x 0 … 3 4 … 9
.02 .980 …: : : : : : :
3.4 .033 … .558 .744 … .9973.6 .027 … .515 .706 … .9963.8 .022 … .473 .668 … .994: : : : : : :
x 0 … 3 4 … 9
.02 .980 …: : : : : : :
3.4 .033 … .558 .744 … .9973.6 .027 … .515 .706 … .9963.8 .022 … .473 .668 … .994: : : : : : :
Cumulative ProbabilitiesCumulative Probabilities

4 - 4 - 3737
© 2001 © 2001 prentice-Hall, Inc.prentice-Hall, Inc.
Thinking ChallengeThinking Challenge
You work in Quality You work in Quality Assurance for an Assurance for an investment firm. A investment firm. A clerk enters clerk enters 7575 words words per minute withper minute with 66 errors per hour. What errors per hour. What is the probability of is the probability of 00 errorserrors in a in a 255-word255-word bond transaction? bond transaction?
© 1984-1994 T/Maker Co.

4 - 4 - 3838
© 2001 © 2001 prentice-Hall, Inc.prentice-Hall, Inc.
Poisson Distribution Poisson Distribution Solution: Finding Solution: Finding **
75 75 words/min = (75 words/min)(60 min/hr)words/min = (75 words/min)(60 min/hr)
= = 45004500 words/hr words/hr
6 errors/hr6 errors/hr = 6 errors/= 6 errors/45004500 words words
= = .00133.00133 errors/word errors/word
In a In a 255255-word transaction (interval):-word transaction (interval):
= (= (.00133.00133 errors/word )( errors/word )(255 255 words) words)
= .34 errors/255-word transaction = .34 errors/255-word transaction

4 - 4 - 3939
© 2001 © 2001 prentice-Hall, Inc.prentice-Hall, Inc.
Poisson Distribution Poisson Distribution Solution: Finding Solution: Finding
p(0)*p(0)*
0.7118
!0
e34.)4(
!
e)(
-.340
-
p
xxp
x
0.7118
!0
e34.)4(
!
e)(
-.340
-
p
xxp
x
4 - 4 - 4040
© 2001 © 2001 prentice-Hall, Inc.prentice-Hall, Inc.
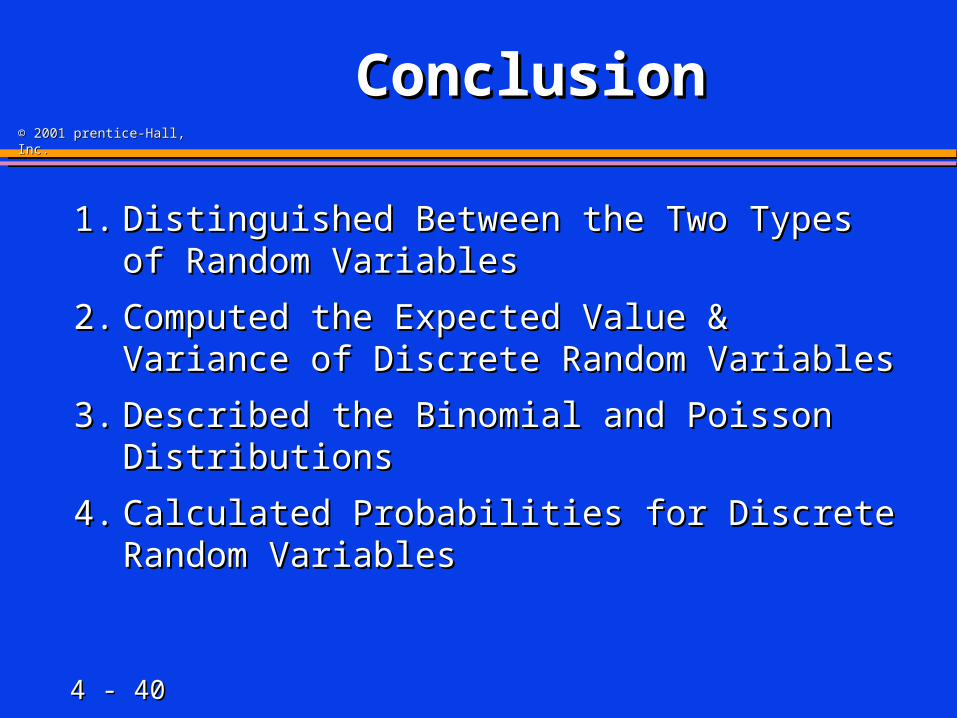
ConclusionConclusion
1.1. Distinguished Between the Two Types of Distinguished Between the Two Types of Random VariablesRandom Variables
2.2. Computed the Expected Value & Variance Computed the Expected Value & Variance of Discrete Random Variablesof Discrete Random Variables
3.3. Described the Binomial and Poisson Described the Binomial and Poisson DistributionsDistributions
4.4. Calculated Probabilities for Discrete Calculated Probabilities for Discrete Random VariablesRandom Variables

End of Chapter
Any blank slides that follow are blank intentionally.


![2[1]. Discrete Random Variables](https://static.fdocuments.us/doc/165x107/577d2fb61a28ab4e1eb2727a/21-discrete-random-variables.jpg)