
3rd Webinar on General Insurance 23rd December 2020
31
Consolidation in Non-Life Insurance Industry Nidhesh Jain Research Analyst, Investec 3rd Webinar on General Insurance 23rd December 2020
Transcript of 3rd Webinar on General Insurance 23rd December 2020

Consolidation in Non-Life Insurance Industry
Nidhesh Jain
Research Analyst, Investec
3rd Webinar on General Insurance
23rd December 2020

Presentation Outline• Evolution of Non-Life Sector in India
• Consolidation Curve (Four phases of consolidation)
• Consolidation Curve: Case Study: Indian Telecom Sector
• How consolidation happened in other counties in Non-Life Sector? Lessons from
UK, US and China.
• Factors driving acquisitions
• Key M&As globally in Insurance
• M&A deals in Non-Life Sector in India
• Where do we stand on consolidation drive in India?
• Case Study: ICICI Lombard – Bharti-Axa Deal
www.actuariesindia.org

Evolution of Non-Life Sector in India
www.actuariesindia.org
Insurance Regulatory and Development
Authority Act (IRDA Act) of 1999 came into
effect on 19th April 2000 which ended the
monopoly of GIC and its subsidiaries and
liberalized the insurance business in India.
IRDA was incorporated as the statutory
body to regulate and register private sector
insurance companies.
General Insurance Corporation (GIC),
along with its four subsidiaries, i.e.,
National Insurance Company Ltd., Oriental
Insurance Company Ltd., New India
Assurance Company Ltd. and United India
Assurance Company Ltd., was made
India’s national reinsurer.
The sector was once again opened
up by Increasing FDI Limits to 49%
from 26%.
De-tariffication of marine hull1
2000
2005
Till now all the segments of general
insurance were tariffed and the premiums
were decided by IRDAI. As on 2007, De-
tariffication of all non-life insurance
products except the auto third-party
liability segment was done.
Motor Third party pool was created
wherein all the claims would be collected
in this pool and would be divided
amongst all the companies in their
respective market share. This lead to
adverse losses in the motor TP segment.2012
IRDAI dismantled Motor TP pool and set up
a declined risk pool. This means that from
here onwards the insurers could take the
Motor TP policies on their balance sheets
and thus manage their own motor TP
policies.
2015
2007
2001 - 2007: Tariffed Era 2008 - 2012: Readjustment phase 2012 - 2018: Growth with Profitability
Listing of private/ and public general
insurance companies in during 2017-18
Favourable regulatory changes around
long term motor (3rd party) insurance,
distribution through OEMs/ dealers, and
compulsory personal accident cover.
M&A – Apollo Munich and Bharti-Axa;
more are on the block
Entry of new age players like Acko
2020

Evolution of Non-Life Sector in India
www.actuariesindia.org
Growth with ProfitabilityReadjustment PhaseTariffed Era
105 127 152 174 195 225 271 305 336 392 482 598 712 799 872 964 1,276 1,507 1,694 1,893
93%
83%
81%82%
88%
81%85%
86% 85%
93%
89%
83%82% 82%
85%
91%
85%
89%
86%
50%
55%
60%
65%
70%
75%
80%
85%
90%
95%
100%
-
200
400
600
800
1,000
1,200
1,400
1,600
1,800
2,000
2001 2002 2003 2004 2005 2006 2007 2008 2009 2010 2011 2012 2013 2014 2015 2016 2017 2018 2019 2020
GDPI (Rs Bn) Loss Ratio
6 year CAGR - 17% 4 year CAGR - 18% 7 year CAGR - 15%

Evolution of Non-Life Sector in India
www.actuariesindia.org
62.3%57.1% 55.5% 54.3% 53.6% 52.6% 50.6% 49.8% 50.2% 49.5% 46.8% 45.0%
40.5% 38.6%
33.1%37.3% 37.9%
36.8% 37.1% 38.4% 40.4% 41.3% 41.4% 41.2%42.1% 43.5%
48.0%48.2%
0.0%
10.0%
20.0%
30.0%
40.0%
50.0%
60.0%
70.0%
80.0%
90.0%
100.0%
2007 2008 2009 2010 2011 2012 2013 2014 2015 2016 2017 2018 2019 2020
Market share of Players in GI Industry
PSU Private Multi-line SAHI Specialised

Consolidation Curve (Four phases of Consolidation)
• Stage 1 – Opening
– The first stage generally begins with a single start-up or with a monopoly just emerging from a newly deregulated or privatized
industry.
– But this 100% industry concentration quickly drops off. Soon, the combined market share of the three largest companies drops
to between 30% and 10%, as competitors quickly arise to create the frontier of industry consolidation.
• Stage 2 – Scale
– This stage is all about building scale. Major players begin to emerge, buying up competitors and forming empires.
– The top three players in a stage 2 industry will own 15% to 45% of their market, as the industry consolidates rapidly.
• Stage 3 – Focus
– After the ferocious consolidation of stage 2, stage 3 companies focus on expanding their core business and continuing to
aggressively outgrow the competition.
– The top three industry players will now control between 35% and 70% of the market. By this time, there are still generally five
to 12 major players.
• Stage 4 – Balance & Alliance
– The industry concentration rate plateaus and can even dip a bit as, at this stage, the top three companies claim as much as
70% to 90% of the market. Large companies may form alliances with their peers because growth is now more challenging.
www.actuariesindia.org
Poll Question 1
www.actuariesindia.org
Which of the following best describes Indian Telecom sector? 1.Monopoly2.Duopoly3.Oligopoly4.Perfect Competition
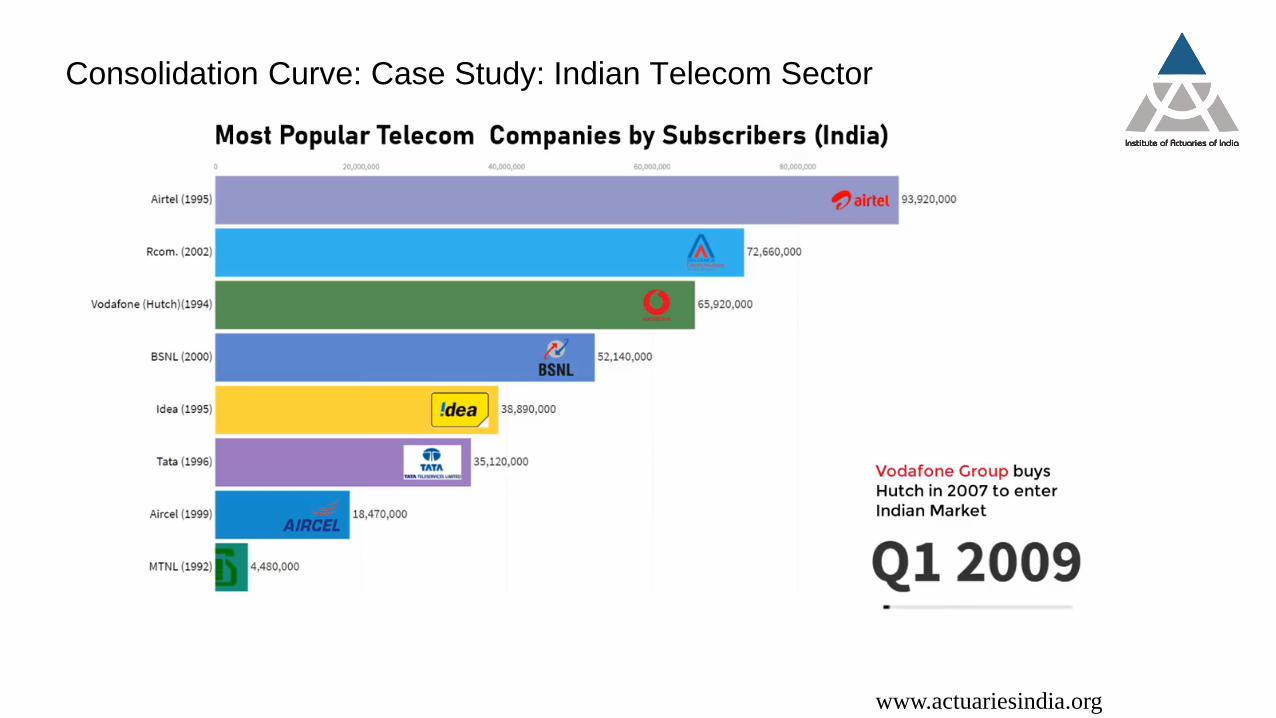
Consolidation Curve: Case Study: Indian Telecom Sector
www.actuariesindia.org

UK Motor Insurance – Why consolidation is not visible here?
www.actuariesindia.org
0%
10%
20%
30%
40%
50%
60%
70%
80%
90%
100%
1996 2001 2006 2011 2015 2019
Motor Insurance Market Share (%)
Allianz Direct Line Aviva Admiral Ageas esure Hastings RSA Axa Zurich Other
• Barriers to entry are low
• Business models changed; old
players did not adapt to
changes.
• Entry of Price Comparison
Websites.
PCW share of personal motor sales

US P&C Insurance – Consolidation is happening at a slower pace
www.actuariesindia.org
0%
10%
20%
30%
40%
50%
60%
70%
80%
90%
100%
2007 2008 2009 2010 2011 2012 2013 2014 2015 2016 2017 2018 2019
US P&C Market share
State Farm Berkshire Hathaway Liberty Mutual Allstate Insurance Progressive Insurance
Travelers Group Chubb INA Group USAA Group Farmers Insurance Others

China P&C Insurance – No signs of consolidation
www.actuariesindia.org
0%
10%
20%
30%
40%
50%
60%
70%
80%
90%
100%
2007 2008 2009 2010 2011 2012 2013 2014 2015 2016 2017 2018
China P&C Market Share
PICC Ping An China Pacific China Life P&C China United Others
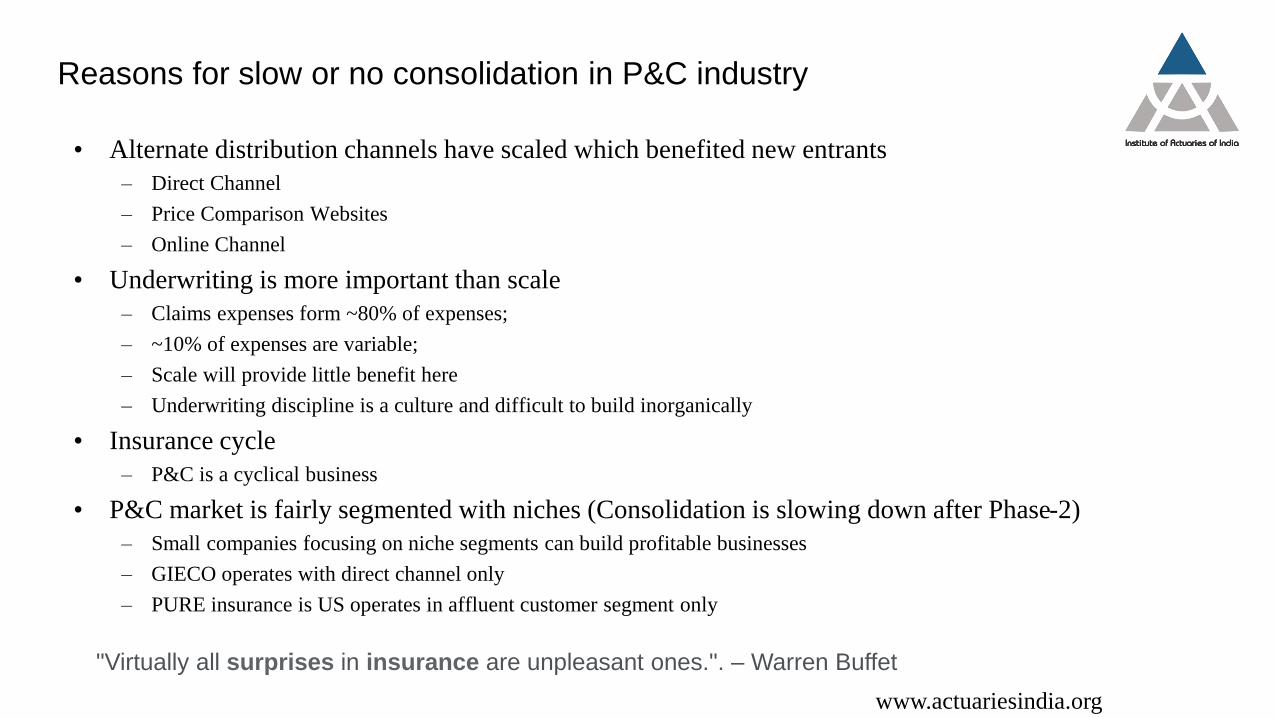
Reasons for slow or no consolidation in P&C industry
• Alternate distribution channels have scaled which benefited new entrants
– Direct Channel
– Price Comparison Websites
– Online Channel
• Underwriting is more important than scale
– Claims expenses form ~80% of expenses;
– ~10% of expenses are variable;
– Scale will provide little benefit here
– Underwriting discipline is a culture and difficult to build inorganically
• Insurance cycle
– P&C is a cyclical business
• P&C market is fairly segmented with niches (Consolidation is slowing down after Phase-2)
– Small companies focusing on niche segments can build profitable businesses
– GIECO operates with direct channel only
– PURE insurance is US operates in affluent customer segment only
www.actuariesindia.org
"Virtually all surprises in insurance are unpleasant ones.". – Warren Buffet

Factors driving acquisition (inorganic acquisition)
www.actuariesindia.org
Desire/ need for growth
Geographic
expansion
Access to
distribution
Scale
Access to new
verticals
Technology
Integrated
Service offerings
Valuations
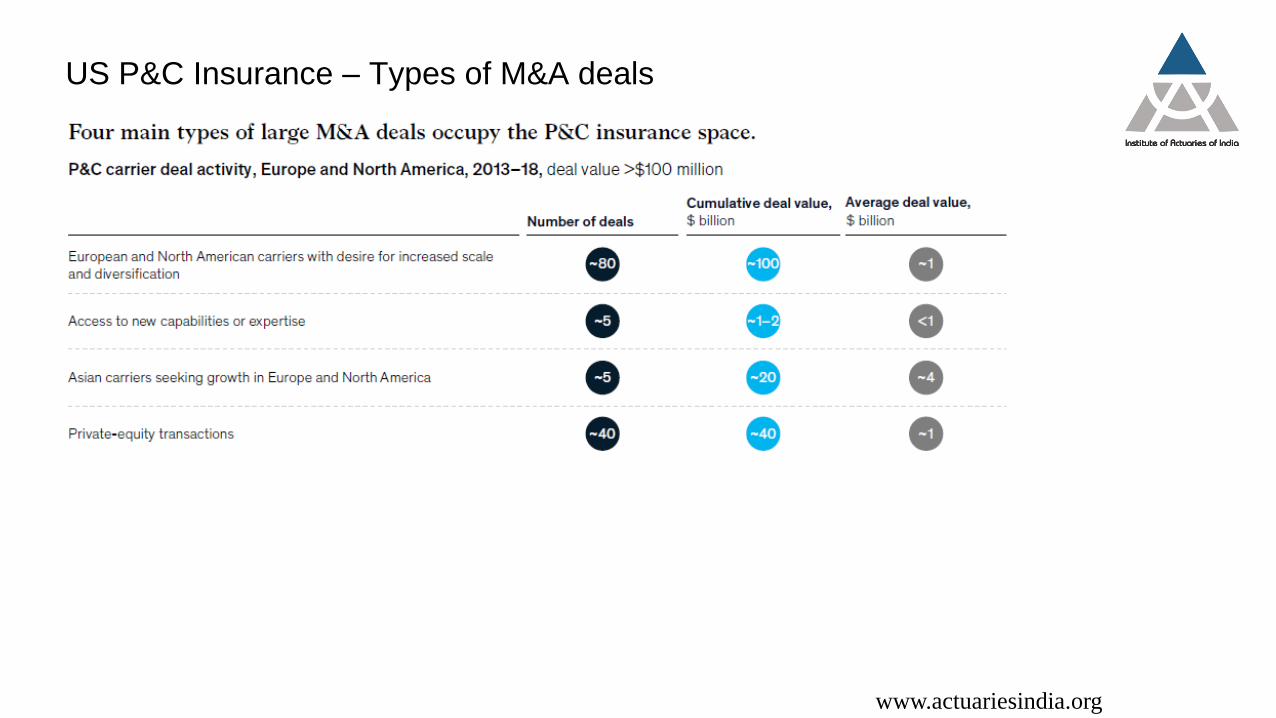
US P&C Insurance – Types of M&A deals
www.actuariesindia.org

Key M&A deals globally
• Tokio Marine acquired Privilege Underwriters in 2019
– Privilege Underwriters owns a P&C company in USA which is based on model of Reciprocal
Exchange. It caters to HNI customers.
– It offers insurance for homes with a rebuild value of more than one million dollars, automobiles,
watercraft, jewelry, art and other collections, personal excess liability (umbrella), and flood.
– This gave access to Tokio Marine to US markets and diversifies its business.
• Allianz UK acquitted LV= & L&G in 2019
– The acquisition of LV= & L&G positioned Allianz as the number two players in P&C sector in
UK.
– The deal rationale is to build scale in UK and gain market leadership position.
www.actuariesindia.org

Two-third of M&As do not work out
• “Most acquisitions go awry. Not only are the synergies to which so many executives pay lip
service seldom realised; more often than not the result is catastrophic. Frequently the
executives of the acquired companies leave. In their stead remains only a shell and some
devalued capital equipment. More important, acquisitions, even little ones, suck up an
inordinate amount of top management’s time, time taken away from the main-line business.”
Thomas Peters, In Search of Excellence
• "I will tell you a secret: Deal-making beats working. Deal-making is exciting and fun, and
working is grubby. Running anything is primarily an enormous amount of grubby detail
work . . . deal-making is romantic, sexy. That's why you have deals that make no
sense." Peter Drucker
• “Two thirds of acquisitions don’t work. Ours work because we don’t try to do acquisitions
— we wait for no-brainers.” Charlie Munger
• “You always have these things that the investment banker will tell you will produce synergy
and all that. Most times that doesn’t work.” Buffett
www.actuariesindia.org

Poll Question 2
www.actuariesindia.org
Has India non-life sector consolidated in last ten years?a. Yesb. Noc. Can’t Say

India – Non-Life sector is becoming more fragmented
www.actuariesindia.org
0%
10%
20%
30%
40%
50%
60%
70%
80%
90%
100%
2007 2010 2015 2020
Market share (Total Industry)
Top 5 Next 5 Others
0%
20%
40%
60%
80%
100%
2007 2010 2015 2020
Market share (Private Industry)
Top 5 Next 5 Others
5.1
4.3 4.3
3.5 3.4
2.62.3 2.2 2.1 1.9 1.7 1.6 1.5 1.4
2.8
1.0
0
1
2
3
4
5
6
General Insurance Penetration % of GDP
190
500
1000
1500
2000
2500
3000
General Insurance Density (Premium Per Capita), USD

India has scope for more number of non-life insurance companies
www.actuariesindia.org
2,496
934
528
90 82 49 46 34 26 -
500
1,000
1,500
2,000
2,500
3,000
USA UK Germany France China Pakistan Bangladesh India Sri Lanka
Number of Non-Life Insurers

India has a long tail of companies which will need capital for survival
www.actuariesindia.org
15%
9%
8%7%
7% 7%
5% 5%4% 4% 4% 4% 4%
2%2% 2% 2% 1% 1% 1% 1%
1% 1% 1% 1% 1% 0% 0% 0% 0% 0% 0% 0%0%
2%
4%
6%
8%
10%
12%
14%
16%
18%
GDPI Market Share (2020)
Market share at 2%

India has a long tail of companies which will need capital for survival
www.actuariesindia.org
91% 93% 94%96% 98% 100% 101% 102% 103% 103%
106% 107% 108% 110% 110% 111% 112%116% 117% 117% 118%
120% 121%126%
132% 133%
141%
149%
158%161%
165%
193%
210%
0%
50%
100%
150%
200%
250%
Combined Ratio (2020)
Combined Ratio at 110%

India has a long tail of companies which will need capital for survival
www.actuariesindia.org
1,418 1,194
999
741
448 412 335 324 263 259 205 177 149 149 100 66 25
-6 -28 -58 -62 -62 -71 -110 -134 -168 -175 -188 -241 -244
-1,486 -1,524
-4,108
-5,000
-4,000
-3,000
-2,000
-1,000
-
1,000
2,000
PAT (Rs Cr), FY20

Drivers of consolidation in India
• Capital
– Capital constraints faced by small and mid size players
• Profitability
– Skewed towards top players
• Economies of Scale
– Benefits to large players
• Technology
– Market share gains by players with strong tech platforms
• Distribution
– Companies with strong distribution will continue to gain market share
www.actuariesindia.org

Drivers of M&A in India
• Scale
– HDFC + L&T General
– ICICI Lombard + Bharti Axa
• Capital constraints
– Bharti-Axa
• Promoters’ priorities
– Bharti-Axa, L&T General, Apollo Munich
• Entry in new segments
– HDFC acquisition of Apollo Munich
• Technology
– ICICI Lombard acquisition of Auto Ninja
• Distribution
• Valuation
– ICICI Lombard + Bharti Axawww.actuariesindia.org

Valuation as driver for M&A
• M&A could be attractive depending on the valuation of deal
• There are two ways to make a deal look attractive
– Buying businesses at cheap valuation
– Buying businesses with expensive stock
www.actuariesindia.org
Company A Company B Merged Entity Merged Entity with Synergies
Net Worth 100,000 10,000 110,000 110,000
PAT 20,000 1,000 21,000 22,000
RoE 20% 10% 19% 20%
Combined Ratio 100% 105% 101% 100%
No of Shares 100 100 105 105
P/B 6.0 3.0 5.7 6.0
Valuations 600,000 30,000 630,000 660,000
Share Price 6,000 300 6,000 6,286
EPS 200 10 200 210

Case Study – ICICI Lombard – Bharti Axa acquisition
www.actuariesindia.org
Figure 1: ICICIGI’s m/s will increase to 8.7% post-merger expanding its lead over Bajaj & HDFC
Source: **HDFC market share includes Apollo Munich, Investec Securities estimates
Figure 1: ICICIGI GDPI Mix (FY20)
Source: Investec Securities estimates
Figure 2: Bharti-Axa GDPI Mix (FY20)
Source: Investec Securities estimates
Figure 3: Merged entity GDPI Mix (FY20)
Source: Investec Securities estimates
Figure 1: ICICIGI distribution mix (FY20)
Source: Investec Securities estimates
Figure 2: Bharti-Axa distribution mix (FY20)
Source: Investec Securities estimates
Figure 3: Merged distribution mix (FY20)
Source: Investec Securities estimates
Product mix of ICICIGI and Bharti-Axa
Distribution mix of ICICIGI and Bharti-Axa

Case Study – ICICI Lombard – Bharti Axa acquisition
www.actuariesindia.org
Figure 1: Merged entity RoE of 20% is possible subjected to cost synergies ICICIGI Bharti Axa Merged Comments
A. Claims ratio 72.9% 78.3% 73.8% Loss ratio of merged entity will increase marginally
B. Opex/NEP 28.3% 46.1% 31.2% Bharti Axa Opex ratio are high where should be cost synergies
C. Underwriting Margin (C = 1 - A - B) -1.1% -24.5% -4.9%
D. Expense Ratio/NWP 27.6% 42.1% 30.1%
E. Combined Ratio (E = A + D) 100% 120% 103.8% CR may be contained if cost synergies play out
F. Investment return 8.4% 9.0% 8.5%
G. Average Investment/NEP 2.6 2.4 2.5
H. Investment return/NEP 22% 21% 22%
I. Other expenses/NEP -2% -10% -4% Bharti made provisions on investments which should not recur.
J. PBT/NEP (J = C + H + I) 18% -13% 13%
K. PAT/NEP 13% -13% 8% Tax rate may reduce to 20% as Bharti has accumulated losses.
L. NEP/Avg Net worth 1.6 3.1 1.8
M. RoE (M = K*L) 21% -41% 15%
N. Investment Leverage 4.3 7.2 4.6
Source: Investec Securities estimates

Case Study – ICICI Lombard – Bharti Axa acquisition
www.actuariesindia.org
Figure 1: ICICIGI-Bharti-Axa deal valuations are in line with past deals in the industry
Company Seller Buyer % stake sold Valuation Trailing PAT Trailing BV P/E P/B Date
HDFC ERGO
HDFC Ltd Ergo
International AG 22.9% 49,000 1,040 10,237 47 4.8 Dec-15
Chola MS General
Tube Investments Mitsui
Sumitomo 14.0% 63,048 2,997 8,670 21 7.3 Mar-16
ICICI Lombard
ICICI Bank Fairfax 9.0% 172,250 5,356 31,795 32 5.4 Oct-15
Royal Sundaram
RSA Sundaram Finance
26.0% 17,308 220 5,498 79 3.1 Jul-15
ICICI Lombard
Fairfax Warburg Pincus 12.2% 203,000 7,019 44,038 29 4.6 Jun-17
SBI General SBI Premji Invest &
Axis MF 4.0% 120,500 3,957 15,481 30 7.8 Sep-18
Royal Sundaram
Sundaram Finance Ageas 40.0% 38,000 833 10,245 46 3.7 Nov-18
Star Health Promoter West Bridge,
RARE 93.3% 65,000 1,702 9,596 38 6.8 Jun-18
Apollo Munich
Apollo Hospitals HDFC 50.8% 29,232 112 4,361 261 6.7 Jan-20
Max Bupa Max India True North 51.0% 10,000 228 2,559 44 3.9 Feb-19
Religare Health
Religare Enterprises Kedaara 6.39% 41,831 436 5,499 95.9 7.6 Jun-20
Raheja QBE Prism Johnson & QBE Austrailia
Paytm 100.0% 5,680 (621) 1,485 NA 3.8 Jul-20
Bharti AXA Bharti Enterprises,
Axa ICICI Lombard 100.0% 46,000 (2,440) 7,503 NA 6.1 Aug-20
Source: Investec Securities estimates
Because ICICI Lombard was valued at
9.6x P/B
How can one value Bharti-Axa at 6x P/B?

Case Study – ICICI Lombard – Bharti Axa acquisition
www.actuariesindia.org
Figure 1: Four people in top management of Bharti-Axa have spent a reasonable amount of time at ICICI Lombard
Name Designation Bharti AXA - Joining date
Comment
Sanjeev Srinivasan
Chief Executive Officer & Managing Director
Aug-16 He was heading marketing and bancassurance at ICICI Lombard for 6.6 years.
Rahul Ahuja CFO May-20 Earlier CFO of Max Bupa Health.
Banashree Satpathy
Actuary Jan-17 No experience with Lombard
Rohit Kohli
Senior Vice President - Customer Services and Operations
Jun-16 Never worked in Lombard. Spent large part of career in Max Bupa.
Arif Syed
Senior Vice President of Technology (CTO)
Oct-17 He has spent nine years at ICICI Lombard.
Milind V Kolhe
Chief Underwriting and Reinsurance Officer
Apr-19 Not worked in Lombard.
Saurav Jaiswal
Chief Distribution Officer - Retail Business
Jan-17 He spent 12 years at ICICI Lombard and was heading retail and direct
channel.
Jignesh Sangoi Chief Risk Officer NA He spent ~5 years at ICICI Earlier he was AVP – Management reassurance at
Lombard
Source: Investec Securities estimates
Management team of Bharti-Axa

Poll Question 3 & 4
www.actuariesindia.org
What is NOT a rationale for acquiring Bharti-Axa?a. Access to technologyb. Scalec. To ward of competitors to gain scale in Motor Insuranced. Cultural fit as top management from Bharti-Axa is from ICICI Lombard
Is ICICI Lombard acquisition of Bharti-Axa justified? a. Yesb. No

Food for thought
• P&C industry in other countries is not consolidating much
• India needs many more companies to expand the penetration
• In short term, P&C industry may consolidate as tail is getting weaker and promoters are not
willing to infuse capital. Acquired or Perish!
• Which of India’s M&A deals make sense?
• M&A activity is likely to accelerate, though ICICI Lombard has made M&A difficult for
others by raising the bar.
• Overtime, we expect new players to enter who will disrupt the sector either through tech or
new products.
www.actuariesindia.org


![F A fissac leaflet HR2 · under grant agreement N° 642154. 1st training webinar W } i l ] l } + 4th training webinar 3rd training webinar 2nd training webinar EVENTS 2020 Final project](https://static.fdocuments.us/doc/165x107/60081b6c6a987a5a8a0a26c3/f-a-fissac-leaflet-under-grant-agreement-n-642154-1st-training-webinar-w-i.jpg)