3rd Quarter Report, March 31, - DG Cement
50
2019 3rd Quarter Report, March 31, (Un-audited)
Transcript of 3rd Quarter Report, March 31, - DG Cement

2019
3rd Quarter Report,March 31,
(Un-audited)

Company Information 02
Contact Us 03
Directors’ Report 04
Condensed Interim Unconsolidated
Statement of Financial Position 10
Statement of Profit or Loss - Unaudited 12
Statement of Comprehensive Income - Unaudited 13
Statement of Cash Flows - Unaudited 14
Statement of Changes In Equity - Unaudited 15
Notes to and Forming Part of the Condensed Interim
Unconsolidated Financial Information - Unaudited 16
Condensed Interim Consolidated
Statement of Financial Position 28
Statement of Profit or Loss - Unaudited 30
Statement of Comprehensive Income - Unaudited 31
Statement of Cash Flows - Unaudited 32
Statement of Changes In Equity - Unaudited 33
Notes to and Forming Part of the Condensed Interim
Consolidated Financial Information - Unaudited 34
Contents
DG Cement 3rd Quarter 2019 01

Company Information
Mrs. Naz Mansha ChairpersonMr. Raza Mansha Chief ExecutiveMr. Khalid Niaz KhawajaMr. Mohammad Arif Hameed Mr. Mahmood AkhtarMr. Farid Noor Ali FazalMr. Shahzad Ahmad Malik
Mr. Khalid Niaz Khawaja Member/ChairmanMr. Mahmood Akhtar MemberMr. Mohammad Arif Hameed Member
Mr. Khalid Niaz Khawaja Member/ChairmanMr. Raza Mansha Member Mr. Mahmood Akhtar Member
Mr. Khalid Mahmood Chohan
Mr. Raza Mansha Chief Executive OfficerMr. Aftab Ahmad Khan Director FinanceDr. Arif Bashir Director Technical & OperationsMr. Farid Noor Ali Fazal Director MarketingMr. Inayat Ullah Niazi Chief Financial Officer
Allied Bank Limited MCB Islamic Bank Limited Bank Alfalah Limited Meezan Bank LimitedBank Al-Habib Limited National Bank of PakistanBank Islami Pakistan Limited Samba Bank LimitedDubai Islamic Bank Soneri Bank LimitedFaysal Bank Limited Standard Chartered BankHabib Bank Limited Limited (Pakistan) LimitedHabib Metropolitan Bank The Bank of KhyberIndustrial and Commercial The Bank of Punjab Bank of China United Bank LimitedMCB Bank Limited A.F. Ferguson & Co., Chartered Accountants
Mr. Shahid Hamid, Bar-at-Law
0006469
1213275-6
0402252300164
DGKC
Board of Directors
Audit Committee
Human Resource &Remuneration Committee
Company Secretary
Management
Local Bankers
External Auditors
Legal Advisors
CUIN
NTN
STRN
Symbol
DG Cement 3rd Quarter 201902

Nishat House, 53-A, Lawrence Road,Lahore-PakistanUAN: 92 42 111 11 33 33 Fax: 92 42 36367414Email: [email protected] site: www.dgcement.com
Khofli Sattai, Distt., Dera Ghazi Khan-PakistanPhone: 92-641-460025-7Fax: 92-641-462392Email: [email protected]
12, K.M. Choa Saidan Shah Road,Khairpur, Tehsil Kallar Kahar, Distt. Chakwal-PakistanPhone: 92-543-650215-8Fax: 92-543-650231
Chichaee Gadani Main RCD, Hub,Distt. Lasbela, PakistanUAN: 92 42 111 11 33 33
THK Associates (Pvt) LtdHead Office, Karachi1st Floor, 40-C, Block-6, P.E.C.H.S., Karachi.Tel: (021) 111 000 322Fax: (021) 34168271
Branch Office, LahoreDYL Motorcycles Ltd. Office,147-Q Block, Behind Emporium Mall, Johar Town, LahoreCell: 0303-4444795, 0323-8999514
Mr. Inayat Ullah Niazi Chief Financial OfficerE-mail: [email protected]: 0092 42 111 11 33 33
Mr. Khalid Mehmood Chohan Company SecretaryE-mail: [email protected]: 0092 42 111 11 33 33
Registered Office
Factories
Share Registrar
For Investors’ Information,Comments, Inquiries,Complaints:
Contact Us
DG Cement 3rd Quarter 2019 03
DG Cement 3rd Quarter 201904
Directors’ Report
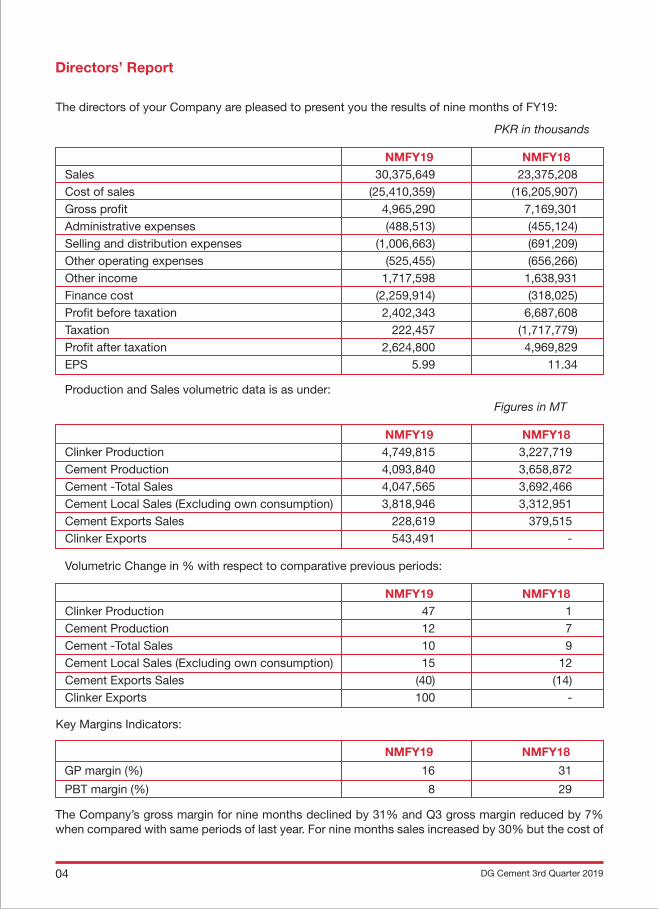
The directors of your Company are pleased to present you the results of nine months of FY19:
Key Margins Indicators:
PKR in thousands
NMFY19 NMFY18Sales 30,375,649 23,375,208Cost of sales (25,410,359) (16,205,907)Gross profit 4,965,290 7,169,301Administrative expenses (488,513) (455,124)Selling and distribution expenses (1,006,663) (691,209)Other operating expenses (525,455) (656,266)Other income 1,717,598 1,638,931Finance cost (2,259,914) (318,025)Profit before taxation 2,402,343 6,687,608Taxation 222,457 (1,717,779)Profit after taxation 2,624,800 4,969,829EPS 5.99 11.34
Production and Sales volumetric data is as under: Figures in MT
NMFY19 NMFY18Clinker Production 4,749,815 3,227,719Cement Production 4,093,840 3,658,872Cement -Total Sales 4,047,565 3,692,466Cement Local Sales (Excluding own consumption) 3,818,946 3,312,951Cement Exports Sales 228,619 379,515Clinker Exports 543,491 -
Volumetric Change in % with respect to comparative previous periods:
NMFY19 NMFY18Clinker Production 47 1Cement Production 12 7Cement -Total Sales 10 9Cement Local Sales (Excluding own consumption) 15 12Cement Exports Sales (40) (14)Clinker Exports 100 -
NMFY19 NMFY18
GP margin (%) 16 31
PBT margin (%) 8 29
The Company’s gross margin for nine months declined by 31% and Q3 gross margin reduced by 7% when compared with same periods of last year. For nine months sales increased by 30% but the cost of

sales jumped by 57%. Company’s average net retention per ton though increased as compared toprevious year’s nine months but the cost escalation exceeded to eclipse the margins. Cost of sales that seized 69% of net sales last year, took 84% this year. Net sales on overall basis increased by 30% in value but volumetric increase is about 15% in local cement sales despite with 67% new capacity addition while clinker exports are not bountiful. This happened to be one of main causes for declining margins besides increase in cost of sales due to coal price hikes, soaring energy rates, depreciating rupee and inflationary pressures. Overall economic slow-down has the primary effect on Industry’s and Company’s earnings.
Rising interest rates, loans against new plant addition and import based facilities have increased finance cost. The credit tax figure pertains to deferred tax as there is no current tax for the period as tax liability is offset by investment credit.
Pakistan Cement Industry despatches growth, period to comparative period, in percentages:
Industry’s utilization (in percentages) status:
Industry numbers for growth are not encouraging for running financial year yet. North section reported negative year on year growth. South zone made positive growth and diluted the negative impact of Country’s Industry on overall basis. Swelled exports of south zone mainly comprised of clinker that is a less value-added commodity than cement. Despite capacity expansions in this year, industry witnessed 6% decline in local sales.
For near future cement sales may remain subdued due to overall economic slow-down while inflationary pressure, high interest rate, currency vulnerability and prevalent uncertainty to keep casting a spell of low margins. However, there is hope that macro-economic factors may be controlled by early next fiscal year. Profitability of Company to remain dependent on volumetric growth in cement sales and selling price where volumes are less likely to improve in near future and price is vulnerable to market forces. The market is experiencing multiple factors that may destabilise the price of commodity and those include low demand due to overall economic sluggishness, expansions and rising cost of business. Despite narrated factors that are acting negatively it is hoped that prices to remain range bound. Coal prices dipped and its benefits could be effectively reaped if cement prices adhere a decent level.
Principal activity of the Company is manufacture and sale of cement and following are the principal risks the Company face:
• Tight price market and tough competition• Capacity utilization• Interest rate• Foreign currency fluctuations• Shrinking exports market
DG Cement 3rd Quarter 2019 05
North South Aggregate Local Exports Total Local Exports Total Local Exports TotalNM FY19 (10) (18) (11) 15 210 46 (6) 49 (0.48)
North South Aggregate Local Exports Total Local Exports Total Local Exports TotalNM FY19 75 6 82 60 30 90 71 12 84

Following are the directors of the Company:
Mrs. Naz Mansha (Chairperson) Non- ExecutiveMr. Raza Mansha ExecutiveMr. Khalid Niaz Khawaja IndependentMr. Mohammad Arif Hameed Non-ExecutiveMr. Khalid Qadeer Qureshi Non-Executive (Deceased on February 24, 2019)Mr. Mehmood Akhtar Non- Executive (Appointed on March 05, 2019 to fill the casual vacancy)Mr. Farid Noor Ali Fazal ExecutiveMr. Shahzad Ahmad Malik Non-Executive
Female Directors: 01Male Directors: 06
Audit CommitteeMr. Khalid Niaz Khawaja ChairmanMr. Mohammad Arif Hameed MemberMr. Khalid Qadeer Qureshi Non-Executive (Deceased on February 24, 2019)Mr. Mehmood Akhtar Non- Executive (Appointed on March 05, 2019 to fill the casual vacancy)
Human Resource & Remuneration CommitteeMr. Khalid Niaz Khawaja ChairmanMr. Raza Mansha MemberMr. Khalid Qadeer Qureshi Non-Executive (Deceased on February 24, 2019)Mr. Mehmood Akhtar Non- Executive (Appointed on March 05, 2019 to fill the casual vacancy)
There are no material post balance sheet events affecting the period end position.
Our plants and operations are complying with international and national environmental standards. DGKC is fully cognizant of its responsibility towards society and welfare. The Company is spending on education, health, medical and fire-fighting facilities, water supply to nearby localities, aiding in emergency and disaster situations in nearby areas, awareness campaigns etc.
There are no changes that have occurred during the period under review concerning the nature of the business of the company or of its subsidiaries, or any other company in which the company has interest.
The Directors of your company state that the system of internal control is sound in design and has been effectively implemented and monitored. Significant deviations from last period in operating results of the company are highlighted and reasoned in other parts of Directors report.
We thank all our stakeholders and admire efforts of our employees.
For and on behalf of the Board
Raza Mansha Farid Noor Ali FazalChief Executive Officer Director
LahoreApril 24, 2019
DG Cement 3rd Quarter 201906

DG Cement 3rd Quarter 2019 07

DG Cement 3rd Quarter 201908
31 16
29 8
NMFY19NMFY18
NMFY1975682711284 6090 30
NMFY19(10)(18)(11)(6)49(0.48) 1546 210

DG Cement 3rd Quarter 2019 09
23,375,208 30,375,649
(16,205,907) (25,410,359)
7,169,301 4,965,290
(455,124) (488,513)
(691,209) (1,006,663)
(656,266) (525,455)
1,638,931 1,717,598
(318,025) (2,259,914)
6,687,608 2,402,343
(1,717,779) 222,457
4,969,829 2,624,800
11.34 5.99
3,227,719 4,749,815
3,658,872 4,093,840
3,692,466 4,047,565
3,312,951 3,818,946
379,515 228,619
- 543,491
1 47
7 12
9 10
12 15
(14) (40)
- 100
20192018
20192018
20192018

Unconsolidated Condensed InterimStatement of Financial Position
31 March, 30 June, 2019 2018 Un-Audited Audited Note (Rupees in thousand)EQUITY AND LIABILITIES
CAPITAL AND RESERVES
Authorised share capital - 950,000,000 (June 30, 2018: 950,000,000) ordinary shares of Rs 10 each 9,500,000 9,500,000 - 50,000,000 (June 30, 2018: 50,000,000) preference shares of Rs 10 each 500,000 500,000 10,000,000 10,000,000
Issued, subscribed and paid up capital 438,119,118 (June 30, 2018: 438,119,118) ordinary shares of Rs 10 each 4,381,191 4,381,191 Reserves 32,771,878 34,761,625 Accumulated profit 38,754,392 37,991,605 75,907,461 77,134,421
NON-CURRENT LIABILITIES
Long term finances - secured 6 17,249,955 17,730,324 Long term deposits 214,517 109,726 Retirement and other benefits 328,313 278,379 Deferred taxation 3,523,863 4,082,974 21,316,648 22,201,403
CURRENT LIABILITIES Trade and other payables 7,538,131 7,595,299 Short term borrowings - secured 17,901,621 12,209,667 Current portion of non-current liabilities 4,218,280 2,336,910 Accrued finance cost 716,719 347,880 Unclaimed dividend 35,658 28,347 Provision for taxation 35,090 35,090 30,445,499 22,553,193
Contingencies and Commitments 7 127,669,608 121,889,017
The annexed notes 1 to 19 form an integral part of this condensed interim financial information.
Chief Executive
DG Cement 3rd Quarter 201910

31 March, 30 June, 2019 2018 Un-Audited Audited Note (Rupees in thousand)
ASSETS
NON-CURRENT ASSETS
Property, plant and equipment 8 77,579,433 76,493,984 Investments 9 14,120,351 16,259,564 Long term loans to employees 574 574 Long term loans, advances and deposits 60,923 59,269 91,761,281 92,813,391
CURRENT ASSETS
Stores, spares and loose tools 8,131,372 5,114,227 Stock-in-trade 3,640,346 1,377,596 Trade debts 1,624,734 188,293 Investments 9 15,918,617 16,018,594 Advances, deposits, prepayments and other receivables 2,041,342 2,637,675 Loan to related party 10 1,000,000 1,000,000 Income tax receivable 2,768,182 2,270,137 Cash and bank balances 783,734 469,104 35,908,327 29,075,626
127,669,608 121,889,017
As At March 31, 2019 (Un-audited)
DirectorChief Financial Officer
DG Cement 3rd Quarter 2019 11

DG Cement 3rd Quarter 201912
2019 2018
July to January to July to January to
March March March March
Note (Rupees in thousand) (Rupees in thousand)
Sales 30,375,649 10,608,444 23,375,208 7,611,538
Cost of sales 11 (25,410,359) (8,827,938) (16,205,907) (5,692,157)
Gross profit 4,965,290 1,780,506 7,169,301 1,919,381
Administrative expenses (488,513) (176,557) (455,124) (159,205)
Selling and distribution expenses (1,006,663) (358,370) (691,209) (231,044)
Other operating expenses 9.1 (525,455) (94,275) (656,266) (186,738)
Other income 1,717,598 572,967 1,638,931 446,086
Profit from operations 4,662,257 1,724,271 7,005,633 1,788,480
Finance cost (2,259,914) (911,766) (318,025) (125,381)
Profit before taxation 2,402,343 812,505 6,687,608 1,663,099
Taxation 222,457 70,506 (1,717,779) (427,125)
Profit after taxation 2,624,800 883,011 4,969,829 1,235,974
Earnings per share
(basic and diluted) Rupees 5.99 2.02 11.34 2.82
The annexed notes 1 to 19 form an integral part of this condensed interim financial information.
DirectorChief Executive Chief Financial Officer
Unconsolidated Condensed Interim Statement of Profit or Loss For the Quarter and Nine Months Ended March 31, 2019 (Un-audited)

DG Cement 3rd Quarter 2019 13
Unconsolidated Condensed Interim Statement of Profit or Loss For the Quarter and Nine Months Ended March 31, 2019 (Un-audited)
DirectorChief Executive Chief Financial Officer
2019 2018
July to January to July to January to
March March March March
(Rupees in thousand) (Rupees in thousand)
Profit for the taxation 2,624,800 883,011 4,969,829 1,235,974
Other comprehensive income
for the period
Items that may be re-classified
subsequently to profit or loss
Change in value of available-for-sale
investments (2,326,401) 544,636 760,102 1,298,692
Tax effect of change in fair value of
available-for-sale investments 336,654 - - -
(1,989,747) 544,636 760,102 1,298,692
Items that will not be subsequently
re-classified to profit or loss - - - -
Other comprehensive income
for the period (1,989,747) 544,636 760,102 1,298,692
Total comprehensive (loss) /income
for the period 635,053 1,427,647 5,729,931 2,534,666
The annexed notes 1 to 19 form an integral part of this condensed interim financial information.
Unconsolidated Condensed Interim Statement of Comprehensive IncomeFor the Quarter and Nine Months Ended March 31, 2019 (Un-audited)

DG Cement 3rd Quarter 201914
2019 2018 July to July to March March Note (Rupees in thousand)
Cash flows from operating activities
Cash generated from operations 13 (128,456) 7,132,061
Finance cost paid (1,891,075) (220,079)
Retirement and other benefits paid (11,434) (38,876)
Taxes paid (498,045) (880,389)
Payment to subsidiary against tax losses - (15,000)
Long term deposits - net 104,791 10,435
Net cash generated from operating activities (2,424,219) 5,988,152
Cash flows from investing activities
Fixed capital expenditure (3,691,558) (11,482,315)
Proceeds from sale of property, plant and equipment 33,431 16,254
Investments made - net (250,000) (140,049)
Long term loans, advances and deposits - net (1,654) (979)
Interest received 76,684 59,465
Dividend received 1,441,049 1,494,565
Net cash used in investing activities (2,392,048) (10,053,059)
Cash flows from financing activities
Repayment of long term finances (1,299,000) (541,667)
Disbursement of loans 2,700,000 7,290,510
Settlement of derivative financial instrument - (35,077)
Dividend paid (1,854,702) (3,285,893)
Net cash used in financing activities (453,702) 3,427,873
Net (decrease) in cash and cash equivalents (5,269,969) (637,034)
Cash and cash equivalents at the beginning of the period (11,740,563) (8,149,348)
Exchange loss on cash and cash equivalents (107,355) (128,669)
Cash and cash equivalents at the end of the period 14 (17,117,887) (8,915,051)
The annexed notes 1 to 19 form an integral part of this condensed interim financial information.
DirectorChief Executive Chief Financial Officer
Unconsolidated Condensed Interim Cash Flow StatementFor the Nine Months ended March 31, 2019 (Un-audited)

DG Cement 3rd Quarter 2019 15
Dire
ctor
Chi
ef E
xecu
tive
Chi
ef F
inan
cial
Offi
cer
Cap
ital
res
erve
Rev
enue
res
erve
Bal
ance
as
at J
une
30, 2
018
- A
udit
ed
4,38
1,19
1 4,
557,
163
24,7
79,1
25
353,
510
5,07
1,82
7 37
,991
,605
77
,134
,421
Tota
l co
mp
rehe
nsiv
e in
com
e fo
r th
e p
erio
d-
Pro
fit fo
r th
e p
erio
d
- -
- -
- 2,
624,
800
2,62
4,80
0-
Oth
er c
omp
rehe
nsiv
e in
com
e fo
r th
e p
erio
d
- -
(1,9
89,7
47)
- -
- (1
,989
,747
)
-
- (1
,989
,747
) -
- 2,
624,
800
635,
053
Tota
l co
ntri
but
ions
by
and
dis
trib
utio
ns t
o
o
wne
rs o
f th
e C
om
pan
y re
cog
nize
d d
irec
tly
in
eq
uity
- Fi
nal d
ivid
end
for
the
year
end
ed
Ju
ne 3
0, 2
018
(Rs
4.25
per
sha
re)
- -
- -
- (1
,862
,013
) (1
,862
,013
)B
alan
ce a
s at
Mar
ch 3
1, 2
019-
Una
udit
ed
4,38
1,19
1 4,
557,
163
22,7
89,3
78
353,
510
5,07
1,82
7 38
,754
,392
75
,907
,461
Bal
ance
as
at J
une
30, 2
017
- A
udit
ed
4,38
1,19
1 4,
557,
163
28,0
31,8
37
353,
510
5,07
1,82
7 32
,473
,351
74
,868
,879
Tota
l co
mp
rehe
nsiv
e in
com
e fo
r th
e p
erio
d-
Pro
fit fo
r th
e p
erio
d
- -
- -
- 4,
969,
829
4,96
9,82
9-
Oth
er c
omp
rehe
nsiv
e in
com
e fo
r th
e p
erio
d
- -
760,
102
- -
- 76
0,10
2
-
- 76
0,10
2 -
- 4,
969,
829
5,72
9,93
1To
tal c
ont
rib
utio
ns b
y an
d d
istr
ibut
ions
to
ow
ners
of
the
Co
mp
any
reco
gni
zed
dir
ectl
y
in e
qui
ty-
Fina
l div
iden
d fo
r th
e ye
ar e
nded
June
30,
201
7 (R
s 7.
5 p
er s
hare
) -
- -
- -
(3,2
85,8
93)
(3,2
85,8
93)
Bal
ance
as
at M
arch
31,
201
8- U
naud
ited
4,
381,
191
4,55
7,16
3 28
,791
,939
35
3,51
0 5,
071,
827
34,1
57,2
87
77,3
12,9
17
The
anne
xed
not
es 1
to
19 fo
rm a
n in
tegr
al p
art
of t
his
cond
ense
d in
terim
fina
ncia
l inf
orm
atio
n.
Fair
valu
ere
serv
e
Sha
rep
rem
ium
Sha
reca
pit
al
Cap
ital
rede
mpt
ion
rese
rve
fund
Gen
eral
rese
rve
Acc
umul
ated
P
rofit
Tota
l
Rup
ees
in t
hous
and
sUnconsolidated Condensed Interim Statement of Changes In Equity For the Nine Months ended March 31, 2019 (Un-audited)
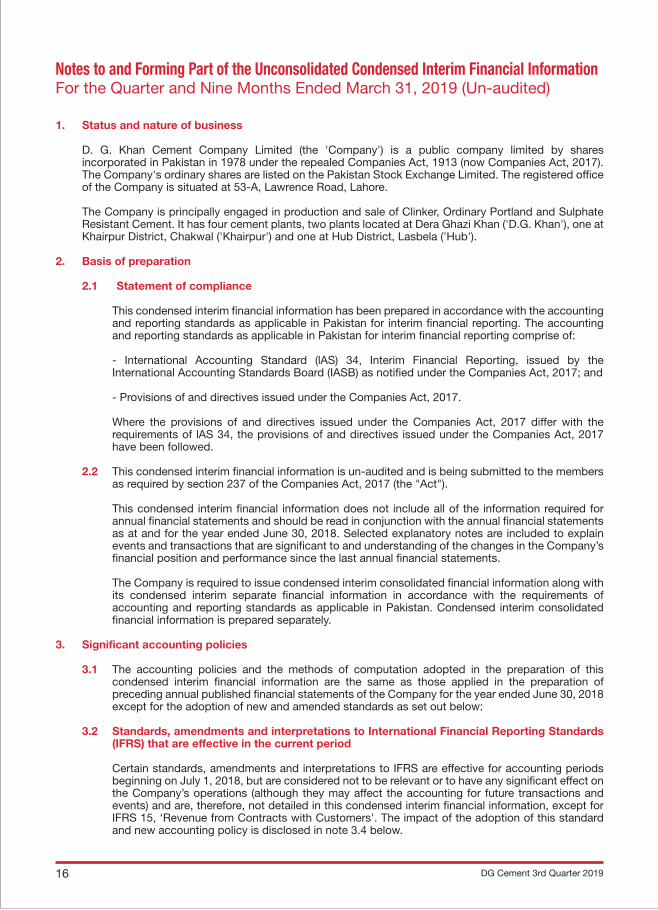
1. Status and nature of business
D. G. Khan Cement Company Limited (the 'Company') is a public company limited by shares incorporated in Pakistan in 1978 under the repealed Companies Act, 1913 (now Companies Act, 2017). The Company's ordinary shares are listed on the Pakistan Stock Exchange Limited. The registered office of the Company is situated at 53-A, Lawrence Road, Lahore.
The Company is principally engaged in production and sale of Clinker, Ordinary Portland and Sulphate Resistant Cement. It has four cement plants, two plants located at Dera Ghazi Khan ('D.G. Khan'), one at Khairpur District, Chakwal ('Khairpur') and one at Hub District, Lasbela ('Hub').
2. Basis of preparation
2.1 Statement of compliance
This condensed interim financial information has been prepared in accordance with the accounting and reporting standards as applicable in Pakistan for interim financial reporting. The accounting and reporting standards as applicable in Pakistan for interim financial reporting comprise of:
- International Accounting Standard (lAS) 34, Interim Financial Reporting, issued by the International Accounting Standards Board (IASB) as notified under the Companies Act, 2017; and
- Provisions of and directives issued under the Companies Act, 2017.
Where the provisions of and directives issued under the Companies Act, 2017 differ with the requirements of lAS 34, the provisions of and directives issued under the Companies Act, 2017 have been followed.
2.2 This condensed interim financial information is un-audited and is being submitted to the members as required by section 237 of the Companies Act, 2017 (the "Act").
This condensed interim financial information does not include all of the information required for annual financial statements and should be read in conjunction with the annual financial statements as at and for the year ended June 30, 2018. Selected explanatory notes are included to explain events and transactions that are significant to and understanding of the changes in the Company’s financial position and performance since the last annual financial statements.
The Company is required to issue condensed interim consolidated financial information along with its condensed interim separate financial information in accordance with the requirements of accounting and reporting standards as applicable in Pakistan. Condensed interim consolidated financial information is prepared separately.
3. Significant accounting policies
3.1 The accounting policies and the methods of computation adopted in the preparation of this condensed interim financial information are the same as those applied in the preparation of preceding annual published financial statements of the Company for the year ended June 30, 2018 except for the adoption of new and amended standards as set out below:
3.2 Standards, amendments and interpretations to International Financial Reporting Standards (IFRS) that are effective in the current period
Certain standards, amendments and interpretations to IFRS are effective for accounting periods beginning on July 1, 2018, but are considered not to be relevant or to have any significant effect on the Company’s operations (although they may affect the accounting for future transactions and events) and are, therefore, not detailed in this condensed interim financial information, except for IFRS 15, ‘Revenue from Contracts with Customers'. The impact of the adoption of this standard and new accounting policy is disclosed in note 3.4 below.
DG Cement 3rd Quarter 201916
Notes to and Forming Part of the Unconsolidated Condensed Interim Financial InformationFor the Quarter and Nine Months Ended March 31, 2019 (Un-audited)

3.3 Standards, amendments and interpretations to existing standards that are not yet effective and have not been early adopted by the Company
The Securities and Exchange Commission of Pakistan ('SECP') through SRO 1007(I)/2017 dated October 4, 2017 had notified that IFRS 9, ‘Financial Instruments’ would be applicable for annual periods beginning on or after July 1, 2018, however, subsequent to reporting date, SECP through SRO 229(I)/2019 dated February 14, 2019 has notified the deferment of this standard to reporting period/year ending on or after June 30, 2019 (earlier application is permitted). Consequently, the Company has not adopted this standard in the preparation of this condensed interim financial information for the nine month ended March 31, 2019.
This standard replaces the guidance in IAS 39, ‘Financial Instruments: Recognition and measurement’. It includes requirements on the classification and measurement of financial assets and liabilities; it also includes an expected credit losses model that replaces the current incurred loss impairment model. As allowed above, the Company will apply this standard in the preparation of its financial statements for the year ending June 30, 2019 and it is yet to assess the full impact of this standard.
Further, the following amendments and interpretations to existing standards have been published and are mandatory for the Company's accounting period beginning on July 1, 2019, and the Company has not early adopted them:
Effective date (accounting periods beginning on or after)
Other standards or interpretations IIFRS 16 ‘Leases' January 01, 2019 IFRIC 23 'Uncertainty over income tax treatments' January 01, 2019
The Company will apply these standards/interpretations to standards from their respective effective dates and has yet to assess the impact of these amendments on its financial statements.
3.4 New accounting policy and impact thereof
3.4.1 IFRS 15, ‘Revenue from Contracts with Customers'
New accounting policy
"Revenue from sale of goods is recognised when the when the Company satisfies a performance obligation by transferring a promised good or service to a customer.
In case of local sales, revenue is recognised at the time of despatch from the factory.
In case of export sales of the company, the delivery of cement/clinker and transportation are two distinct performance obligations and the total transaction price is allocated to each performance obligation. Revenue relating to each performance obligation is recognized on satisfaction of each distinct performance obligation."
Impact of adoption
The company has applied IFRS 15 using the modified retrospective approach for transition. This approach requires entities to recognise the cumulative effect of initially applying IFRS 15 as an adjustment to the opening balance of un-appropriated profit in the period of initial application. Comparative prior year periods would not be adjusted. The application of IFRS 15 does not have any significant impact on the revenue recognition policy of the company and therefore, the cumulative effect of initially applying this standard as an adjustment to the opening balance of un-appropriated profit in the period of initial application is not material and hence, has not been accounted for.
4. Change in accounting estimate
During the period, the Company carried out a comprehensive review of the remaining useful lives of the Company's operating fixed assets and as a result of such review, management identified that plant and machinery, factory buildings and quarry equipment require an upward revision whereas furniture and fittings and office equipment require a downward revision in their useful lives. Hence, the remaining
DG Cement 3rd Quarter 2019 17

useful lives of plant and machinery, factory buildings and quarry equipment have been increased while useful lives of furniture and fittings and office equipment have been decreased. Such change has been accounted for as a change in an accounting estimate in accordance with IAS 8 ‘Accounting Policies, Changes in Accounting Estimates and Errors’. Had there been no change in the accounting estimate, the profit before tax for the nine month ended March 31, 2019 would have been lower by Rs 1,481.810 million and carrying value of operating fixed assets as at that date would have been lower by the same amount. Consequently, due to the above change in accounting estimate, future profits before tax would decrease by Rs 1,481.810 million.
5. Taxation
The preparation of the condensed interim financial information requires management to make judgments, estimates and assumptions that affect the application of accounting policies and the reported amounts of assets and liabilities, income and expenses. Actual results may differ from these estimates. In preparing this condensed interim financial information, the significant judgments made by management in applying accounting policies and key sources of estimation were the same as those that were applied to the annual financial statements of the Company for the year ended June 30, 2018 except for the change in accounting estimate disclosed in note 4.1.
March 31, June 30, 2019 2018 Un-audited Audited (Rupees in thousand)
6. Long term finances
Long term loans - note 6.1 21,441,471 20,040,471
Less: Current portion shown under current liabilities 4,191,516 2,310,147
17,249,955 17,730,324
6.1 Long term finances
Opening balance 20,040,471 13,020,000
Add:
Proceeds of borrowing 2,700,000 7,853,805
Exchange loss during the period - -
22,740,471 20,873,805
Less:
Repayment during the period 1,299,000 833,334
Closing balance 21,441,471 20,040,471
7. Contingencies and commitments
7.1 Contingencies There is no significant change in contingencies from the preceding annual financial statements of
the Company for the year ended June 30, 2018 except for the matter disclosed in note 15.1.7 to the previous annual financial statements, which is mentioned below:
The Company made alternate arrangements of water for its Khairpur plant and hence, the Honourable Supreme Court of Pakistan disposed of the matter through its order dated November 19, 2018 (further amended through its order dated January 10, 2019) wherein it directed the Company to contribute Rs 100 million to the "Diamer-Bhasha and Mohmand Dams Fund" which the Company has deposited during the period.
DG Cement 3rd Quarter 201918

7.2 Commitments in respect of:
(i) Contracts for capital expenditure Rs 352.680 million (June 30, 2018: Rs 224.277 million)
(ii) Letters of credits for capital expenditure Rs 2,280.783 million (June 30, 2018: Rs 235.266 million)
(iii) Letters of credit other than capital expenditure Rs 1,536.579 million (June 30, 2018: Rs 3,091.684 million)
(iv) The amount of future payments under operating leases and the period in which these payments will become due are as follows:
March 31, June 30, 2019 2018 Un-audited Audited (Rupees in thousand)
Not later than one year 425 331 Later than one year and not later than five years 1,699 1,325 Later than five years 5,228 4,307 7,352 5,963
8. Property, plant and equipment
Operating assets - note 8.1 71,714,150 73,434,283 Capital work-in-progress - note 8.2 5,509,979 2,967,935 Major spare parts and stand-by equipment 355,304 91,766 77,579,433 76,493,984
8.1 Operating fixed assets
Opening book value 73,434,283 30,987,739 Add: Additions during the period - note 8.1.1 885,976 46,233,538 Less: -Disposals during the period - at book value - note 8.1.2 18,933 212,625 -Impairment charged for the period/year - 1,270,120 -Depreciation charged during the period/year 2,587,176 2,304,249 2,606,109 3,786,994 Closing book value 71,714,150 73,434,283
8.1.1 Additions during the period
Freehold land 18,753 175,361 Buildings on freehold land : - Factory buildings - 12,251,170 - Office building and housing colony 7,408 1,411,901 Roads 3,052 827,897 Plant and machinery 206,186 26,516,470 Quarry equipment 326,084 1,876,865 Furniture, fixtures 68,688 121,632 Office equipment 42,979 60,262 Motor vehicles 210,100 142,727 Power and water supply lines 2,726 2,849,253 885,976 46,233,538
DG Cement 3rd Quarter 2019 19

March 31, June 30, 2019 2018 Un-audited Audited (Rupees in thousand)
8.1.2 Disposals during the period
Factory buildings - 172,634 Roads - 8,211 Motor vehicles 18,933 25,249 Power and water supply lines - 6,531 18,933 212,625
8.2 Capital work-in-progress
Civil works 897,020 226,299 Plant and machinery 570,712 756,743 Advances for capital expenditure 38,744 8,954
Expansion project: - Civil works 1,703,526 496,086 - Plant and machinery 1,534,798 304,763 - Advances to suppliers and contractors 636,890 1,175,090 - Others 128,289 - 4,003,503 1,975,939 5,509,979 2,967,935
9. Investments
Carrying value of investments at the beginning of the period / year 32,278,158 35,608,138
Investments made during the period / year - Related parties 250,000 290,049 250,000 290,049 Fair value gain / loss during the period / year on: - Available for sale investments (2,326,400) (3,620,029) -Impairment loss on equity instrument of subsidiary - note 9.1 (162,790) - (2,489,190) (3,620,029) Carrying value at the end of the period / year 30,038,968 32,278,158 Investments classified in current assets (15,918,617) (16,018,594) Closing balance 14,120,351 16,259,564
9.1 Impairment loss on equity instruments of subsidiary
The Company reviewed the carrying amount of its investment in equity instruments of Nishat Dairy (Private) Limited and its recoverability to determine whether there is an indication that such investment has suffered an impairment loss. As a result of carrying out the aforementioned
DG Cement 3rd Quarter 201920

assessment, the recoverable amount of the investment was determined to be lower than its carrying amount by Rs 0.60 per share and the carrying amount was accordingly reduced by Rs 162.790 million which has been recognised as an expense and included in 'Other expenses'.
10. Loan to related party
This represents loan to Nishat Hotels and Properties Limited that was originally repayable on October 30, 2018, however, its extension for one year was approved by the members of the Company in their Annual General Meeting held on October 28, 2018 as per the requirements of section 199 of the Act on the same terms except for change in mark-up rate from 3 months KIBOR + 0.5% to 1 month KIBOR + 0.5% per annum.
2019 2018 July to January to July to January to March March March March (Rupees in thousand) 11. Cost of sales
Raw and packing materials consumed 2,882,319 1,035,286 1,976,910 748,879 Salaries, wages and other benefits 2,415,673 831,412 1,562,713 515,420 Electricity and gas 3,659,272 1,335,468 1,661,477 630,056 Furnace oil and coal 12,470,810 4,536,366 6,878,532 2,406,034 Stores and spares consumed 2,320,397 762,473 1,389,117 538,755 Repair and maintenance 351,733 22,500 241,846 78,213 Insurance 63,911 19,351 41,092 13,280 Depreciation on property, plant and equipment 2,532,302 852,028 1,473,426 495,148 Royalty 540,947 189,577 254,433 85,437 Excise duty 36,414 12,692 24,321 8,196 Vehicle running expenses 65,479 28,981 23,640 9,546 Postage, telephone and telegram 8,144 3,239 3,936 1,452 Printing and stationery 17,552 9,156 8,720 2,125 Legal and professional charges 4,301 1,374 1,478 259 Travelling and conveyance 9,713 3,017 5,327 1,823 Plant cleaning and gardening 24,585 9,205 26,171 8,633 Rent, rates and taxes 97,688 39,295 43,356 15,472 Freight charges 43,515 6,773 22,492 7,464 Other expenses 188,418 30,697 29,463 9,860 Total manufacturing cost 27,733,173 9,728,890 15,668,450 5,576,052
Opening work-in-process 493,431 1,784,164 522,557 94,028 Closing work-in-process (2,494,420) (2,494,420) (67,361) (67,361) (2,000,989) (710,256) 455,196 26,667 Cost of goods manufactured 25,732,184 9,018,634 16,123,655 5,602,728
Opening stock of finished goods 385,626 437,721 332,278 228,327 Closing stock of finished goods (598,422) (598,422) (86,855) (86,855) (212,796) (160,701) 245,423 141,472
Less: Own consumption capitalized (109,029) (29,995) (163,171) (52,043) 25,410,359 8,827,938 16,205,907 5,692,157
DG Cement 3rd Quarter 2019 21

12. Transactions with related parties The related parties include the subsidiaries, the Investor (Nishat Mills Limited), related parties on the basis of common directorship, group companies, key management personnel including directors and post employment benefit plans. The Company in the normal course of business carries out transactions with various related parties. Significant transactions with related parties are as follows:
July to July to
March March
2019 2018
Un-audited Un-audited
(Rupees in thousand)
Relationship with the Nature of transaction Company i. Subsidiary entities Purchase of goods and services 1,739,715 1,013,708 Rental income 697 643 Dividend income - 51,191 Sale of goods 16,745 17,215 ii. Entities on the basis of common directorship Insurance premium 1,537 1,338 Sale of goods 87,073 39,607 Mark-up income on balances with related parties 72,581 50,240 Dividend income 27,229 62,453 Dividends paid 14,273 25,188
iii. Investor Sale of goods 40,986 76,296 Dividend income 143,875 128,730 Dividends paid 584,690 1,031,807
iv. Other related entities Insurance premium 108,542 69,492 Sale of goods 326 - Dividend income 1,267,337 1,247,331 Dividends paid 971 1,714 Purchase of goods and services 31,634 26,662 Insurance claims received 1,531 -
v. Key management Salaries and other personnel employment benefits 180,283 152,965
vi. Post employment Expense charged in respect of benefit plans defined benefit plan (including capitalized) 92,831 79,825
Expense charged in respect of defined contribution plan (including capitalized) 62,108 51,191
DG Cement 3rd Quarter 201922

March 31, June 30,
2019 2018
Un-audited audited
(Rupees in thousand) Payable to related parties:
Trade and other payables 247,963 327,510
Receivable from related parties:
Trade debts 35,313 6,516 Loan to related party 1,000,000 1,000,000 Loan, advances, deposits, prepayments and other receivables 9,384 5,937 1,044,697 1,012,453
July to July to
March, March,
2019 2018
Un-audited Un-audited
(Rupees in thousand)
13. Cash flow from operating activities
Profit before tax 2,402,343 6,687,608
Adjustment for :
- Depreciation on property, plant and equipment 2,587,176 1,527,809
- Profit on disposal of property, plant and equipment (14,498) (6,770)
- Profit on bank deposits (7,551) (9,564)
- Dividend income (1,441,049) (1,494,565)
- Retirement and other benefits accrued 61,368 78,336
- Mark-up income on Loans (72,581) (50,240)
- Exchange loss - net 135,162 183,655
- Finance cost 2,259,914 318,025
- Provision of WPPF 127,761 352,061
- Impairment of investment in equity instruments of subsidiary 162,789 -
- (Gain)/loss on derivative financial instruments - (12,979)
Profit before working capital changes 6,200,834 7,573,376
Effect on cash flow due to working capital changes:
- (Increase) / decrease in stores, spares and loose tools (3,017,145) (578,926)
- (Decrease) / Increase in stock-in-trade (2,262,750) 704,793
- (Increase) / decrease in trade debts (1,429,615) (36,949)
- Increase in advances, deposits, prepayments and other receivables 599,781 (920,901)
- Decrease / (Increase) in trade and other payables (219,561) 390,668
(6,329,290) (441,315)
Cash generated from operations (128,456) 7,132,061
DG Cement 3rd Quarter 2019 23

March 31, March 31, 2019 2018 Un-audited Un-audited (Rupees in thousand)
14. Cash and cash equivalents
Short term borrowings - secured (17,901,621) (9,290,539)
Cash and bank balances 783,734 375,488
(17,117,887) (8,915,051)
15. Financial risk management
15.1 Financial risk factors
The company’s activities expose it to a variety of financial risks: market risk (including currency risk, fair value interest rate risk, cash flow interest rate risk and price risk), credit risk and liquidity risk.
The condensed interim financial information does not include all financial risk management information and disclosures required in the annual financial statements, and should be read in conjunction with the company’s annual financial statements as at June 30, 2018.
There have been no changes in the risk management department or in any risk management policies since the year ended June 30, 2018.
15.2 Fair value estimation
a) Fair value hierarchy
The different levels for fair value estimation used by the Company have been defined as follows:
- The fair value of financial instruments traded in active markets (such as publicly traded available for sale securities) is based on quoted (unadjusted) market prices at the end of the reporting period. The quoted market price used for financial assets held by the company is the current bid price. These instruments are included in Level 1.
- The fair value of financial instruments that are not traded in an active market (for example over-the-counter derivatives) is determined using valuation techniques. These valuation techniques maximise the use of observable market data where it is available and rely as little as possible on entity specific estimates. If all significant inputs required to fair value an instrument are observable, the instrument is included in Level 2.
- If one or more of the significant inputs is not based on observable market data, the instrument is included in level 3. This is the case for unlisted equity instruments.
To provide an indication about the reliability of the inputs used in determining fair value, the Company classifies its financial instruments into the three levels prescribed above. The following table presents the Company’s financial assets measured and recognised at fair value at March 31, 2019 and June 30, 2018 on a recurring basis:
DG Cement 3rd Quarter 201924

Level 1 Level 2 Level 3 Total As at March 31, 2019 (Rupees in thousand)
Assets
Investments - available-for-sale -Quoted equity instruments 25,801,302 - - 25,801,302
-Unquoted equity instruments - - 1,896,680 1,896,680
25,801,302 - 1,896,680 27,697,982
As at June 30, 2018
Assets Investments - available-for-sale -Quoted equity instruments 26,332,214 - - 26,332,214
-Unquoted equity instruments - - 3,392,170 3,392,170
26,332,214 - 3,392,170 29,724,384
The Company’s policy is to recognise transfers into and transfers out of fair value hierarchy levels as at the end of the reporting period.
There were no transfers between Level 1, 2 and 3 during the period. There were no changes in valuation techniques during the period.
The Company did not measure any financial assets or financial liabilities at fair value on a non-recurring basis as at March 31, 2019.
b) Valuation techniques used to determine fair values
Specific valuation techniques used to value financial instruments include:
- the use of quoted market prices or dealer quotes for similar instruments; and
- for other financial instruments - discounted cash flow analysis.
c) Fair value measurements using significant unobservable inputs
The main level 3 inputs used by the Company to determine fair value of investment in Nishat Hotels and Properties Limited ('NHPL') are derived and evaluated as follows.
- Discount rate is determined using a capital asset pricing model to calculate a pre-tax rate that reflects current market assessments of the time value of money and the risk specific to NHPL.
- Long term growth rate is estimated based on historical performance of NHPL and current market information for similar type of companies.
The significant assumptions used in this valuation technique are as follows:
- Discount rate of 12.37%.
- Long term growth rate of 4% for computation of terminal value.
- Annual growth in costs and revenues is linked to inflation at 5.25% per annum.
DG Cement 3rd Quarter 2019 25

DirectorChief Executive Chief Financial Officer
The fair value/carrying amount of the investment in Hyundai Nishat Motors (Private) Limited is not material to the interim financial information and hence, the inputs used have not been disclosed.
16. Summary of significant transactions and events
The Company's financial position and performance was particularly affected by the following events and transactions during the interim reporting period:
- repaid principal on long term finance aggregating Rs 4,191.516 million (refer to note 6);
- change in estimate of useful lives of operating fixed assets (refer to note 4);
- fair value loss recognized in respect of investment in Nishat Hotels and Properties Limited (refer to note 9.1);
- dividends paid amounting to Rs 1,851.419 million (refer to statement of cash flows); and
- deposited Rs 100 million in the "Diamer-Bhasha and Mohmand Dams Fund" created by the Supreme Court of Pakistan (refer to note 7.1).
17. Date of authorization for issue
This interim financial information was authorized for issue on April 24, 2019 by the Board of Directors of the Company.
18. Event occurring after the reporting period
Subsequent to period end, owing to the attack in Pulwama in Indian Occupied Kashmir on February 14, 2019, exports to India have been suspended due to imposition of 200% custom duty by the Indian goverment on all imports from Pakistan. Company's export of cement to India during the period was 155,000 metric tonnes amounting to Rs 1,029.593 million and a similar quantity of exports was projected in the subsequent half year ending June 30, 2019, uptil the happening of the aforementioned incident.
19. Corresponding figures
In order to comply with the requirements of International Accounting Standard 34 - 'Interim Financial Reporting', the condensed interim balance sheet have been compared with the balances of annual audited financial statements of preceding financial year, whereas, the condensed interim profit and loss account, condensed interim statement of comprehensive income, condensed interim cash flow statement and condensed interim statement of changes in equity have been compared with the balances of comparable period of immediately preceding financial year.
DG Cement 3rd Quarter 201926

Interim ConsolidatedFinancial
Statements

DG Cement 3rd Quarter 201928
31 March, 30 June, 2019 2018 Un-Audited Audited Note (Rupees in thousand)EQUITY AND LIABILITIES
CAPITAL AND RESERVES
Authorised capital - 950,000,000 (June 30, 2018: 950,000,000) ordinary shares of Rs 10 each 9,500,000 9,500,000 - 50,000,000 (June 30, 2018: 50,000,000) preference shares of Rs 10 each 500,000 500,000 10,000,000 10,000,000
Issued, subscribed and paid up capital 438,119,118 (June 30, 2018: 438,119,118) ordinary shares of Rs 10 each 4,381,191 4,381,191 Reserves 32,732,605 34,722,352 Accumulated profit 38,578,628 37,884,238 75,692,424 76,987,781 Non-controlling interest 1,938,555 1,994,849 77,630,979 78,982,630
NON-CURRENT LIABILITIES
Long term finances - secured 5 17,892,177 18,330,324 Long term deposits 214,517 109,726 Deferred liabilities 328,313 278,379 Deferred taxation 3,799,010 4,299,861 22,234,017 23,018,290
CURRENT LIABILITIES
Trade and other payables 7,901,444 7,787,966 Loan from related party - unsecured 6 214,000 214,000 Short term borrowing-secured 20,599,684 13,614,942 Current portion of non-current liabilities 4,426,058 2,364,410 Accrued finance cost 719,088 370,028 Unclaimed dividend 35,658 28,347 Provision for taxation 35,090 35,090 33,931,022 24,414,783
CONTINGENCIES AND COMMITMENTS 7 133,796,018 126,415,703
The annexed notes form an integral part of this condensed interim consolidated financial information.
Chief Executive
Consolidated Condensed InterimStatement of Financial Position

DG Cement 3rd Quarter 2019 29
31 March, 30 June, 2019 2018 Un-Audited Audited Note (Rupees in thousand)
ASSETS
NON-CURRENT ASSETS
Property, plant and equipment 8 81,483,227 80,582,245 Biological assets 600,833 636,403 Investments 9 11,750,329 13,859,552 Long term loans to employees 574 574 Long term loans and deposits 61,828 60,173 93,896,791 95,138,947
CURRENT ASSETS
Stores, spares and loose tools 8,439,607 5,272,192 Stock-in-trade 5,502,853 2,428,200 Trade debts 2,224,729 519,802 Investments 9 15,901,601 16,018,629 Advances, deposits, prepayments and other receivables 2,306,294 2,824,034 Loan to related party 10 1,000,000 1,000,000 Income tax recoverable 3,454,246 2,714,926 Cash and bank balances 1,069,897 498,973 39,899,227 31,276,756
133,796,018 126,415,703
DirectorChief Financial Officer
As At March 31, 2019 (Un-audited)

DG Cement 3rd Quarter 201930
DirectorChief Executive Chief Financial Officer
2019 2018
July to January to July to January to
March March March March
Note (Rupees in thousand) (Rupees in thousand)
Sales 32,609,651 11,113,313 25,395,325 8,377,120
Cost of sales 11 (27,419,503) (9,275,549) (18,149,001) (6,391,735)
Gross profit 5,190,148 1,837,764 7,246,324 1,985,385
Administrative expenses (545,122) (195,960) (514,243) (181,436)
Selling and distribution expenses (1,025,500) (364,533) (706,839) (236,629)
Other operating expenses (639,200) (105,295) (824,907) (229,777)
Other income 1,823,001 621,418 1,659,492 503,232
Profit from operations 4,803,327 1,793,394 6,859,827 1,840,775
Finance cost (2,457,596) (1,007,959) (339,008) (126,392)
Profit before taxation 2,345,731 785,435 6,520,819 1,714,383
Taxation 155,037 43,453 (1,780,216) (439,927)
Profit after taxation 2,500,768 828,888 4,740,603 1,274,456
Attributable to:
Equity holders of the parent 2,556,401 853,244 4,843,373 1,280,111
Non-controlling interest (55,633) (24,356) (102,770) (5,655)
2,500,768 828,888 4,740,603 1,274,456
Earning per share basic and diluted (Rupees) 5.71 1.89 10.82 2.91
The annexed notes form an integral part of this condensed interim consolidated financial information.
Consolidated Condensed Interim Statement of Profit or LossFor the Quarter and Nine Months Ended March 31, 2019 (Un-audited)

DG Cement 3rd Quarter 2019 31
DirectorChief Executive Chief Financial Officer
2019 2018
July to January to July to January to
March March March March
(Rupees in thousand) (Rupees in thousand)
Profit after taxation 2,500,768 828,888 4,740,603 1,274,456
Items that may be re-classified
to profit or loss:
Available for sale financial assets
- Change in fair value of available-for-sale
financial assets (1,989,747) 542,170 760,102 1,294,572
- Gain during the year transferred to
profit and loss account on
derecognition of investment - - - -
(1,989,747) 542,170 760,102 1,294,572
Items that will not be subsequently
re-classified to profit or loss: - - - -
Other comprehensive income
for the period (1,989,747) 542,170 760,102 1,294,572
Total comprehensive income for the period 511,021 1,371,058 5,500,705 2,569,028
Attributable to:
Equity holders of the parent 566,654 1,396,523 5,603,475 2,576,536
Non-controlling interest (55,633) (25,465) (102,770) (7,508)
511,021 1,371,058 5,500,705 2,569,028
The annexed notes form an integral part of this condensed interim consolidated financial information.
Consolidated Condensed Interim Statement of Comprehensive IncomeFor the Quarter and Nine Months Ended March 31, 2019 (Un-audited)

DG Cement 3rd Quarter 201932
DirectorChief Executive Chief Financial Officer
2019 2018 July to July to March March Note (Rupees in thousand)
Cash (used in)/ generated from operations 13 (1,101,273) 6,538,280
Financial cost paid (2,108,536) (243,785)
Retirement and other benefits paid (11,434) (38,877)
Taxes paid (1,085,134) (801,317)
Payment to subsidiary against tax losses - (15,000)
long term deposits - net 104,791 10,435
Net cash (used in)/ from operating activities [A] (4,201,586) 5,449,736
Fixed capital expenditure (3,692,350) (12,318,537)
Proceeds from sale of property, plant and equipment 59,972 40,662
Long term loans and deposits - net (1,655) (980)
Investments made - net 235,843 (203,609)
Interest received 77,109 59,478
Dividend received 1,447,404 1,452,056
Net cash (used in) investing activities [B] (1,873,677) (10,970,930)
Repayment of long term finances (6,267,010) (627,917)
Loan from related party - 45,000
Settlement of derivative financial instrument - (35,077)
Proceeds from long term finances 7,890,510 7,890,510
Dividend paid (1,854,700) (3,378,967)
Net cash / (used in) from financing activities [C] (231,200) 3,893,549
(De) Increase in cash and cash equivalents [A+B+C] (6,306,463) (1,627,645)
Cash and cash equivalents at the beginning of period (13,115,969) (8,164,282)
Exchange loss on cash and cash equivalents (107,355) (128,669)
Cash and cash equivalents at the end of period 14 (19,529,787) (9,920,596)
The annexed notes form an integral part of this condensed interim consolidated financial information.
Consolidated Condensed Interim Cash Flow StatementFor the Nine Months Ended March 31, 2019 (Un-audited)

DG Cement 3rd Quarter 2019 33
Dire
ctor
Chi
ef E
xecu
tive
Chi
ef F
inan
cial
Offi
cer
Cap
ital
res
erve
Rev
enue
res
erve
Bal
ance
as
at J
une
30, 2
018
- A
udit
ed
4,38
1,19
1 4,
557,
163
24,7
00,8
28
353,
510
5,11
0,85
1 37
,884
,238
76
,987
,781
1,
994,
849
78,9
82,6
30To
tal c
omp
rehe
nsiv
e in
com
e fo
r th
e p
erio
d
- P
rofit
for
the
per
iod
-
- -
- -
2,55
6,40
1 2,
556,
401
(55,
633)
2,
500,
768
-
Oth
er c
omp
rehe
nsiv
e in
com
e fo
r th
e p
erio
d
- -
(1,9
89,7
47)
- -
- (1
,989
,747
) (6
61)
(1,9
90,4
08)
To
tal c
ontr
ibut
ions
by
and
dist
ribu
tions
to o
wne
rs
of
the
Com
pany
rec
ogni
zed
dire
ctly
in e
quity
-
Par
ent
com
pan
y
- Fi
nal d
ivid
end
for
the
year
end
ed
Ju
ne 3
0, 2
018
(Rs
4.25
per
sha
re)
- -
- -
- (1
,862
,011
) (1
,862
,011
) -
(1,8
62,0
11)
Bal
ance
as
at M
arch
31,
201
9 -
Una
udit
ed
4,38
1,19
1 4,
557,
163
22,7
11,0
81
353,
510
5,11
0,85
1 38
,578
,628
75
,692
,424
1,
938,
555
77,6
30,9
79
Bal
ance
as
at J
une
30, 2
017
- A
udit
ed
4,38
1,19
1 4,
557,
163
27,9
57,4
95
353,
510
5,11
0,85
1 32
,333
,597
74
,693
,807
1,
971,
423
76,6
65,2
30To
tal c
omp
rehe
nsiv
e in
com
e fo
r th
e p
erio
d
- P
rofit
for
the
per
iod
-
- -
- -
4,84
3,37
3 4,
843,
373
(102
,770
) 4,
740,
603
-
Oth
er c
omp
rehe
nsiv
e in
com
e fo
r th
e p
erio
d
- -
760,
102
- -
- 76
0,10
2 10
,199
77
0,30
1
To
tal c
ontr
ibut
ions
by
and
dist
ribu
tions
to o
wne
rs
of
the
Com
pany
rec
ogni
zed
dire
ctly
in e
quity
-
Par
ent
com
pan
y
- Fi
nal d
ivid
end
for
the
year
end
ed
June
30,
201
7 (R
s 7.
5 p
er s
hare
) -
- -
- -
(3,2
85,8
93)
(3,2
85,8
93)
- (3
,285
,893
)
- S
ubsi
dia
ry c
om
pan
y
- Fi
nal d
ivid
end
for
the
year
end
ed
June
30,
201
7 (R
s 2
per
sha
re)
- -
- -
- -
- (9
3,07
4)
(93,
074)
B
alan
ce a
s at
Mar
ch 3
1, 2
018
- U
naud
ited
4,
381,
191
4,55
7,16
3 28
,717
,597
35
3,51
0 5,
110,
851
33,8
91,0
77
77,0
11,3
89
1,78
5,77
8 78
,797
,167
The
anne
xed
not
es fo
rm a
n in
tegr
al p
art
of t
his
cond
ense
d in
terim
con
solid
ated
fina
ncia
l inf
orm
atio
n.
Rup
ees
in t
hous
and
s
Sha
reca
pit
alS
hare
pre
miu
m
Fair
valu
ere
serv
e
Cap
ital
rede
mpt
ion
rese
rve
fund
Gen
eral
rese
rve
Acc
umul
ated
Prof
it
Tota
l equ
ityat
trib
utab
le to
shar
ehol
ders
of
pare
nt c
ompa
ny
Non
-con
trol
ling
inte
rest
Tota
l
Consolidated Condensed Interim Statement of Changes In Equity For the Nine Months Ended March 31, 2019 (Un-audited)

DG Cement 3rd Quarter 201934
1. Legal Status and nature of business
The group comprises of: - D. G. Khan Cement Company Limited (the parent company); - Nishat Paper Products Company Limited; - Nishat Dairy (Private) Limited.
D. G. Khan Cement Company Limited (the 'Company') is a public company limited by shares incorporated in Pakistan in 1978 under the repealed Companies Act, 1913 (now Companies Act, 2017). The Company's ordinary shares are listed on the Pakistan Stock Exchange Limited. The registered office of the Company is situated at 53-A, Lawrence Road, Lahore. The Company is principally engaged in production and sale of Clinker, Ordinary Portland and Sulphate Resistant Cement. It has four cement plants, two plants located at Dera Ghazi Khan ('D.G. Khan'), one at Khairpur District, Chakwal ('Khairpur') and one at Hub District, Lasbela ('Hub').
Nishat Paper Products Company Limited is a public limited company incorporated in Pakistan. It is principally engaged in the manufacture and sale of paper products and packaging material (hereinafter referred to as the 'Paper segment').
Nishat Dairy (Private) Limited is a private limited company incorporated in Pakistan. It is principally engaged in the business of production and sale of raw milk (hereinafter referred to as the 'Dairy segment').
During the current reporting period Nishat Farm Supplies (Private) Limited dissolve/wond-up.
The registered office of the Group is situated at 53-A, Lawrence Road, Lahore. The parent company's holding in its subsidiaries is as follows:
Effective percentage of holding
- Nishat Paper Products Company Limited 55.00% - Nishat Dairy (Private) Limited 55.10% (approx)
2. Basis of preparation
2.1 Statement of compliance
This condensed interim financial information has been prepared in accordance with the accounting and reporting standards as applicable in Pakistan for interim financial reporting. The accounting and reporting standards as applicable in Pakistan for interim financial reporting comprise of:
- International Accounting Standard (lAS) 34, Interim Financial Reporting, issued by the International Accounting Standards Board (IASB) as notified under the Companies Act, 2017; and
- Provisions of and directives issued under the Companies Act, 2017.
Where the provisions of and directives issued under the Companies Act, 2017 differ with the requirements of lAS 34, the provisions of and directives issued under the Companies Act, 2017 have been followed.
This condensed interim financial information does not include all of the information required for annual financial statements and should be read in conjunction with the annual financial statements as at and for the year ended June 30, 2018. Selected explanatory notes are included to explain events and transactions that are significant to and understanding of the changes in the Group’s financial position and performance since the last annual financial statements.
The Group is required to issue condensed interim consolidated financial information along with its
Notes to and Forming Part of the Consolidated Condensed Interim FinancialFor the Quarter and Nine Months Ended March 31, 2019 (Un-audited)

condensed interim separate financial information in accordance with the requirements of accounting and reporting standards as applicable in Pakistan.
3. Significant accounting policies
3.1 The accounting policies and the methods of computation adopted in the preparation of this condensed interim financial information are the same as those applied in the preparation of preceding annual published financial statements of the Group for the year ended June 30, 2018 except for the adoption of new and amended standards as set out below:
3.2 Standards, amendments and interpretations to International Financial Reporting Standards (IFRS) that are effective in the current period
Certain standards, amendments and interpretations to IFRS are effective for accounting periods beginning on July 1, 2018, but are considered not to be relevant or to have any significant effect on the Group’s operations (although they may affect the accounting for future transactions and events) and are, therefore, not detailed in this condensed interim financial information, except for IFRS 15, ‘Revenue from Contracts with Customers'. The impact of the adoption of this standard and new accounting policy is disclosed in note 3.4 below.
3.3 Standards, amendments and interpretations to existing standards that are not yet effective and have not been early adopted by the Group
The Securities and Exchange Commission of Pakistan ('SECP') through SRO 1007(I)/2017 dated October 4, 2017 had notified that IFRS 9, ‘Financial Instruments’ would be applicable for annual periods beginning on or after July 1, 2018, however, subsequent to reporting date, SECP through SRO 229(I)/2019 dated February 14, 2019 has notified the deferment of this standard to reporting period/year ending on or after June 30, 2019 (earlier application is permitted). Consequently, the Group has not adopted this standard in the preparation of this condensed interim financial information for the half year ended March 31, 2019.
This standard replaces the guidance in IAS 39, ‘Financial Instruments: Recognition and measurement’. It includes requirements on the classification and measurement of financial assets and liabilities; it also includes an expected credit losses model that replaces the current incurred loss impairment model. As allowed above, the Group will apply this standard in the preparation of its financial statements for the year ending June 30, 2019 and it is yet to assess the full impact of this standard.
Further, the following amendments and interpretations to existing standards have been published and are mandatory for the Group's accounting period beginning on July 1, 2019, and the Company has not early adopted them:
Effective date (accounting periods beginning on or after)
IFRS 16 ‘Leases' 01-Jan-19 IFRIC 23 'Uncertainty over income tax treatments' 01-Jan-19
The Group will apply these standards/interpretations to standards from their respective effective dates and has yet to assess the impact of these amendments on its financial statements.
3.4 New accounting policy and impact thereof
3.4.1 IFRS 15, 'Revenue from Contracts with Customers'
The following amendments and interpretations to existing standards have been published and are mandatory for the Group's accounting periods beginning on or after July 01, 2018 or later periods, and the Group has not early adopted them:
New accounting policy
Revenue from sale of goods is recognised when the when the Group satisfies a performance
DG Cement 3rd Quarter 2019 35

obligation by transferring a promised good or service to a customer.
For cement segment: In case of local sales, revenue is recognised at the time of despatch from the factory.
In case of export sales of the segment, the delivery of cement/clinker and transportation are two distinct performance obligations and the total transaction price is allocated to each performance obligation. Revenue relating to each performance obligation is recognized on satisfaction of each distinct performance obligation.
Return on deposits is accrued on a time proportionate basis by reference to the principal outstanding and the applicable rate of return.
Dividend income on equity investments is recognised as income when the right of receipt is established.
For paper segment:
Revenue from the sale of goods is recognised at the time of despatch from the factory.
For Dairy Segment:
Revenue is recognised at the time of despatch of goods.
Mark-up on deposits with banks or interest-bearing balances with parties are accrued on a time proportion basis by reference to the principal outstanding and rates applicable thereon.
Impact of adoption
The Group has applied IFRS 15 using the modified retrospective approach for transition. This approach requires entities to recognise the cumulative effect of initially applying IFRS 15 as an adjustment to the opening balance of un-appropriated profit in the period of initial application. Comparative prior year periods would not be adjusted. The application of IFRS 15 does not have any significant impact on the revenue recognition policy of the Group and therefore, the cumulative effect of initially applying this standard as an adjustment to the opening balance of un-appropriated profit in the period of initial application is not material and hence, has not been accounted for.
3.5 Significant accounting estimates, judgements and financial risk:
The preparation of this condensed interim financial information requires the management to make judgements, estimates and assumptions that affect the application of policies and the reported amounts of assets, liabilities, income and expenses. Actual results may differ from these estimates.
In preparing this condensed interim financial information, the significant judgements made by the management in applying the Group’s accounting policies and the key sources of estimation uncertainty were the same as those that applied to the financial statements for the year ended June 30, 2018, with the exception of changes in estimates of useful lives of operating fixed assets of D. G. Khan Cement Company Limited as referred to in Note 3.4 and those that are required in determining the provision for income taxes as referred to in note 4 and.
The Group's financial risk management objectives and policies are consistent with those disclosed in the financial statements as at and for the year ended June 30, 2018.
3.6 Change in accounting estimate
During the period, the Group carried out a comprehensive review of the remaining useful lives of the cement segment's operating fixed assets and as a result of such review, management identified that plant and machinery, factory buildings and quarry equipment require an upward revision whereas
DG Cement 3rd Quarter 201936

furniture and fittings and office equipment require a downward revision in their useful lives. Hence, the remaining useful lives of plant and machinery, factory buildings and quarry equipment have been increased while useful lives of furniture and fittings and office equipment have been decreased. Such change has been accounted for as a change in an accounting estimate in accordance with IAS 8 ‘Accounting Policies, Changes in Accounting Estimates and Errors’. Had there been no change in the accounting estimate, the profit before tax for the nine month ended March 31, 2019 would have been lower by Rs 1,481.810 million and carrying value of operating fixed assets as at that date would have been lower by the same amount. Consequently, due to the above change in accounting estimate, future profits before tax would decrease by Rs 1,481.810 million.
4. Taxation
Income tax expense is recognised based on management's estimate of the weighted average effective annual income tax rate expected for the full financial year.
March 31, June 30, 2019 2018 Un-audited audited (Rupees in thousand)
5. Long term finances
Long term loans - note 5.1 22,291,471 20,667,971
Less: Current portion shown under current liabilities 4,399,294 2,337,647
17,892,177 18,330,324
5.1 Long term loans
Opening balance 20,667,971 13,133,750
Add: Disbursements during the period 2,950,000 8,453,805
Exchange loss during the period - -
23,617,971 21,587,555
Less: Repayment during the period 1,326,500 919,584
Closing balance 22,291,471 20,667,971
6. Loan from related party - unsecured
This represents unsecured and interest free loan provided by the three directors of the Dairy Segment. The loan amount shall be payable within one year from the execution date.
7. Contingencies and commitments
7.1 Contingencies
There is no significant change in contingencies from the preceding annual financial statements of the Group for the year ended June 30, 2018 except for except for the matter disclosed in note 16.1.7 to the previous annual financial statements, which is mentioned below:
The cement segment made alternate arrangements of water for its Khairpur plant and hence, the Honourable Supreme Court of Pakistan disposed of the matter through its order dated November 19, 2018 (further amended through its order dated January 10, 2019) wherein it directed the Company to contribute Rs 100 million to the "Diamer-Bhasha and Mohmand Dams Fund" which the Company has deposited during the period.
DG Cement 3rd Quarter 2019 37

7.2 Commitments in respect of:
(i) Contracts for capital expenditure Rs 352.680 million (June 30, 2018: Rs 224.277 million)
(ii) Letters of credits for capital expenditure Rs 2,280.783 million (June 30, 2018: Rs 235.266 million)
(iii) Letters of credit other than capital expenditure Rs 1,851.267 million (June 30, 2018: Rs 3,685.854 million)
(iv) The amount of future payments under operating leases and the period in which these payments will become due are as follows:
March 31, June 30, 2019 2018 Un-audited audited (Rupees in thousand)
Not later than one year 425 331 Later than one year and not later than five years 1,699 1,325 Later than five years 5,228 4,307 7,352 5,963
8. Property, plant and equipment
Operating assets - note 8.1 75,612,921 77,509,420 Capital work-in-progress - note 8.2 5,515,002 2,981,059 Major spare parts and stand-by equipment 355,304 91,766 81,483,227 80,582,245
8.1 Operating assets
Opening book value 77,509,420 34,336,559 Add: Additions during the period/ year -note 8.1.1 930,439 47,234,857 78,439,859 81,571,416 Less: Disposals during the period/ year - net book value -note 8.1.2 36,808 222,769 Impairment charge during the period/year - 1,270,120 Depreciation charged during the period/ year 2,790,130 2,569,107 Closing book value 75,612,921 77,509,420
8.1.1 Major additions during the period
Freehold land 48,575 202,663 Buildings on freehold land 2,680 12,270,389 Office building and housing colony 7,408 1,411,901 Roads 3,052 827,897 Plant and machinery 207,922 27,447,033 Quarry equipment 326,084 1,886,974 Furniture, fixtures and office equipment 112,693 184,858 Motor vehicles 219,299 153,892 Power and water supply lines 2,726 2,849,250 930,439 47,234,857
DG Cement 3rd Quarter 201938
March 31, June 30, 2019 2018 Un-audited audited (Rupees in thousand)
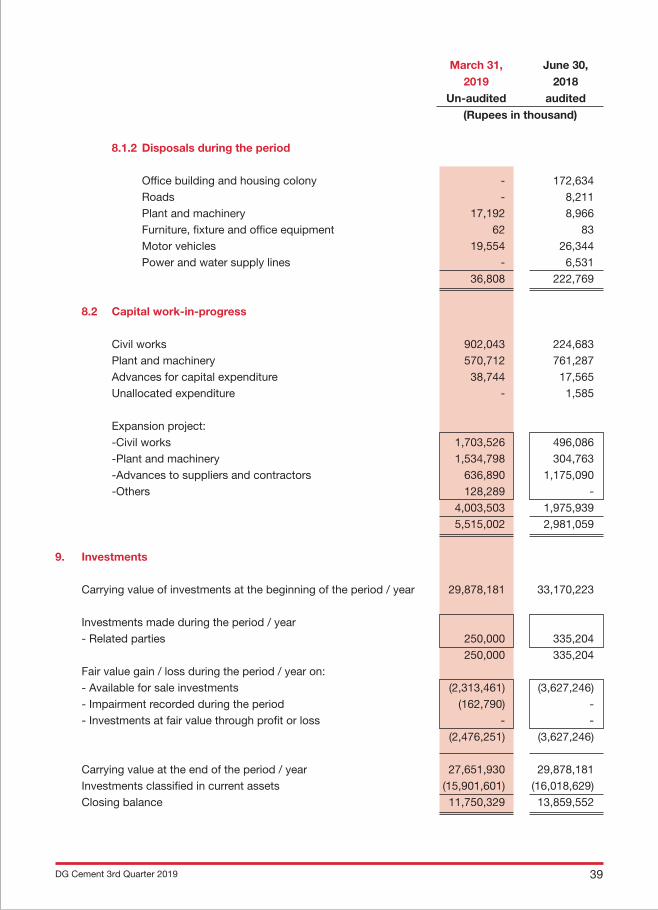
8.1.2 Disposals during the period
Office building and housing colony - 172,634 Roads - 8,211 Plant and machinery 17,192 8,966 Furniture, fixture and office equipment 62 83 Motor vehicles 19,554 26,344 Power and water supply lines - 6,531 36,808 222,769
8.2 Capital work-in-progress
Civil works 902,043 224,683 Plant and machinery 570,712 761,287 Advances for capital expenditure 38,744 17,565 Unallocated expenditure - 1,585 Expansion project: -Civil works 1,703,526 496,086 -Plant and machinery 1,534,798 304,763 -Advances to suppliers and contractors 636,890 1,175,090 -Others 128,289 - 4,003,503 1,975,939 5,515,002 2,981,059
9. Investments
Carrying value of investments at the beginning of the period / year 29,878,181 33,170,223
Investments made during the period / year - Related parties 250,000 335,204 250,000 335,204 Fair value gain / loss during the period / year on: - Available for sale investments (2,313,461) (3,627,246) - Impairment recorded during the period (162,790) - - Investments at fair value through profit or loss - - (2,476,251) (3,627,246)
Carrying value at the end of the period / year 27,651,930 29,878,181 Investments classified in current assets (15,901,601) (16,018,629) Closing balance 11,750,329 13,859,552
DG Cement 3rd Quarter 2019 39

DG Cement 3rd Quarter 201940
10. Loan to related party
This represents loan to Nishat Hotels and Properties Limited that was originally repayable on October 30, 2018, however, its extension for one year was approved by the members of the Group in their Annual General Meeting held on October 28, 2018 as per the requirements of section 199 of the Act on the same terms except for change in mark-up rate from 3 months KIBOR + 0.5% to 1 month KIBOR + 0.5% per annum.
2019 2018 July to January to July to January to March March March March (Rupees in thousand)
11. Cost of sales
Raw and packing materials consumed 3,533,875 972,266 2,720,409 1,048,617 Forage 761,740 262,772 662,041 221,653 Medicine and related items 68,032 23,524 62,020 17,691 Salaries, wages and other benefits 2,531,469 898,083 1,664,349 549,045 Electricity and gas 3,761,184 1,368,027 1,758,864 727,443 Furnace oil and coal 12,470,810 4,536,366 6,878,532 2,334,656 Stores and spares consumed 2,346,958 788,330 1,407,526 546,178 Repair and maintenance 389,646 41,933 273,766 86,679 Insurance 65,655 20,053 43,994 14,746 Depreciation on property, plant and equipment 2,731,523 918,437 1,665,015 558,033 Royalty 540,947 189,577 254,433 85,437 Excise duty 36,414 12,692 24,321 8,196 Vehicle running expenses 66,520 30,022 24,483 9,992 Postage, telephone and telegram 8,195 3,290 3,966 1,463 Printing and stationery 17,552 9,156 8,720 2,120 Legal and professional charges 4,401 1,474 1,578 259 Travelling and conveyance 9,713 3,017 5,329 1,823 Plant cleaning and gardening 24,585 9,205 26,171 8,633 Rent, rates and taxes 97,694 39,301 43,506 15,203 Freight charges 43,676 6,934 22,527 7,465 Other expenses 247,093 30,696 89,698 22,502 Total manufacturing cost 29,757,682 10,165,155 17,641,248 6,267,834
Opening work-in-process 493,431 1,784,164 522,557 94,028 Closing work-in-process (2,494,420) (2,494,420) (67,352) (67,352) (2,000,989) (710,256) 455,205 26,676 Cost of goods manufactured 27,756,693 9,454,899 18,096,453 6,294,510
Opening stock of finished goods 535,499 614,199 431,356 364,904 Closing stock of finished goods (763,660) (763,660) (215,637) (215,637) (228,161) (149,461) 215,719 149,267 Less: Own consumption capitalized (109,029) (29,889) (163,171) (52,042) 27,419,503 9,275,549 18,149,001 6,391,735

12. Transactions with related parties
The related parties include the subsidiaries, the Investor (Nishat Mills Limited), related parties on the basis of common directorship, group companies, key management personnel including directors and post employment benefit plans. The Group in the normal course of business carries out transactions with various related parties. Significant transactions with related parties are as follows:
July to July to
March March
2019 2018
Un-audited Un-audited
(Rupees in thousand)
Relationship with the Nature of transaction Group i. Entities on the basis of common directorship Insurance premium 1,537 1,338 Sale of goods 87,073 39,607 Mark-up income on balances with related parties 72,581 50,240 Dividend income 27,229 62,453 Dividends paid 14,273 25,188
ii. Investor Sale of goods 40,986 76,296 Dividend income 143,875 128,730 Dividends paid 584,690 1,031,807
iii. Other related entities Insurance premium 108,542 69,492 Sale of goods 326 - Dividend income 1,267,337 1,247,331 Dividends paid 971 1,714 Purchase of goods and services 31,634 26,662 Insurance claims received 1,531 -
iv. Key management Salaries and other personnel employment benefits 180,283 152,965
v. Post employment Expense charged in respect of benefit plans defined benefit plan (including capitalized) 92,831 79,825
Expense charged in respect of defined contribution plan (including capitalized) 62,108 51,191
DG Cement 3rd Quarter 2019 41

DG Cement 3rd Quarter 201942
March 31, June 30,
2019 2018
Un-audited audited
(Rupees in thousand) Payable to related parties
Trade and other payables 896 6,418
Receivable from related parties Trade debts 34,423 6,516 Loan to related party 1,000,000 1,000,000 Loan, advances, deposits, prepayments and other receivables 9,384 5,937 1,043,807 1,012,453
July to July to
March, March,
2019 2018
Un-audited Un-audited
(Rupees in thousand)
13. Cash generated from operations
Profit before tax 2,345,731 6,520,819 Adjustment for : - Depreciation on property, plant and equipment 2,790,130 1,723,538 - Profit on bank deposits (7,976) (9,564) - Profit on disposal of property, plant and equipment (23,164) (7,554) - Dividend income (1,447,404) (1,452,056) - Provision of WPPF 134,645 362,641 - Retirement and other benefits accrued 61,368 78,336 - Mark-up income on Loans (72,581) (50,253) - Exchange loss - net 173,768 183,655 - Finance cost 2,457,596 339,008 - (Gain)/loss on derivative financial instruments - (12,979) Profit before working capital changes 6,412,113 7,675,591
- Stores, spares and loose tools (3,167,415) (594,619) - Stock-in-trade (3,074,653) 577,496 - Trade debts (1,698,101) (322,451) - Advances, deposits, prepayments and other receivables 521,188 (1,216,605) - Trade and other payables (94,405) 418,868 Net working capital changes (7,513,386) (1,137,311) Cash (used in)/ generated from operations (1,101,273) 6,538,280

March 31, March 31, 2019 2018 Un-audited Un-audited (Rupees in thousand)
14. Cash and cash equivalents
Short term borrowings - secured (20,599,684) (10,304,578)
Cash and bank balances 1,069,897 383,982
(19,529,787) (9,920,596)
15. Financial risk management
15.1 Financial risk factors
The group’s activities expose it to a variety of financial risks: market risk (including currency risk, fair value interest rate risk, cash flow interest rate risk and price risk), credit risk and liquidity risk.
The consolidated condensed interim financial information does not include all financial risk management information and disclosures required in the annual financial statements, and should be read in conjunction with the group’s annual financial statements as at June 30, 2018.
There have been no changes in the risk management department or in any risk management policies since the year ended June 30, 2018.
15.2 Fair value estimation
a) Fair value hierarchy
The different levels for fair value estimation used by the Group have been defined as follows:
- The fair value of financial instruments traded in active markets (such as publicly traded equity securities) is based on quoted (unadjusted) market prices at the end of the reporting period. The quoted market price used for financial assets held by the Group is the current bid price. These instruments are included in Level 1.
- The fair value of financial instruments that are not traded in an active market (for example over-the-counter derivatives) is determined using valuation techniques which maximize the use of observable market data and rely as little as possible on entity specific estimates. If all significant inputs required to determine fair value of an instrument are observable, the instrument is included in Level 2.
- If one or more of the significant inputs is not based on observable market data, the instrument is included in level 3. This is the case for unlisted equity instruments.
To provide an indication about the reliability of the inputs used in determining fair value, the Group classifies its financial instruments into the three levels prescribed above. The following table presents the Group’s financial assets measured and recognised at fair value at March 31, 2019 and June 30, 2018 on a recurring basis:
DG Cement 3rd Quarter 2019 43

Level 1 Level 2 Level 3 Total As at March 31, 2019 (Rupees in thousand)
Assets
Investment - At fair value through
profit or loss
Investments - Available for sale
-Quoted equity instruments 25,805,250 - - 25,805,250
-Unquoted equity instruments - - 1,846,680 1,846,680
Biological assets - - 600,833 600,833
Total assets 25,805,250 - 2,447,513 28,252,763
Level 1 Level 2 Level 3 Total As at June 30, 2018 (Rupees in thousand)
Assets Investment - At fair value through
profit or loss 35 - - 35
Investments - Available for sale
-Quoted equity instruments 26,485,976 - - 26,485,976
-Unquoted equity instruments - - 3,392,170 3,392,170
Biological assets - - 636,403 636,403
Total assets 26,486,011 - 4,028,573 30,514,584
The Group’s policy is to recognise transfers into and transfers out of fair value hierarchy levels as at the end of the reporting period.
There were no transfers between Level 1, 2 and 3 during the period. There were no changes in valuation techniques during the period.
The Group did not measure any financial assets or financial liabilities at fair value on a non-recurring basis as at March 31, 2019.
b) Valuation techniques used to determine fair values
Specific valuation techniques used to value financial instruments include:
- the use of quoted market prices or dealer quotes for similar instruments; and
- for other financial instruments - discounted cash flow analysis.
c) Fair value measurements using significant unobservable inputs
The main level 3 inputs used by the Group to determine fair value of investment in Nishat Hotels and Properties Limited ('NHPL') are derived and evaluated as follows:
- Discount rate is determined using a capital asset pricing model to calculate a pre-tax rate that reflects current market assessments of the time value of money and the risk specific to NHPL.
DG Cement 3rd Quarter 201944
- Long term growth rate is estimated based on historical performance of NHPL and current market information for similar type of companies.
- Long term growth rate is estimated based on historical performance of NHPL and current market information for similar type of companies.
The significant assumptions used in this valuation technique are as follows:
- Discount rate of 12.37%.
- Long term growth rate of 4% for computation of terminal value.
- Annual growth in costs and revenues is linked to inflation at 5.25% per annum.
The fair value/carrying amount of the investment in Hyundai Nishat Motors (Private) Limited is not material to the interim financial information and hence, the inputs used have not been disclosed.
The main level 3 inputs used by the Group to determine fair value of biological assets are derived and evaluated as follows:
The fair value of these assets is determined by an independent professionally qualified valuer. Latest valuation of these assets was carried out on June 30, 2018. Level 3 fair value of Biological assets has been determined using a replacement cost approach, whereby, current cost of similar dairy cattle in the international market has been adjusted for transportation costs to arrive at fair value. 'The international market prices of similar dairy cattle, when these increase the fair value increases. The fair value is also dependent on the age of the cattle. The fair value increases as the cows mature. This value decreases as cows age and go through lactations.
Fair value sensitivity analysis
For biological assets
If the fair value of biological assets , at the period end date fluctuates by 1% higher/lower with all other variables held constant, pre tax loss for the period would have been Rs 6.008 million (June, 2018: Rs 5.992) lower/higher mainly as a result of lower/higher fair value loss on biological assets.
16. Summary of significant transactions and events
The Group's financial position and performance was particularly affected by the following events and transactions during the interim reporting period:
- repaid principal on long term finance aggregating Rs 1,326.500 million (refer to note 5.1);
- change in estimate of useful lives of operating fixed assets (refer to note 3.4);
- fair value loss recognized in respect of investment in Nishat Hotels and Properties Limited (refer to note 9.1);
- dividends paid amounting to Rs 1,854.700 million (refer to statement of cash flows); and
- deposited Rs 100 million in the "Diamer-Bhasha and Mohmand Dams Fund" created by the Supreme Court of Pakistan (refer to note 7.1).
DG Cement 3rd Quarter 2019 45

DG Cement 3rd Quarter 201946
17. Operating segments
Segment information is presented in respect of the group's business. The primary format, business segment, is based on the group's management reporting structure.
The group's operations comprise of the following main business segment types:
Type of segments Nature of business
Cement Production and sale of clinker, Ordinary Portland and Sulphate Resistant Cements.
Paper Manufacture and supply of paper products and packing material.
Dairy Production of raw milk
17.1 Segment analysis and reconciliation - condensed
The information by operating segment is based on internal reporting to the Group executive committee, identified as the 'Chief Operating Decision Maker' as defined by IFRS 8. This information is prepared under the IFRS's applicable to the consolidated financial statements. All group financial data are assigned to the operating segments.

DG Cement 3rd Quarter 2019 47
Rup
ees
in t
hous
and
s
July
1 t
o M
arch
31,
Cem
ent
Pap
er
Dai
ry
Elim
inat
ion
- ne
tC
onso
lidat
ed
Rev
enue
from
- E
xter
nal C
usto
mer
s 30
,375
,649
23
,375
,208
1,
152,
296
1,09
2,87
6 1,
081,
706
927,
241
- -
32,6
09,6
51
25,3
95,3
25
- In
ter-
grou
p
- -
1,73
8,37
1 1,
013,
546
- -
(1,7
38,3
71)
(1,0
13,5
46)
- -
30,3
75,6
49
23,3
75,2
08
2,89
0,66
7 2,
106,
422
1,08
1,70
6 92
7,24
1 (1
,738
,371
) (1
,013
,546
) 32
,609
,651
25
,395
,325
Seg
men
t gro
ss p
rofit
/(los
s)
4,96
5,29
0 7,
169,
301
383,
806
265,
752
(127
,596
) (1
81,8
86)
(31,
352)
(6
,843
) 5,
190,
148
7,24
6,32
4
Seg
men
t exp
ense
s (2
,020
,631
) (1
,802
,599
) (7
0,90
9)
(62,
455)
(1
18,2
82)
(180
,935
) -
- (2
,209
,822
) (2
,045
,989
)
Oth
er in
com
e
1,71
7,59
8 1,
638,
931
10,5
22
12,8
32
95,5
78
8,37
2 (6
97)
(643
) 1,
823,
001
1,65
9,49
2
Fina
ncia
l cha
rges
(2
,259
,914
) (3
18,0
25)
(192
,618
) (1
9,50
1)
(5,0
64)
(1,4
82)
- -
(2,4
57,5
96)
(339
,008
)
Taxa
tion
222,
457
(1,7
17,7
79)
(59,
241)
(6
0,92
5)
(8,1
79)
(1,5
12)
- -
155,
037
(1,7
80,2
16)
Pro
fit/(l
oss)
afte
r tax
atio
n 2,
624,
800
4,96
9,82
9 71
,560
13
5,70
3 (1
63,5
43)
(357
,443
) (3
2,04
9)
(7,4
86)
2,50
0,76
8 4,
740,
603
Dep
reci
atio
n
2,58
7,17
6 1,
527,
809
45,1
40
24,8
72
135,
617
146,
984
22,1
97
23,8
73
2,79
0,13
0 1,
723,
538
Cap
ital e
xpen
ditu
re
(3,6
91,5
58)
(11,
495,
855)
(1
,424
) (9
34,9
25)
(34,
947)
(6
8,40
0)
35,5
79
180,
643
(3,6
92,3
50)
(12,
318,
537)
Cas
h to
ope
ratio
ns
(2,4
24,2
19)
5,98
8,15
2 (1
,025
,292
) (3
95,7
44)
(103
,787
) (7
8,51
4)
(648
,288
) (6
4,15
8)
(4,2
01,5
86)
5,44
9,73
6
Cas
h fro
m in
vest
ing
(2,3
92,0
48)
(10,
053,
059)
(3
3)
(974
,027
) 38
,184
(8
0,00
1)
480,
220
136,
157
(1,8
73,6
77)
(10,
970,
930)
Rup
ees
in th
ousa
nds
31.0
3.20
19
30.0
6.20
18
31.0
3.20
19
30.0
6.20
18
31.0
3.20
19
30.0
6.20
18
31.0
3.20
19
30.0
6.20
18
31.0
3.20
19
30.0
6.20
18
unau
dite
d au
dite
d un
audi
ted
audi
ted
unau
dite
d au
dite
d un
audi
ted
audi
ted
unau
dite
d au
dite
d
Seg
men
t ass
ets
1
27,6
69,6
08
121,
889,
015
5,47
7,27
8 3,
819,
137
3,03
2,74
6 3,
133,
181
(2,3
83,6
14)
(2,4
25,6
30)
133,
796,
018
126,
415,
703
Seg
men
t lia
bilit
ies
51,
762,
147
44,7
54,5
98
4,06
8,99
4 2,
481,
688
580,
964
517,
857
(247
,066
) (3
21,0
70)
56,1
65,0
39
47,4
33,0
73
17
.2
Geo
grap
hica
l seg
men
ts
All
segm
ents
of t
he g
roup
are
man
aged
on
natio
n-w
ide
basi
s an
d op
erat
e m
anuf
actu
ring
faci
litie
s an
d sa
les
offic
es in
Pak
ista
n on
ly.
2019
2018
2019
2018
2019
2018
2019
2018
2019
2018

DG Cement 3rd Quarter 201948
DirectorChief Executive Chief Financial Officer
18. Date of authorization for issue
This consolidated condensed interim financial information was authorized for issue on April 24, 2019 by the Board of Directors of the of the Parent Company.
19 Event occurring after the reporting period
Subsequent to period end, owing to the attack in Pulwama in Indian Occupied Kashmir on February 14, 2019, exports to India have been suspended due to imposition of 200% custom duty by the Indian goverment on all imports from Pakistan. Cement segment's export of cement to India during the period was 155,000 metric tonnes amounting to Rs 1,029.593 million and a similar quantity of exports was projected in the subsequent half year ending June 30, 2019, uptil the happening of the aforementioned incident.
20. Corresponding figures
In order to comply with the requirements of International Accounting Standard 34 - 'Interim Financial Reporting', the condensed interim consolidated balance sheet have been compared with the balances of annual audited financial statements of preceding financial year, whereas, the condensed interim consolidated profit and loss account, condensed interim consolidated statement of comprehensive income, condensed interim consolidated cash flow statement and condensed interim consolidated statement of changes in equity have been compared with the balances of comparable period of immediately preceding financial year.

VE
RS
AT
ILE
P
h: +
92 4
2 37
12 1
920
Nishat House, 53-A, Lawrence Road, Lahore-Pakistan.UAN:+92-42-111-11-33-33
D.G. KHAN CEMENT COMPANY LIMITED