3rd Paper Shallow Water Effect on Turning Motion of a Pusher Barge System Aphydro 2008
8
Shallow Water Effect on Turning Motion of a Pusher-Barge System Koh Kho King 1 , Hironori Yasukawa 2 and Noritaka Hirata 3 Graduate School of Engineering, Hiroshima University, 1-4-1 Kagamiyama, Higashi Hiroshima, Hiroshima, Japan 739-8527. 1 Ph.D course student, E-mail: [email protected] 2 Professor, E-mail: [email protected] 3 Assistant Professor, E-mail: [email protected] ABSTRACT Nine different pusher-barge systems and eight unconventionally arranged pusher-barge systems have been studied by the authors [1][2]. This paper is a continuation to the previous studies by taking pusher-barge system (11BP) into shallow water condition. Shallow water rotating arm test (RAT) was conducted at Kyushu University with water height to ship’s draught ratio (h/d) 1.2 (shallow water), 1.5 (medium shallow) and 19.3 (deep water) conditions. Hydrodynamic derivatives were obtained from the model test data by using least squares fitting method and new hydrodynamic derivative equations suitable for the three water draught ratio conditions were introduced. Linear derivatives were compared with studies from different researchers [3][4][5]. Added mass in shallow water was calculated using singularity distribution method under the assumption of rigid free surface. Propeller and rudder hull interaction parameters were pre-assumed based on the study of other researchers in shallow water condition. Pusher-barge 11BP is found to have negative course stability index in shallow water condition, which means the pusher is unstable. Maneuvering simulations were performed at 20 degrees and 35 degrees turning. Pusher-barge 11BP is found to have the largest turning circle in deep water and smallest turning circle in shallow water condition. Course keeping ability decreases from deep to medium shallow to shallow water conditions. KEY WORDS: Pusher-barge; shallow water effect; turning motion. 1 INTRODUCTION Pusher-barge systems are commonly being used in inland water- ways, where water depth often is of limitation. In ship maneuver- ing, water depth plays an important role, where different water depth will result different turning characteristics of a vessel. Nine different pusher-barge systems [1] and eight unconventionally ar- ranged pusher-barge systems [2] were studied by the authors. As a continuation to the pusher-barge study, shallow water ef- fect in maneuvering was investigated in this paper. Pusher-barge system, 11BP, was taken as the subject of the study and shallow water tests were conducted at Kyushu University. Hydrodynamic derivatives were obtained by least squares fitting to the model test data. Maneuvering simulations were performed based on the captured hydrodynamic derivatives and also some pre-assumed propeller and rudder hull interaction parameters with referred to the study of other researchers. These were discussed in more details in the later sections. 2 SHIP MODEL Principal particulars of the pusher and barge in model scale and full-scale used in the research are shown in Table 1. Fig. 1 shows the body plan of the pusher and barge used. Pusher used in the model test is without propeller and rudder installed. However, in the simulation pusher used is assumed to be twin screws and twin rudders. Controllable pitch propeller (CPP) is assumed to be installed with diameter (D P ) 1.8m and revolution 300rpm. Main engine power is 1000kW. Rudder span is 2.0m, cord 2.0m and area (AR) 4.0m 2 . Pusher design and specifications are with referred to reference [6]. Rake-barge with ship like design at the bow was used in the study. Bow part of the rake-barge is curved and sharp with water piercing design. Table 1 shows the principal dimensions of the rake-barge. Body plan of the rake-barge is shown in Fig. 1. In this paper, one pusher and one barge were used as the subject of the study. One rake-barge and a pusher were arranged in- line, named ”11BP”. Table 2 shows the principal dimensions of pusher-barge 11BP, where LOA is the length overall of the system, B is the maximum breadth, d is the water draught, and C b is the block coefficient with regards to the LOA, B and d of the system. Fig. 2 shows the photo of the actual model of 11BP pusher-barge system used in the model experiment. Scale ratio of the model is 1/50. Propellers and rudders were not installed during the experiment. Table 2: Principal dimensions of the pusher-barge system in full- scale symbol 11BP LOA (m) 100.96 B (m) 10.67 d (m) 2.74 5 (m 3 ) 2140.9 LCB from AP (m) 58.47 C b 0.725 3 HYDRODYNAMIC DERIVATIVES CHAR- ACTERISTICS 3.1 Captive Model Test In order to obtain shallow water hydrodynamic derivatives, rotat- ing arm test (RAT) was performed at Kyushu University square tank. In the experiments, three different water depth to ship’s draught ratios were performed, where h/d = 19.3 (deep wa- ter), 1.5 (medium shallow) and 1.2 (shallow water). Water was drained from the tank in order to get the desired water height to model’s draught ratio. Model’s trim, draught and roll motions
-
Upload
kostasmicha -
Category
Documents
-
view
47 -
download
0
Transcript of 3rd Paper Shallow Water Effect on Turning Motion of a Pusher Barge System Aphydro 2008

Shallow Water Effect on Turning Motionof a Pusher-Barge System
Koh Kho King1, Hironori Yasukawa2 and Noritaka Hirata3
Graduate School of Engineering, Hiroshima University, 1-4-1 Kagamiyama, Higashi Hiroshima,Hiroshima, Japan 739-8527.
1Ph.D course student, E-mail: [email protected], E-mail: [email protected]
3Assistant Professor, E-mail: [email protected]
ABSTRACT
Nine different pusher-barge systems and eight unconventionally arranged pusher-barge systems have been studied by the authors [1][2].This paper is a continuation to the previous studies by taking pusher-barge system (11BP) into shallow water condition. Shallow waterrotating arm test (RAT) was conducted at Kyushu University with water height to ship’s draught ratio (h/d) 1.2 (shallow water), 1.5(medium shallow) and 19.3 (deep water) conditions. Hydrodynamic derivatives were obtained from the model test data by using leastsquares fitting method and new hydrodynamic derivative equations suitable for the three water draught ratio conditions were introduced.Linear derivatives were compared with studies from different researchers [3][4][5]. Added mass in shallow water was calculated usingsingularity distribution method under the assumption of rigid free surface. Propeller and rudder hull interaction parameters werepre-assumed based on the study of other researchers in shallow water condition. Pusher-barge 11BP is found to have negative coursestability index in shallow water condition, which means the pusher is unstable. Maneuvering simulations were performed at 20 degreesand 35 degrees turning. Pusher-barge 11BP is found to have the largest turning circle in deep water and smallest turning circle inshallow water condition. Course keeping ability decreases from deep to medium shallow to shallow water conditions.
KEY WORDS: Pusher-barge; shallow water effect; turning motion.
1 INTRODUCTION
Pusher-barge systems are commonly being used in inland water-ways, where water depth often is of limitation. In ship maneuver-ing, water depth plays an important role, where different waterdepth will result different turning characteristics of a vessel. Ninedifferent pusher-barge systems [1] and eight unconventionally ar-ranged pusher-barge systems [2] were studied by the authors.
As a continuation to the pusher-barge study, shallow water ef-fect in maneuvering was investigated in this paper. Pusher-bargesystem, 11BP, was taken as the subject of the study and shallowwater tests were conducted at Kyushu University. Hydrodynamicderivatives were obtained by least squares fitting to the modeltest data. Maneuvering simulations were performed based on thecaptured hydrodynamic derivatives and also some pre-assumedpropeller and rudder hull interaction parameters with referredto the study of other researchers. These were discussed in moredetails in the later sections.
2 SHIP MODEL
Principal particulars of the pusher and barge in model scale andfull-scale used in the research are shown in Table 1. Fig. 1 showsthe body plan of the pusher and barge used. Pusher used in themodel test is without propeller and rudder installed. However,in the simulation pusher used is assumed to be twin screws andtwin rudders. Controllable pitch propeller (CPP) is assumed tobe installed with diameter (DP ) 1.8m and revolution 300rpm.Main engine power is 1000kW. Rudder span is 2.0m, cord 2.0mand area (AR) 4.0m
2. Pusher design and specifications are withreferred to reference [6].
Rake-barge with ship like design at the bow was used in thestudy. Bow part of the rake-barge is curved and sharp with waterpiercing design. Table 1 shows the principal dimensions of therake-barge. Body plan of the rake-barge is shown in Fig. 1. In
this paper, one pusher and one barge were used as the subjectof the study. One rake-barge and a pusher were arranged in-line, named ”11BP”. Table 2 shows the principal dimensionsof pusher-barge 11BP, where LOA is the length overall of thesystem, B is the maximum breadth, d is the water draught, andCb is the block coefficient with regards to the LOA, B and d ofthe system. Fig. 2 shows the photo of the actual model of 11BPpusher-barge system used in the model experiment. Scale ratioof the model is 1/50. Propellers and rudders were not installedduring the experiment.
Table 2: Principal dimensions of the pusher-barge system in full-scale
symbol 11BP
LOA (m) 100.96B (m) 10.67d (m) 2.745 (m3) 2140.9
LCB from AP (m) 58.47Cb 0.725
3 HYDRODYNAMIC DERIVATIVES CHAR-ACTERISTICS
3.1 Captive Model Test
In order to obtain shallow water hydrodynamic derivatives, rotat-ing arm test (RAT) was performed at Kyushu University squaretank. In the experiments, three different water depth to ship’sdraught ratios were performed, where h/d = 19.3 (deep wa-ter), 1.5 (medium shallow) and 1.2 (shallow water). Water wasdrained from the tank in order to get the desired water height tomodel’s draught ratio. Model’s trim, draught and roll motions

Table 1: Principal dimensions of the pusher and barge
pusher rake-bargeFull-scale Model Full-scale Model
Length Overall, LOA (m) 40.00 0.80 60.96 1.22Length btw. Perpendiculars, LBP (m) 39.50 0.79 60.96 1.22
Breadth, B (m) 9.00 0.18 10.67 0.21Draft, d (m) 2.20 0.044 2.74 0.055
Volume, 5 (m3) 494.7 0.00396 1646.2 0.01317LCB from AP (m) 21.98 0.4395 29.44 0.5888Block Coefficient, Cb 0.633 0.633 0.924 0.924
Fig. 1: Body plans of the pusher and the rake-barge
were fixed. Model forward speed, U = 0.364m/s, is equivalentto full-scale ship’s speed of 5 knots. During the experiments,force and moment transducer was used and placed at the mid-ship of the pusher-barge model. Longitudinal force (X∗H),lateralforce (Y ∗H) and yawing moment (NH) were recorded and non-dimensionalized using the following equations:
X∗0H , Y
∗0H =
X∗H , Y∗H
(1/2)ρ LOA dU2(1)
N 0H =
NH
(1/2)ρ LOA2 dU2(2)
In the equation, LOA is the length overall of the pusher-bargesystem, ρ is water density, d is model’s draught, and U is theforward speed. ”∗” denotes results measured from experimentswith virtual mass influence included. No correction was neededfor NH due to virtual mass, hence NH was used directly in theequation. Since, forces and moment measured from the experi-ments are having added mass influences included, they must becalculated separately and be excluded when processing the ex-periment data.
3.2 Added Mass Coefficients
Added mass coefficients in shallow water were calculated usingsingularity distribution method with the assumption of rigid free-surface. Fig. 3 shows the shallow water effect on added mass.From Fig. 3, it is found that added mass reduced increasedsignificantly when h/d approaches 1. Added mass were non-dimensionalized (m0
11, m022, m
026, m
066) using the following equa-
tions:
m011,m
022 =
m11,m22
(1/2)ρ LOA2 d(3)
m026 =
m26
(1/2)ρ LOA3 d(4)
m066 =
m66
(1/2)ρ LOA4 d(5)
Fig. 3: Shallow water effect on added mass coefficients for 11BP
3.3 Model Experiment Results of HydrodynamicDerivatives
Experimental results of longitudinal force, lateral force and yaw-ing moment in non-dimensional form (X∗
0H , Y
∗0H , N
0H) were plotted
in Fig. 4. Circle, triangle, square and diamond shapes are dataobtained from experiments. Intermediate lines in the figure arefitting using hydrodynamic derivatives obtained from lead squaremethod. In general, hydrodynamic derivatives for shallow water,medium shallow water and deep water are having the same plottrend. However, for h/d = 1.2, at 20 degrees oblique drift angle,
Y ∗0
H has a drop or reduction in force. From the experiment data,

Fig. 2: Model of pusher-barge 11BP
second order equation for X 0H with respect to βm and r
0 and thirdorder equation for Y 0
H and N 0H were derived, as shown in Eq. (6).
X 0H = X 0
0 cos2 βm +X
0βββ
2m +X
0βrβmr
0
+X 0rrr
02
Y 0H = Y 0
ββm + Y0r r
0 + Y 0ββββ
3m + Y
0ββrβ
2mr
0
+Y 0βrrβmr
02 + Y 0rrrr
03
N 0H = N 0
ββm +N0rr0 +N 0
ββββ3m +N
0ββrβ
2mr
0
+N 0βrrβmr
02 +N 0rrrr
03
⎫⎪⎪⎪⎪⎪⎪⎪⎪⎬⎪⎪⎪⎪⎪⎪⎪⎪⎭(6)
In the equation, βm is the oblique drift angle at midship, r0 is thenon-dimensional turning rate (r0 ≡ rL/U), X 0
0 is the forward re-sistance, X 0
ββ , Y0β , etc. are the hydrodynamic derivatives. In the
previous study [1], Y 0βrr and Y
0rrr were neglected due to the lim-
ited turning rate in the experiment, making accuracy of higherorder of r0 difficult to obtain. However, in this paper, shallowwater tests were conducted till r0 = 0.7, fitting in Fig. 4 showssatisfactory results for practical use. From Fig. 4, hydrodynamicderivatives for maneuvering were decided, where for h/d = 19.3and 1.5, the obtained hydrodynamic derivatives are good for alldrift angle as tested in the study, but for h/d = 1.2 the obtainedhydrodynamic derivatives are limited to drift angle -5 degrees till15 degrees. Hydrodynamic derivatives obtained from the exper-iments and used in this paper are shown in Table 3. In Table 3,added mass coefficients are shown as well.
Table 3: Resistance coefficient, hydrodynamic derivatives andadded mass coefficients
symbol h/d = 19.3 h/d = 1.5 h/d = 1.2
X0ββ -0.053 -0.1749 -0.3637
X0rr 0.0272 0.0792 0.1055
X0βr −m0
22 -0.1069 -0.3213 -0.6202
Y 0β 0.221 0.6354 1.2375
Y 0r −m011 -0.0151 -0.0375 -0.1325
Y 0βββ 0.4857 2.5353 4.2245
Y 0ββr -0.2268 0.7413 3.6005
Y 0βrr 0.1562 0.286 0.7129
Y 0rrr 0.0118 -0.0836 -0.2003N 0β 0.0706 0.1988 0.4435
N 0r -0.0593 -0.0654 -0.0861
N 0βββ 0.0848 0.5665 1.1277
N 0ββr -0.1407 -0.6547 -0.2249
N 0βrr 0.0358 -0.0528 -0.0561
N 0rrr 0.0028 0.0097 -0.0522m011 0.0195 0.0148 0.006
m022 0.3722 0.2325 0.0929
m026 0.0108 0.005 0.0006
m066 0.0124 0.0089 0.0049
3.4 Linear Hydrodynamic Derivatives and CourseStability
Linear derivatives obtained from the experiments, Y 0β , Y
0r , N
0β ,
N 0r, were compared with papers published by other researchers
in shallow water studies. Pusher-barge system 11BP at differentwater depth ratio were compared with the linear derivatives ofPCC [4], LNGC [3], Wide-beam Twin [5], and Conventional Twin[5]. Fig. 5 shows the shallow water effect on linear hydrodynamicderivatives. From the figure, it is found that for Yβ/Yβ−deep,pusher-barge 11BP is having similar changes of the derivativesfrom deep to shallow water as LNGC. From Nβ/Nβ−deep plot,pusher-barge 11BP is having similar trend between PCC and widebeam twin vessels. In Yr/Yr−deep plot, pusher-barge 11BP showvery high value of Yr/Yr−deep in medium shallow and shallow wa-ter conditions and is much higher than the other type of vessels.Plot of Nr/Nr−deep shows 11BP with significantly lower value ofNr/Nr−deep in medium shallow and shallow water conditions ascompared to other vessels.Course stability index, C, is defined in Eq. (7). Rudder ef-
fect is not taken into account in C calculation. Negative valueof course stability index in shallow water condition shows thatpusher-barge 11BP is unstable in course keeping in shallow wa-ter.
C =N 0r
Y 0r −m0 −m0
11
− N0β
Y 0β
(7)
In analysing the effect of water depth on course stability,changes of N 0
r/(Y0r −m0 −m0
11), N0β/Y
0β and C versus d/h were
plotted as shown in Fig. 6. From the figure, for 11BP, it isfound that at shallow water, value of N 0
r/(Y0r −m0 −m0
11) dropswhile N 0
β/Y0β increases. This resulted in the negative value of C,
lead to unstable course keeping ability of the vessel. Wide beamtwin and conventional twin have similar course keeping behavior,while PCC has different behavior than the rest of the vessels.
Table 4: Resistance coefficient, hydrodynamic derivatives, addedmass, and course stability index
symbol h/d = 19.3 h/d = 1.5 h/d = 1.2
N 0r/(Y
0r −m0 −m0
11) 0.3521 0.3428 0.3013N 0β/Y
0β 0.3195 0.3129 0.3584
C 0.0327 0.0299 -0.0571
4 TURNING SIMULATION
4.1 Simulation Outline
In order to understand more clearly the maneuvering behaviorof pusher-barge system 11BP in different water depths, turningsimulation of 20 degrees and 35 degrees rudder angle was carried
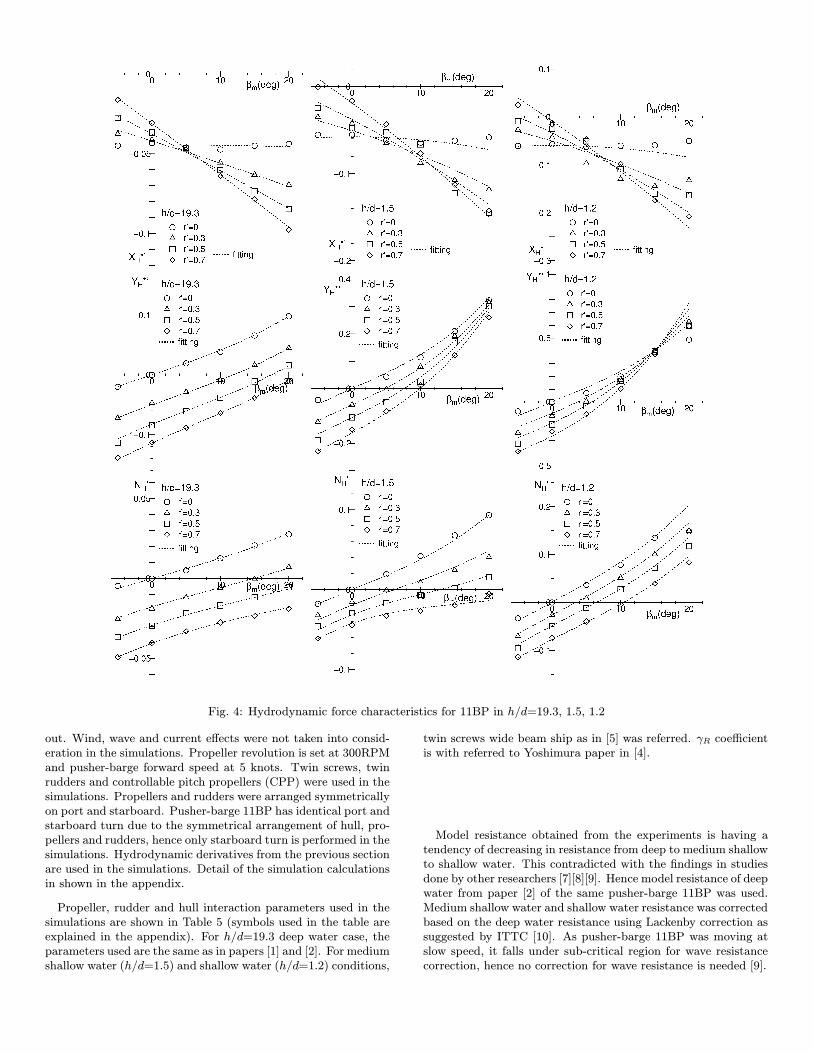
Fig. 4: Hydrodynamic force characteristics for 11BP in h/d=19.3, 1.5, 1.2
out. Wind, wave and current effects were not taken into consid-eration in the simulations. Propeller revolution is set at 300RPMand pusher-barge forward speed at 5 knots. Twin screws, twinrudders and controllable pitch propellers (CPP) were used in thesimulations. Propellers and rudders were arranged symmetricallyon port and starboard. Pusher-barge 11BP has identical port andstarboard turn due to the symmetrical arrangement of hull, pro-pellers and rudders, hence only starboard turn is performed in thesimulations. Hydrodynamic derivatives from the previous sectionare used in the simulations. Detail of the simulation calculationsin shown in the appendix.
Propeller, rudder and hull interaction parameters used in thesimulations are shown in Table 5 (symbols used in the table areexplained in the appendix). For h/d=19.3 deep water case, theparameters used are the same as in papers [1] and [2]. For mediumshallow water (h/d=1.5) and shallow water (h/d=1.2) conditions,
twin screws wide beam ship as in [5] was referred. γR coefficientis with referred to Yoshimura paper in [4].
Model resistance obtained from the experiments is having atendency of decreasing in resistance from deep to medium shallowto shallow water. This contradicted with the findings in studiesdone by other researchers [7][8][9]. Hence model resistance of deepwater from paper [2] of the same pusher-barge 11BP was used.Medium shallow water and shallow water resistance was correctedbased on the deep water resistance using Lackenby correction assuggested by ITTC [10]. As pusher-barge 11BP was moving atslow speed, it falls under sub-critical region for wave resistancecorrection, hence no correction for wave resistance is needed [9].
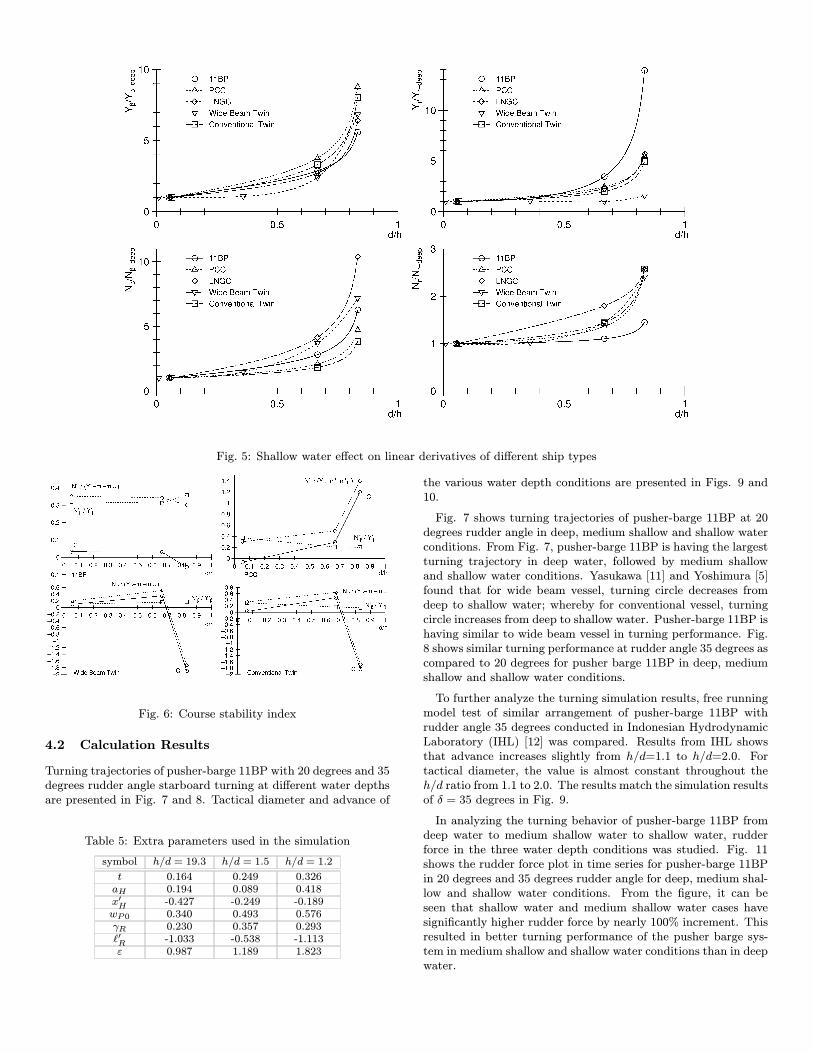
Fig. 5: Shallow water effect on linear derivatives of different ship types
Fig. 6: Course stability index
4.2 Calculation Results
Turning trajectories of pusher-barge 11BP with 20 degrees and 35degrees rudder angle starboard turning at different water depthsare presented in Fig. 7 and 8. Tactical diameter and advance of
Table 5: Extra parameters used in the simulation
symbol h/d = 19.3 h/d = 1.5 h/d = 1.2
t 0.164 0.249 0.326aH 0.194 0.089 0.418x0H -0.427 -0.249 -0.189wP0 0.340 0.493 0.576γR 0.230 0.357 0.293`0R -1.033 -0.538 -1.113ε 0.987 1.189 1.823
the various water depth conditions are presented in Figs. 9 and10.
Fig. 7 shows turning trajectories of pusher-barge 11BP at 20degrees rudder angle in deep, medium shallow and shallow waterconditions. From Fig. 7, pusher-barge 11BP is having the largestturning trajectory in deep water, followed by medium shallowand shallow water conditions. Yasukawa [11] and Yoshimura [5]found that for wide beam vessel, turning circle decreases fromdeep to shallow water; whereby for conventional vessel, turningcircle increases from deep to shallow water. Pusher-barge 11BP ishaving similar to wide beam vessel in turning performance. Fig.8 shows similar turning performance at rudder angle 35 degrees ascompared to 20 degrees for pusher barge 11BP in deep, mediumshallow and shallow water conditions.
To further analyze the turning simulation results, free runningmodel test of similar arrangement of pusher-barge 11BP withrudder angle 35 degrees conducted in Indonesian HydrodynamicLaboratory (IHL) [12] was compared. Results from IHL showsthat advance increases slightly from h/d=1.1 to h/d=2.0. Fortactical diameter, the value is almost constant throughout theh/d ratio from 1.1 to 2.0. The results match the simulation resultsof δ = 35 degrees in Fig. 9.
In analyzing the turning behavior of pusher-barge 11BP fromdeep water to medium shallow water to shallow water, rudderforce in the three water depth conditions was studied. Fig. 11shows the rudder force plot in time series for pusher-barge 11BPin 20 degrees and 35 degrees rudder angle for deep, medium shal-low and shallow water conditions. From the figure, it can beseen that shallow water and medium shallow water cases havesignificantly higher rudder force by nearly 100% increment. Thisresulted in better turning performance of the pusher barge sys-tem in medium shallow and shallow water conditions than in deepwater.

Fig. 7: Turning trajectories (δ = 20 deg)
Fig. 8: Turning trajectories (δ = 35 deg)
5 CONCLUDING REMARKS
Pusher-barge system with one pusher and one barge arrangedin-line (11BP) has been studied in study. Rotating arm test wascarried out in three water depth to ship’s draught conditions (h/d= 19.3 (deep water); 1.5 (medium shallow); 1.2 (shallow water)).In shallow water condition, pusher-barge 11BP is found to havenegative value of course stability index (C), which means thatthe system in stable in course keeping. Pusher-barge 11BP ishaving the largest value of C in deep water, which is the easiestto maneuver condition among the three water depth to ship’sdraught ratios.In turning simulations, for rudder angle 20 degrees, pusher-
barge 11BP turning performance is similar to a wide beam vessel,where turning trajectory decreases from deep to medium shal-low to shallow water condition. For rudder angle 35 degrees,pusher-barge 11BP is having the similar performance as 20 de-
Fig. 9: Tactical diameter and advance distance (δ = 20 deg)
Fig. 10: Tactical diameter and advance distance (δ = 35 deg)
grees rudder angle, where largest turning circle occurs in deepwater, followed by medium shallow and then shallow water. Theauthors also found big increment in rudder force from deep tomedium shallow and shallow water conditions.For future work, the authors suggest conducting free running
model test on pusher-barge systems in comparison with the com-puter simulations. Different combinations and arrangements ofpusher-barge system should also be tested and simulated for abetter understanding of pusher-barge maneuvering characteris-tics in shallow water.
ACKNOWLEDGEMENT The authors want to thankemeritus Professor K. Kijima of Kyushu University for provid-ing the facilities and assistance in conducting the rotating arm

Fig. 11: Rudder force changes in time series for deep, mediumshallow and shallow water conditions
test in various water depths conditions.
References
[1] Yasukawa H, Hirata N, Koh KK, Punayangkool K, Kose K(2007). ”Hydrodynamic Force Characteristics on Maneuver-ing of Pusher-Barge Systems (in Japanese),” J Jpn Soc NavArchit Ocean Eng, Vol 5, pp 133-142.
[2] Koh KK, Yasukawa H, Hirata N, Kose K (2008). ”Hydo-dynamic Derivatives Investigation on Unconventionally Ar-ranged Pusher-Barge Systems,” J Mar Science Tech (to bepublished).
[3] Fujino M, Ishiguro T (1984). ”A Study of the MathematicalModel Describing Manoevring Motions in Shallow Water.Shallow water effects on rudder-effectiveness parameters (inJapanese),” J Soc Nav Archit Jpn, Vol 156, pp 18-192..
[4] Yoshimura Y (1986). ”Mathematical Model for the Manoeu-vring Ship Motion in Shallow Water (in Japanese),” J Kan-sai Soc Nav Archit Jpn, Vol 200, pp 41-51.
[5] Yoshimura Y, Sakurai H (1989). ”Mathematical Model forthe Manoeuvring Ship Motion in Shallow Water (3rd Re-port) (in Japanese),” J Kansai Soc Nav Archit Jpn, Vol 211,pp 115-126.
[6] Pfennigstorf J (1970). ”Handbuch der Werften X Band,”Bearb von K Wendel, Schiffahrts-Verlag HANSA, CSchroedter & Co, Hamburg 11.
[7] Millward A (1982). ”The Effect of Shallow Water on theResistance of Ship at High Sub-Critical and Super-CriticalSpeeds,” Trans RINA, Vol 124, pp 175-181.
[8] Millward A (1991). ”A Comparison of the Effects of Re-stricted Water Depth on a Model and Full Size PlanningHull,” Trans RINA, Vol 133, pp 237-250.
[9] Hofman M (2000). ”Shallow Water Resistance Charts forPreliminary Vessel Design,” Int Shipbuilding Prog, Vol 31,No 449, pp 61-76.
[10] Lackenby H (1963). ”The Effect of Shallow Water on ShipSpeed,” Shipbuilder Vol 70, No 672.
[11] Yasukawa H, Kobayashi E (1995). ”Shallow Water ModelExperiements on Ship Turning Performance,” Mini Sympo-sium on Ship Manoeuvrability 26 May 1995,West-Japan SocNav Archit, pp 71-83.
[12] Yasukawa H (eds) (2006). ”Study on River Transportationby Pusher and Multi-Barge System,” The Report of 11thSeminar of JSPS-DGHE Core University Program on Ma-rine Transportation Engineering, Hiroshima University, No06-1, pp 444.
[13] Hirano M (1980). ”On the Calculation Method of Ship Ma-neuvering Motion at the Initial Design Phase (in Japanese),”J Soc Nav Archit Jpn, Vol 147, pp 144-153.
[14] Fujii H, Tuda T (1961). ”Experimental Research on RudderPerformance (2) (in Japanese),” J Soc Nav Archit Jpn, Vol110, pp 31-42.
[15] Yoshimura Y, Nomoto K (1978). ”Modeling of ManeuveringBehaviour of Ships with a Propeller Idling, Boosting andReversing (in Japanese),” J Soc Nav Archit Jpn, Vol 144,pp 57-69.
A Maneuvering Simulation Calculations
Fig. 12 shows the coordinate systems used in the paper. O −X0Y0Z0 are the space coordinate system, with X0Y0 as to thewater surface and Z0 vertically downwards axis from the watersurface. ψ is the angle from X0 axis to the center of gravity ofthe ship. G − xyz is the ship’s coordinate system, where G isthe center of gravity of the ship, x is the forward direction of theship and y is the lateral direction of the ship. xy forms the watersurface where the ship is located and z is the vertical downwardsdirection from the center of gravity of the ship.Maneuvering motions of the pusher-barge system (surge, sway,
yaw) are defined in the motion equations shown in Eq. (8). Inthe equation, ˙ is time based of the respective parameters. Theunknown values are: u the forward speed, v the lateral speedand r the turning rate. m is the mass of the ship and Izz is themoment inertia of the ship. m11, m22, m26, m66 are the addedmass and added moment of inertia of the pusher-barge systemthat occur when a ship accelerate or decelerate or in turningmotion. On the right hand side of the equation, X is the totalforward force, Y is the total lateral force and N is the total yawmoment at the center of gravity of the pusher-barge system.
(m+m11)u− (m+m22)vr = X(m+m11)ur + (m+m22)v +m26r = Y
(Izz +m66)r +m26v = N
⎫⎬⎭ (8)
X, Y , and N are the forces and moment introduced from hull(H), propeller (P ) and rudder (R), which are expressed in Eq.
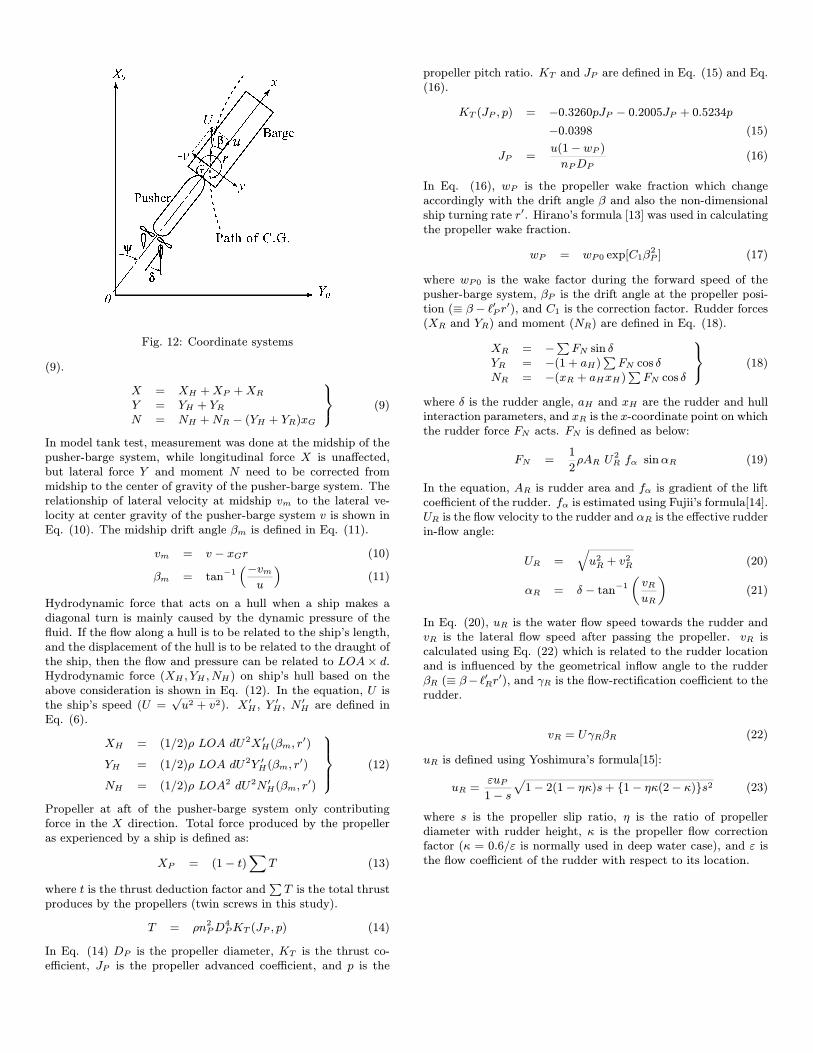
Fig. 12: Coordinate systems
(9).
X = XH +XP +XR
Y = YH + YRN = NH +NR − (YH + YR)xG
⎫⎬⎭ (9)
In model tank test, measurement was done at the midship of thepusher-barge system, while longitudinal force X is unaffected,but lateral force Y and moment N need to be corrected frommidship to the center of gravity of the pusher-barge system. Therelationship of lateral velocity at midship vm to the lateral ve-locity at center gravity of the pusher-barge system v is shown inEq. (10). The midship drift angle βm is defined in Eq. (11).
vm = v − xGr (10)
βm = tan−1³−vmu
´(11)
Hydrodynamic force that acts on a hull when a ship makes adiagonal turn is mainly caused by the dynamic pressure of thefluid. If the flow along a hull is to be related to the ship’s length,and the displacement of the hull is to be related to the draught ofthe ship, then the flow and pressure can be related to LOA× d.Hydrodynamic force (XH , YH , NH) on ship’s hull based on theabove consideration is shown in Eq. (12). In the equation, U isthe ship’s speed (U =
√u2 + v2). X 0
H , Y0H , N
0H are defined in
Eq. (6).
XH = (1/2)ρ LOA dU2X 0H(βm, r
0)
YH = (1/2)ρ LOA dU2Y 0H(βm, r
0)
NH = (1/2)ρ LOA2 dU2N 0H(βm, r
0)
⎫⎪⎪⎬⎪⎪⎭ (12)
Propeller at aft of the pusher-barge system only contributingforce in the X direction. Total force produced by the propelleras experienced by a ship is defined as:
XP = (1− t)X
T (13)
where t is the thrust deduction factor andPT is the total thrust
produces by the propellers (twin screws in this study).
T = ρn2PD4PKT (JP , p) (14)
In Eq. (14) DP is the propeller diameter, KT is the thrust co-efficient, JP is the propeller advanced coefficient, and p is the
propeller pitch ratio. KT and JP are defined in Eq. (15) and Eq.(16).
KT (JP , p) = −0.3260pJP − 0.2005JP + 0.5234p−0.0398 (15)
JP =u(1− wP )nPDP
(16)
In Eq. (16), wP is the propeller wake fraction which changeaccordingly with the drift angle β and also the non-dimensionalship turning rate r0. Hirano’s formula [13] was used in calculatingthe propeller wake fraction.
wP = wP0 exp[C1β2P ] (17)
where wP0 is the wake factor during the forward speed of thepusher-barge system, βP is the drift angle at the propeller posi-tion (≡ β − `0P r0), and C1 is the correction factor. Rudder forces(XR and YR) and moment (NR) are defined in Eq. (18).
XR = −PFN sin δYR = −(1 + aH)
PFN cos δ
NR = −(xR + aHxH)PFN cos δ
⎫⎬⎭ (18)
where δ is the rudder angle, aH and xH are the rudder and hullinteraction parameters, and xR is the x-coordinate point on whichthe rudder force FN acts. FN is defined as below:
FN =1
2ρAR U
2R fα sinαR (19)
In the equation, AR is rudder area and fα is gradient of the liftcoefficient of the rudder. fα is estimated using Fujii’s formula[14].UR is the flow velocity to the rudder and αR is the effective rudderin-flow angle:
UR =qu2R + v
2R (20)
αR = δ − tan−1µvRuR
¶(21)
In Eq. (20), uR is the water flow speed towards the rudder andvR is the lateral flow speed after passing the propeller. vR iscalculated using Eq. (22) which is related to the rudder locationand is influenced by the geometrical inflow angle to the rudderβR (≡ β− `0Rr0), and γR is the flow-rectification coefficient to therudder.
vR = UγRβR (22)
uR is defined using Yoshimura’s formula[15]:
uR =εuP1− s
p1− 2(1− ηκ)s+ {1− ηκ(2− κ)}s2 (23)
where s is the propeller slip ratio, η is the ratio of propellerdiameter with rudder height, κ is the propeller flow correctionfactor (κ = 0.6/ε is normally used in deep water case), and ε isthe flow coefficient of the rudder with respect to its location.