
3rd CENR Conference Advancing Communities Disaster Resilience
196
Transcript of 3rd CENR Conference Advancing Communities Disaster Resilience

Bridge Building Workshop for Improving Community Health Community Engagement in Research (CEnR) and Comparative Effectiveness Research (CER)

Welcome
Syed Ahmed, MD, MPH, DrPH, FAAFP
Senior Associate Dean for Community Engagement, Director of the Community Engagement Key Function of the CTSI, Medical
College of Wisconsin
Advancing Communities’ Disaster Resilience
Advancing Communities’ Disaster Resilience

Opening Remarks
Reza Shaker, MD
Senior Associate Dean for Clinical and Translational Research, Principal Investigator and Director of the CTSI,
Medical College of Wisconsin

Workshop Vision and Format
Zeno Franco, PhD
Assistant Professor, Community Engagement Key Function, Department of Family and Community Medicine,
Medical College of Wisconsin

Hurricane Katrina, 2005

Hospital and Healthcare Systems
Public Health
Communities
How Can We Better Integrate these Systems to Respond to Disasters?
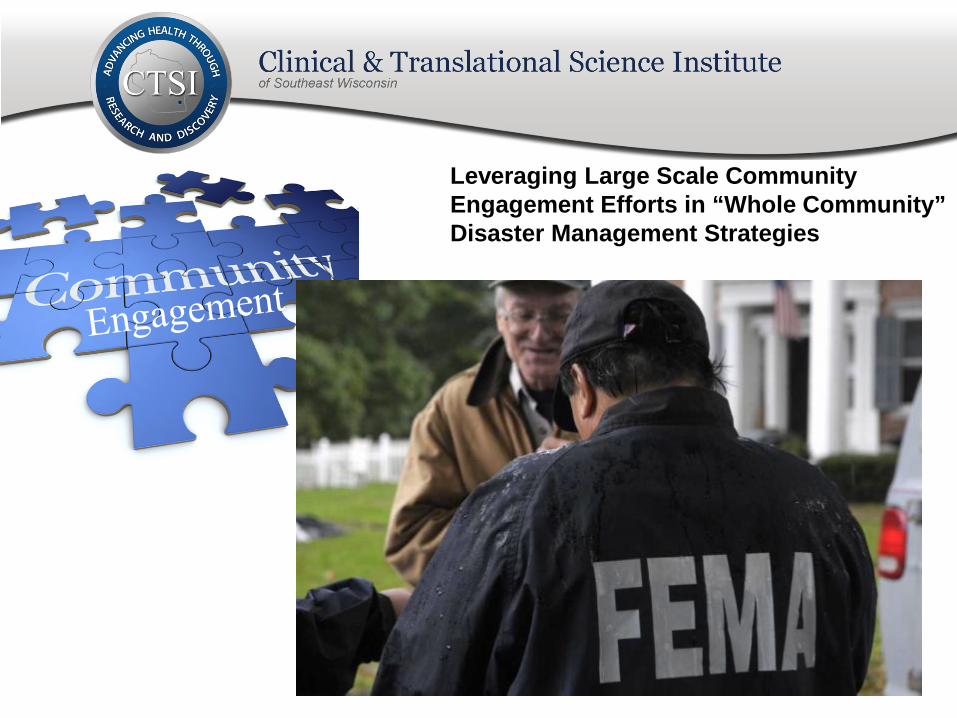
Leveraging Large Scale Community Engagement Efforts in “Whole Community” Disaster Management Strategies

DHS / FEMA / CDC Response to Recent Community Level Disaster Response Failures in the US
• FEMA “Whole Community” Approach ov/about/wholecommunity.shtm
• Movement away from government centric planning, mitigation, response & recovery
• Private sector integration – Employees, retail locations,
supply chain • Focus on developing &
measuring community resilience
• Problems – Unfunded mandate – Agencies have little experience
with this approach – Struggling to find appropriate
models • Opportunities:
– Application of existing Community Engagement in Research (CEnR) models
– Specific resources in existing community-academic partnerships

Collaborating Organizations • CTSI Community Engagement Key Function, Medical
College of Wisconsin
• Department of Emergency Medicine, MCW
• UW-Milwaukee FEMA Think Tank
• City of Milwaukee, Department of Public Health
• EnRiCH (Enhancing Resilience and Capacity for Health) Project, University of Ottawa, Canada


Table Work Session 1 Milwaukee Disaster Scenarios
• Red Section Tables – Infectious Disease • Blue Section Tables – F4 Tornado • Yellow Section Tables – Industrial Accident • Green Section Tables – Flood
** In order to ensure that sections have a wide range of backgrounds represented, you have been assigned a section to sit in – your section is listed on your name tag.


Table Work Session 2 – World Café
• Each Table Section will have 1 over-arching question regarding how we can address the issues identified in the disaster scenarios through systems level change.
• Participants will start in their color zone and then migrate to a NEW table in each of the other three color zones at ~10 minute intervals.
• Participants will add any NEW ideas to the list of responses being created by the table scribe
• We will provide more detail about the process just prior to the session

“Paperless” Conference • There is one conference program per table to
minimize paper on the tables
• All conference materials including presentations, notes & posters will be available electronically after the conference at: http://bit.ly/ctsi_community_resilience
• An email with the link will also be sent after the conference to all attendees

Live Conference Twitter Feed • During the table sessions, a live conference twitter feed will
be displayed on the screens
• A designated person will be tweeting from each table. If you are one of these people, there are special instructions for you in the program.
• All participants are also free to add comments using twitter at any time during the day using their own twitter account.
• The conference hashtag is #CTSI-ACDR

US Federal Perspective Toward Whole Community
Disaster Preparedness Richard C. Hunt, MD, FACEP
Senior Medical Advisor for the National Healthcare Preparedness Program and Assistant Secretary for
Preparedness and Response, US Department of Health and Human Services

Community Partnerships for Disaster Planning- the EnRICH Project
Experience
Tracey O’Sullivan, PhD
Director of the Enhancing Resilience and Capacity for Health (EnRICH) Project and Assistant Professor,
Interdisciplinary School of Health Sciences, University of Ottawa

United States Department of
Health & Human Services Office of the Assistant Secretary for Preparedness and Response
Richard C. Hunt, MD, FACEP Senior Medical Advisor
National Healthcare Preparedness Programs Office of Preparedness and Emergency Operations
Office of the Assistant Secretary for Preparedness and Response
A Thread of Preparedness
Within Health Care
Community Engagement in Research Conference: Advancing Communities’ Disaster Resilience
Milwaukee, WI
September 18, 2013
19

20
Event Overview
2001 2002 2003 2004 2005 2006 2007 2008 2009 2010 2011
National Health Security Strategy
H1N1 Pandemic
2011 Tornadoes
Deepwater Horizon
9/11 and Anthrax
Re-emerging H5N1
Katrina, Rita, Wilma
Ike, Gustav Japan Earthquake Nuclear Event Haiti
earthquake
MCM Enterprise Review Project BioShield PAHPA
2012
Hurricanes Isaac and
Sandy
Bioterrorism Act
2013
PAHPA reauthorized
Boston and West, TX
Presenter
Presentation Notes
ASPR has responded to a number of public health emergencies including: The first pandemic in 40 years; An earthquake in the western hemisphere’s poorest country; A giant oil spill in the Gulf of Mexico; The 2011 Japan earthquake, tsunami, and associated radiological contamination event; and Other domestic events including food-borne outbreaks, E. coli, botulism, salmonella, hurricanes, floods, tornadoes, Avian influenza, West Nile virus, and ricin. ASPR protects people’s health in emergencies: through building the right policies and partnerships to allow for effective response through leadership nationally to capture local best practices on how communities prepare themselves for and recover from adversity (learned a lot from the oil spill about the importance of behavioral health) And through operational responsibilities – we sent medical teams to Haiti to care for the injured, and played a critical role in developing H1N1 vaccine …you can see ASPR’s role is huge and encompasses diverse areas…

21
Our Current Situation
• The United States health care delivery system is focused on cost reduction which includes service retraction resulting in “just-in-time” (JIT) operating principles and staffing.
• While United States health system emergency preparedness and response
mechanisms are established and operational, they can be fragmented and are restrained by a JIT approach.
• The United States continues to experience overcrowding in emergency departments with limited mechanisms to reallocate patients throughout the hospital or the community.
• Our day to day system does not serve us well; therefore, it is not likely to
serve us well on “game day.”
Darling, M, Wise, S. Not Your Father’s Supply Chain, MATERIALS MANAGEMENT IN HEALTH CARE, APR 2010 The Future of Emergency Care in the United States ( 2006) www.iom.edu/Activities/Quality/emergencycare.aspx Hospitals Failing to Address Patient Boarding (2012) www.acepnews.com/index.php?id=514&tx_ttnews%5Btt_news%5D=1555&cHash=2125d52f1ab0ae31328f2440243e7f70

National Healthcare System Capacity
Decreasing Capacity
Preparedness and Health Care Delivery
100% Prepared
Gap
Coalitions
Coalition Preparedness
22

National Healthcare System Capacity
100% Prepared
Coalition Preparedness
Gap
Coalitions
23
Preparedness and Health Care Delivery

24
Health Care & Preparedness Financials
• National Health Expenditures grew 4.0% to $2.5 trillion in 2009, or $8,086
per person, and accounted for 17.6% of Gross Domestic Product (GDP).
• 2010, hospital expenditures were $814 Billion (CMS) - According to the American Hospital Association, there are 5,754 hospitals
in the United States -Average Hospital Expenditures = approx $141 million
• The Hospital Preparedness Program 2012 budget is $347 million (0.0001 of overall National Health Expenditures)

25
Our Current Need
• A comprehensive national preparedness and response health care system that is scalable and coordinated to meet local, State and National needs
• A dual use application to preparedness, integrating with and improving the efficiencies of daily health delivery
• A financially sustainable approach to preparedness
• A population based health delivery model for disaster response
• Defined Healthcare Preparedness Capabilities and Performance Measures

26
National Healthcare Preparedness Programs Overview
• Mission: To improve healthcare preparedness and response by providing leadership, funding, evaluation, and technical assistance to HPP awardees
• Vision: A robust, integrated federal, state, and local disaster healthcare system that coordinates all components of health delivery, supporting Emergency Support Function #8, to realize greater national healthcare preparedness, response, and recovery

27
National Healthcare Preparedness Capabilities
1) Health Care System Preparedness (Health Care Coalitions) 2) Health Care System Recovery 3) Emergency Operations Coordination 5) Fatality Management 6) Information Sharing 10) Medical Surge (Immediate Bed Availability) 14) Responder Safety and Health 15) Volunteer Management http://www.phe.gov/preparedness/planning/hpp/reports/documents/capabilities.pdf

28
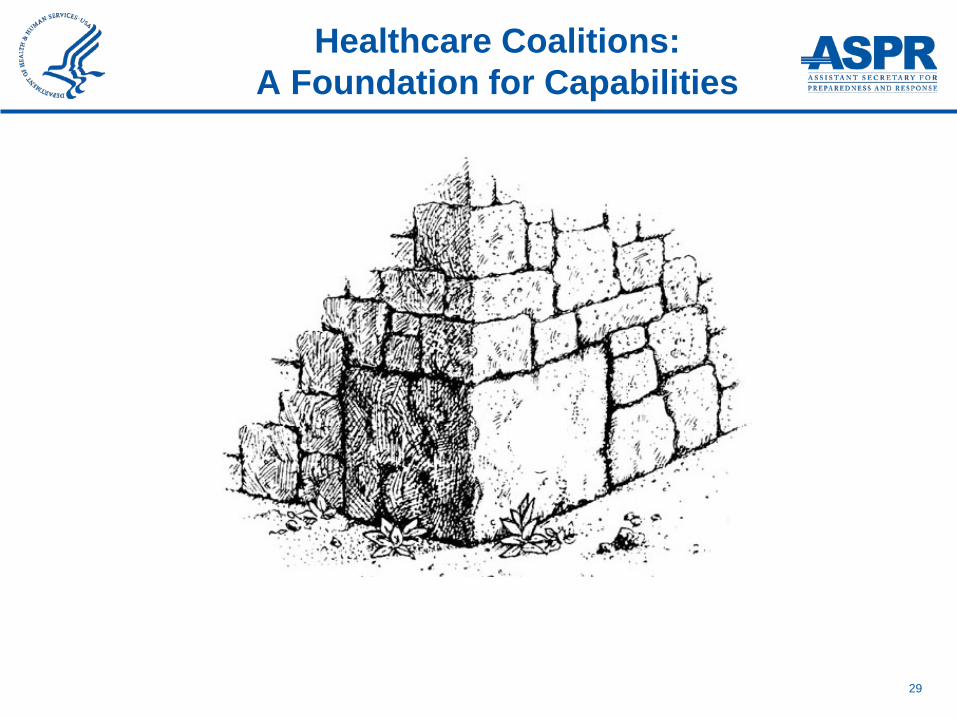
“The whole is greater than the sum of its parts.”
Healthcare Coalitions
Aristotle
29
Healthcare Coalitions: A Foundation for Capabilities

Health Care Coalitions (HCC)
• Alternative Care Sites
• Behavioral Health
• Community Based Organizations
• Community Health Centers
• Dialysis Facilities
• Emergency Management
• Emergency Medical Services
• Faith Based Organizations
• Hospitals
• Long Term Care Facilities
• National Disaster Medical System
• Primary Care Providers
• Public Health
• Private Insurance
• Urgent Care Facilities
• Volunteers

31
Health Care Coalition (HCC)

32
Healthcare Coalitions: The Cornerstone
Percent of population covered Functionality
Risk
Linked with daily care
Presenter
Presentation Notes
Make stone

33
• Definition: A fault or weakness that causes or could cause someone or something to fail
Medical Surge: An Achilles’ Heel

34
“Of particular concern are questions about the ability of health care systems to ‘surge ‘, - that is, to have the staff and resources in place to adequately care for increased numbers of affected individuals or individuals with unusual or highly specialized needs.” GAO Report, March 2013
National Preparedness: Improvements Needed for Measuring Awardee Performance in Meeting
Medical and Public Health Preparedness Goals
Medical Surge: GAO Concerns

35
• Goal: To quickly provide higher-level care to more serious patients during a disaster with no new space, personnel, or equipment
Ability (of coalitions) to provide no less than 20% bed availability of staffed members’ beds, within 4 hours of a disaster
• NHPP 2013 Medical Surge Capability Program Measure
The New “Medical Surge”: Immediate Bed Availability (IBA)

36
• Evidence Informed
• Operationally Tenable
• Economically Sustainable
• Ethically Grounded
Immediate Bed Availability

37
Reverse Triage: Inpatients at low risk for untoward events would be discharged or transferred back to the community Reverse Triage Study (Maryland: Kelen)
• Study: 3 hospitals, 19 week monitoring, 1,632 total beds • Hospitals achieved a net surge capacity of 66-81% after
accounting for non-disaster emergencies • Majority of surge would have been available 24-48 hours
after disaster
IBA: Evidence Informed Reverse Triage
Source: Kelen, “Creation of Surge Capacity by Early Discharge of Hospitalized Patients at Low Risk for Untoward Events, Disaster Medicine and Public Health Preparedness, 2009.

38
Every day, approximately 20% of hospital patients are discharged
Every day, even more patients may be available for discharge • Clinically stable patients with few parenteral medications may be appropriate
for early discharge • Strategies to expedite discharge:
─ Discharge holding lounge ─ Convert private rooms to double rooms ─ Reopen closed areas ─ Utilize hallways ─ Convert patient areas to critical care areas ─ Temporary external structures for patient holding ─ “Flat space” (e.g. lobbies, waiting rooms, hallways) can open 10%
operating bed capacity
IBA: Operationally Tenable: Space
Source: Hick, Hanfling, et al., “Health Care Facility and Community Strategies for Patient Care Surge Capacity,” Annals of Emergency Medicine, 2004.

39
Staffing is likely to be the key restriction on the number of patients that facilities and coalitions can accommodate HCCs should consider:
• Protocols for revision of staff work hours • Callback of off-duty personnel • Use of non-clinical staff • Local Medical Reserve Corps • Untraditional patient care providers (e.g. family members,
nonprofessional personnel such as city employees) • Surge plans for home care agencies and clinics • Fewer, larger staffed off-site facilities will benefit from economies
of scale
IBA: Operationally Tenable: Staff
Source: Hick, Hanfling, et al., “Health Care Facility and Community Strategies for Patient Care Surge Capacity,” Annals of Emergency Medicine, 2004.

40
Building disaster preparedness into existing healthcare systems makes the process economically sustainable
• Allows for surge capacity without extra “staff, space, or stuff”
Private partners and insurance companies need to be involved
• Billing will be an issue but can be mitigated through stakeholder buy in
IBA: Economically Sustainable
Source: Medical Surge Capacity Workshop Summary, 2010, http://www.nap.edu/openbook.php?record_id=12798&page=135

41
During overwhelming disasters: • Decisions must be made as to who can best be served • Medical ethics grounded in autonomy, beneficence, non-
maleficence, and justice Consent to “be triaged” is implicit in consent to give medical care:
• Applied in routine clinical care, military operations, public health, or population level emergencies
• Utilitarian vs. egalitarian, proportionality of care • Victims of disaster treated equally to existing patients
IBA: Ethically Grounded
Source: Kraus, Levy, et. Al, “Lifeboat Ethics: Considerations in the Discharge of Inpatients for the Creation of Hospital Surge Capacity,” Disaster Medicine and Public Health Preparedness, 2007.

Medical Surge Program Measure
42

43
NHPP Medical Surge Indicators
Indicator 1: The Awardee has posted its approved Crisis Standards of Care (CSC) plan on the ASPR Communities of Interest SharePoint Site. Indicator 2: The Awardee has completed mass fatality management plans that have been adopted by HCCs’ members.
Indicator 3: The HCC has developed a strategic plan with participation from its membership. Indicator 4: The HCC has demonstrated, through exercise or real incident, its ability to both deliver appropriate levels of care to all patients, as well as to provide no less than 20% immediate availability of staffed members' beds, within 4 hours of a disaster. Indicator 5: The HCC has demonstrated the ability to do the following during an incident, exercise, or event: 1) Monitor patient acuity and staffed bed availability in real-time, 2) Off-Load Patients, 3) On-Load Patients, 4) Track and document patient movement Indicator 6: The Awardee’s Recovery Plan addresses how it will meet post-disaster behavioral and mental healthcare needs of communities (i.e., HCC member staff). Indicator 7: The HCC has a mechanism to obtain feedback to help resolve member conflicts that have the potential to affect the overall performance of the HCC.

United States Department of
Health & Human Services Office of the Assistant Secretary for Preparedness and Response
Sustainable Medical Surge Surge within the System:
Immediate Bed Availability
45
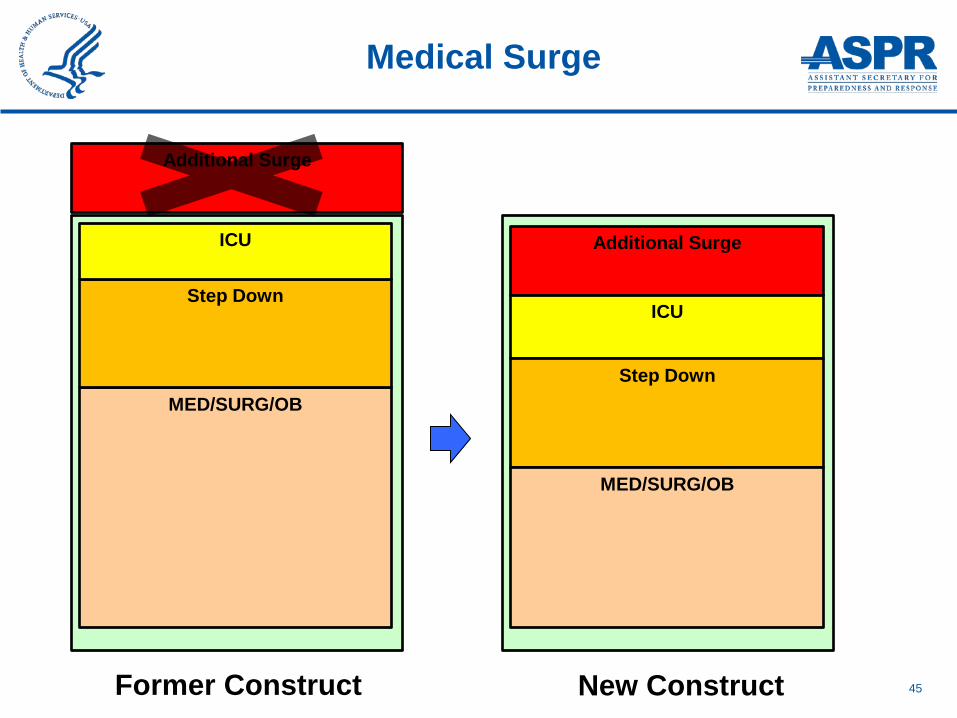
Medical Surge
Former Construct
Additional Surge
MED/SURG/OB
Step Down
ICU Additional Surge
ICU
Step Down
MED/SURG/OB
New Construct

46
IBA Concept
Stroke/MIs
High Acuity Psychiatric patients
ICU Patients
Acute Surgical Patients
Imminent OB delivery Convalescing
Awaiting discharge Behavioral Health Issues
Post Operative Care
Social Issues Elective Procedures
Home
Community Health Centers
Long Term Care
Acute
20%
EVEN
T
HCC Hospital(s) HCC Partner(s)

47
Continuous Monitoring
• Maintain operations • Monitor patient acuity in real-time • Continually establish disaster disposition protocols
Off-load • Disaster disposition protocols utilized • Rapid bed turnover • Discharge or Transfer of lower acuity patients to coalitions
partners/home • Deferral of elective admissions/procedures etc.
On-load • Redeploy existing resources to allow for higher-acuity admissions
Pillars of IBA

48
• Greater than half of Healthcare Coalitions use electronic data and information sharing systems
• Examples of systems: WebEOC, Health Alert Networks
(HAN), and bed tracking systems
• Greater than half of Healthcare Coalitions have tested communication systems protocols internally and with relevant stakeholders
• Communication between coalitions is less prevalent • In a moment’s notice: Where are the 20% staffed beds?
IBA: Real World Experiences Continuous Monitoring

49
Reverse Triage in Practice (Royal Darwin Hospital: 2009) • Event: Boat explosion injured 30 asylum seekers • Royal Darwin Hospital was full with ED backlog • Disaster Response Team activated reverse triage • Elective procedures cancelled, multidisciplinary teams assessed
patients, increased use of community care (nursing facilities), discharged patients
• In 4 hours, 56 beds were available (16% of capacity) • Only one patient returned for further treatment
IBA Real World Experience: Off-loading: Ashmore Reef Explosion, 2009
Source: Atkinson, Satterwaite, “Using reverse triage to create hospital surge capacity: Royal Darwin Hospital’s response to the Ashmore Reef disaster,” Journal of Emergency Medicine, 2012.

50
IBA: Real World Experiences Off-loading: Hurricane Sandy, 2012
• “Where possible, investments should be coordinated across multiple institutions, using health care coalitions to ensure resiliency.”
• Improved Situational awareness
• Drilled evacuation (IBA off-load) ─ “Measured success” in Sandy
with transport
• Improved clarity of criteria and triggers for evacuation Source: JAMA, 2012.

51
IBA Real World Experience: Off-loading: Seasonal Influenza, 2013
Strategies used during January 2013 seasonal influenza:
• Expedited patient case management (discharge planning techniques)
• Decompressed inpatient wards • Isolated hospitals cancelled elective admissions and
procedures
Source: Health System Stress Assessment, OPEO, 2013.

52
Rashid Hospital, Dubai, UAE • 500 bed tertiary care hospital • Constantly over bed capacity • Disaster activation 10 times in 3 years • Disaster response challenges: lack of bed space, congested ORs,
uncoordinated medical management
IBA Real World Experience: Off-loading: Rashid Hospital
Griffiths, et. al, “A framework for physician activity during disasters and surge events,” Disaster Medicine Journal, 2011.

53
Rashid Hospital, Dubai, UAE • Root cause analysis • Physicians continuing with “normal business” (e.g. ward
rounds, patient assessments) in spite of disaster status • No system or recognition for need for reverse triage • ORs continue with routine cases with lack of leadership in
this area
IBA: Real World Experiences Off-loading, Rashid Hospital
Griffiths, et. al, “A framework for physician activity during disasters and surge events,” Disaster Medicine Journal, 2011.

54
• Reverse triage education • Transfer to other facilities if specialist interventions not
required within 24 hours • Increasing bed capacity and routinely clear patients
─ Hospitalists ─ Extended discharge lounge facilities ─ Liaison with construction companies regarding expatriate
patients’ “transport home” ─ Liaison with local police to allow access
IBA: Real World Experience Off-loading, Rashid Hospital
Griffiths, et. al, “A framework for physician activity during disasters and surge
events,” Disaster Medicine Journal, 2011.

55
IBA: Real World Experiences
“Minicard:” Rashid Hospital
Griffiths, et. al, “A framework for physician activity during disasters and surge events,” Disaster Medicine Journal, 2011. 35

56
• On-loading takes place in EDs everyday, and will continue to take place regardless of challenges of space, staff, stuff
• The continuous monitoring and off-loading of IBA allows on-loading to take place in an efficient manner that does not compromise patient care
IBA: Real World Experience On-loading

Real World Experience: On-loading: Madrid Terrorist Bombing, 2004
On March 11, 2004, 10 terrorist explosions occurred almost simultaneously on commuter trains in Madrid killing 177 people instantly and injuring more than 2,000.
That day, 966 patients were taken to 15 public community hospitals. More than 270 patients arrived at the closest facility between 0800 and 1030 hours.

58
International Lessons Observed, Every Time
Injured and dead will arrive at closest hospital Closest hospital is
unable to meet the demand = functional “collapse”
Compelling need to distribute patients
Compelling need to distribute
patients

59
RECENT EXPERIENCES
Immediate Bed Availability

60
IBA: Further Considerations
• Federal ─ Regulations
• Jurisdictional ─ Triggers/Thresholds ─ Transportation ─ Liability ─ Staff/public education

61
• Everyday preparedness for game day • Weaving a thread of preparedness into the daily
delivery of care
Immediate Bed Availability

62
• Community resilience entails the ongoing and developing capacity of the community to account for its vulnerabilities and develop capabilities that aid that community in ─ (1) preventing, withstanding and mitigating the stress of a
health incident; ─ (2) recovering in a way that restores the community to a
state of self-sufficiency and at least the same level of health and social functioning after an incident; and
─ (3) using knowledge from a past response to strengthen the community’s ability to withstand the next health incident.
• Building Community Resilience to Disasters Rand Technical Report, 2011
Community Resilience Defined
63
•911 always answers •EMS always responds •EDs always receive
Healthcare System Resilience and Community Resilience

64
• When health systems are compromised: ─ Hugo: Charleston County EMS
─ Katrina: Charity ─ Joplin: Mercy Hospital Joplin
─ Sandy: NYU, Bellevue
Functional collapse of healthcare delivery
Healthcare System Resilience and Community Resilience

65
Healthcare System Resilience and Community Resilience

66
• Healthcare system cares for people in their most desperate moments of need
• Most of our health system cares for those seeking help regardless their ability to pay
• When in need, the healthcare system is a safety net for a community’s citizens
• Compromising the healthcare system compromises the safety net • Maintaining a community’s safety net maintains community resiliency • Compromising the safety net compromises the community’s
resiliency
• Therefore, we need to build resilient healthcare systems
Healthcare System Resilience and Community Resilience

67
• Evident in a resilient community:
─ Optimal community health and access to quality health
services
• Building Community Resilience to Disasters RAND Technical Report, 2011
Community Resilience and Healthcare System Resilience

Healthcare System Resilience and Community Resilience

69
Questions

70
• IBA attempts to push healthcare systems toward the left hand side of the conventional – contingency – crisis standards of care continuum
• Pandemic may reach a tipping point where crisis standards
apply requiring: ─ More staff: locum tenems / traveling nurses ─ More stuff: medical countermeasures ─ More space: use of planned and unplanned alternate care
space (e.g., hotels) ─ Fatality management
IBA and Pandemic

71
Continuous monitoring: across the system Off-loading: makes space for sicker patients Onloading: sicker patients will need acute care resources • Meeting the 4 hour IBA requirement is a foundation for
building surge capacity for events that have much longer time spans
• Meeting the 20% staffed bed requirement will help, but may or may not be enough to accommodate volume
IBA and Pandemic

Community Partnerships for Disaster Planning:
The EnRiCH Project Experience
Tracey O’Sullivan, PhD Community Engagement in Research Conference
September 18, 2013

Lead Investigator: Tracey O’Sullivan, UOttawa Federal Partners: Public Health Agency of Canada, Division of Aging & Seniors (Patti Gorr) Human Resource & Skills Development Canada, Office of Disability Issues (Erik Lapalme) Industry Partners: Canadian Red Cross (Mona O’Brien, Karen Charles, Louise Geoffrion) Nova Scotia Department of Emergency & Social Services (John Webb, Joanne Lawlor) Ville de Gatineau (Jacques Rathwell, Gilles Desjardins, Nathalie Bourget- CSSS) Region of Waterloo (Steve LaRochelle) 211 Québec City (Claude Vanasse, Nicole Pare)
Academic Partners: University of Ottawa
(Wayne Corneil, Louise Lemyre Craig Kuziemsky, Sanni Yaya,
Linda Garcia, Dan Lane, Jeff Jutai)
Carleton University
(Behnam Behnia)
Funded by the Canadian Centre for Security Science (CSS)

The EnRiCH Collaboration • Community-based participatory research focused on
inclusive engagement and fostering collaboration to enhance resilience among high risk populations
• Bringing together expertise from front line response organizations, community associations, governance and policy, academia, research and knowledge translation, health economics, community health promotion, disaster management and national security.
• Asset or functional capability-oriented approach
www.enrichproject.ca

Images of Resilience

Community: Ottawa • House A: retired couple, both mid-70’s; the
woman had a hip replacement 4 months ago
• House B: working couple, 4 boys (4 yrs old, 14, 16, 18)
• House C: retired couple, both mid-70’s; husband had heart attack in 2012, wife has history of depression


Aspects of Community Resilience • Resistance, Absorption, Restoration (Kahan et al., 2009)
– End states or outcomes – Build back better
• Key concepts (Chandra, 2011)
– Engagement – Partnerships – Sustained local leadership – Education about risks – Access to services (eg. Health services) – Integration of preparedness and wellness – Repaid restoration of services / networks – Individual preparedness & self-sufficiency – Targeted strategies to empower and engage high risk
populations – Financial resiliency – families and businesses

Lessons from EnRiCH
1. Awareness and relationships are key factors to engage communities to become more resilient
2. True engagement is reaching out – and then really empowering people to participate
3. Asset-based approach requires changing the lens through which we see different groups in the population

80
• Disasters are characterized by disproportionate impacts on marginalized and otherwise high-risk groups.
• Vulnerability to disasters is increasing due to
• Population growth / density • Inadequate hazard knowledge • Rising rates of poverty and homelessness • An aging population and infrastructure • Increased social inequities (Enarson & Walsh, 2007)
• Because emergencies cause a disruption in social and
physical environments, it is important to consider those with functional limitations that could be at greater risk

81
Resilient communities
•Have strong social networks and accessible public organizations (McKnight, 2010)
•Effective communication strategies between leading members of community organizations (Norris et al., 2008) •Recognize the assets of individuals, organizations and communities (O’Sullivan et al., 2013)
Eatst.foodnetwork.ca

EnRiCH Intervention Framework
Develop Common Ground and Awareness
Asset/Need Assessment
Collaborative Asset-Mapping
Task
Inclusive Engagement of
High Risk Populations
Foster Connectedness
& Collaboration
Improved Contingency Plans & Communication
Enhance Adaptive Capacity & Community Resilience
Upstream Leadership & Community Partnerships

The EnRiCH Community Intervention was designed as a template for communities to tailor to their own context and priorities
1. Asset/Need Assessment (focus group using SIM format)
2. EHRIT Orientation and Networking Session
3. Online Collaborative Planning Task (8-10 weeks)
4. Table Top Exercise
The EnRiCH Manual is available at http://enrichproject.ca/publications-and-resources.html
83
EnRiCH Community Intervention

Asset/Need Assessment in Target Communities
• Focus groups using Structured Interview Matrix (n=143)
• Survey to assess connectedness before and after the focus groups
• Qualitative theme analysis
Instructional Video for the SIM available at: http://www.enrichproject.ca/publications-and-resources.html

“I very much like this format versus other traditional [focus group] methods. This format allowed for each person’s response and for an interactive flow. [It] moved along efficiently and maintained the momentum of conversation” “The process was very useful and seemed to truly collect useable useful information” “I enjoyed it... it kept everyone engaged and ensured that everyone got to participate” “Very good discussion. I think the most important thing from this is the fact that multiple organizations came together and started a conversation”

External
Posi
tive
Neg
ativ
e S W
O T
• Availability of general training/educational opportunities
• Preparedness plans in place • Lessons learned from past
disasters/experiences • Built infrastructure (eg: large facilities for
shelter) • Diverse response and support organizations • Existing MOUs • Informal supports • Close-knit community
• Lack of training and
educational opportunities in working with high risk individuals
• Lack of community awareness
• Need for improved contingency plans
• Lack of attention to high risk individuals in the planning process
• Transportation infrastructure (eg: location of railway could potentially cut off the community)
SWOT Analysis:
• External resources & networks (eg: neighbouring communities, counties, and provinces)
• Funding and resources from provincial and federal governments
• Knowledge exchange between agencies • Learning from experiences of other
communities • Military assistance • Role of media during an emergency
• Weather conditions • Physical geography • Funding • Information dissemination by media • Over reliance on external
opportunities • Built infrastructure (eg: limited
access in/out of province
Internal • Limited public and
accessible transportation • Shortage of human
resources • Community reliance on
response organizations • Need for accessible
communication • Individual finances • Large vulnerable population
(ie: seniors and people with disabilities)
• Need for improved connectedness and collaboration between agencies
Presenter
Presentation Notes
Truro SWOT Analysis

COMMUNICATION MOBILITY / TRANSPORTATION
AWARENESS SELF-CARE & DAILY LIVING TASKS PSYCHOSOCIAL SAFETY &
SECURITY
EnRiCH Functional Capabilities Framework (O’Sullivan et al., 2013) (www.enrichproject.ca)
The acronym CHAMPSS is used to outline 7 categories of functional capabilities:
– Communication – Housing – Awareness – Mobility / Transportation – Psychosocial – Self-Care & Daily Living Tasks – Safety & Security
HOUSING

1. Recognize the expertise of a) community members who have functional limitations and b) people who work in organizations that provide support for people with functional limitations
2. The expertise from the community can be used to train the response community, inform contingency plans, and ensure appropriate supports are available when needed
3. Social capital was enhanced as participants interacted and worked together on the asset-mapping task
4. Leadership is needed to create and champion opportunities for collaboration and building relationships
88
Emergent Themes

• Inclusive engagement and recognition of the expertise of community members are consistent with a ‘Whole-of-Society’ approach to disaster and emergency management (WHO, 2009; FEMA).
• Adaptive capacity is supported through connectedness and strong relationships between different sectors and organizations in a community (Norris et al., 2008).
• Upstream transformative leadership (Caldwell et al., 2012) is needed to champion this type of paradigm shift to promote inclusive engagement and acknowledge of peoples’ potential contribution
89
Bridging Health Promotion & Crisis Management

But HOW? By…
1. Creating opportunities to build awareness and relationships –these are key factors to engage communities to become more resilient
2. Reaching out to community stakeholders to engage them – and then really empower everyone to participate
3. Changing the lens to look for assets within individuals, organizations and communities

The 1st EnRiCH International Conference (2012)
• The EnRiCH International Conference on Whole-of-Society Engagement was held in Ottawa, Ontario, November 2012.
• Approximately 100 participants attended the conference, representing regions across Canada, United States, United Kingdom, and Germany.
• The webinar of the full conference is available at http://enrichproject.ca/publications-and-resources.html.
Bridge Building Workshop for Improving Community Health Community Engagement in Research (CEnR) and Comparative Effectiveness Research (CER)
Poster
Session
10:15-10:45 am
Advancing Communities’ Disaster Resilience

Bridge Building Workshop for Improving Community Health Community Engagement in Research (CEnR) and Comparative Effectiveness Research (CER)
Table Work
10:45-11:45 am
Advancing Communities’ Disaster Resilience

Table Work Session 1 Milwaukee Disaster Scenarios
• Red Section Tables – Industrial Accident • Blue Section Tables – Flood • Yellow Section Tables – Infectious Disease • Green Section Tables – F4 Tornado
** In order to ensure that sections have a wide range of backgrounds represented, you have been assigned a section to sit in – your section is listed on your name tag.

• Process – Each table section will receive one scenario to work from – The scenario is listed in the table program and extra copies will
be available – Each scenario offers:
• National operational picture (if appropriate) • Milwaukee operational picture • Community considerations
– Draw on the expertise at your table to operationalize how these community considerations might play out in this type of disaster in the community you serve or live in.
– A table section consultant will roam between tables to answer questions and provide in put as needed.
Table Work Session 1 Milwaukee Disaster Scenarios
Presenter
Presentation Notes

Table Work Session 1 Milwaukee Disaster Scenarios
• Each table will be asked to respond to 4 questions – these questions can be found in the program
• Please identify a table scribe at each table to take notes on your responses to these questions
• The notes from this process will be collected, collated and made available on the conference website

Bridge Building Workshop for Improving Community Health Community Engagement in Research (CEnR) and Comparative Effectiveness Research (CER)
Table Work
10:45-11:45 am
Advancing Communities’ Disaster Resilience

Bridge Building Workshop for Improving Community Health Community Engagement in Research (CEnR) and Comparative Effectiveness Research (CER)
Lunch
11:45-12:45 am
Advancing Communities’ Disaster Resilience

Plenary Panel • Steven Fronk, Director of the Office of Emergency
Management and Homeland Security, City of Milwaukee • Carl Stenbol, Administrator of the Emergency
Management Bureau, Milwaukee County Department of Health and Human Services
• Mona O’Brien, District Advisor, Northern District, Canadian Red Cross, Nova Scotia, Canada
• Mary Rhedin, Individual and Community Preparedness Officer, US Department of Homeland Security/FEMA RV, National Preparedness Division, Chicago, IL
• Gretchen Mead, Director, Victory Garden Initiative, Milwaukee, WI

DRIVERS OF CHANGE Advancing Communities Disaster Resilience Conference September 18, 2013
101
Presented By: Mary Rhedin Community Preparedness Officer DHS / FEMA Region V

Future Disasters Disasters are becoming
more destructive in the United States and around the world.
Change template from
response to nurturing a culture of resilience and reduce vulnerability.
102
Recent Disasters
The Public Face of FEMA
In 2013 19 Disasters
3 in Region V

Drivers of Change
103
• U.S. demographic shifts • Changing climate • The changing role of the
individual • Technology development
and dependency • Critical infrastructure • Evolving terrorist threat
Presenter
Presentation Notes
U.S. demographics Population will grow 42% by 2050 Increasing along the nation’s coastlines (urban sprawl) Shifting away from other larger (older) cities Significant increase in elderly population Becoming more racially and ethnically diverse Climate Change- once a century storm occur much more frequently Challenges Urban sprawl Stresses response resources Challenges Elderly population Many fit and mobile Many also have unique medical and care needs May require medical staff, equipment and supplies Racial and ethnic diversity Language barrier May not seek help in an emergency More mobile society Residents less familiar with the area in which they live An affluent and fast paced society Increased dependence on social networks Increased availability to real-time information Enhanced networking ability Sometimes unreliable and inaccurate Can be used with less-than-honorable intentions The Internet used to recruit and radicalize individuals Impact on public information and warning Warning Multiple paths and systems Do people understand the message? What about those who don’t have access? Critical infrastructure ---effect of economic stagnation Public Information Ensuring the message reaches the target audience People seek affirmation / validation 85% of the nation’s critical infrastructure and key resources are owned by the private sector Loss of a sector could have far reaching cascading effects Role of government in protecting infrastructure will create new challenges for emergency managers Restoring broadband service equals the importance of other infrastructure elements (water, electric, land-lines Economic Impact on Preparedness: Demand for services and capabilities increase, while resources decrease Building strong inter-disciplinary partnerships Building regionally focused and regionally based capabilities serving multiple jurisdictions Strained financial resources

The Cost of our Current Path
104
The large sums of money spent responding to disasters is an indicator of the urgent need to increase the nation’s resilience.
Presenter
Presentation Notes
New York City Mayor Bloomberg estimates the total public and private losses to New York City to be $19 billion. �Approximately 15 billion is for the losses not covered by private insurance �3.8 billion will be compensated by insured private losses �- Governor Cuomo says Sandy has cost New York state 41.9 billion. �32.8 billion in repair and restoration costs �9.1 billion in mitigation and prevention costs �- At one point, close to 3 million people in New Jersey were without power. �- Over 100 million miles of shorelines beaches are severely eroded.

Resilience
The ability of individuals and communities to deal with a state of continuous, long term stress;
the ability to garner inner strengths and resources in order to cope effectively;
the measure of adaptation and flexibility. Resilience is the ability to prepare and plan for,
absorb, recover from, and more successfully adapt to adverse events.
105
Presenter
Presentation Notes
More important than one definition is the emphasis on attributes

Success Factors
• Recognize hazards • Identify community assets • Engage and activate all parts of the
community • Support innovative thinking • Nurture existing community preparedness
and planning efforts and identify best practices
106
Presenter
Presentation Notes
Recovery from disasters is a physical and social process Community led action Collaboration between public/private Identify community assets – physical /material Engaging and activation all parts of the communities Recognizing the connections and interdependencies within communities Draw upon upon experience and expertise across different sectors and fields Support innovative thinking

Engagement Exercise
Protective Measures workshop: • Grassroots approach to engage people in
their own emergency preparedness through scenario based discussion.
• Focus on Shelter in Place POC: Dave Duecker O: 312.408.5345 E-mail: [email protected] 107
Presenter
Presentation Notes
There is a lot of noise about preparedness you see messages everywhere—what is critical is to actively engage invividuals.

Milwaukee County Emergency Management 109
Disaster Preparedness & Resources

Milwaukee County Emergency Management
What is County Emergency Management’s Role? Emergency Management coordinates pre-disaster
preparedness for natural and technological disasters that may affect the local communities and provides disaster response and recovery assistance.
Emergency Management can provide assistance with: Planning, Training and Exercising Resource Management Disaster Operations Damage Assessment Disaster Recovery
Milwaukee County Emergency Management
Milwaukee County Emergency Management
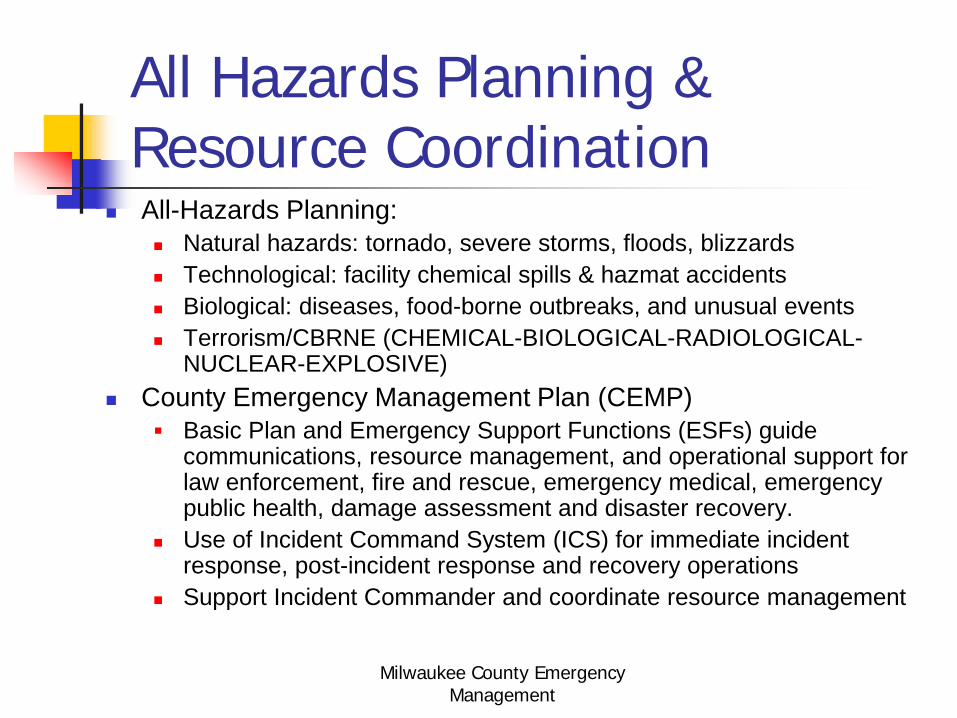
All Hazards Planning & Resource Coordination
All-Hazards Planning: Natural hazards: tornado, severe storms, floods, blizzards Technological: facility chemical spills & hazmat accidents Biological: diseases, food-borne outbreaks, and unusual events Terrorism/CBRNE (CHEMICAL-BIOLOGICAL-RADIOLOGICAL-
NUCLEAR-EXPLOSIVE) County Emergency Management Plan (CEMP)
Basic Plan and Emergency Support Functions (ESFs) guide communications, resource management, and operational support for law enforcement, fire and rescue, emergency medical, emergency public health, damage assessment and disaster recovery.
Use of Incident Command System (ICS) for immediate incident response, post-incident response and recovery operations
Support Incident Commander and coordinate resource management

Milwaukee County Emergency Management
Milwaukee County Emergency Management
Milwaukee County Incidents/Disasters 1997(D) & 1998(D) Floods 1998 Ammonium Nitrate Tanker Fire I94/Mitchell Interchange 1999 Gustnado in Cudahy (100 mph winds) 1999 Train derailment in Oak Creek (H2SO4) 2000(D) 2 Tornados (March 8th - St. Francis & July 2nd Oak Creek)
2001 Sept 11th (Primarily law enforcement, security & threat assessment)
2004(D) Flood Lincoln Creek Area 2005(D) Katrina Shelter @ SFP Youth Dorm (400+ evacuees)
2006 Falk Corp Propane Explosion Menomonee Valley 2009 H1N1 Pandemic Flu Continuity of Operations Planning 2009 Patrick Cudahy Foods Fire & Evacuation 2008(D), 2009 & 2010(D) Floods 2011(D) Ground Hog Day Blizzard

Milwaukee County Emergency Management
Evacuation and Sheltering Operations
EVACUATION OPERATIONS: • Routes Identified: Primary/Secondary, mass transit, emergency
responders/vehicles • Evacuation Staging Areas for responders, equipment and supplies • Mass transit evacuation assembly areas identified
SHELTER OPERATIONS: • Community Based Shelter Operations with Red Cross Assistance to
provide a full range of mass care services including: – Feeding, Bulk Supply Distribution, Family Reunification – Provide for continuity of care and resources – Health Services, Mental Health, Client Casework
• Assures that immediate needs of the clients are met and connect them to resources, special needs services provided at the shelter site.

Milwaukee County Emergency Management
Resource Management Planning Provides basic guidelines for inventorying, mobilizing, and
monitoring direct and logistical resources--equipment, supplies, facilities, and personnel--needed in response to and recovery from disasters and other major incidents. Provides a framework for response resource management within integrated response and recovery operations.
Potential request(s) for assistance: emergency purchasing, heavy equipment, fuel, radios, command post, food service, water, portable toilets, generators, sandbags, volunteers, flood recovery supplies & vendors, evacuation & shelter support, mutual aid assistance, IMT (Incident Mgmt. Team).

Milwaukee County Emergency Management
Response Resources and Coordination Office of the Sheriff Office of the County Executive County Dept. Heads Regional Hazmat Team Municipal Elected Officials Local Public Health Depts. Local Fire Chief’s Local Police Chief’s Local Public Works Business/Industry
Red Cross Salvation Army State VOAD WI National Guard State Emergency Mgmt State DNR State Patrol U.S. Coast Guard FBI US EPA
Specialized resources include: Hazmat Response Team, Heavy Urban Rescue Team, SWAT Teams, Explosive Device Mitigation Teams, Event
Surveillance, Biological Monitoring, Real time messaging

Milwaukee County Emergency Management
Catastrophic Event Scenarios All disasters begin Local -> County --> State --->
Federal Severe Weather Events:
Tornado (Joplin scenario F4) Major Flood Ice storm
Hazardous Materials Incidents: RR Hazmat bulk tank railcar (propane-2 mile zone) Anhydrous Ammonia Food Storage Facilities (1 mile zone) Interstate Highway Bulk Tanker Incident
Milwaukee County Emergency Management

Milwaukee County Emergency Management
Facility Preparedness Site Emergency Plan with evacuation and shelter-in-place
procedures; and contingency plan for essential employees and resources. Maintain Continuity of Operations Plan (COOP) for relocation of staff to predetermined off-site location and provisions for critical supplies and equipment at location.
Local jurisdiction special facility planning: • Required for: Hospitals, Nursing Homes, Assisted Living
Facilities, Schools,Community Based Residential Facilities, Day Program Sites and In-Home Service Providers
• Must have contingency plan for essential resources: power, water, food, sanitation, and other supplies essential for operation and plan for relocation and transportation of clients / residents to off-site alternate facility / location for continuity of care.
Milwaukee County Emergency Management
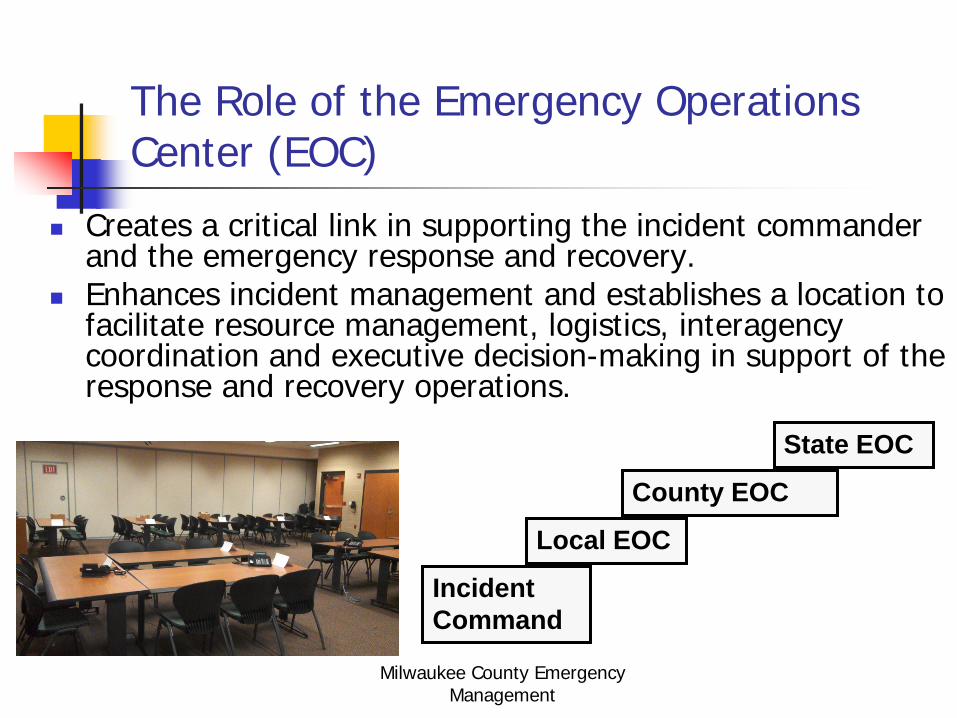
The Role of the Emergency Operations Center (EOC)
Creates a critical link in supporting the incident commander and the emergency response and recovery.
Enhances incident management and establishes a location to facilitate resource management, logistics, interagency coordination and executive decision-making in support of the response and recovery operations.
County EOC
State EOC
Incident Command
Local EOC

Milwaukee County Emergency Management
Recovery Phases
Stabilization
Intermediate (Disaster Assistance)
Long Term Recovery (Unmet Needs)
DAYS=>WEEKS WEEKS=MONTHS MONTHS=YEARS

Milwaukee County Emergency Management
Federal Assistance
Robert T. Stafford Disaster Relief and Emergency Assistance Act of 1988 (as amended) provides two types of Presidential declarations: Emergency
Limited types of assistance available Primarily Public Assistance
Major Disaster Full range of federal assistance
Individual Assistance Public Assistance
Milwaukee County Emergency Management
Recovery Goals
Maintain leadership Utilize local initiative and resources Maximize state/federal programs and benefits Establish and maintain communications to and
from citizens Provide a point of contact for disaster victims Make maximum use of damage and impact
assessment for recovery planning Promote economic recovery.

Milwaukee County Emergency Management 122
The Big Picture
Local EOC or
Command Post
County EOC
State EOC
Federal Government
***Federal resources are restricted until Presidential Disaster Declaration Occurs
Local / County State of Emergency Declared Damage Assessment Initiated
State Declares State of Emergency
Local IC overwhelmed; lack local resources for incident response/recovery Local
Incident or Event

Milwaukee County Emergency Management
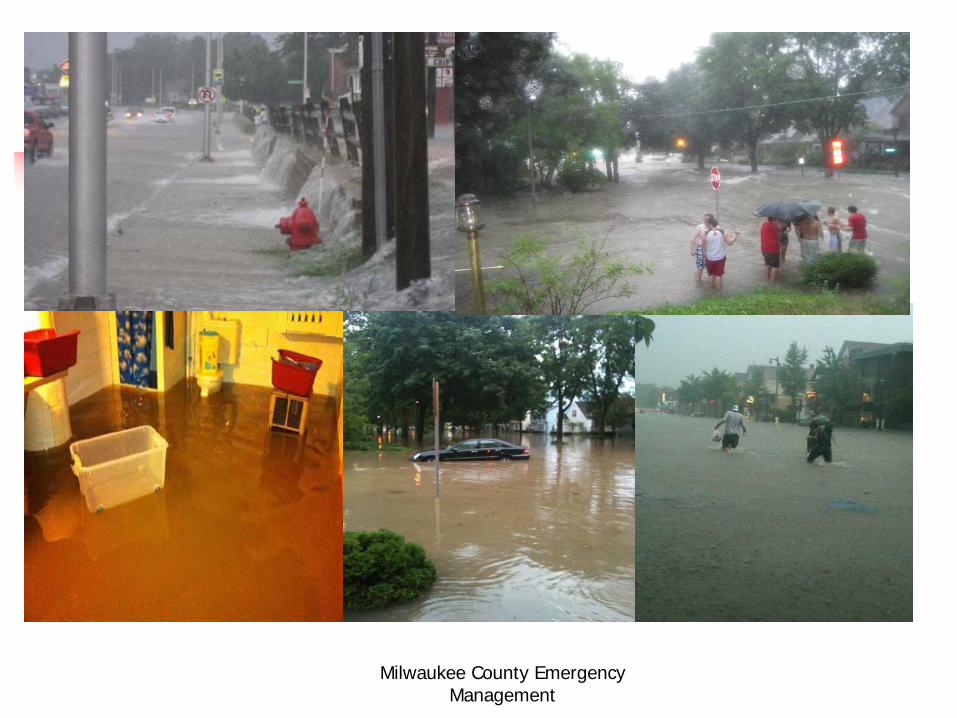
July 22, 2010 Milwaukee County Severe Weather / Flooding
• July 22, 2010, late afternoon moderate to heavy rain moved through rapidly dumping 3-4 inches of rain in a few hours causing areas of flash flooding.
• During the evening severe thunderstorms developed and moved very slowly over the same areas with heavy rain of 4-5 inches common in many areas setting the stage for major flooding. Locally reports of 6 to 8+ inches of rain on the north side of the City of Milwaukee and in the North Shore suburbs.
• General Mitchell International Airport recorded 5.79 inches for the day...breaking a record.

Milwaukee County Emergency Management
Damage Assessment
In Milwaukee alone over 1200 homes had 2 feet or more of water/sewage in
their basements.
Milwaukee County Emergency Management

Milwaukee County Emergency Management

Milwaukee County Emergency Management
Flooding Event Private and Public Sector Damages $35,514,569
Total homes reporting: 11,881 with estimated damages of $22,187,459 • 9957 homes affected • 1859 homes with minor damage • 59 homes with major damage • 6 homes destroyed Total businesses reporting: 68 with estimated damages of $1,686,752 • 59 businesses with minor damage • 9 businesses with major damage Total public sector damage (uninsured) estimated at $11,640,358 • $1,946,100 for debris clearance • $894,988 for protective measures (emergency services overtime and response equipment) • $2,774,400 for road damage • $310,000 for damage to water control sites • $2,003,010 for damage to public buildings and equipment • $2,385,760 for damage to public utilities • $1,326,100 for other damages (roadways, pathways, trails, erosion controls)

Milwaukee County Emergency Management
Milwaukee Severe Weather/Flooding July 2010 Challenges Damage Assessment Data Duplication Use of 2-1-1 Impact Hotline and 286-CITY FEMA Appeal / Delay in FEMA Declaration for
Individual & Family Assistance FEMA Registration Process Rental Properties Volunteer Management
Volunteers for debris removal from basements Volunteers for basement clean up and mold remediation
Flood Clean-Up Kits for community Requesting Kits – Delivery - Distribution

Milwaukee County Emergency Management
Proposed Local Recovery Support Functions (RSFs)
1. Damage Assessment/ Impact Analysis
2. Continuation of Government 3. Debris Management 4. Individual Assistance 5. Unmet Needs 6. Human Services 7. Safety and Risk Assessment 8. Public & Environmental Health 9. Repair & Restoration of
Infrastructure 10. Emergency Permitting and
Inspections 11. Rebuilding, Construction,
Repairs, Restoration
12. Housing (Temporary and Replacement
13. Redevelopment 14. Public Information/Community
Relations 15. Volunteers and Donations 16. Re-entry & Security 17. Economic Restoration &
Development 18. Environmental Concerns 19. Mitigation 20. Recovery Administration &
Finance 21. Cultural & Historic Concerns 22. Mutual Aid

Milwaukee County Emergency Management
Milwaukee County Emergency Management
CONTACT INFO: Milwaukee County Office of the Sheriff Division of Emergency Management
9225 South 68th Street Franklin WI 53233
414-525-5770 E-mail: [email protected]
Web-site: www.mkesheriff.org

High Water in Milwaukee
An after-the-flood perspective on perils, pitfalls and practical considerations
when you really need help


How IT and GIS helped demonstrate the impact on the
community The 2010 FEMA Disaster Declaration
Challenge Case Study
9/6/2011 133 Draft - for Discussion purposes only

“As Governor Doyle mentioned in his July 31, 2010 letter to President Obama, private households in
Milwaukee County, and especially the City of Milwaukee, were impacted by
this event in such severity and magnitude that effective response is beyond the capabilities of the State and our local governments without
federal assistance. I am very concerned that without the Individual Assistance Program designation, parts
of our community will be unable to rebound from this disaster. Therefore,
I am providing you with further information to illustrate the
concentration of damages in our city and the impact on our residents and
neighborhoods. “ Excerpt: Letter dated August 13, 2010
from Mayor Tom Barrett
9/6/2011 Draft - for Discussion purposes only 134

“Backwater & Service Calls + Household Income - The map
indicates that the area with the highest amount of service calls
reflects a median income of less than $25,000/year.”
Excerpt: Letter dated August 13, 2010
from Mayor Tom Barrett
9/6/2011 Draft - for Discussion purposes only 135

“Backwater Service Calls + Minority Population – The cluster map
indicates that the same low-income area reflects that 80-100% of the area
is minority. “
Excerpt: Letter dated August 13, 2010 from Mayor Tom Barrett
9/6/2011 Draft - for Discussion purposes only 136

“Backwater + Senior Populations – The map indicates several significant
areas of concentration of seniors (defined as 65 years of age and
older). A fair share of the backwater calls come from areas of the city that represent either 9-12% or 12-32% of seniors within the impacted areas. “
Excerpt: Letter dated August 13, 2010
from Mayor Tom Barrett
9/6/2011 Draft - for Discussion purposes only 137

“These same neighborhoods have been affected by flooding incidents in 2008, 2009 and 2010. These incidents generated a combined total of 13,442 calls (in 2008 there were 2,066 calls; in 2009 there were 673 calls and the
combined total of the two incidents in July of 2010 resulting in 13,442 calls).
Upon review you will see that the density in Map E is almost identical to
that of Map A. “
Excerpt: Letter dated August 13, 2010 from Mayor Tom Barrett
9/6/2011 Draft - for Discussion purposes only 138

“Another layer of hardship for impacted communities is that these same neighborhoods most adversely impacted by this event, suffered from
high rates of subprime lending and foreclosures in recent years. “
Excerpt: Letter dated August 13, 2010
from Mayor Tom Barrett
9/6/2011 Draft - for Discussion purposes only 139

“This has resulted in baseline declines in property values. The average
estimate of decline in property values for the areas hardest hit by the flood reflects a devastating reduction of at
least 10% from 2008 to 2010, a stunning loss that has further reduced
home equity values. “
Excerpt: Letter dated August 13, 2010 from Mayor Tom Barrett
9/6/2011 Draft - for Discussion purposes only 140

“Milwaukee’s housing stock is unique in a couple ways. First, properties are
older, especially in the areas hit by the flood. Over 95% of the homes are 50 years and older, and as homes age,
the cost of replacement and repairs increase. It also makes those same
homes more susceptible to damage, since the sewer infrastructure is
usually as old as the house itself. “
Excerpt: Letter dated August 13, 2010 from Mayor Tom Barrett
9/6/2011 Draft - for Discussion purposes only 141
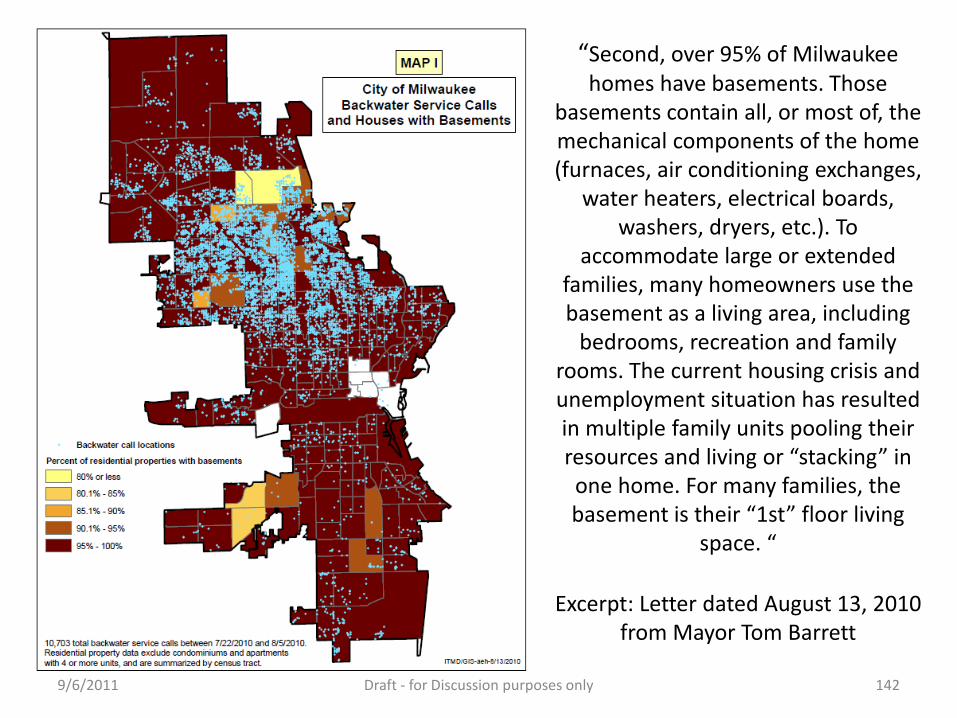
“Second, over 95% of Milwaukee homes have basements. Those
basements contain all, or most of, the mechanical components of the home (furnaces, air conditioning exchanges,
water heaters, electrical boards, washers, dryers, etc.). To
accommodate large or extended families, many homeowners use the basement as a living area, including
bedrooms, recreation and family rooms. The current housing crisis and unemployment situation has resulted in multiple family units pooling their resources and living or “stacking” in one home. For many families, the basement is their “1st” floor living
space. “
Excerpt: Letter dated August 13, 2010 from Mayor Tom Barrett
9/6/2011 Draft - for Discussion purposes only 142

A bit of history …
• On July 22, 2010 more than 8 inches of rain fell in less than 3 hours in parts of Milwaukee
• Call Center received 12,000+ backwater calls • In some homes it was “clear water” • In other homes it definitely was not • Citizens and DPW removed and disposed of 7,000
TONS of soaked basement debris • Now what ???

Circle the wagons …
• DPW already working double shifts • EM&HS office staff is exhausted • 12,000 citizens in need of assistance • No cavalry in sight ! • Only feasible solution … call in volunteers • One big problem …

Chapter 323.41(3) Wis. Stats.
• (a) … an individual who registers in writing with a local unit of government’s emergency management program to provide his or her own labor without compensation … during a disaster … is considered an employee of the local unit of government … for purposes of any claim to the labor provided.
• What does this mean?
The not-so-great legislative solution …
• 323.42 (1) In any calendar year, if the amount the local government is liable for … exceed(s) $1 per capita of the local unit of government’s population, the state shall reimburse the local unit of government the amount of the excess.
• Only $1 per capita? • Milwaukee population is 600,000 • Where do you live?

Factors Propelling Volunteer Clean-Up Effort
• Meeting with Mayor Barrett • Concentration of flood damaged homes
predominantly in Milwaukee’s inner city • Many homes impacted … few destroyed • Poor, elderly, functional needs populations
disproportionately affected • No guarantee outside assistance forthcoming

Initial Steps
• EMHS/VOAD/COAD establish operational VRC and start clean-up effort within three days.
• Discussion with City Attorney regarding municipality liability under Chapter 323
• Homeowner liability waivers drafted • City Call Center & 211 help with triage • Mayor goes public, calling on people to help their
neighbors and assist us in identifying most in need

Before Deployment
• 211 & 286-CITY identified and disseminated daily list of callers for volunteer clean-up.
• Necessary resident information and status entered into All Hands Disaster database
• Licensed social workers and CDBG workers make contact with residents and perform needs assessments door-to-door and by phone

• Background checks of volunteers by EMHS • Medical evaluations by Health Department • Fit testing for masks by Fire Department • Safety training at volunteer reception center • Equipment, gloves & cleaning supplies distributed
Veolia Water
Preparing Volunteers

At Time of Deployment
• Volunteers divided into groups • Each group given specific addresses • On-site supervision provided by crew leader from
Milwaukee Community Service Corp
Veolia Water

UASI Regional Effort
• Urban Area Security Initiative stakeholders from 5 counties (Milwaukee, Racine, Waukesha, Washington & Ozaukee Counties) assisted in obtaining volunteers
Veolia Water

Volunteer Clean-Up Effort in Milwaukee … a success story
Veolia Water

300+ most-in-need homes cleaned by 35+ organizations, 130+ volunteers and
only 21 full-time paid personnel
Veolia Water

A Special Thank You.. • VOAD for assisting in the recruitment of volunteers. Keith
Lang, President of Wisconsin VOAD was one of the first contacts the Office of Emergency Management & Homeland Security made.
• Milwaukee & Waukesha Counties personnel assisted with volunteer management, provided ID-badge system and helped locate housing for AmeriCorps workers
• Ozaukee County provided personnel to assist in volunteer management at the volunteer reception center.
• Washington & Racine Counties provided outreach by requesting their volunteers to assist the clean-up effort.

Additionally we need to thank…
• Wisconsin Emergency Management, the Office of Justice Assistance & FEMA for providing us guidance throughout the clean-up effort.
MCSC
Let’s not forget … All Hands Disaster, AmeriCorps, ARES RACES, Christian Reformed World Relief
Committee, City of Milwaukee, Communities and Organizations Active in Disaster, Community Partners (Safe and Sound), Department of Homeland Security, Flood Emergency Assistance Team, Federal Emergency Management Assistance, Grainger, Kleen mart, Lutheran Social Services, Milwaukee Community Service Corp, Milwaukee Community Christian Corp-Youth Builds, Milwaukee County, Milwaukee Fire Department, Milwaukee Health Department, Milwaukee Metropolitan Sewerage District, Milwaukee Police Department, Milwaukee Public Schools, Office of Justice Assistance, Project Recovery, Red Cross, Salvation Army, Southern Baptist, United Methodist Church, UW-Whitewater, UW-Milwaukee, Veolia Water, Volunteers and Organizations Active in Disaster (VOAD), Washington County, Waukesha County, Wisconsin Emergency Management.
And a very special thank you to the people of Nechama and AmeriCorps for
hands-on, in-the-trenches help, and to the Milwaukee Kicker’s Soccer Club for generously donating their facilities as a residence of AmeriCorps workers.

Was it all worth it?

But where are we now?
• Least resilient are not much better off • Most preparedness programs still reach only those
already at least somewhat prepared • Poor, elderly, functional needs populations are still
difficult to reach and underserved • Most people, when the sun is shining, still do not see
disaster preparedness as a priority

New Tactics and Ideas Required
• More/better community outreach and training • Restructured UAWG to include private sector, CBO
and FBO stakeholders at the table • Refocused UAWG emphasis: ID and match existing
resources/relationships with needs • Simpler, more visible preparedness message • Link disaster preparedness with in-school, fire
prevention and survive alive programs

And the list goes on
• Facebook friends as volunteer cadre • Volunteer flash mobs • Student association volunteer competitions • Sports figure PSAs encouraging pre-event
preparedness and post-event volunteerism • Sports venues as “let’s get it done” VRCs • Promo items (first aid kits, weather radios, sports
tickets) for volunteer service

Steve Fronk, Director City of Milwaukee Office of Emergency Management
& Homeland Security 414.286.5062
Contact Me With Your Ideas

Fostering Community Engagement
Pre – During – Post Disaster Response
Mona O’Brien, Canadian Red Cross Nova Scotia, Canada
Community & Academic Partnerships:
Learning from the Past, Building for the Future Milwaukee, WI, USA
09/17/2013 163

∗ Understanding why community based organizations and community members should think about engaging in the emergency preparedness and response process.
∗ What community based organizations and members have to offer the emergency preparedness process.
∗ Why community based organizations should think about emergency preparedness.
9/18/2013 Footer Text 164
Fostering Community Engagement Learning Objectives

∗ Largest humanitarian organization worldwide. ∗ Mission: To improve the lives of vulnerable people by
mobilizing the power of humanity. ∗ Nova Scotia was the first Province in Canada to sign
an agreement with the Provincial Government to provide the 6 emergency social services; food, clothing, shelter, personal services, registration/inquiry and reception and information.
9/18/2013 Footer Text 165
About the Canadian Red Cross
Presenter
Presentation Notes
3.5 dedicated staff members to providing DM leadership within the Province. 400 volunteers trained to national standards in disaster management

9/18/2013 Footer Text 166
Nova Scotia is...

∗ 1 of Canada’s 3 Maritime Provinces ∗ Second smallest province in Canada ∗ Nowhere in Nova Scotia is more than 67 km (42 mi)
from the ocean ∗ Prone to tropical storms and hurricanes ∗ Population in 2011 was 921 727 ∗ Famous for our seafood and great hospitality
9/18/2013 Footer Text 167
Nova Scotia is...
Presenter
Presentation Notes
There have been 33 such storms, including 12 hurricanes, since records were kept in 1871 – about once every four years. The most destructive hurricane was Hurricane Juan in 2003.

• Located in the Center of Nova Scotia • situated near the Atlantic Ocean and enjoys a
moderate climate with warm summers, mild winters, and picturesque autumns
• a town of approximately 12,000 people (2011 census data)
• at the junction of all major rail and highway routes • Known as the “Hub” of Nova Scotia
9/18/2013 168
Truro, Nova Scotia is...
Presenter
Presentation Notes
Point out where Truro is in comparison to the rest of the Province; Railway runs through the centre of Town – Cargo train, with litres and litres of hazardous materials on board Population approx: 12 059 – 2011 Census data Population of Colchester County including Town of Truro is approx. 60 000 (which would also be affected) Average Household Income: $ 37 000 Highest rate of Mental Health consumers in the Province – because, the vast majority of services are located in Truro, NS which lends itself to a progressive community in terms of service providers

9/18/2013 169
A closer look at Truro...

∗ Sept 2012 flooding - 56 registered; 100+ clean up kits ∗ March 2009 flooding - 40 households evacuated ∗ March 2006 fire – 11 unit apartment building; several residents were
mental health consumers ∗ Nov 2004 power outage – 4 day duration; 40 comfort centres
established province wide ∗ Feb 2004 blizzard– White Juan; formal state of emergency declared ∗ Sept 2003 Hurricane Juan – 9 day power outage ∗ March 2003 flooding – 445 registered; Local State of Emergency ∗ Sept 11 – 9000 registered and sheltered ∗ Sept 2000 fire – seniors complex; 20 registered; 1 fatality ∗ January 1998 flooding – 275 registered
9/18/2013 170
Our Recent Emergency History
Presenter
Presentation Notes
Over 83 smaller scale emergencies in the past 8 years such as house fires, localized flooding, etc. Swiss Air 1998 – 229 souls lost September 11 – 9000 sheltered Support to the Alberta Flooding – call centre and deployments Porters Lake Forest Fire – registered 5000 – Friday of Fathers’ day weekend Spryfield Forest Fire – registered 1200 – early Spring 1999 – Kosovo Refugees come to NS – 5000 landed in Greenwood, NS, Red Cross was there for 3 months providing ESS.

∗ Forest Fire ∗ Weather Events (severe snowstorms) ∗ Hurricane ∗ Transportation (rail and air) ∗ Flooding
9/18/2013 Footer Text 171
Hazards and Risk Analysis
Presenter
Presentation Notes
During 2012 HARA exercise, the Red Cross in Canada identified the following as the highest risk for the Province of NS Based on this, an all hazards approach is taken when it comes to preparedness and planning. An example of this would be the lunchbox sessions (lunch and learn) we promote with community organizations. This is the approach we use when educating the community at large – an all hazards approach. Health emergencies are also on the rise – is this something you should be planning for?
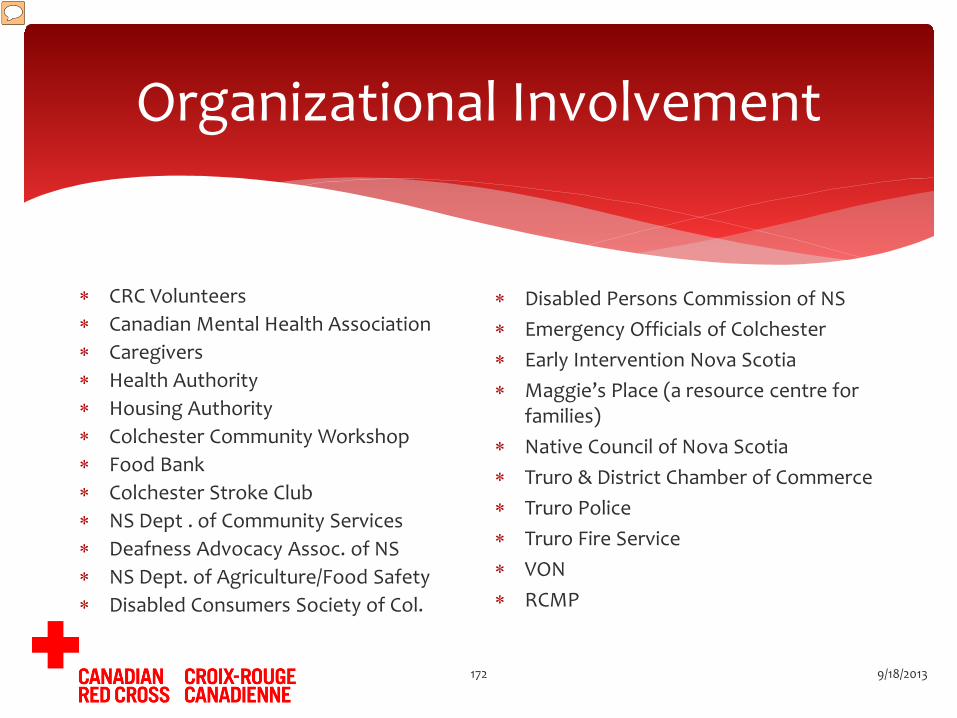
Organizational Involvement
9/18/2013 172
∗ CRC Volunteers ∗ Canadian Mental Health Association ∗ Caregivers ∗ Health Authority ∗ Housing Authority ∗ Colchester Community Workshop ∗ Food Bank ∗ Colchester Stroke Club ∗ NS Dept . of Community Services ∗ Deafness Advocacy Assoc. of NS ∗ NS Dept. of Agriculture/Food Safety ∗ Disabled Consumers Society of Col.
∗ Disabled Persons Commission of NS ∗ Emergency Officials of Colchester ∗ Early Intervention Nova Scotia ∗ Maggie’s Place (a resource centre for
families) ∗ Native Council of Nova Scotia ∗ Truro & District Chamber of Commerce ∗ Truro Police ∗ Truro Fire Service ∗ VON ∗ RCMP
Presenter
Presentation Notes
Before the EnRiCH project began in Truro, we did an environmental scan of community organizations that could provide any of the ESS to augment the support given by the Red Cross in response. But our work didn’t stop there. These organizations play a key role in preparedness. They asked the Red Cross to provide the EPP to their staff, their boards and the clients they provide a service to. Once this was completed, we worked with the executive of some of the organizations to create an EP plan for their organization. This takes time, resources and dedication to ensuring the community is prepared. What resources do you have in your community that could be helpful or utilized in future disasters? List the enviromental scan I did .

∗ Environment scan ∗ Established/fostered new relationships ∗ Oriented groups to the purpose of EnRiCH ∗ Provided groups with opportunity to partner with us ∗ Coordinated forum for groups to come together
exclusively focus on emergency preparedness
9/18/2013 Footer Text 173
Process for engagement & collaboration
Presenter
Presentation Notes
Environmental scan to identify organizations providing a service to vulnerable populations on a daily basis Established and fostered new relationships; utilized existing partnerships Oriented groups to the purpose of EnRiCH; strongly messaged the importance of emergency preparedness in our community Provided groups with an opportunity to partner with a leader in disaster management and the expertise that comes along with the Red Cross Coordinated forum for groups to come together to exclusively focus on emergency preparedness

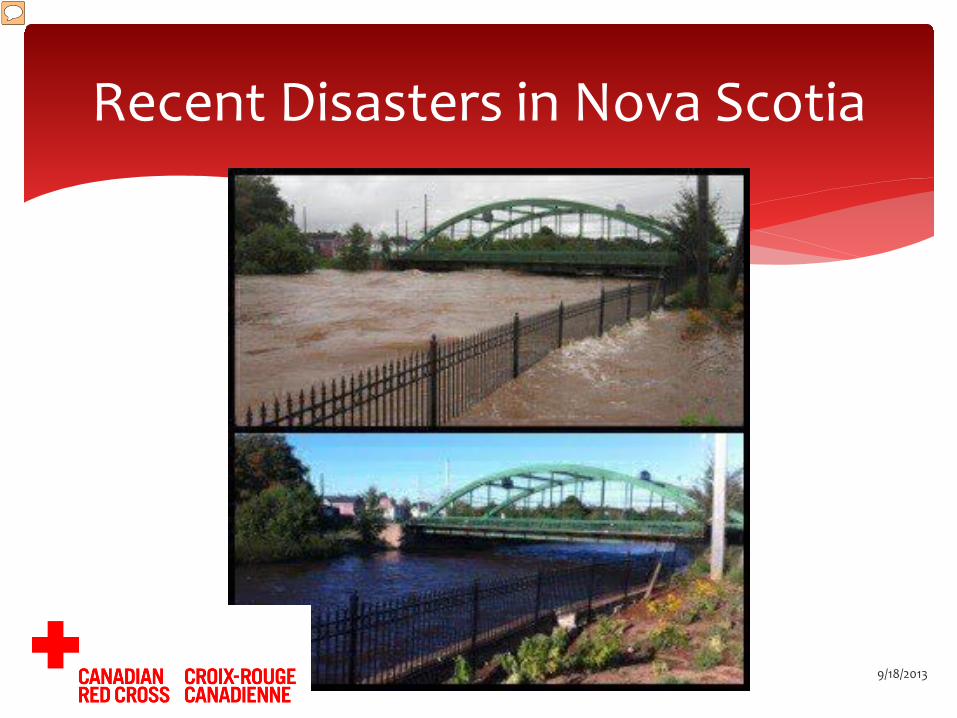
A Picture is worth...
9/18/2013 174
Presenter
Presentation Notes
Describe picture Train bridge Entering into Bible Hill One of the few access points into Bible Hill was cut off Homes were invaded with flood waters consisting of chemicals, etc....

Recent Disasters in Nova Scotia
9/18/2013 Footer Text 175
Presenter
Presentation Notes
Access to essential services were cut off.
Recent Disasters in Nova Scotia
9/18/2013 Footer Text 176
Presenter
Presentation Notes
Town of Truro was limited to access vital services – what a difference a day makes.

Recent Responses in Nova Scotia
9/18/2013 Footer Text 177
Presenter
Presentation Notes
How would these emergencies affect your organization or your employees/volunteers/clients?

Strengths in our community
-Availability of training -Preparedness plans in place -Lessons learned from past disasters -Built infrastructure (large facilities) -Diverse response/support organizations -Existing MOUs -Informal supports -Close knit community
9/18/2013 Footer Text 178
Presenter
Presentation Notes
CRC-DP Workshops – 45 minute brownbag lunch sessions offered to community groups, corporations, and other NGO, as well as gov’t departments to educate staff on personal preparedness Hurricane Juan, White Juan, Flooding -2003 Built Infrastructure – many support organizations have facilities, service groups such as legion, lions clubs, churches, ALL have agreements with REMO and Red Cross. Diverse Response/Organizations: REMO, Police, Fire, EHS, SA, DCS, Col-Rest Existing MOU’s – DOP, Agreement with DCS, since 1999 Close knit community – Col. County Fire Fighters Association – call upon when needed. High risk individuals are serviced by one organization, such as Col. Stroke Club – there is only one in the area, therefore, close relationships are built for people to rely on each other during times of disaster.

Weaknesses in our community
-Lack of training/educational opportunities in working with high risk individuals -Lack of community awareness -Need for improved disaster plans -Transportation
9/18/2013 Footer Text 179
Presenter
Presentation Notes
Lack of training/educational opport: for example, someone who requires specialized training does not have access to it in Truro, would have to travel to Halifax (an hour away) to receive this training. Interesting to note: Response organizations were well aware of each other’s capacity, however, the focus group confirmed, they were not aware of response organization capacity nor, response organizations were not aware of some groups in Truro that were of high risk. Need for improved contingency plans: More awareness to the gen. population and high risk pops are required and the Emergency response organizations require additional training to deal with high risk popuations, such as Red Cross shelters – how can we accomodate residents with a multitude issues such as mental health issues: IE: Roleika Drive example... Transportation infrastructure: There is one able transit bus in Truro. This brought about heavy concerns and was deemed a weakness generally. There was quite a concern over how communication would proceed in the event of a large scale disaster in the community Limited Income – med income is appr. $37 000, however, fixed income was an issue and showed as a weakness. Shortage of human resources Community reliance on response organizations Need for accessible communication Individual finances Large vulnerable population, ie. seniors and people with disabilities Need for improved connectedness and collaboration between � agencies
∗ The EnRiCH Project and focus groups were an intervention in itself.
∗ Connected to a vaster group of vulnerable/high risk populations.
∗ Identified gaps; moving forward gaps are slowly being bridged.
9/18/2013 Footer Text 180
Observations/Outcomes
Presenter
Presentation Notes
Bringing together groups forced us to focus on preparedness collaboratively Maggie’s Place had not include emergency preparedness in their planning; now they do and have partnered with Red Cross to provide training to client base Dept. of Agriculture/Food Safety Division initiated contact with Red Cross during recent flooding; provided information on food safety for client distribution; visited shelters Early Intervention NS identified their work with children with disabilities and their families; Red Cross volunteers have been trained by EINS on accommodating children with disabilities and their families in emergency shelters, enhancing our ability as a service based organization

∗ Phone tree used by the Colchester Stroke Club was most certainly an opportunity to broaden the scope of best practices and encourage others to share their best practices.
∗ Collaboration with our community! Getting to know each other pre-disaster allows us all to respond more appropriately when serving clients.
∗ Initially, we failed to recognize that it is unreasonable to ask a person living on Income Assistance, on a pension or in poverty to create an emergency kit. We shifted messaging to include information on how to access available resources.
9/18/2013 Footer Text 181
Observations/Outcomes What worked well? Where did we encounter obstacles?

∗ Transportation restrictions, it was beneficial to create a “mobile presentation”. This also allowed the training participant the added comfort of being in familiar surrounding.
∗ Even though helping each other is the “Maritime way”, it is the combination of resources within our community that make us more resilient.
∗ When the time comes again for a disaster response, we will have built the relationships with organizations that provide services to vulnerable populations – our shared clients.
9/18/2013 182
Observations/Outcomes Lessons Learned

∗ We know a prepared community is a more resilient one!
∗ Disasters seem to be happening with more severity and more frequency.
∗ A vulnerable population tends to be more reliant on services/support pre and post disaster.
9/18/2013 Footer Text 183
Why should your organization think about Emergency Preparedness?

∗ When the community is prepared, be it as individuals, families, or communities, the disaster itself becomes only an inconvenience and not an emergency, in most cases.
∗ Communities would be familiar with the resources that already exist in the community, so they would know where to direct themselves for services.
9/18/2013 Footer Text 184
Why should community members care about future disasters and planning for them?
∗ Collaboration on personal emergency preparedness was not part of the organizational mandate of the groups.
∗ When groups were presented with an opportunity to enhance their ability to reach out to their client base, pre, during and post disaster, they embraced it!
∗ There was a commitment to collaborate. ∗ Barrier: Lack of human resources; dedicated hands
are needed to keep the wheels turning!
9/18/2013 185
Lessons on Collaboration
Presenter
Presentation Notes
Mention the funding for Cumberland County – See Jim Hannon for update...

∗ Limited or no technical ability/interest. ∗ Dialogue and collaboration was encouraged the old
fashion way! ∗ Through inciting discussion rather than providing
answers we encouraged problem solving and personal responsibility in preparedness.
9/18/2013 Footer Text 186
Lessons on Collaboration
Presenter
Presentation Notes
Several of the group members we met had limited or no technical ability/interest so staying connected comprehensively through online sites was a barrier – we broke it down. Many of the groups did not email/blog/text/tweet and many did not have the hardware. We encouraged dialogue and collaboration in a way in which the individuals were familiar and comfortable, ie. picking up the phone, meeting in person, and maintaining the contact. Through inciting discussion rather than providing answers we encouraged problem solving and personal responsibility in preparedness.

∗ It has allowed us to cast a bigger net into the community we serve pre-during-post disasters.
∗ It has increased our ability to educate individuals, organizations, and the community on the importance of being prepared.
∗ It has meant we, as an organization are better prepared to respond to the needs of our community.
9/18/2013 187
What has partnering with the University of Ottawa done for us?

∗ Connect with the local chapter of the American Red Cross. Be prepared as an individual.
∗ Find out what the local, state and federal emergency plans are for you and your community.
∗ Be engaged and help your neighbour. ∗ Build resiliency in your community, one step at a time.
9/18/2013 188
How can your community become involved in
disaster preparedness and response?
Presenter
Presentation Notes
– find out the risk in your community and volunteer opportunities Did you know September is National Preparedness Month? With the American Red Cross - Know the risk, Make a plan Build a kit. www.redcross.org

Bridge Building Workshop for Improving Community Health Community Engagement in Research (CEnR) and Comparative Effectiveness Research (CER)
Table Work
2:30-3:15 pm 10 Minute Chimes for
Moving to Another Color Table
Advancing Communities’ Disaster Resilience

Table Work Session 2 – World Café
• Each Table Section will have 1 over arching question regarding how we can address the issues identified in the morning session through systems level change.
• Participants will start in their color zone and then migrate to a NEW table in each of the other three color zones at 10 minute intervals.
• Participants will add any NEW ideas to the list of responses being created by the table scribe

Start at a Blue Table
Move to a Green Table
Move to a Yellow Table
Move to a Red Table
Table Work Session 2 – World Café

• Report out – One table scribe in each section leads report
out with other scribes filling in any additional ideas
– Thoughts on morning scenarios – Open discussion
Table Work Session 2 – World Café

Bridge Building Workshop for Improving Community Health Community Engagement in Research (CEnR) and Comparative Effectiveness Research (CER)
Table Work
2:30-3:15 pm
Advancing Communities’ Disaster Resilience

Bridge Building Workshop for Improving Community Health Community Engagement in Research (CEnR) and Comparative Effectiveness Research (CER)
Report Outs From the
Group
3:15-4:00 pm
Advancing Communities’ Disaster Resilience

Closing Remarks Zeno Franco, PhD