3Q2017 Cover Page.ppt -...
15
GLOBAL CAPITAL MARKETS REVIEW REUTERS / Ilya Naymushin GLOBAL CAPITAL MARKETS REVIEW LEGAL ADVISORS Full Year 2017
Transcript of 3Q2017 Cover Page.ppt -...

GLOBAL CAPITAL MARKETS REVIEWREUTERS / Ilya Naymushin
GLOBAL CAPITAL MARKETS REVIEWLEGAL ADVISORS
Full Year 2017

11
11
11
Canada All Debt (CAL1) - Manager
Canada Equity & Equity-related (CAL4) - Issuer
Canada Equity & Equity-related (CAL4) - Manager
Japan Capital Markets
Japan Common Stock (JL1) - Issuer
Japan Common Stock (JL2) - Manager
Samurai Bonds (JL5) - Issuer
Samurai Bonds (JL6) - Manager
11
Canada Capital Markets
6
6
6
6
Canada All Debt (CAL1) - Issuer
EMEA Capital Markets
7
7
All International Bonds (AV1) - Issuer
All International Bonds (AV2) - Manager
10
10
Australia International Bonds (BW1) - Issuer
Australia International Bonds (BW2) - Manager
1
Global Debt, Equity & Equity-related Excluding FCA (G01) - Manager
Quarterly Global Legal Advisor Debt, Equity and Equity-related Chart
Full Year 2017 | Global Capital Markets | Legal Advisors
GLOBAL CAPITAL MARKETS REVIEW
Table of Contents
Global Capital Markets
Global Deals Intelligence
Global Debt, Equity & Equity-related Excluding FCA (G01) - Issuer
1
1
Global Straight Debt Including ABS & MBS (G02) - Issuer
Global Straight Debt Including ABS & MBS (G02) - Manager
2
2
2
1
Global Straight Debt Excluding ABS & MBS (G03) - Issuer
https://www.thomsonone.com
Sa u a o ds (J 6) a age
Criteria Summary
Ranking Criteria Summary 12
EMEA Equity & Equity-related (AX2) - Manager
9
Asia Pacific G3 Bonds (BV1) - Issuer
Asia Pacific (Ex Japan) Capital Markets
8
8
Asia Equity & Equity-related (BX1) - Issuer
Asia Equity & Equity-related (BX2) - Manager
Asia Pacific G3 Bonds (BV2) - Manager
Asia Pac G3 Bonds ex Australasia, Central Asia (BV3) - Issuer
Thomson Reuters Contact
8
8
7
te at o a o ds ( ) a age
EMEA Equity & Equity-related (AX1) - Issuer
Australia Equity & Equity-related (BY2) - Manager
9
10
10
Asia Pac G3 Bonds ex Australasia, Central Asia (BV4) - Manager
Australia Equity & Equity-related (BY1) - IssuerUS Straight Debt Including ABS & MBS (AB6) - Manager
US Straight Debt Including ABS & MBS (AB6) - Issuer
US Straight Debt Excluding ABS & MBS (AB7) - Issuer
US Straight Debt Excluding ABS & MBS (AB7) - Manager
5
5
5
5
12
Thomson Reuters Solutions For the Deal Making Community
13
Global Equity & Equity-related (G08) - Issuer
3
4
7
Global Equity & Equity-related (G08) - Manager
US Debt, Equity & Equity Related (AB1) - Issuer
3
2
US Equity & Equity Related (AB2) - Issuer
US Equity & Equity Related (AB2) - Manager
4
4
US Debt, Equity & Equity Related (AB1) - Manager 4
Global Straight Debt Excluding ABS & MBS (G03) - Manager
US Capital Markets

Total combined debt and equity capital markets activity totaled US$7.9 trillion for full year 2017, anincrease of 2.4% in comparison to the capital raised last year.
Allen & Overy was the top overall advisor to issuers across debt and equity in 2017; advising issuers on263 deals totaling US$205.1 billion. Allen & Overy was also the top overall advisor to managers acrossdebt and equity in 2017; advising managers on 975 transactions totaling US$539.5 billion.
Global Straight Debt excluding securitizations totaled US$6.1 trillion in full year 2017, representing a1.5% decrease compared to 2016. The total number of deals executed in 2017 (19,817) increased by3% relative to 2016.
Global equity capital markets activity totaled US$791.5 billion in full year 2017, representing a 19.5%increase from last year. The total number of deals executed in 2017 (5,769) increased by 21.2% relativeto 2016.
Grandall Law Firm took first place among issuer advisors in global equity capital markets during fullyear 2017, with 95 issues totaling US$12.4 billion. Latham & Watkins was the leading global equity andequity-related legal advisor to managers, having advised on a total of 188 transactions with a totalvalue of US$48.9 billion in proceeds raised.
Global follow-on offerings totaled US$509.9 billion during full year 2017, an increase of 13% comparedto a year ago and the strongest anunal period for follow-on offerings since 2015. Follow-on offeringsfrom companies in the Financial sector accounted for 22% of capital raising during 2017, upsignificantly from 12% of overall follow-on offerings a year ago Financials Media and Telecom Baker & McKenzie 20
18
22 154 58,610.9
▲
18
96 16+9
9
16*
-
+0.6+0.2
-7
▲
▼13*
112810
▼-12 ▼-12Clifford Chance
0.5▲
9
170,036.81419 146
▼+25
-5
▲5
0.6 ▲
White & Case LLP
Cleary Gottlieb Steen & Hamilton 9Davis Polk & Wardwell
Mayer Brown LLP
7
▲
-0.2 ▼
0.7
▲3.1
▲052,950.9
+1.0
+0.12.21.293,308.8
+6712
2.3
+0.11.0
+0.1▲ 109,134.6 819
1.4
▲-0.4
11 -0.293,381.8 1.2
▲
106,152.2 ▼1.317,748.5 43 -
700.2
+0.2
59,441.7
1.838
41,392.8
140,733.90.3
▼0.4
+0.2-0.1
▼
+100.522▼
-0.1
00 30▲ -
1766,975.2
36 -
0.8
66 0.1
▲+0.1 ▲0.9
▲
▲+890 0 3
Allen & Overy
+296
▲0.60.6
7▲
+21▲
Sh (%)2016 Rank
5
2 4
Sullivan & Cromwell
Linklaters 3
Issuer Legal Advisor
5 172
Full Year 2017 | Global Capital Markets | Legal Advisors
GLOBAL CAPITAL MARKETS REVIEW†
Global Debt & Equity Proceeds Up 7% | Equity Proceeds Up 21% | Straight Debt Proceeds Up 3%
Share Ch.Market
-0.1
Market
263
Global Debt, Equity & Equity-related Ex FCA (G01)
▼
12*
1
2017 Rank Deals
# of
0.9
8
42
6
3
Jan 1 - Dec 31
Market# of Deals per Advisor Proceeds per Advisor (US$m)
2.61Proceeds
+0.9 ▲
Rank# of DealsShare
King & Wood Mallesons
Sidley Austin LLP220
165168
3246 2.06
Change in
+80Latham & Watkins205,067.0
0.7
▼
0.8156,813.3
▲
-7
152
▲
77,423.4234,328.3
241,402.8
3.0+38195
20.9
113
0.6 +25
0.4
0.4
+28
20,294.0
-4 ▼
▲+350.5
13*
4177,443.3+47
0.4
▲139
Morgan Lewis & Bockius
12
Grandall Law Firm
22*
17Kirkland & Ellis 16*Freshfields Bruckhaus Deringer
19Conyers Dill & Pearman
Simpson Thacher & Bartlett 0.4Anderson Mori & Tomotsune
Skadden 0.5119
11
118
15
12*11
11815
98
94
10
0.397
0.4
130
16
+230.3
hare
significantly from 12% of overall follow on offerings a year ago. Financials, Media and Telecomofferings increased a combined 95% compared to full year 2016.
The volume of global high yield corporate debt reached US$432.8 billion during full year 2017, anincrease of 40% compared to the same time last year and the strongest annual period for global highyield issuance in three years. United States high yield issuers accounted for 52% of total issuance,down from 60% a year ago. The United Kingdom, Canada and China each accounted 6% of this year’sissuance.
173,644.4 -0.5▼▼
▲
▼
-0.1
▲
▲+0.2
62
2.5
+0.8
▲
3.8
7-0.4156,782.1 2.0
Market
Jan 1 - Dec 31
Market
-15.0% ▼
Share Ch.▲
▲
Sh (%)539,473.6 6.8 +0.9
+0.5
4.3+0.5
3 +0.5▲
▲
# of Deals
▲▲1
5.1196,458.0
+0.1
+0.8 ▲▲
▲▲
+0.3
* tie
16
▲
Hunton & Williams
15
100.0
▼+0.4 ▲
Baker & McKenzie
Sullivan & Cromwell 9Cahill Gordon & Reindel
20
Linklaters
Manager Legal Advisor
% Change from Last Quarter
2
0.7194
60.7
0.7
Mayer Brown LLP
13Shearman & Sterling LLPSkadden
17
2017 Rank
2016 Rank
% Change from Same Period Last Year
Global Debt, Equity & Equity-related Ex FCA (G01)
Proceeds per Advisor (US$m)
RankProceeds
27,870
▲
22,154.5
# of Deals per Advisor
▼
18 07,900,590.5
0.3100.0
36
6.9% ▲
100.0
2.4%
▲+8+1,794
5 7
404,198.51 3.5
643975
224377
1.5 ▲411
# of Market
90 0.3
Deals
▲
+312
Change in
4
+155
+37+651.4
2.3+137
▲ 337,807.0▲ ▲
8
0.8
▲2.20.3
300,637.3
-35+30
9
9
▼
+30
Sidley Austin LLP -49
2521,460.77
207 ▼
▲
160,555.0
King & Wood Mallesons
+0.13.05238,516.7
125,967.0 12 1.6+64
▲127,900.4
0.7184+40 ▲
1.212
▲
5
8205
132.0
175 0.6
15
0.6
▲ 121,069.9
68,442.4+17
30
14137,321.7
▼
0.60.9 +0.2
18▲
▲ 1.6 +0.6
090,717.7
-
65,332.7 16 -0.30.81.5
10 1.7
+63
10
101106
0.5
1361417*
16
135
11
142
-21
0.6 +400.5 +42
0.5+32
8
Allen & Overy
Industry Total
-8.2%
Davis Polk & Wardwell 3
0.5
4
1
3 42
Clifford Chance
Cravath, Swaine & Moore
12
Latham & Watkins
6
100.0
131
0.40.4
155
7,900,590.5▲
44,866.1
Simpson Thacher & Bartlett
1415
1110*10*White & Case LLP
% Change from Same Period Last Year
+1,794
▼
https://www.thomsonone.com
175
▲+18
+52
▲
2.4%
Visit http://dmi.thomsonreuters.com to view archives and order custom League Tables
27,870Industry Total
6.9%
† Excludes Federal Credit Agency Issuance
-15.0%▲
▼% Change from Last Quarter -8.2%
Morgan Lewis & Bockius
2518
Cleary Gottlieb Steen & Hamilton
10,784.30
-0.117* 89 0.3 +6 44,552.1
Quarterly Global Legal-Advisor Debt, Equity and Equity-related
Freshfields Bruckhaus Deringer 19 19 0.6Baker & McKenzie 20 20* 73 0.3 ▲ 40 ▼
-0.1
0
1,000
2,000
3,000
4,000
5,000
6,000
7,000
8,000
0
500
1,000
1,500
2,000
2,500
1Q12 2Q 3Q 4Q
1Q13 2Q 3Q 4Q
1Q14 2Q 3Q 4Q
1Q15 2Q 3Q 4Q
1Q16 2Q 3Q 4Q
1Q17 2Q 3Q 4Q
# of
Issu
es
Pro
ceed
s (U
S$b
)
Proceeds (US$b) # of Issues
1

+2 24,093.7▲0.2▲
Hogan Lovells 20 19 44▲
15
18
1.80.9
▲
+0.3 ▲0.6 ▲
126,593.3
1.10.4
15
2121,835 +922
▲0.3 0 -
+13+0.1 ▲
▲
▲▲
▲
17
7,031,554.4
112,417.3
3.12.18
▲▲
▲
▲+0.30.6
▲
▼▲
100.0
9314
43,767.1▲▲ 74,472.8
+70
115 0.5
17
14 16 116 0.5
92
1623*
+0.165,948.3
13▲▲ 12
10 +0.1
+0.3
▲
+0.51.394,306.6
12-24+38
0.6 0.9
▲
0.612115▼
+0.2
-0.364,540.6 16
1.6
146,973.9+0.8218,854.5+0.3
511
5
Simpson Thacher & Bartlett 7 8
6
120,061.5
71,167.5
50,274.0
78,292.937,800.6
4
3
16 0.9
Shearman & Sterling LLP
1.013* 85
15
Hunton & Williams
11
17
1218Freshfields Bruckhaus Deringer
62
0.40.4 +18
+14Kirkland & Ellis 13Skadden 14 13* 81
▼ 0.2▼
King & Wood Mallesons 11* 17 95 0.4 +36Anderson Mori & Tomotsune 11*
0.5
610Clifford Chance 7
0.4
Cleary Gottlieb Steen & Hamilton 8 15 125
Mayer Brown LLP
095
Davis Polk & Wardwell 9 11
Linklaters
Sullivan & Cromwell 5 4 132Latham & Watkins 4
2Sidley Austin LLP
9
White & Case LLP 5-
▼▲
9146,486.1▲
0.6 +61262,060.6
▲
+27
100.0
156,349.1+46
+3111
0.60.7
9
130
+45+39
13*
0.80.7
7
13* 95
▲▲
0.417 0.41819
▲+0.1
40,604.2
19,476.72.1
+0.2
+0.5+0.6
0.2
+18
364,451.24.0
52
04
+0.6
1.72.2 -0.4
+0.76
3.7
25
Proceeds per Advisor (US$m)
Sh (%)▼
Market MarketMarket
1 1 ▲2.7188,238.6 Allen & OveryRank
1Share Ch.Proceeds
2016 Rank
-28,739.8
▲3
1963 +14
+40
6* 86*
2066,425.5
Linklaters
Sidley Austin LLP
+650.6
370.6
Davis Polk & Wardwell
+0.1
19
Industry Total
2
▲▼
Cleary Gottlieb Steen & Hamilton+0.1
Morgan Lewis & Bockius
131
2.8
7 ▼▲
42
131
153,916.9 51.9
+19
+1
63,160.9-0.3
0.4
1.3
70.52.2
-10
76
132,202.0
▲
▲▲
▲
98112 +29 ▲
-21
+922
▼
+12
16
Cravath, Swaine & Moore 20
0.374Morgan Lewis & Bockius
50Industry Total
-0.120*
Skadden+0.6 Milbank Tweed Hadley & McCloy
0.70.7
0.5 -0.1Mayer Brown LLP
▼
Cravath, Swaine & Moore0.7-0.5
▲▼1.1
47,123.9
20
▲90,502.3
+5 ▲+4558
1019
0.30.367
42*
100.021
0.30.2
Shearman & Sterling LLP 18
21,835
12
1.3▲
17 1018
Simpson Thacher & Bartlett 16
8▲
+14▼▲
-00.424
+0.1
194,555.5▲
1.4
+0.3
+0.296,332.8
▲
92,207.4
4
▼3.1
0.91.9 ▲6
-14
1.1# of Deals
0.8 ▲
3 -0.1-10
1630.7
1+1.1-0.3
+0.80.92
159,511.7
9
157
-16
▲0.6▲
214,971.4132,345.5
▲
232Allen & Overy 1 1 ▼
Change in # ofIssuer Legal Advisor Deals
2017 Rank
Market
GLOBAL DEBT CAPITAL MARKETS†
# of Deals per Advisor# of Deals per AdvisorMarket
Manager Legal Advisor Share
Global Straight Debt Including ABS & MBS (G02)
Proceeds per Advisor (US$m)Change in
Share2016 Rank
Jan 1 - Dec 31 Global Straight Debt Including ABS & MBS (G02)
Rank# of Deals Sh (%)2017 Rank Deals
Jan 1 - Dec 31
48,724.2
11,189.0
7.42
147,150.6282,891.3
0.3
37 2.1
+26
▲
0.8 ▲
161▼-37164
121
▲
167
▲8
11
▲
157
Clifford ChanceCahill Gordon & Reindel
▼
223 1.0
0.8 -42+31179
175
+98
+301 +1.1551
▲ 520,487.1+1402.5 5.2
923▲
+45▲▲3 1.1
4 10
Sullivan & Cromwell 10 9
6
Hunton & Williams
12*12*
King & Wood Mallesons
2.3
11
+0.6
White & Case LLP
231Latham & Watkins
2
# of
4.2
Market
5
0.8+0.3
Full Year 2017 | Global Capital Markets | Legal Advisors
100.0
Share Ch.Proceeds
7,031,554.4
20,536.627,076.8
2319* 25 3519* 17 35 0.2 -5
+0.1
▲
Sh (%)
0.3 017 0.5 +0.3 ▲0.2 +15
▼▲
0.2
145,446.6
-16.9% -17.4%
▲
▲4.4%
1482,382.8
MarketChange in
+0.1
8
-+1452
Hogan Lovells
1
10▲
3+91
362,833.52.8
+0.7
▲
4.71.1
+0.8
-
+0.1
0
2
▼▲ 1.1%
3▲
Proceeds
▲
6.0▲
▲
▲
▼
Proceeds per Advisor (US$m)
Rank8.0
0.3
4.2
282,891.3
+0.4
+1.2
2.419,476.7
+1.0
12
▲
-
▲
1.9
15
100.019,817
% Change from Same Period Last Year
Industry Total
-22.2%-1.5%
-19.6%
Visit http://dmi.thomsonreuters.com to view archives and order custom League Tables
▲ +26 65,374.3
Cravath, Swaine & Moore
-19.6%% Change from Last Quarter -22.2%▲
19
Gibson Dunn & Crutcher +22
▲24,291.9
* tie† Excludes Federal Credit Agency Issuance
3.0%
146,973.9
11*
86,344.9
▲▲
Cleary Gottlieb Steen & HamiltonDavis Polk & Wardwell
5*
7
Clifford Chance 9
8
▼
151
Sh (%)MarketShare
546
Jan 1 - Dec 31
3 7
▼
+1.2
3Rank
0227
▲
Share Ch.843
2.1
Allen & Overy▲ 2193,169.4
Sullivan & Cromwell65
144 57,613.8▲+66214,971.4
▲5*White & Case LLP+28
Anderson Mori & Tomotsune 4King & Wood Mallesons
8
23114
3.2 +1.0
▲
+0.1
▲# of Deals
Global Straight Debt Excluding ABS & MBS (G03)
# of Market2017 Rank Share Ch.Deals
▲ 249▲ 2.0 0
1.2
0.9
4.3
▲
+254
▲
213
# of Deals per Advisor
+26 4+46
255,200.8
0.8 +18-39 6
5
0.8
0.4▲0.5
0.41.6
3.6▲
+23▲ 1.4
218,854.5
96,612.6
▲
11 -
+0.3
0
7▲
+0.413
2.0▲
+0.3
-0.5+1.1
2.4
153,232.5 2.5 ▼
Manager Legal Advisor
6+0.9
Cahill Gordon & Reindel0.87
Clifford Chance
4
194
0.7
% Change from Last Quarter▼
9
1
8
120,061.5179
159
+31
129,579.2
▲▼
10
161
6
45
40
7
# of Deals-14
16+1 ▲
+4221
1.01
2017 Rank
1.1
▼
212
0.7
% Change from Last Quarter -16.9%
+630.810Sidley Austin LLP
Allen & Overy
Global Straight Debt Excluding ABS & MBS (G03)
Linklaters
Market
▲
Issuer Legal Advisor
▲
Share Proceeds
Jan 1 - Dec 31
Proceeds per Advisor (US$m)
2.9
Latham & Watkins
177,620.6
-17.4%▲ 1.1%
Market
4.4%
# of Deals per AdvisorChange in
% Change from Same Period Last Year
2016 Rank
# ofDeals
3
950.596
1060.6
132
1110.6123
+0.6
0131,441.2
11,189.0▼
2.5153,716.9
-11
▲0.5 ▲
95▼
76,470.9
0.4
+45 150,907.7
-16
0.4 ▲
0.50.513
61+6
14
16
0.413
62
131110* 23 0
▲76 -0.2 White & Case LLP
Shearman & Sterling LLPKirkland & Ellis
720.315
Skadden
0.2Shearman & Sterling LLP▲
47,288.4
17
66,917.612 14
17
10*
115,517.3
+25 119,335.8
+22▼ 14-0.5 14
▼12
▲
▼
11
86
0.7
▲Skadden
0.6+38
0.8
89,169.0 1.59
14
Cravath, Swaine & Moore+37
0.5
0.812
▲2.5
105
8*
11113
Sullivan & Cromwell133
12
3 157
0.2
16
6 157
▼
+0.2+0.1
+0.2
-
+0.3
21*
100.7130
15
2.2 ▲Sidley Austin LLP 10
1.3
5
+454 ▲
King & Wood Mallesons3.6 -0.24
▲ Davis Polk & Wardwell+0.4
1
28,739.81.1
16+18
67,675.9
▲
+12
15
11
+36
▲0.3
0.80.3 +26
▲
Cleary Gottlieb Steen & Hamilton
8*Simpson Thacher & Bartlett
▲
▲ Latham & Watkins▼
% Change from Same Period Last Year
Linklaters
5
2016 Rank
Market
1.1▲0.7 +0.1 ▲ 49Hunton & Williams
840.4
-0.1
Mayer Brown LLP 39,330.3
49 0.3 ▲
15
18*+11
0.2
+17
▲+0.790,360.3 818
1.1+0.4
▲
11*Simpson Thacher & Bartlett
73-79
Freshfields Bruckhaus Deringer
2022,992.7Freshfields Bruckhaus Deringer
15
28*
50,274.044,987.3 17
37,117.546
+84216 -9
+0.3
18Milbank Tweed Hadley & McCloy18
46170.4▼
15,233.4
-1.5%
100.0
▲0.7
% Change from Same Period Last Year
18
▲+575 6,057,830.0
▼3.0%
19,817
▼
https://www.thomsonone.com
▲
▼
6,057,830.0 100.0
▼▲
% Change from Last Quarter
-3 Mayer Brown LLPAllen & Gledhill 20 1618* 26*
4546
-
0.2 ▼100.0
0.2
+57535 0.3
▼
0.6
+0.1 ▲+20 ▲
1.5
1.0
-
Industry Total
2

+7
1.6
10,224.1
+16
Goodwin Procter LLP 4
34
3100.5
Simpson Thacher & Bartlett
▼
-
▲
+0.9-
-0.91.4
White & Case LLP
+17
Linklaters
49
1.091
+1615 58
3
12,431.7
26,883.3
Sh (%)# of Deals
+31
1
11,400.122,004.7 6
▲
▼
Cooley LLP
1.61.7
Market Change in
Global Equity & Equity-related (G08)
▲Proceeds
-1.3 1
38,583.7
Rank
Proceeds per Advisor (US$m)
Jan 1 - Dec 31
-0.5
2.6
▲
▼-0.5
6.2
Market
+0.2 ▲
7,470.1▲
0.6
521,264.6 +0.1
1.3▼▲
0.9
17,117.2
15,724.220,891.5
▲+17
2720
7*
Stikeman Elliott▼19 34
31*28 +14
791,543.8
17
▲
-0.5
▼
▼
▲
-0.2
-0.3 ▼
▼-
5 595
10,822.0
7
226,897.81.0 +3357
7
▲ 17,643.1
▼
▲▲
+2.785
Full Year 2017 | Global Capital Markets | Legal Advisors
Issuer Legal Advisor2017 Rank
2016 Rank
Proceeds per Advisor (US$m)Market
Share Ch. Manager Legal AdvisorDealsMarket# of
Proceeds2017 Rank
MarketChange in
Jan 1 - Dec 31
Share
▲1
▲3 +17
Global Equity & Equity-related (G08)
+211 +495
MarketSh (%) Share Ch.# of Deals
2.5
▼
▼
+0.7
4
Davis Polk & Wardwell
# of
Latham & Watkins2
2016 Rank
2Conyers Dill & Pearman 94 1.6
# of Deals per Advisor
145Grandall Law Firm
Latham & Watkins 3 2 89 1.5 +15-1.1
Zhong Lun Law Firm
▲+25
15* 67 1.2
3
▲King & Wood Mallesons +2Cooley LLP 4
0▲ 4
8,557.824,467.8 3.1
26
14
6 6 60 1.0 +10▲5 4 63 1.1
▲
2.8 038
5,503.3 426,032.5
0.7 00.8
AllBright Law Offices 7 17* 58 1.0 +240.1
-
9 11* 54 0.9 +161,038.6▲ 0130Handsome Attorneys at Law 8 5 55 1.0 +2
45 0.6 -0.3▲ 5,069.80.32,453.3 +0.1▲
▲Appleby 10 10 51 0.9 +12
7
Grandway Law Offices82
-0.2Baker & McKenzie 11* 7 49 0.9 +2
▲ 21,544.68,671.8+11
Skadden 11* 11* 49 0.9Goodwin Procter LLP
14,653.9
4,610.9
▲+0.1 ▲
242
1.1 +0.1▼
51
3.4+4
2.70.6
0.80.8 ▲
▲
+11
▲17* 41
9 45Vinson & Elkins LLP 15 15* 42
16
13 14 48Simpson Thacher & Bartlett 14
-0.3
+7▲
90.7Norton Rose Fulbright
Industry Total
0.74017* 35* 0.7
+1,009
0.740
Wilson Sonsini Goodrich & Rosati
+1938*
4011*
Davis Polk & Wardwell17*
▼
+12
16*
10,503.9
100.039 0.7
5,769+1 ▲
Mintz Levin Cohn Ferris Glovsky & Popeo+0.431
▲
Sullivan & Cromwell
+0.20.5
17*▲
Sullivan & Cromwell
+7
▲
-0.1
1.9
3,555.517
26,284.8
+6
3.3
0.7
1.3▲+14▲+20
3,944.1▲ 602.922,639.0 5
3
DLA Piper LLP ▲ 6517* 22*20
791,543.8
4.8+0.5
14
▲ 32,276.6+1.91.0 38,290.4▲
+23+11
0.96 4
Baker & McKenzie 9* 11
5212*8 6 51 0.9
3214*0.6
211.3
29▲0.9
7*
Skadden 9* 10
Sidley Austin LLP 14*
19,152.9▲
▼
▲0.7
49 0.9
0.50.5
0.6
0.5
46
0.6
0.8
+11
▲
10 2.2+2
5,449.3 +0.2
16
▲
▲
▼
+0.1
▲
-0.8 ▼
+0.1
▲
-1.6+0.5
6.8 ▼
▲0.9
▲1.44.9
3.3 +39
GLOBAL EQUITY CAPITAL MARKETS
2▲Share
# of Deals per Advisor
Rank
2188
Deals12
53,573.3 148,946.0
3-1.2
-▲
06
▲0.711
4.12.2 +0.4
0.825 -0.52,287.1 0.3
9,869.85,969.5
0.5
16*
+0.10.346
0.2-0.1
73
+14 2,671.0
Herbert Smith Freehills
14*
▲
▲32
-6
-732
+7Clifford ChanceFreshfields Bruckhaus Deringer
1211 12*
41
2.4
2.0
100.0
Norton Rose Fulbright
Covington & Burling
13 14
Industry Total 5,769 100.0
Allen & Overy
Blake Cassels & Graydon 9
17*
27*
+1,009 ▲ 100.0
▲
Visit http://dmi.thomsonreuters.com to view archives and order custom League Tables
* tie
19.5%▼-0.2%
https://www.thomsonone.com
21.2%% Change from Same Period Last Year % Change from Same Period Last Year% Change from Last Quarter 27.0% ▲
21.2% ▲ ▲% Change from Last Quarter 27.0% ▲ -0.2% ▼
▲ 19.5% ▲
3

▼+7 ▲ 42,856.1 16 1.4 -0.2Allen & Overy 20 17* 41 1.0
14 9% ▲
100.0
+0.3
▲
100.0 +822
23 9%
-0.1
+27
-0.3
+0.1
Full Year 2017 | Global Capital Markets | Legal Advisors
4
144.4
# of Deals Proceeds
1+32
Kirkland & Ellis
White & Case LLP
10*
Hunton & Williams
9
7
10*
16* 1316* 15
1.8
10* 1.515
Goodwin Procter LLP
▲Shearman & Sterling LLP
17* +8
Morgan Lewis & Bockius
Cravath, Swaine & Moore
Vinson & Elkins LLPCooley LLP
10*
Gibson Dunn & Crutcher12
Simpson Thacher & Bartlett
2514 31* 61
196213
8
9
5
▲ 186,052.2
2.6
3.085,159.8▲
▼+35
49,190.6
178
112
Sh (%)
Davis Polk & Wardwell
Skadden
Sullivan & Cromwell121
Sidley Austin LLP
Cleary Gottlieb Steen & Hamilton
5Mayer Brown LLP
2017 Rank
2
2016 Rank
21
Issuer Legal AdvisorLatham & Watkins
Deals
3
2.0
2.6+25
131,510.8141,971.8
6100
127
▲1.6 +181.6
+1733,892.7
2.1
43
▼
0.940
84,403.18
▲20
70 1.1
10,925.5
▲
▲
14 9%
4,266
63 1.5
42 1.0
545,673.6
-0.254,471.7
100.0
▲1.5
571.1
93,604.815 -0.5
1.3
▲
▲
3.0
+43
14Hogan Lovells
18
Industry Total
% Change from Same Period Last Year
19+3
+30
1.3
70
47
+2
+36
+71.459+14
17
1.3
▲
120.3
▲17 +10
13
9
▼0.42.3 +1.6 ▲
▲
+0.8
▼
▲Hunton & Williams
2.72.4
▲
+0.41.7
▼
+0.2
3,130,947.0
72,294.5
-1.1
▼Cravath, Swaine & Moore
-0.4 Sidley Austin LLP
+0.1
Allen & Overy▲
78
12105
4
1096 34.5111
Change in
12.8
+184.2 +63 ▲ 131,184.5
4.2
# of Deals per Advisor# of
US Debt, Equity & Equity Related (AB1) Jan 1 - Dec 31
Market
US CAPITAL MARKETS REVIEW†
Jan 1 - Dec 31
2017 Rank
2016 Rank
# of Deals per Advisor Proceeds per Advisor (US$m)Market
RankMarket
4Davis Polk & Wardwell 2 2
1
Simpson Thacher & Bartlett
Latham & Watkins 1
3
+122364 8.54.2 ▲+2.1
Change in # ofShare Ch.
+0.55.5 ▲Manager Legal Advisor
4Proceeds
▲Sh (%)Sh (%) Share Ch.RankSh (%)
MarketDeals
Proceeds per Advisor (US$m)
US Debt, Equity & Equity Related (AB1)
285 6.7
# of DealsMarket
173,108.4
Market
▲
2.7▲
▼6
▲
+0.2
28
% Change from Same Period Last Year
+37
▲
Shearman & Sterling LLP
+45189,094.7
55,997.3
4.03.8
▼
3.5
-0.3 ▼▼
▲
-2.0
▲▲
▼
18 1.1
121.2
-
▼
0
6.0▲
▼
▼
37,701.9
3.01.8▲
-0.1
-0.5
+0.24.3
10
126,276.7 7123,342.5 -0.43.9
5
▲+0.8
+28
8
3133,810.6
+14
80,433.2+0.8110,404.7
1193,660.8+9
2.6▲16132.0
▲
1.5+12 ▲1.7
+55
-0.1
11,230.315
35
1.7
74 1.772 35,170.4
52,090.3
+0.1+0.20.4
0.2
+39 ▲ +1.0+11Goodwin Procter LLP
46
Morgan Lewis & BockiusWhite & Case LLP
156416 22
17
14
1.3▲▲
0.937,677.6
+0.21.2 +0.3
▲
15
93
-8
3,130,947.04,266
1.3 ▲57
▲+822
Cooley LLP ▲
Freshfields Bruckhaus Deringer 29* 38▲
+3023* 5419
6,805.51.1
44▲56,487.1 +1.0
▼
23 9%
100.0
17
90
▲
▲
▲
10
▲
▲Mayer Brown LLP
+59
-6
18
62.6
74,007.6
63,735.0
2
2.572.3
-24▲
57
26,989.0
1.4 41,816.3
+11 ▲9,041.8
5.92.7
4Cahill Gordon & Reindel
▼
5
▼▲
-2.3
-0.4
11310 10611
1.6
10Sullivan & Cromwell
▲
▼
-0.4
7
6
Linklaters 141312
Skadden
122 +48
3
7▼
Cleary Gottlieb Steen & Hamilton119▲ 8*
12-1.8
13
3.8
8* 8* 119 2.82.9
2.8
+0.8
188133,297.4
269,747.6
+333.0 +31
▼
129
+44
3.9
▼1 8.6 -0.4▲8.1 +0.42
4.39
▲
▲
▲254,650.4
2.5
6-58117,517.0
8*
2.2
167
▲5 162
▲
1116
86
Industry Total0.5
18Milbank Tweed Hadley & McCloy
20 24+20 ▲ 14,159.8
† Excludes U.S. Federal Credit Agency Issuance
▲ 776.4 58 0.4 +0.4 ▲Mintz Levin Cohn Ferris Glovsky & Popeo 20* 66* 12 1.2 +9
1,844.6 0.8 +0.5 ▲Maples & Calder 19 50* 13 1.3 +8 ▲Sullivan & CromwellMorrison & Foerster 18 15* 15 1.5 +4
% Change from Same Period Last Year% Change from Last Quarter
▲
2.7
1,745.4 35 0.8 -0.2
162.4 -5.3 ▼
▼
4.25.4
14
▲
100.0
▼
+0.534
+213
14.9% ▲▲▲23.9%
9.5%
▼
6,273.5
3.1
-1+16
5,996.6
3,528.4
▲
7
▲
2.2
▼4.0 +3.0
▲
-9.8%
11
+6 ▲ 6,897.0+7
28.0% ▲ 10.7% ▲% Change from Last Quarter 18.2% ▲ -9.8%
26* ▲ 8,882.8 8
+71.6
16
% Change from Same Period Last Year
1.65,351.9Sullivan & Cromwell 16* 20* 16 ▲+8
Sidley Austin LLP 16* +9
1.8 -0.7+9 ▲ 5,949.0 13-614 7 18 1.9 3,930.8 17
Fenwick & West LLP 12 18* 20 2.1Gibson Dunn & Crutcher 13 26* 19 2.0
+11 ▲ 2,309.9 28+8
+12 6,208.6 12▲
6,329.5 11▲+14▲ 3,839.9 18
Davis Polk & Wardwell 10*10* 13 21WilmerHale
26* 21 2.2▲
2.22.9
Morgan Lewis & Bockius 9 14 24 2.5 3,057.4+12Simpson Thacher & Bartlett 8 5 32 3.3 ▲+3Venable LLP 7 6 33 3.4 11,286.0▲+8Wilson Sonsini Goodrich & Rosati 5* 8 35 3.6
9 3.6Vinson & Elkins LLP 4 2 41 4.2
23▲▼
7.75.1
1 +1.71.4
-2.0 ▼3.7
-0.9+2.1
▲▼
▲▲
2 1 60
Market
▼▲ 14,121.26.2 21 ▲
9.5%
US Equity & Equity Related (AB2)
# of Deals per Advisor
% Change from Last Quarter
2016 Rank
Latham & Watkins8,158.7
62Issuer Legal Advisor
2017 Rank
3
6 4.9 Latham & Watkins
Proceeds per Advisor (US$m)
14.9%▼
Share Ch.Sh (%)6.4
+8 ▲ 9+8 -3.1
4.4
+296.4
1214Mintz Levin Cohn Ferris Glovsky & Popeo
6.34.4
43
+3.54
Market
10,920.5
3
Sh (%)
+5+0.3
+1.77
5.9
▲
Cooley LLP 1
3▲
+14
12,955.0+15
413,856.0
Goodwin Procter LLP
▲35Skadden 5*
17,077.9
9,751.0Simpson Thacher & Bartlett 5+0.8 ▲
▲Covington & Burling+0.35
414Skadden 6
5.75
7 3.2
3534
31
-13.9%% Change from Same Period Last Year
# of MarketChange in
▼
55+29Cooley LLP
▲
Vinson & Elkins LLP
1.7
2.8 +1.9
+0.8
+2.1
Cravath, Swaine & Moore
Shearman & Sterling LLP
1.0 Sidley Austin LLP8 ▼
▲1.515
2.79*
-2
-1.7
18.2%
26* 12 1.21.3
28.0% ▲
974
Davis Polk & Wardwell
21 ▲9*21
6
10
2
% Change from Same Period Last Year
2016 Rank
US Equity & Equity Related (AB2)
▲ -13.9%
+0.6 ▲
+0.4
MarketRank
▼
23.9%
Jan 1 - Dec 31
Change in Share Ch.
16.9
Proceeds per Advisor (US$m)
# of DealsMarket
-0.32
Sh (%)▲
▲▲
12.33
37,278.418.6
▲
1
+6 19,268.4+1.8+1.2
10,411.4 +2.32.99
5+13 4.7
Proceeds1 169 +36
Sh (%)17.4
+2141,067.9
▲6,480.5
4▲▲ 11,921.7
8.73
2.2
5.4+10
13
2,425.1 19
▼
18▲ 1,249.6
Wilson Sonsini Goodrich & Rosati
19 30*
▲28 2.9+1327
+22.8
Cahill Gordon & Reindel
Clifford Chance
30*
Ropes & Gray
11
1718
14 16*▲
▼Fried Frank Harris Shriver & Jacobson 1515 20* 17 1.8Ropes & Gray
11*
26*Ellenoff Grossman Schole & Cyruli 9*
1.6
Visit http://dmi.thomsonreuters.com to view archives and order custom League Tables
100.0
▲
Industry Total
* tie
7,319.1▼1.918
▲
▲2.6
+0.85,733.8
▲
12
▲
1.6
0
2.7 ▼3.3
2.8 +2.3-2.7
▼
219.0 64
2,502.30.6
-29
0.1
1.1
-0.716
9*-5
16
1.9-1.9
+12 +0.5
▲
18
16*
18 ▼
1314 1.4 -5
1.9
▲
▲
11*
7
Jan 1 - Dec 31
Deals Proceeds Rank
▲+0.7
▲
▲
# of Deals Manager Legal AdvisorMarket
▲% Change from Last Quarter
2 120
# of Deals per Advisor
8
11*
9*
Goodwin Procter LLP
Freshfields Bruckhaus Deringer
5,905.6+9
▼
10.7%
▲ 782.9 38 0.41.0
Industry Total
6 3.4 +2.9
▲▲▲
+0.2
▲+0.2
▲+1.6
▲
+0.338* 10
▲
1.1 +720 211.0
https://www.thomsonone.com
▲▲ 100.0221,132.8
▲ 4,280.2
+213
2017 Rank
8
1.17,467.4
+7
# ofDeals
Proskauer Rose LLP▲
221,117.82,253.6
974 100.0
Hunton & Williams 20* 40* 12 1.2 +6 15 1.9 -0.4 ▼
4

1.3
▼
15 1.50.7
▼
+1.0 ▲
▲
▼
3.0
-0.5
+0.3▲
518
2 4.7
▲
-2.0
135,642.3
Milbank Tweed Hadley & McCloy 1.3
Share Ch.
▼
Market
+0.3
43,659.013 1.8
▼ 30,342.0▼
▲
1.0
▲
19
2.3-0.2
1.9
Proceeds per Advisor (US$m)
1.1+1.6 ▲8
▲+13
0 -
▲
-0.5
33100.0
▲+0.114,034.0
McGuireWoods LLP -2
▲
54,807.0 1219 0.915* 30
3,292 100.0 +609Industry Total
22 31 ▲Willkie Farr & Gallagher 17 19 32Hogan Lovells 18 0.9
24Allen & Overy 16 14 41 42,856.1
21,248.61.0 +8+7
Gibson Dunn & Crutcher 15 20* 43 ▲1.3
66,086.01.3 +24Morgan Lewis & Bockius 13* 11 46 1.4 +6 30,835.3
37,536.1
+0.3Cravath, Swaine & Moore 13* 13 46
17▲ 85,971.91.4 +10▲1.5 +37Hunton & Williams 11* 27* 49
Shearman & Sterling LLP 11* 9 49 ▼14 1.51.5 +1 ▲
2.3▲ 53,216.51.6 +14▼2.1 -9 67,325.1
70
10 12 53White & Case LLP7
2.18Simpson Thacher & Bartlett 9 4 68
2.1 +10Skadden 7+22 2.1
-1.3+0.2
▲ 60,151.6961,360.0▲10
Kirkland & Ellis 7 8 8190
2.5Davis Polk & Wardwell 6 5 2.7
16 1.4▼ 40,307.8+21 ▲
102Sidley Austin LLP -335 1 96 2.9
3.1 +57Cleary Gottlieb Steen & HamiltonSullivan & Cromwell 3 2 111Latham & Watkins 1186
4 10 ▲
119 +34
3.42 3.6 +55
3
Change in # ofDeals
1Sh (%) Sh (%)Rank
2016 Rank
2017 Rank
Market# of Deals per Advisor
▲
6 +0.3
58
7*
Sh (%)
1.8
Deals
21
Change in # of Deals per Advisor
Jan 1 - Dec 31
46
5
15
Market# ofManager Legal Advisor
13
2.0
Dechert
4.5
Issuer Legal Advisor
1.416 25
2.3
6104104
6772
10
+10
Jan 1 - Dec 31
# of Deals84,776.4
Proceeds
4▲▲ 117,063.3
17
Mayer Brown LLP
2,909,829.2
129,029.8
+2.4
Morgan Lewis & Bockius
Industry Total
Cahill Gordon & Reindel
-0.6
+1.3
▼
3.6
-0.7
Sidley Austin LLP
▼▲
▲
4.0▲
-2.01+0.9
▼4.43
2.9
0.9
180,700.3
2017 Rank
Market
US Straight Debt Including ABS & MBS (AB6)
-3 0.5 -0.2
6.2▲
2016 Rank
4.2
▲
5.0 +23-53
5.9▲
▲
125,978.2
+11
36,602.9
37,677.6
▲+31
15
5
4.5Sh (%)
54,383.3
9
232,469.3
1.31.9
7
4.410
235,382.1
Rank4
111,611.4
2
8
▼-
0.80.620
-0.3
-2.1
0.3100.0
10,924.8 -
-0.211
15
02.4123.21.2
+1.0+33▲ 34,837.0▼
▲ 48,410.1
93,287.0+10
2,909,829.2▲0.6
020 ▲
+609
0Fried Frank Harris Shriver & Jacobson
3,292
1928 20
100.0
▲
14 1.7
1.7
-4 +0.216
9,460.5 25
50,308.5
+0.1
+0.6
126,913.63.7
0.424
018
1317
68,511.5
▼▲1 8.1
181,627.3
+0.4
▲3 6.2
123,342.5
-0.4 ▼4.36
4.1
8.0
▼
▼▼3.8
▲
-72.2
+214.54.5
+433.2
+8 ▲2.5▲+18
975Skadden
149
8 107
14
7* 111
83
Sullivan & Cromwell12
White & Case LLP 16
Clifford Chance 18
13*
▼
17
122
+7
3.7
85
Vinson & Elkins LLP
1112
Linklaters
6
13*
9*
+32
+62
3.33.2
2.69* 11
19
Cravath, Swaine & Moore
Shearman & Sterling LLP
Mayer Brown LLPHunton & Williams
Simpson Thacher & Bartlett
Cleary Gottlieb Steen & Hamilton ▲
-0.3
2 1651
20 15* 29
4
Allen & Overy
▲+0.5
+9 ▲
147+48
▲
▼
+0.1
-0.1
3.4▲
▲
1148
3
52
+38
7
3
▼
+86
MarketMarket
US Straight Debt Including ABS & MBS (AB6)
▲Proceeds
Davis Polk & Wardwell
-
Share Ch.132,040.5
# of Deals▲
+0.9 ▲▲
Latham & Watkins
Proceeds per Advisor (US$m)
Full Year 2017 | Global Capital Markets | Legal Advisors
+0.5
-
▲ 120,280.1
107,518.8
▼
-0.5
▲
4
195
US CAPITAL MARKETS REVIEW†
▲ 9,047.5 24 0.4 0 -Vinson & Elkins LLP 19* 21* 17 0.7 +3Freshfields Bruckhaus Deringer 19* 26 0.3 0
100.0
23 17 0.7 +427 1.2
MarketRankSh (%)
Change in
-1Linklaters 20 15▲ 100.0▼
2,340 100.0 +360
https://www.thomsonone.com
Proceeds
Gibson Dunn & Crutcher 1719*57,687.2
15 0.7 -7
▼ -21.5% ▼
▼
+360100.0
18.3% ▲
▲
10.2% ▲
▼21,929.1
2,392,640.3
-7,886.3-0.918 0.9
Jan 1 - Dec 31
Proceeds per Advisor (US$m)
US Straight Debt Excluding ABS & MBS (AB7)
2017 Rank Manager Legal Advisor
2016 Rank Sh (%)
# of Market
15.3%% Change from Last Quarter
2423
40
191212
11
7.6
18
-0.9%
Market
0.9
# of Deals
% Change from Last Quarter
47
14
10
16
Change in
2.93.2
2.01.7
7677
▲
201.0
Issuer Legal Advisor
+9
+121323
+2434,191.0
-5
▲▲
1521*
▲2,343
78 3.3
4967
26 1.148,969.2▼
▲
+6
▲
+32-0.159,413.0▲ 2.5
40,823.8
1.4
▲
20
24,081.9 17
17,092.1▲
+0.8
1.0 +0.1
93,329.6
+0.3▲
+0.42.10.4
0.7▲
▲
▲11▼▲
+0.2
1.7▼
+1.0
▼+17
+14
-13.9
998,922.0+23
124.010
9.6
3
0
5126,913.6
+0.94.2
228,832.2100,246.4 8
4.14.6
6115,826.6
109,204.1▲
181,627.3
2
5.37
1315
107*
14 16
▲
95,285.8
+0.3▼
# of Deals per Advisor
Deals
▼
1.8 Cravath, Swaine & Moore12
Cleary Gottlieb Steen & Hamilton
Skadden
Clifford Chance 17
13
▲
Hunton & WilliamsWhite & Case LLP
▼
11Linklaters
2.1
3.3
Jan 1 - Dec 31
▼
4.6
▲+0.1
-0.6
Sh (%)
-0.1
▲-14.2%7.1%
Milbank Tweed Hadley & McCloy
% Change from Same Period Last Year 22.7%
Proceeds per Advisor (US$m)
▼-14.2%
1
Market
130,336.4▲ 5.5
MarketRank
US Straight Debt Excluding ABS & MBS (AB7)
-
# of Deals
# of Deals per Advisor
+0.94
6.7+23
2017 Rank
# of
7.1%
▲3 156
Sh (%)
1
▲+46
7.04.8
+22
7.99.7▲ 232,469.3
+0.2 6
32
▲4
▼▲ 6.0
▼
Sullivan & Cromwell
8 +24
7.6
7* 101 4.3 -0.4
+1.1▲
▼▲▼
-0.5
+0.3
▲▲
110
1.8
2.7-1.2
-0.6
-2.3
9
7Shearman & Sterling LLP2.3 9107104
55
4.4 +31
+13140
+7
+79Latham & Watkins 185165
4.76
2016 Rank Deals
412
% Change from Last Quarter▲▲
▲Share Ch.Proceeds
▲2 1
4 4.8
Market
114,971.4
121,255.7135,442.3
3Cahill Gordon & Reindel
5.1 Simpson Thacher & Bartlett
180,700.3
+1.0
+3.1▲▲▲
Latham & Watkins 1 4 113Sullivan & Cromwell
+43
111Davis Polk & Wardwell 3 3 89 3.8 +20
3.34 8 85 3.6
+544.84.7 +10
7 6 65
Cleary Gottlieb Steen & HamiltonSidley Austin LLP 5 5 78
43,186.42.8 +142.4
Simpson Thacher & Bartlett 6 2 66Skadden
2.8
+2Shearman & Sterling LLP 9 7 49Kirkland & Ellis 8 9* 57
10 11 46
Gibson Dunn & Crutcher 12
2.1
21,248.6▲+17
+9 85,829.9Cravath, Swaine & Moore 11 9* 45 1.9
% Change from Last Quarter -1.1% ▼% Change from Same Period Last Year 18.2%
▲+9
Industry Total
▲54,807.0
311.3 ▲
Industry Total
9,460.5
10.1%
* tie
Visit http://dmi.thomsonreuters.com to view archives and order custom League Tables
▲▲
+0.9
% Change from Same Period Last Year
† Excludes Federal Credit Agency Issuance
-21.6% ▼
▲
▼+1.6
14 1.7
▲2.3
2,391,740.18 2.4
▲
+0.4
5 3.6
▲-0.5
▲
16
15
+0.9
Share Ch.
7
1 -1.92 5.7
▼-0.4
17 1.3
▼
▲Davis Polk & Wardwell
1.4
Sidley Austin LLP
Allen & Overy
+0.5
+20
+21
271.4
18* 1.6
1.4
2.0
0.9
+1.9
Hunton & Williams 14*-0.3
22
2.8Mayer Brown LLPWillkie Farr & Gallagher
33,419.5
-0.1
▼ 65,503.2
13▲
46,389.643,659.0
1.9
9▲
323713
McGuireWoods LLP21
-9
+12
20 43
White & Case LLP
% Change from Same Period Last Year 22.7% ▲
1.21.3
1913*
Hogan Lovells
14* 17▲ 32,130.3 1.3
1810
▼ 39,780.6Allen & Overy -216* 12
-0.2-3 0.6Vinson & Elkins LLP 29+0.218
31
55,901.7
▲
▲
16* +13 ▲1.331
13* 14,034.0▼-2
32
1.8 +24
▼ 30,342.030
11
6▲ 66,086.0
1.3
▲
▲
31,766.1
+21▼
▲
15.3% ▲
▼
▲
Fried Frank Harris Shriver & Jacobson
▲14
Mayer Brown LLP▲
+0.1
5

7 1.3 - -
16 0.2 - -18 0.2 +0.1 ▲
0.2 - -
301.9259.4
1,960.5
0.2 - -14* 12* 1 0.2 0 -
Mayer Brown LLPLatham & WatkinsSimpson Thacher & Bartlett
14* - 1
14* - 1-0.1 ▼15 0 5 - -
- -21* 0.2 - -
399.0227.6227.6806 7
19 0.3
21* 0.21 0.2 -1 ▼13* - 1 0 2 - -
1 0.2 - -13* - 1 0.2 - -
Milbank Tweed Hadley & McCloyLavery de BillyGoodmansSidley Austin LLP
13* -
13* 9
0.0 -
-▲-
164.31,332.3
2.4
20 0.1 -11 0.9 +0.42114* - 1 0.2 -
---
14* - 1 0.2 -14* 12* 1 0.2 0
0.7 -
---
Cassels Brock & Blackwell LLPBurnet Duckworth & PalmerFasken Martineau DuMoulin LLP
1,960.5222.1
1,114.2
9 1.3 -21* 0.2 -10- 1 0.2 -
---
- 1 0.2 -- 1 0.2 -
13*13*13*
Hogan LovellsLatham & WatkinsMayer Brown LLP
--▼
151214
0.4 00.8 0
▲--
628.81,109.61,006.67* 2 0.4 0 0.7 -0.2
10*10*
7* 3 0.7 +17* 2 0.4 0
0.5 +0.1
--▲
GoodmansGibson Dunn & CrutcherDavis Polk & Wardwell
606.6929.9790.2
16 0.4 -12 0.6 -140.4 +1
--▲
- 2 0.4 -- 2 0.4 -
9*9*
10* 29*
Burnet Duckworth & PalmerMcGuireWoods LLPShearman & Sterling LLP
McCarthy Tetrault
9
Torys 3
Norton Rose Fulbright 5
Stikeman Elliott 6*Blake Cassels & Graydon 6*
33
2 9
4 6
8 7* 4
5* 7
7.3 +4Osler Hoskin & Harcourt LLP 2 3 19 4.2 +8
1 1 ▲ 10,885.5 2 7.2 +0.4 ▲▲ 16,438.4 1 10.7 +5.7 ▲
2.0 -3 ▼ 2,781.5 5 1.9 -1.4 ▼Davies Ward Phillips & Vineberg LLP 4 5* 8 1.8 +3 ▲ 3,043.4 4 2.1 -1.9 ▼
1.6 +2 ▲ 2,306.9 6 1.5▼ 3,420.21.3 -3
-0.2 ▼
0.9 +2 1,459.1 10 1.012* 6 1.3 +5 ▲
+0.2 ▲
3 2.20.8 +0.7 ▲
Canada All Debt (CAL1) Jan 1 - Dec 31
13-1.3 ▼
Proceeds per Advisor (C$m)
1,135.6▲
Change in
8,176.9
Market 2017 Rank
Allen & Overy
CANADA CAPITAL MARKETS REVIEW
Sh (%) Share Ch.Issuer Legal AdvisorMarket
Share Ch.Sh (%)2016 Rank
MarketRankProceedsSh (%) # of Deals
# ofDealsManager Legal Advisor
Change in # of Deals per Advisor
MarketProceeds
2▲ 5.4 +2.0 ▲# of Deals
Full Year 2017 | Global Capital Markets | Legal Advisors
# of
Jan 1 - Dec 31
2016 Rank
2017 Rank
MarketRank
# of Deals per Advisor Proceeds per Advisor (C$m)
3* 32 7.1Deals Sh (%)
Canada All Debt (CAL1)
Market
+17Blake Cassels & Graydon 1Torys 2* 3* 17 3.8 +2 ▲ 5,088.4 5 3.3 +0.7 ▲Osler Hoskin & Harcourt LLP 2* 2 17 3.8 +1 ▲ 4,031.2 6 2.7 -1.8 ▼McCarthy Tetrault 4 1 14 3.1 -10
▲▼ 7,253.6 3
19.3 +11.210 2.2 +5 711 2.4 +7
▲ 2,972.51
Norton Rose Fulbright 6 6*Davies Ward Phillips & Vineberg LLP 7*
29,189.3Borden Ladner Gervais LLP 5 8
-6* 5 1.1 0- 5
81.1 -
1.62,477.34- 5,112.7
151 463 3
Sullivan & Cromwell 7* -3.4 -+0.9+0.5
▲
-3.8 ▼▲
2.0 ▲
4.7
13
452 100 0 -148 ▼Industry Total 100 0
-
1
9*13*13*13*
Stikeman ElliottAllen & OveryDavis Polk & WardwellFreshfields Bruckhaus Deringer
--0
5--
10*
211
-
936.8294.4574.9480.6
0.40.20.20.2
-40.2 -
17 0.4 -
▼--
18 0.3 0
▼---
0.6 -1.420
Sidley Austin LLPSullivan & CromwellBennett JonesCravath, Swaine & Moore
10* -
14* 12*
2 0.4 -10* - 2 0.4 -
1 0.2 014* - 1 0.2 -
----
1,576.11,407.4
310.2182.6
8 1.0 -9 1.0 - -
--
17 0.2 019 0.1 -
- 74.0 32 0.2 - -Wildeboer Dellelce LLP 16* - 4 1.1 -
1,001.281.2
11 0.6 - -24 0.1 - -
- -13* - 1 0.2 - -
White & Case LLPWillkie Farr & Gallagher
13* - 1 0.215 0.5806.713 1 0.2Sidley Austin LLP
12.0 -10.8
▼▲▼
626.448.8
3,629.8
16 2.1 -2.634 0.2 +0.1216* 13* 4 1.1 -1
-▲▼
16* 15* 4 1.1 016* 18* 4 1.1 +2
▲-▼
Dentons Canada LLPGowling WLGPaul, Weiss
+0.334 0.3 -10 4.0 -1.0
141.483.3
1,164.8
30 0.5▼--
- 5 1.4 -15* 5 1.4 0
Miller ThomsonSkadden
15*15*15*
Gowling WLG 14 5 1.4 -1
-9.5+0.8
▼▼
512
-4.3
▼▲▼
251136
0.52.90.1▲
160.8863.7
35.6
1.41.41.1
-6-1+117
554
Burnet Duckworth & PalmerDavies Ward Phillips & Vineberg LLPBennett Jones
14*14*16*
-0.3-1.1+0.2
▼▼▲
222326
0.80.80.7
▲▼-
249.1240.5193.5
1.61.41.4
+2-40
17*12*15*
655
Davies Ward Phillips & Vineberg LLPBorden Ladner Gervais LLPFasken Martineau DuMoulin LLP
13*15*15*
2
% Change from Last Quarter ▲% Change from Same Period Last Year
144.4%
Industry Total
4
* tie% Change from Last Quarter
53.4%▼▲
5.2% ▲
291
1 9
Cassels Brock & Blackwell LLP 5 12*McCarthy Tetrault
Dorsey & Whitney LLPBlake Cassels & Graydon
▼-6.2%▼-17.1%
5,363.0+10
111,080.5Rank
8.0
-24.7%% Change from Same Period Last Year
Proceeds per Advisor (C$m)
▼
Market
% Change from Last Quarter▲4.2%
Canada Equity & Equity-related (CAL4)
+17 ▲Sh (%) Proceeds
3.5
MarketSh (%)# of Deals
▼Stikeman Elliott 3 6* 24 6.6 ▲
-15.4▲
17.97.4 1
+1
27
2,401.3 5
▲+4
7.9 -2.33,831.2 3 12.5
▼+7.0
▲Troutman Sanders LLP 6 5 14 3.8 1.4 +0.4 ▲
3.6
4
-3 ▼ 423.9 154.115
19 5.2 ▲+0.7+6 ▲ 350.1 ▲17 1.2
4.8▲ 1,443.2 8 +2.1Osler Hoskin & Harcourt LLP 7* 8 13 0Norton Rose Fulbright 7* 11 13
7-3.6 4,939.7 2
+3
▲
▲Torys 9 6* 11 3.0 -3Dentons Canada LLP 10 27* 8 2.2 +7Burnet Duckworth & Palmer 11* 2 7 1.9 ▼-15
19 1.1 +1.1▼▲
620.0 14 2.0340.1
# of Deals per Advisor
-4.0 4.2
100.0 30,454.9
Market
-5.1 ▼+6.8
▼ 1,972.316.3
# of# of Deals per Advisor
Change in
▲1,599.6
9+5
19
▼
▲▼
-17.1% ▼% Change from Last Quarter4.2%
-6.2%% Change from Same Period Last Year -24.7% ▼
Jan 1 - Dec 31
▲Share Ch.
225.5 24 0.8
Rank2016 RankManager Legal Advisor
▼ 3,661.3 4 12.2
144.4% ▲5.2%
1.5 +1.3
100.0
Visit http://dmi.thomsonreuters.com to view archives and order custom League Tables https://www.thomsonone.com
▲
% Change from Same Period Last Year -23.7%▲
Dorsey & Whitney LLP 10* +5 ▲ 466.59
+0.8 ▲+2.5
-653.0
53.4%
5.37
▲
14
911.1
▲0.8 +0.5 ▲9.9 +5.7
-
9 4.1
10
-323
▲▲ 224.0
1▼-11
▲
▲
▲ 1,305.4
3.0 +2.4▲
8
15*13*
25.62.0 +1.917+23
+11.8627.1
29
32.72.5
3.8 +6
+14+6
3
5*
7-9 ▼
9* 3.8
-
6.9 ▲
TorysGoodmans
Fasken Martineau DuMoulin LLP
9
2.5 -6
2.2
Blake Cassels & GraydonCassels Brock & Blackwell LLPBorden Ladner Gervais LLP
5*
10
13
2
149*Baker & McKenzie
6.09*
3.6
22
11 3.0-
Deals
8.0
144
25
31211
18*
Issuer Legal Advisor2017 Rank
2017 Rank
Market Change in 2016 Rank
# ofDeals
Proceeds per Advisor (C$m)
2,246.9 +0.7
Jan 1 - Dec 31Canada Equity & Equity-related (CAL4)
Sh (%)8.5Stikeman Elliott
151,463.3
▲
Market
-148
Market
Industry Total 452 100.0 ▼ 151,463.3 100.0
-23.7%
# of Deals▲
Industry Total +18365
+6Proceeds
6 ▲
2,998.9
100.030,454.9▲
+2.5
Osler Hoskin & Harcourt LLP
6.2
Skadden▲ +0.2
452 100.0 148 ▼
365 100.0 +18
▼▼
Industry Total
McCarthy Tetrault 10* 4
▲
Share Ch.
7,722.27.3
100.0
Sh (%)
8 -0.3 ▼869.1 12 2.8 -5.3
1,279.8▼12* 7* 8 2.2 -1
0.922 +0.2 ▲Troutman Sanders LLP 12* 6 8 2.2 -2 ▼ 270.3Paul, Weiss 11* 3 7 1.9 -13Bennett Jones 13* 20* 6 1.6 +4 ▲
-5.3 ▼
6
Industry Total 6,709 100.0 +61119 0.9 +0.7Hunton & Williams 19* 51* 40 ▲
▲ 100.04,359,955.5▲ 40,588.60.6 +34
+18 ▲ 63,883.7 11 1.5 +1.016 0.5 -15
3 4.3
118125
122,621.5
109,814.6
+35 ▲ 92,894.5
▼
Allen & Overy 1 1 219 -0.6 ▼3.3 -11 ▼ 185,956.2193,154.0Linklaters 2 2 191 2.9 ▲+40
▲1.9 +61 ▲ 159,511.7 4 3.7 +0.8▲1.9 +16 ▲ 93,748.4White & Case LLP 124 2.28
Cleary Gottlieb Steen & Hamilton 3 11 1254 4
Latham & Watkins 5 9 122 111,762.1Sidley Austin LLP 6 5 108
1.814 1.3 +0.1 ▲1.6 5 ▲ 54,876.9
1.6 -12 ▼ 193,746.6 1 4.4Sullivan & Cromwell 7 3 107+19 ▲Davis Polk & Wardwell 8 7 100
▼ 131,861.7151.1 +21 ▲ 54,083.9
5 3.3 -0.4 ▼1.56
145,247.2▲1.5 -3Clifford Chance 9 6 97
1.1 +11Mayer Brown LLP 10 14 75
Anderson Mori & Tomotsune 12 8 70▲ 47,152.6Freshfields Bruckhaus Deringer 11 12 71
39 0.317
0 -1.0 -8 ▼ 10,998.7▲
-1.0 ▼1.0 -3 ▼ 72,609.6Skadden 14 15 63
10 1.7Simpson Thacher & Bartlett 13 10 6812 1.4 -0.6 ▼0.9 +11 ▲ 61,637.0
41,275.5 1.0-0.30.9 +4 ▲ 48,674.0 1.1
18 0Shearman & Sterling LLP 15 13 60
0.9 9Kirkland & Ellis 16 16 59 ▲+14 ▲
0.7Gibson Dunn & Crutcher 19* 24*
+1127King & Wood Mallesons 17 17 57 0.9
▲40 0.6
Cravath, Swaine & Moore 18 18 46
-
Milbank Tweed Hadley & McCloy 18
6,709
▲11.8513,476.2 +0.9+304 1Allen & Overy 1
2.0
▲
9 +1145▲
+39
▼
+0.3
▼16
1 13.4896
134
100.0
6
47.4
0.9
▲88,464.7
0.4 +3818,172.8 17
▲ 42
22+0.2▲
Hunton & Williams
20 35+611
0.7Hogan Lovells 19 18 0.6 +4 -
▼0.523,246.6 19
-0.221▼ 20,369.3
0.9▲
38,404.027,939.0
00.5+0.2
0.9▲
160.6
77
▲▲
160.854
1.8
+0.240,884.6 15
▲ 79,818.8
▲
▲2.112-1.0
▲+0.1▼▼
-0.2
-0.4
1.357
58,483.3 1413
89,171.0
681.21.0
+0.3
8138,489.6+0.3 ▲+0.3
2.8
247,346.1
2.111
+19 ▲
▲▼
3.2
153,702.9
195,893.3-15 9
5 ▲
▼
+0.6
▲64 +0.5
3.5 -1.123
▲
▲5.72.5 -0.2
+0.4
164 0.32.4 ▲
34
11
1457
8
2.01.9
Davis Polk & Wardwell
-36
+92+46
3.1
6 159
9
2.3
322 4.4
15
-1.4 ▼
Mayer Brown LLP1713
+1.4
+0.1+0.2 ▲
Latham & Watkins
Simpson Thacher & Bartlett
Sh (%) # of Deals Proceeds Sh (%)
+0.1
1.11.23.0
+47
2017 Rank
2016 Rank
# ofProceeds per Advisor (US$m)
Issuer Legal Advisor
▲+0.1
11
Linklaters
Clifford Chance
Rank
2
2.4
Share Ch.
7 2.6 ▲
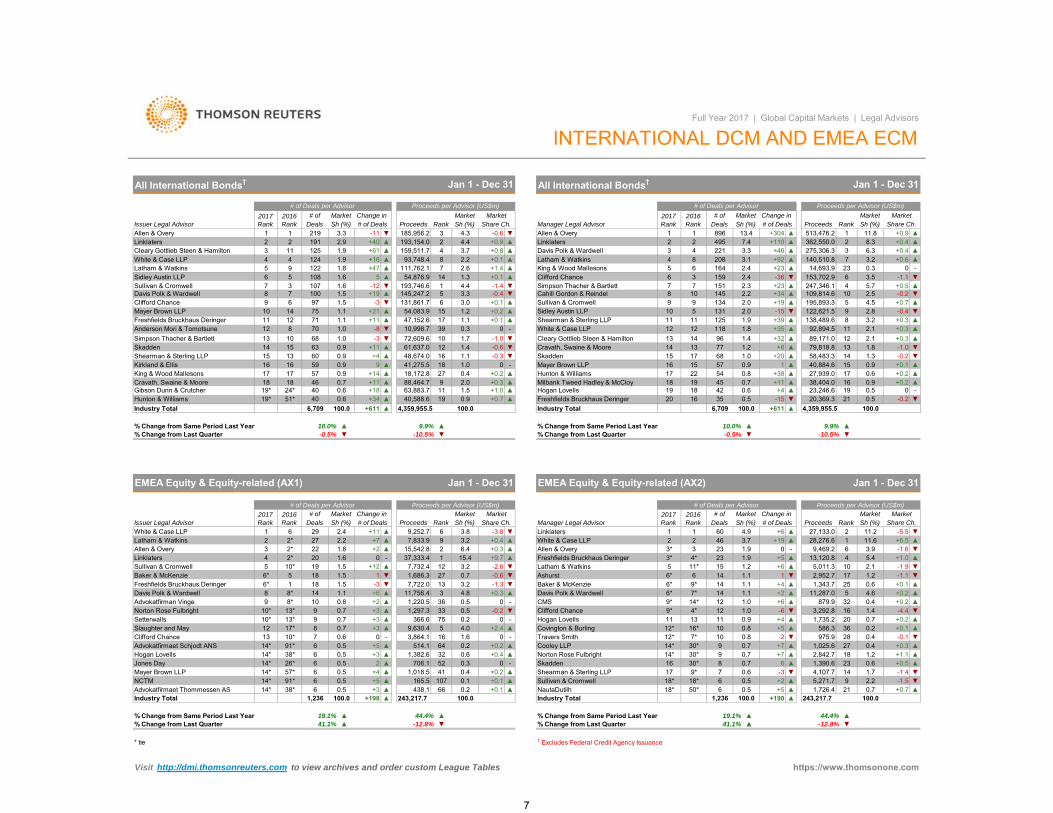
INTERNATIONAL DCM AND EMEA ECM
Jan 1 - Dec 31
# of Deals per Advisor
DealsMarket MarketMarket Change in
Full Year 2017 | Global Capital Markets | Legal Advisors
All International Bonds† Jan 1 - Dec 31 All International Bonds†
0
+0.4
▼+0.74.5
3.2
Sh (%)
7
8.3
140,510.8
362,550.0275,306.3 6.3
23.3
+23
Rank
96
10
1.8
Sh (%)
+23
Proceeds
▲
12
2.0
495
10
13 14
208221
1513
Sullivan & Cromwell 9131
12
8
1+20Skadden
White & Case LLP
17
14,693.9
+0.9 ▲ +110 ▲
# of Deals# of
Manager Legal Advisor
King & Wood Mallesons 5
19
15
Industry Total
Shearman & Sterling LLP
Cravath, Swaine & Moore 14
Freshfields Bruckhaus Deringer▲
▲
▲
+321.4 ▲+6
▲
Market
+342.2
Proceeds per Advisor (US$m)
Share Ch.Change in
# of Deals per Advisor2017 Rank
2016 Rank Deals
MarketMarket
▲▲
Cleary Gottlieb Steen & Hamilton
Sidley Austin LLP 10 5
▲Cahill Gordon & Reindel7
-
100.04,359,955.5
† Excludes Federal Credit Agency Issuance
5,271.71,726.4
9 2.2 -1.5 ▼21 0.7 +0.7 ▲
+2 ▲18* 50* 6 0.5 +5 ▲
Sullivan & CromwellNautaDutilh
18* 18* 6 0.5165.5438.1
107 0.1 +0.1 ▲66 0.2 +0.1 ▲
+5 ▲14* 38* 6 0.5 +3 ▲
NCTMAdvokatfirmaet Thommessen AS
14* 91* 6 0.5
▲▲▼14 1.7 -1.4
18 1.2 +1.123 0.6 +0.5
2,842.71,390.64,107.7
▲▲▼7 0.6 -3
9 0.7 +78 0.7 6
30*30*9*
14*1617
Norton Rose FulbrightSkaddenShearman & Sterling LLP
▲-▲0.4 +0.2
32 0.6 +0.452 0.3 0
1,382.6706.1
1,018.5+4
0.5
410.5
14* 57* 6 0.5 ▲
Hogan LovellsJones Day
+32▲▲
14*14* 26* 6
1,236 100.0
+0.1
879.9
2.1
Share Ch.
▲
0.6
▼▲
11.228,276.6
1.4
▼
11,287.0
-1.1
5
12 1.0 16
Davis Polk & Wardwell
Clifford Chance 4*20
3,292.8▼9*
+2
0.9
* tie
-12.8%
243,217.7
Hogan Lovells 11 13 11 +4
Industry Total
+0.2
% Change from Last Quarter% Change from Same Period Last Year 19.1% ▲ 44.4%
▼▲
41.1% ▲
-6
▼
-4.4 ▼▲ 1,735.2
-1.91.2
▲0.7
Allen & Overy 3
Jan 1 - Dec 31
32
▲27,133.0
2
11*
7*
17
1 6
2017 Rank
2016 RankIssuer Legal Advisor
Latham & Watkins 2 2*
EMEA Equity & Equity-related (AX1)
# of Deals per Advisor
Deals29 +11White & Case LLP
% Change from Last Quarter -0.5% ▼
14
60
6*
1
6*
2346
3
6
+0.3 ▲-1.3 ▼-0.6 ▼-2.6
▲▲
2+0.3
White & Case LLP
Freshfields Bruckhaus Deringer5
+9.7
3.8 -3.0Manager Legal Advisor
EMEA Equity & Equity-related (AX2)
1
9.9%
22 1.8 +2 ▲ 15,542.8▲ 7,833.927 2.2 +7
# of Deals2016 Rank
2.4 ▲
Change in
10.0% ▲▼
Proceeds per Advisor (US$m)# of
Sh (%)Market
Rank
# of Deals per Advisor
Proceeds9,252.7
Sh (%)Market 2017
Rank
-10.5%10.0% 9.9%
2*
-0.5%
2
12 5,011.33.27,732.415.4
1.2154*▲ 1.9
96.4
63.2
LinklatersSullivan & Cromwell
-1.6 37,333.4+12
Baker & McKenzie5 10*
56*
2*4
3.2
201918 1.5 1
▲▼
1.50
1,686.3 276* 1 ▼18 13
11,756.49 8* 10
Davis Polk & Wardwell7,722.0
8 8* 14 1.10.8Advokatfirman Vinge0.7
Freshfields Bruckhaus Deringer
+2▲+6
1.5 -3
▲ 1,297.3 33 0.5Norton Rose Fulbright 10* 13* 9366.6
12 8
+3
3 4.8▲ 1,220.5
+3+3
Industry Total 1,236
Slaughter and May ▲
Mayer Brown LLP
38* 6
4.0 +2.4-
16 1.6 0
75 00.2
-12.8%▲ 44.4%
▲ 9,630.4 5
▼
0 3,864.1514.1
% Change from Last Quarter 41.1%
100.0
▲
Latham & Watkins
% Change from Same Period Last Year 19.1%
+198 ▲ 243,217.7
0.5
Setterwalls 10* ▲
▲
1
Market
14*9*36 0
9*
-
0.7Baker & McKenzie
Allen & Overy
▼Share Ch.
+0.4
▼
% Change from Same Period Last Year
Linklaters
% Change from Last Quarter
-0.2 ▼▲
1
5.4-1.63.9
+6Rank
# of Market
23 +5
4.93.71.9 6
▲▲
+6
+6.5
+1.0
0.4 +0.2
Market
-5.5
▲
▲
12
14 1.11.11.0
6*Ashurst
3*3*
Change in
▼▲
CMS▲
2,952.7▲
▲
14 1.1 ▼+4
1
Sh (%)# of Deals
4.6 +0.2 ▲
9,469.2+19 11.6
0
▼
Deals
Jan 1 - Dec 31
MarketSh (%)
Proceeds per Advisor (US$m)
% Change from Same Period Last Year ▲
+198 ▲
-10.5%
▲ 1,343.7
-13,120.8
▼
https://www.thomsonone.comVisit http://dmi.thomsonreuters.com to view archives and order custom League Tables
100.0
25
Proceeds
+6
100.0
104
2
+0.1-0.1
27
13* 90.7
91* 610* 7 0.6
0.717*
Clifford ChanceAdvokatfirmaet Schjodt ANS 14*
130.5 +5
-▲ 64 0.2 +0.2 14*
-▲ Cooley LLP
12*12*
Covington & BurlingTravers Smith
16*7*
10 0.8 +510 0.8 -2
▲▼
▲▼
586.3975.9
36 0.228 0.4
0.4 +0.3 ▲30* 9 0.7 +7 ▲ 1,025.6
7

▲▼▼▲
46 0.2 -7.27 2.2 +1.2
9 1.9 +1.78 2.0 -1.2
+1
▲▲▼▲
4,209.24,443.1
391.24,732.2
+710 0.5 +5
2 10 0.5 -6Latham & WatkinsKing & Wood MallesonsGrandall Law Firm
28* 10 0.5
9* 10 0.5
20*13*13*13*13*
Khaitan & Co
100.0
62,412.1
0.8
100 0
1,841.8-0.8
▼
▲Maples & Calder 16 20*
180.9
-24
Squire Patton Boggs LLP
28* 0.6
5
Luthra & Luthra Law Offices +9
Sidley Austin LLPDavis Polk & Wardwell
Linklaters5.4 41
17
15
Jingtian & Gongcheng 3+0.5
Clifford Chance
1
▲
713
-0.5
+0.3
4.0 +22▼
▲ 11,873.7Rank
2
▲▲
▲ 4,921.8
Manager Legal Advisor2016 Rank Proceeds
Proceeds per Advisor (US$m)
# of Deals▼+1
MarketMarket
-3.4Sh (%)
# of Deals per Advisor
2017 Rank
MarketChange in Sh (%)
# ofShare Ch.
Change in Proceeds
Market# ofSh (%)Deals # of Deals
2017 Rank
▼
+1.43
+2 ▲
1.1
2,642.711*
0.9 141921
2.8▲ 7,659.12.3 +0.6
32
▲
-4.6
▲+0.5
18
+1.0
17
00.094 0.2 +0.1
4.322 1.33 ▲
▲2.0 +1.2
31 74.8
478*2.0168*
1.8 ▼-
9,330.5
5,069.8
1.51.3
23 ▲1.1
4,303.2
+1
▲
+91.3
23 1.1 ▲+13 2,894.7▲1.1+11
23
▼
2,298.822
2 087 ▲
9
0.9
100 0
5,491.4▲
+368
25*
Tian Yuan Law FirmJunHe LLP 17*
13* 30*11*13*Cyril Amarchand Mangaldas
Shu Jin Law Firm 13*
Appleby
Asia Equity & Equity-related (BX1)
1 92Deals
Beijing Kangda Law Firm
Deheng Law Offices
Zhong Lun Law Firm
M.V. Kini & Co
54
Far East United Law Firm
Grandall Law Firm
Handsome Attorneys at Law
Conyers Dill & Pearman
AllBright Law Offices
Jan 1 - Dec 31
Issuer Legal Advisor4.4
King & Wood Mallesons ▼
34 9
Grandway Law Offices5* 2.6
2.6-2
2.92.8
0.58.9
8
0.42.3
2.56,032.5
▲▼
1,038.6+2 ▲+0.8
+16 111
45
▲
▲▲
52
Full Year 2017 | Global Capital Markets | Legal Advisors
2.65,503.358
5*+24+10 -0.7
Market
2 8360
21.2
Sh (%)2016 Rank
553
9
5
554
7 7*
38 +15930.2
10 14*
+9810
2.3▲
+12334.4▲+4
11*11*17*
11* 2626 ▲
Khaitan & Co
17*
7*
8
+7+1 25
2.5
19,533.5
25*
183
1.1
Paul Hastings LLP
Commerce & Finance Law Offices
4,266.5
▲
27
-0.5
+2.6
+0.1
6*0.8
221.0 +13
165Norton Rose Fulbright
1+2.6
4.1+8
9,426.0407.1
-0.4
9,039.2▲
▲
23.5
4+1
▲0.89* +83
-45
▼
0.2▼1
19
▲
▲0.7
▲+1
+10
15+3
▲
+368100.0
14
11*
▲
669*
1214
11*
Asia Equity & Equity-related (BX2)
Allen & Overy 2
Rank
Proceeds per Advisor (US$m)Market
Share Ch.
0
▲
# of Deals per Advisor
ASIA PACIFIC (EX JAPAN) CAPITAL MARKETS REVIEW
Jan 1 - Dec 31
Shardul Amarchand Mangaldas & Co+5 1,989.2
8*15 +2.242* 0.7 +1314
▲▲
2,087
6*
-2.0
+4 ▲
▼
▲
12 ▲
11
11*
70.7
0.7▲
0.7+1.6▲ 1.8
+0.50.6
0.5 +0.130
-0.5
4.3
1,140.42,550.7
2.4▲-0.20.9
▲
+2.14,853.3 6
5,306.9
1.24,142.2
43,933.2
10▲▼1.9
2.2 ▲
3,086.7136.5
218,842.3Industry Total
+1.0
Industry Total
17*
1.11.1
▲
218 842 3
8 0.4 +7 61 0.1 +0.19 0.4Herbert Smith Freehills
Howse Williams Bowers1718*
▼▲
-3 ▼▲
12 1.4 -1.0
Jia Yuan Law OfficesKanga & CompanyLLinks Law Offices
17* 23* 18
20* 22 17
0.9 +520* 32* 17 0.8 +8 0.0 0
0.8 +3
▲▲▲
7,616.140.4
4,742.8 14 2.2 +0.8
▲-▲
4 3.5 +0.2214
Loeb & LoebS&R Associates
18* 20* 8 0.4 +318* 16* 8 0.4 +2 2.3 +1.5
▲▲
83.94,954.4
-▲
72 0.0 05
1,233.3303.2
25 0.3 -0.1 ▼41 0.1 -0.1 ▼
0 -18* 24* 6 0.8 +3 ▲
Anderson Mori & TomotsuneShimazaki Law Firm
18* 10* 6 0.8419,792.5
39.2% ▲
0.7
Industry Total 721 100.0
▼-0.2
5,266.5 1.3
2.5-3 ▼
13 ▲
14
▼Mayer Brown LLP 13 10 6 0.8 0 - 3,900.0
+0.3
10
155,625.3 126*
11.9
5.0▲
-1.01.3
100.0
2016 Rank
Market
Jan 1 - Dec 31
Issuer Legal Advisor1
▲
1 76
7
12*
6
69,638.0
▲
▲+1.6
+2.7
6
▲
Asia Pacific G3 Bonds (BV2)
2016 Rank
26.9%
2.5
Deals # of Deals
# of Deals per AdvisorChange in 2017
Rank
5
8
# ofSh (%)
100.0
15*
+1.0
▲721+153
21.4%
2,087
▲
▲
▲
100.0
▲
+368
13*
Allen & Gledhill
% Change from Same Period Last Year
34*
Linklaters
6
+6
▼
100.0 100.0
+0.5
5
10 1.77
39.2%
% Change from Same Period Last Year
# of
▲▲
23
111
+7
6
+5
8
Change in
54.9
2017 Rank
+1.4
1.9 +1.4Shearman & Sterling LLP
▲10*
Davis Polk & Wardwell
Latham & Watkins
91.4
Skadden 10*9
▲
▼
+0.8
▲
13
+8 3.4
11,938.5
15
10
Deals
1.41011
+0.19,946.3
4*
Share Ch.
▼
Davis Polk & Wardwell4*
LinklatersAllen & Overy
-2.9
▲Manager Legal Advisor
Market
▲
21.4%6.6%
Rank
0.2%
+35
# of Deals per Advisor
% Change from Last Quarter▲
32.9%
29,999.0
16.6Sh (%)
▲
Market
7.9
▲
5
1 ▲
3
+1.1-3.2
▼
3,940.4
+0.8
8
▲
4
2
9,531.8
Proceeds
▼
0.9▲20,851.7▲
7.2
▼11
+2.4 0.9
▲
-0.1
% Change from Same Period Last Year
* tie
▲
28*King & Wood Mallesons 12
2.518
35
12
▲14
8
7
8
Cleary Gottlieb Steen & Hamilton
▲912
Haiwen & Partners 1.413*
11*6*
10+7 ▲
21* 5
+153
+7JunHe LLP 1.1
8.0%% Change from Same Period Last Year
Visit http://dmi.thomsonreuters.com to view archives and order custom League Tables
-
9.6%
3.2
▲
26.9%% Change from Last Quarter ▲
Cleary Gottlieb Steen & Hamilton+7
1.5
1.7
Simpson Thacher & Bartlett
5
14*
▲
32.9%6.6%
Industry Total
% Change from Last Quarter0.2%
7,137.3
Sh (%)
▲
Proceeds
Asia Pacific G3 Bonds (BV1)
Market
50,069.7
Clifford Chance
Skadden
Rank
-1.7 Shearman & Sterling LLP
▼▲
23Latham & Watkins
2
Sh (%)
+15
8.9
# of Deals
▲▲+5
▲▲
3
Proceeds per Advisor (US$m)Market
Sidley Austin LLP
1
32▲1
3.1+33
35 -445.2
Clifford Chance
75
7▲
14*
10,406.7
33,158.2
▲
4.9
21* +11
1,218.9
182.8
1.9
1.3
93.2
12 1.1▲
JunHe LLP
8
▲▲
2.52.1
9
▲14,241.4
+615
Sullivan & Cromwell 5 2
1.5
30,010.3▲
17
7.2
9
2.3
+2.4
MarketShare Ch.
Jan 1 - Dec 31
▲ 21,911.0
▲2
15.4+30
-1.010.4
643▲
+1.85.1
1421,417.9 +1.3
3 +933
+3254
10.5
4.6+13 ▲3.6
Sidley Austin LLP +3542 7.5Allen & Overy 3
▼
+6
Industry Total
7,745.6+97,853.2 ▲
▲▲
8
▲2.4
▲21 ▲
▲
+0.1
King & Wood MallesonsSullivan & Cromwell
2.4+11
1.9
4 6 26 12,792.63.5
8
15*
+5-425
6,210.610,447.3
% Change from Last Quarter 9.6%8.0%
419,792.5
▲Milbank Tweed Hadley & McCloyMayer Brown LLP
+2.0
10.3-4.1
▲
43,347.7
Proceeds per Advisor (US$m)
10
https://www.thomsonone.com
218,842.3
Anderson Mori & TomotsuneFangda PartnersMilbank Tweed Hadley & McCloy
▲
67,607.2
8,462.0 2.0
16.1
+0.5
16 0.70.7 -
14* 11* 5 0.7 0
▲--
+47,076.22,849.0 -0.2
▲-▼
21 0.3 +0.211 1.7 -
17* 15* 4 0.6 +117* 15* 0.6 +1
2.2 +1.5▲▲
20 0.3 09
1,298.89,413.0
-▲
Commerce & Finance Law OfficesFreshfields Bruckhaus Deringer
13*13*16*16* 4-5
12* 8 1.1 +315* 8 1.1 +410* 7 1.0 +17 7 1.0 ▼
2,060.62,892.93,258.93,630.0
▲
0.5 +0.119 0.7 +0.418 0.8 +0.2
▲▲▼17 0.9 -0.9
8

+166 ▲ 100.0
▼ 4,125.3 -0.2
15
1012 1.2
▲▲
+1.9
-2.7-2.112.7
45,499.2
▼
Manager Legal Advisor
11*
Cleary Gottlieb Steen & Hamilton
2017 Rank
20*
6*
1
-0.6▲
+0.3▲
12
7 1.2
7
▲
-1.2
Share Ch.18.5
Jan 1 - Dec 31
▼
+0.1
Share Ch.
▼ +0.1
1.2
-0.1
JunHe LLP
Sh (%)
-1.46.1
▼
3+1.5▲
6 -3
7,353.2
Skadden▲
▼
10,406.7+2.9
▼Cleary Gottlieb Steen & Hamilton
▲13* 9
+7
8*
10*
2 13.4
4 8.7
ASIA PACIFIC (EX JAPAN) CAPITAL MARKETS REVIEW
Market
1
4 ▲
1
2016 Rank
Davis Polk & Wardwell
Linklaters
-4.9
Rank
+0.2
▲
▲+0.3
▲2,060.6
3
2 5034.4
54
1Sh (%)
2017 Rank
193.7
6
7 86 5
11*13*
13*10*
11*1.3
10
+328*
340,276.2
1.3 ▲3,258.9
7
100.0
+1
▲
Shearman & Sterling LLP8*
Proceeds
3.23.4
Sh (%)
Full Year 2017 | Global Capital Markets | Legal Advisors
Market2016 Rank
Proceeds per Advisor (US$m)
# of Deals
Asia Pac G3 Bonds ex Australasia, Central Asia (BV4)
Rank
# of Deals per AdvisorChange in
43,347.73.8▲
42 5.8
▲ 3Allen & Overy
+13
+9
▲5
19,732.3
▲6
+35
9
1.5
Allen & Gledhill
Clifford Chance
Commerce & Finance Law Offices
8
Davis Polk & Wardwell
Milbank Tweed Hadley & McCloy 8
Industry Total 598
1.0
10,447.3
7,745.6 10
18 0.6
9,000.23.1
2.32.68
14,241.411
▲
▲62,825.8
Deals▲
10
+6.0▲
▲+6
+5+51.7
9
1010
▲
▲
8,462.0▲
1.715
3.23.0 +7 ▲
11,018.418
+8
▲
2622
66,615.3
12,792.611,388.5
12.4
2.5
+43
1 +328.4
Linklaters
Latham & Watkins
74
4
▲+0.8 +0.8
MarketMarket# of# of Deals per Advisor Proceeds per Advisor (US$m)
Sidley Austin LLP
ProceedsMarket
19.6Issuer Legal Advisor Deals
MarketChange in
+33
101
# of
+31
Asia Pac G3 Bonds ex Australasia, Central Asia (BV3)
# of Deals
7021 16.9
11.7
Sh (%)
64
2.5Allen & Overy
2▼10.7
▼Clifford ChanceShearman & Sterling LLP 5 7 ▲
4 5.734 -2
8
3
2
2.823
17
+15
2.8
3.9
+28
Jan 1 - Dec 31
+72.0
175
9* 12
+6
+6
4.2 ▲
+0.9▼
8*+1.52.2
6*
2.0
▲
▲ 8*Skadden
Latham & WatkinsJunHe LLP
Simpson Thacher & Bartlett12
Haiwen & Partners11
▼2.89,531.8 7
13+2.2
▼6 3.1
0.98
-1.5▲ 3,090.4▲
▲
+11 7,137.3-5.3
▲1.7
▲
29,449.0
2.11.3
520,851.711+10 4,441.5▲
+41.0 -2
19* 77
2,722.93,315.0
▲▼6
Mayer Brown LLPFreshfields Bruckhaus Deringer
13*15
1.20.5
▲▼
17 0.8 +0.514 1.0 -0.9
Milbank Tweed Hadley & McCloyFangda PartnersKing & Wood MallesonsAnderson Mori & Tomotsune
13*13*15* +2
11* 5 0.8 +1- 4 0.7 -
3
2,849.06,867.21,298.8
231.4
-13* 4 0.7 +120* 0.1 -0.2
14 0.8 -4.210 2.0 +1.1
▼▲▼▼
18 0.4 -2.037
Deheng Law Offices 15* - 3 0.5 - - 698.6 22 0.2 - -16*16*16*16*16*
Herbert Smith FreehillsJingtian & GongchengKing & Wood MallesonsJ Sagar AssociatesPaul Hastings LLP
28* 4 0.7 +3- 4 0.7 -
23* 4 0.7 +213* 4 0.7 019* 4 0.7 +1
▲-▲-▲
1,346.64,240.83,187.71,531.11,405.9
22 0.4 -0.613 1.3 -16 0.9 +0.220 0.5 -0.821 0.4 +0.2
15*20*20*20*
▼-▲▼▲
Jia Yuan Law OfficesJingtian & GongchengSidley Austin LLPAllen & GledhillCahill Gordon & ReindelAZB & Partners
15*15*
20* 3 0.5 +220* 3 0.5 +213* 3 0.5 017* 2 0.3 0
- 2 0.3 -- 2 0 3 -
▲▲----
1,397.02,789.11,046.1
194.5482.6875 0
17 0.4 -15 0.8 -2.719 0.3 -1.038 0.1 -0.630 0.1 -21 0 3 0
-▼▼▼--
- -16 0.5 - -
-1.0 ▼24 0.2 -1.5 ▼
400.0548.8550.7
1,696.5
31 0.1
23 0.22 0.3 +1 ▲20* - 2 0.3 - -
2 0.3 -3 ▼20* - 2 0.3 - -
Mayer Brown LLPPaul Hastings LLPZhong Lun Law FirmWhite & Case LLP
20* 9*
20* 20*
100.0+166100.0 ▲
11.4%
340,276.2
▲
* tie
Industry Total
% Change from Same Period Last Year 53.1%38.4%
Visit http://dmi.thomsonreuters.com to view archives and order custom League Tables
% Change from Last Quarter% Change from Same Period Last Year 38.4%
13.4%▲▲ 11.4%
▲53.1%
598
https://www.thomsonone.com
▲13.4% ▲% Change from Last Quarter ▲
▲
2020*
AZB & PartnersFreshfields Bruckhaus Deringer
- 2 0.3 -- 2 0.3 -
--
875.0996.1
21 0.3 020 0.3 -0.4
-▼
9
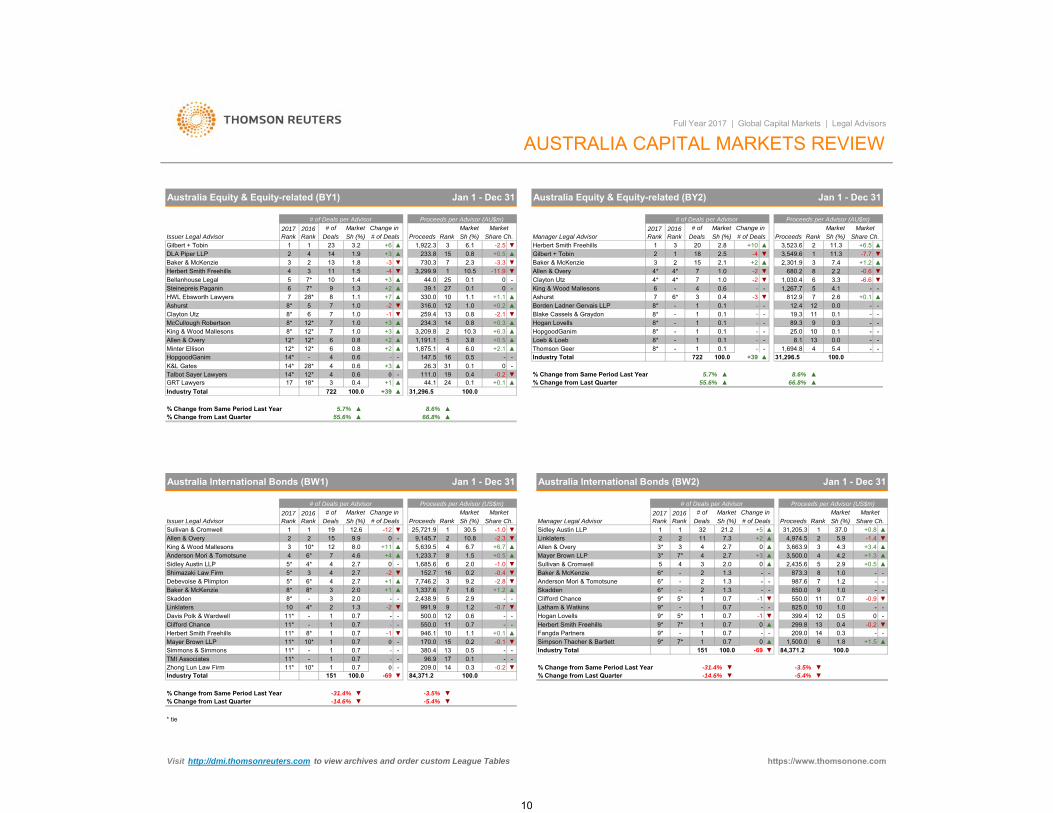
- -4 5.4 - -
- -10 0.1 - -
89.325.0
8.11,694.8
9 0.3
13 0.01 0.1 - -8* - 1 0.1 - -
1 0.1 - -8* - 1 0.1 - -
Hogan LovellsHopgoodGanimLoeb & LoebThomson Geer
8* -
8* -
12*
+6.51▼
12* 7 1.0 +312* 6 0.8 +2
7 1.0 +3 ▲
Market
5 7 1.0 -26 7 1.0 -1
Share Ch.
▲
100.0
12*12*
AshurstClayton UtzMcCullough RobertsonKing & Wood MallesonsAllen & OveryMinter Ellison
8*
% Change from Last Quarter ▲% Change from Same Period Last Year
66.8%5.7%
31,296.5
% Change from Last Quarter
+39
% Change from Same Period Last Year▲
▲55.6%
100.0
Industry Total 722 +39 100.0▲ 31,296.5
722
100.0
1.9
Sh (%)
2.5 3,549.6-4
# of Deals Sh (%)
2.1
▲▼
Market
▲ 8.6%
▲
Baker & McKenzie
1▲
2.8 ▲11.3
Australia Equity & Equity-related (BY1)
2+3▲
Full Year 2017 | Global Capital Markets | Legal Advisors
ProceedsMarket
▼
Industry Total
3
1,922.33.2Gilbert + Tobin 11 18 -7.7
Proceeds per Advisor (AU$m)
2 13 1.8144 ▲
8*
28* 8 1.1 +7
Deals
DLA Piper LLP1
# of DealsChange in
23
# of Market
+6
Market# of Deals per Advisor
Market
AUSTRALIA CAPITAL MARKETS REVIEW
Issuer Legal Advisor Sh (%)
233.8
Proceeds
15
2017 Rank
2
2016 Rank Rank
-3 ▼ 2.37
66.8% ▲
259.4
39.1
316.0
8.6%
▲
330.0
Jan 1 - Dec 31
730.3
6.10.8 +0.5
10.50.10.1
00
1.1
-3.3
0.8
55.6%5.7% ▲ ▲
3 ▼Sh (%)
▲▲
Gilbert + Tobin
8*
Herbert Smith FreehillsBellanhouse LegalSteinepreis PaganinHWL Ebsworth Lawyers
+10 3,523.6 2
Proceeds per Advisor (AU$m)
Rank
Jan 1 - Dec 31
8*
7* 9 1.3 +27* 10 1.4 +3
2016 Rank
3,299.944.0
Share Ch.
-11.9
# of Deals per Advisor
11.3
Change in
Australia Equity & Equity-related (BY2)
2017 Rank
3Deals
20Herbert Smith Freehills
# ofManager Legal Advisor
Baker & McKenzieAllen & OveryClayton Utz
15
▲
+1.1
-2.5
+0.3
1.5 -4
12* 6 0.8 +2
4567
3 11 ▼▲▲▲▼▼
1,191.11,875.1
1252710
14234.33,209.8
5
12 1.0 +0.213 0.8 -2.1 ▼
▲
4 6.0 +2.1
2 10.3 +6.33.8 +0.5
34*4*
King & Wood Mallesons 6
▼--
+24* 7 1.0 -24* 7 1.0 -2
22.2 -0.6
2,301.9680.2
1,030.4
▲▼▼
▲▼▼6 3.3 -6.6
3 7.4 +1.28
- 4 0.6 - - 1,267.7 5 4.1 - -
14*14*14*17
HopgoodGanimK&L GatesTalbot Sayer LawyersGRT Lawyers
- 4 0.6 -28* 4 0.6 +312* 4 0.6 018* 3 0.4 +1
-▲-▲
147.526.3
111.044.1
16 0.5 -31 0.1 019 0.4 -0.224 0.1 +0.1
▼▲
8*
AshurstBorden Ladner Gervais LLPBlake Cassels & Graydon
--
▲▲
▲▲
-3- 1 0.1 -
78*
- 1 0.1 -
▼--
6* 3 0.4 812.912.419.3
7 2.6 +0.112 0.0 -11 0.1 -
▲--
209.01,500.0
14 0.3 - -6 1.8 +1.5 ▲
- -9* 7* 1 0.7 0 ▲
Fangda PartnersSimpson Thacher & Bartlett
9* - 1 0.7
96.9209.0
17 0.1 - -14 0.3 -0.2 ▼
- -11* 10* 1 0.7 0 -
TMI AssociatesZhong Lun Law Firm
11* - 1 0.7
4
7-4
+12.7
100.0
-69 ▼ 100.0
6
▼
https://www.thomsonone.com
152.7 -0.4-2.8
1.6
151
▼-31.4%
7,746.2
▼
Industry Total
▲
% Change from Last Quarter
9.2
84,371.2
-5.4%
+1.2▲
* tie
% Change from Last Quarter -14.6%
Debevoise & Plimpton
▼
100.0
% Change from Same Period Last Year
Industry Total
5* 6*Shimazaki Law Firm 5* 3 4 ▼Sidley Austin LLP
8.04.6 +4
▲
2.72.7 0
1,233.7-1.0
▲+2
▲▲
1.5▲
-2
5.9
MarketMarket
4.3
▲-1.4
2.0
-3.5%
3
1,685.6
-3.5%
% Change from Same Period Last Year
0.216 ▼▼
+3.4 ▲▲
84,371.2
3,663.9
Deals2016 Rank
# of
4
Sidley Austin LLP 1-2.3 ▼
1Share Ch. # of Deals
▼Issuer Legal Advisor # of Deals
1
% Change from Last Quarter
Sh (%)
▲
Jan 1 - Dec 31
Sh (%)Change in
Proceeds per Advisor (US$m)
ProceedsMarket
237.0
Market
Jan 1 - Dec 31
RankProceeds31,205.3
▼4,974.52.7
Share Ch.1
3
32Manager Legal Advisor
11
2017 Rank
-14.6%
22
Australia International Bonds (BW2)
# of Deals per Advisor# of Change in 2016
Rank Deals▲
Proceeds per Advisor (US$m)
3
+0.8Sh (%)Sh (%)
7.3+5
0
21.2
-31.4%
▲
▼▼ -5.4%
▼
▼▼
151 100.0 -69 ▼
▲Clifford ChanceLatham & Watkins
3*5,639.5 +6.7+0.5
King & Wood MallesonsAllen & Overy
8Allen & Overy+11Linklaters
▲6.7
Sullivan & Cromwell
1232
10* 4
1
66.8% ▲
9,145.7
Rank
0 29.930.5
-
55.6%
10.815
Market
Anderson Mori & Tomotsune 44*6*
5*
12
19
Australia International Bonds (BW1)
▼12.6
# of Deals per Advisor2017 Rank
Market
-12 -1.025,721.9
Visit http://dmi.thomsonreuters.com to view archives and order custom League Tables
Baker & McKenzie 8* 8* 3 2.0 +1 71,337.6
2.0 0Baker & McKenzieAnderson Mori & TomotsuneSkadden - 2 1.3
Mayer Brown LLPSullivan & Cromwell
3*5
3,500.02,435.6
▲▲
7* 4 2.7 +34 3
4 4.2 +1.35 2.9 +0.5
SkaddenLinklaters
8* - 3 2.010 4* 2 1.3
--2
-▼
2,438.9991.9
5 2.9 -9 1.2 -0.7
-▼
Hogan Lovells
6* - 2 1.36* - 2 1.36*9* 5* 1 0.79* - 1 0.79* 5* 1 0.7
---
-1-
-1
---▼-▼
873.3987.6850.0550.0825.0399.4
8 1.07 1.29 1.0
11 0.710 1.012 0.5
---
-0.9-0
---▼--11* - 1 0.7 -
11*11*11*11*
Davis Polk & WardwellClifford ChanceHerbert Smith FreehillsMayer Brown LLPSimmons & Simmons
- 1 0.7 -8* 1 0.7 -1
10* 1 0.7 0- 1 0.7 -
--▼--
500.0550.0946.1170.0380.4
+0.115 0.2 -0.1
12 0.6 -11 0.7 -
13 0.5 -
--▲▼-
10 1.1Herbert Smith Freehills 9* 7* 1 0.7 0 ▲ 299.8 13 0.4 -0.2 ▼
10

* tie* tie
12* 0.1 +0.1 ▲
9 1.0 +0.7 ▲12* 0.1 +0.1 ▲
0.5 - -
405.119.319.3
0.5 0 -11* - 1 0.5 - -
SkaddenSoga Law OfficeNorton Rose Fulbright
11* 8* 1
11* - 1
0.90.1
+0.9+0.1
▲▲
--
364.819.3
912
11
0.50.5
--
SkaddenH M chan & Co
8*8*
--
0.8 -2.3
▲▲▼
426.23,645.7
313.2
8 1.1 +1.14 9.2 +8.0116* 2 0.9 0
-▲-
- 3 1.4 -8* 3 1.4 +2
7*7*10
Morrison & FoersterNishimura & AsahiMorgan Lewis & Bockius
▲▼▲▲▼
Sullivan & Cromwell
11 0.5 -0.2
10 0.5 +0.57 1.5 +1.5-
13,540.4581.1189.3607.9
▲▲--
1 0.5 0
1 0.5 --
Morgan Lewis & Bockius
6 5* 5 2.37 7*
8* 7*
Baker & McKenzie
3Sullivan & CromwellMorrison & Foerster - 3 1.4 -
2 34.2 +32.8
Davis Polk & Wardwell
+3+2
8* -3 1.4
1 0.58*
0.8 +0.8 ▲12.7 -18.3 ▼
334.0 10-3* 3* 5 2.3 +1 ▲ 5,028.8
Linklaters 7*
35.4 +27.7 ▲▼
▲ 13,997.3 2Simpson Thacher & Bartlett 3* 5 5 2.3 +2+1 ▲ 1,497.0 6 3.8 -13.5Davis Polk & Wardwell 3* 3* 5 2.3▲
14.2 -4.9 ▼Simpson Thacher & Bartlett 5 5* 6 2.7 +4-3 ▼ 7,234.5 3Nagashima Ohno & Tsunematsu 4 1 13 5.9
5,624.8
181.0-
8 1.5
Jan 1 - Dec 31
Industry Total 222 100.0 +51
Samurai Bonds (JL5)
% Change from Same Period Last Year 29.8%66.7% ▲% Change from Last Quarter ▲29.8%
-52.2%
100.0222 100.0 ▲
81.8%▼
Anderson Mori & Tomotsune 3+3.6
39,559.0
% Change from Last Quarter
2 27.4 -1.1
Mori Hamada & Matsumoto+104 16
15 14,457.6▲
Jan 1 - Dec 31Japan Common Stock (JL2)
Nishimura & Asahi
# of Deals per AdvisorMarket# of
Issuer Legal AdvisorMarket
Full Year 2017 | Global Capital Markets | Legal Advisors
Japan Common Stock (JL1) Jan 1 - Dec 31
JAPAN CAPITAL MARKETS REVIEW
2016 Rank Proceeds
Proceeds per Advisor (US$m)Change in
-52.2%
39,559.0
18.3 +0.2▲
5
▲ 100.0
4
-2.6
RankSh (%) Sh (%)
3 +1.56.3+4+4 ▲14
Anderson Mori & Tomotsune1 2,922.3Share Ch.Deals # of Deals
7.2
2017 Rank
Market 2017 Rank
# of Deals per Advisor
Deals Sh (%)Change in # of Market
3.21
6* 7▼▲
16 -2 1
Jan 1 - Dec 31Samurai Bonds (JL6)
2.37
▼
5
-10.4
4.9 -1.8▼
7.2
-1 ▼1,925.4
16,185.1Share Ch.
+1.36
▲1,199.3Nagashima Ohno & Tsunematsu▲
▲
Proceeds per Advisor (US$m)MarketMarket
▼ 1Manager Legal Advisor Sh (%)Proceeds
40.93.01
▲ 81.8%
# of Deals
Mori Hamada & Matsumoto 3*
▲
28.2
Industry Total
Rank
+51
+52
2016 Rank
▲
56.8
▼66.7% ▲
% Change from Same Period Last Year
3,244.836.6 ▲
* tie
* tie
Visit http://dmi.thomsonreuters.com to view archives and order custom League Tables https://www.thomsonone.com
10 1.4 +1.4 ▲
8.0 +8.0 ▲8 4.9 +4.9 ▲
- 1 2.4 - -
987.6607.3177.1Uryu & Itoga
6* - 2 4.9 -9* - 1 2.4
Baker & McKenzieCleary Gottlieb Steen & Hamilton
-- -
4- 873.3 6 7.0 +7.0 ▲King & Wood Mallesons 6* - 2 4.9 -
1.9 -10.4 ▼▼ 231.4 9Shimazaki Law Firm 5 3* 3
3,368.8 2 27.1 +3.5 ▲10.5 -12.8
▼▼
Nishimura & Asahi▲▼
948.01,304.9
53Clifford Chance
3 3* 6 14.6 +14 2 5 12.2
White & Case LLP 7.6 -1.6 1 9▲ 2,648.7 ▲21.3 +7.2
41 100.0 +3
+3
-17.3 -2
9*
Rank
5* 7
▲ 100.0
17.1
1000.0% ▲
▲% Change from Same Period Last Year 7.9%
▲ 3081.3%
Nagashima Ohno & Tsunematsu
▲
12,425.2
4.9%
2
Industry Total
# of Deals
▲
100.0
18.6▼
MarketMarket
% Change from Same Period Last Year 7.9% ▲
Industry Total
Share Ch.
% Change from Last Quarter
29.0
12,425.2▲
Sh (%)
4.9%
▲ 2,304.4 3+5▲ 1
Rank
4
24.422.0 -2 ▼
100.0
% Change from Last Quarter 1000.0%
3Baker & McKenzie 4
▲ 3081.3%
Proceeds per Advisor (US$m)
▲
+14.3Proceeds
41
2Anderson Mori & Tomotsune 1
Proceeds
+3
-2.1Sh (%)
12
Change in Deals Sh (%)
# of Deals per AdvisorMarket
50.1# of Deals
▲
2016 Rank
2017 Rank
+3
# of Deals per Advisor Proceeds per Advisor (US$m)2017 Rank
2016 Rank
# of MarketMarket
Anderson Mori & Tomotsune 1Sh (%) Manager Legal AdvisorShare Ch.
1 21Issuer Legal Advisor
51.2 +3
# of Market Change in
2Deals
29.3▲
6,220.1 3,603.73 10Nagashima Ohno & Tsunematsu +9.52
▲1
Linklaters 6* - 2 4.9 - - 855.5 7 6.9 +6.9 ▲
7.0 +6.3 ▲4* 2 4.9 +1 ▲ 873.3
11

-
-
-
-
-
-Asia-PacificCarina Causon-Israel
Salvatore ReresTel: +1 646 223 8455E-mail: [email protected]
Europe
E-mail: [email protected]: +44 (0) 207 542 4376
United States
Ian Willmott
If you would like to participate in the submission process, receive quarterly press releases, or have questions about our full league table criteria please contact:
High Yield is defined as securities with an S&P rating equal to or less than BB+ and a Moody’s rating equal to or less than Ba1. Securitiesnot rated by both agencies are assumed high yield with the exception of certain issuers (e.g., Federal Credit Agencies). Certificates ofDeposit, General Term Notes, and Split-junk rated securities (i.e., securities with an investment grade rating from one agency and a highyield rating from the other) are excluded Non-convertible preferred stock transactions are included
Standard league table exclusions: best efforts offerings, non-underwritten transactions and direct placements, rights offerings, transactionsthat mature or are callable/putable less than 360 days after settlement, CD's , Deposit Notes & Bank Notes, Federal Credit Agencytransactions (US Only), exchange offers, and offerings by closed-end funds/trusts.
Initial Public Offering league tables include only transactions where the common stock has never before traded publicly in any market.
Where applicable, all league tables include Rule 144a transactions. All league tables exclude pure private placements. Medium TermNotes programs are excluded but Medium Term Note takedowns are included. MTN takedowns from continuously offered retail programsare tracked but are not eligible for league table credit.
Ranking Criteria Summary
Time periods for league tables will be based upon pricing/launch date.
All current data and previous year's data is as of 9:00am EST on January 12, 2018. Full credit is given to the issuer’s legal counsel andmanager’s legal counsel. All rankings exclude General Counsel. Rankings are accumulated based on number of transactions per advisor.Rankings based on proceeds are available on product.
Tel: +632 459 1566E-mail: [email protected]
J
Full Year 2017 | Global Capital Markets | Legal Advisors
-
-
-
-
Tel: +1 416 687 7577
Tel: +813 6441 1120
CanadaGavin Penny
Aki Sato
E-mail: [email protected]
Mortgage and asset-backed securities collateralizing first lien mortgages, home improvement loans, manufactured housing contracts, homeequity lines of credit and second liens are subject to the classification rules detailed in the Rules for Categorizing Mortgage and Asset-backed Securities letter dated January 1, 2006.
yield rating from the other) are excluded. Non-convertible preferred stock transactions are included.
Canadian equity league tables include best efforts deals, private placements in public entities (PIPES), preferred shares and retailstructured products, self-funded issuance. League Tables are denominated in Canadian dollars.
Japan
https://www.thomsonone.com
Canadian debt league tables include government debt consisting of federal, provincial, and municipal issues, corporate bonds, maples andself-funded issuance. League tables are denominated in Canadian dollars.
Federal Credit Agency issuance is excluded in all regional and global league table rankings.
E-mail: [email protected]
While Thomson Reuters has used reasonable endeavors to ensure that the information provided in this document is accurate and up to date as at the time of issue, neither Thomson Reuters nor its third partycontent providers shall be liable for any errors, inaccuracies or delays in the information, nor for any actions taken in reliance thereon, nor does it endorse any views or opinions of any third party contentprovider. Thomson Reuters disclaims all warranties, express or implied, as to the accuracy or completeness of any of the content provided, or as to the fitness of the content for any purpose to the extentpermitted by law. The content herein is not appropriate for the purposes of making a decision to carry out a transaction or trade and does not provide any form of advice (investment, tax, legal) amounting toinvestment advice, nor make any recommendations or solicitations regarding particular financial instruments, investments or products, including the buying or selling of securities. Thomson Reuters has notundertaken any liability or obligation relating to the purchase or sale of securities for or by any person in connection with this document.
© 2018 Thomson Reuters. All rights reserved.
Thomson Reuters and the Thomson Reuters logo are registered trademarks and trademarks of Thomson Reuters and its affiliated companies. Any third party name or mark herein belongs to the relevant thirdparty.
12
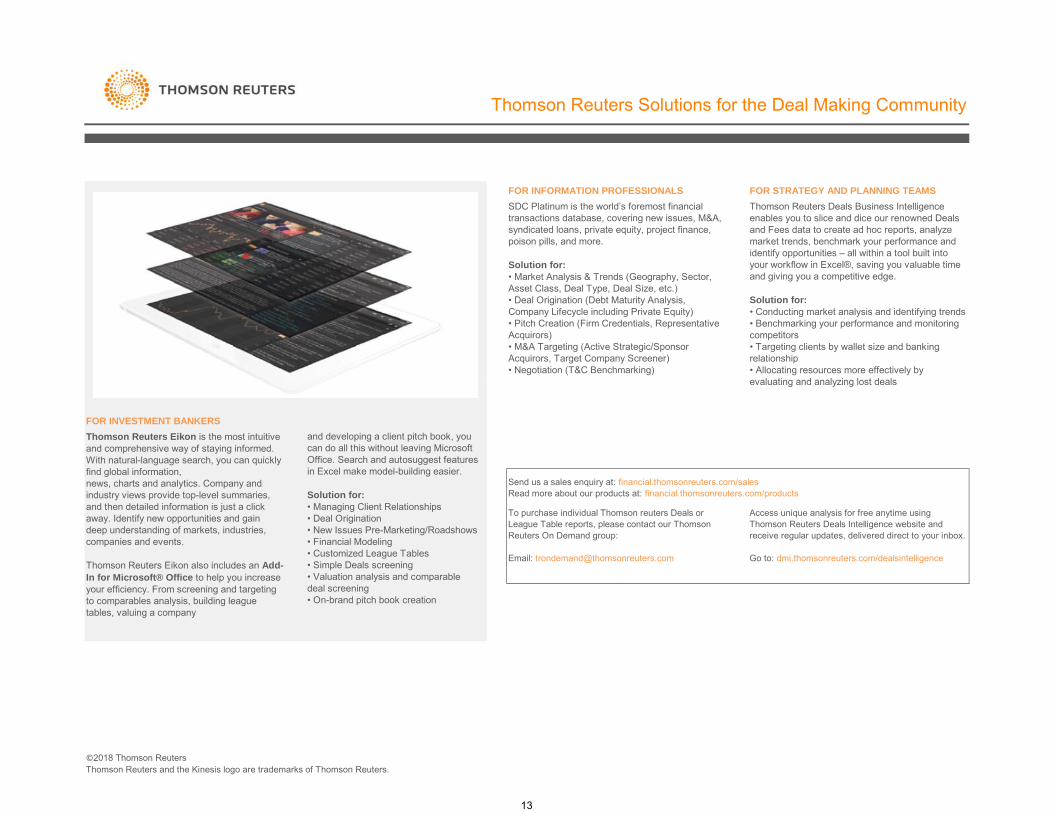
Thomson Reuters Solutions for the Deal Making Community
FOR STRATEGY AND PLANNING TEAMSFOR INFORMATION PROFESSIONALSSDC Platinum is the world’s foremost financial transactions database, covering new issues, M&A, syndicated loans, private equity, project finance, poison pills, and more.
Solution for:• Market Analysis & Trends (Geography, Sector,Asset Class, Deal Type, Deal Size, etc.)• Deal Origination (Debt Maturity Analysis,Company Lifecycle including Private Equity)• Pitch Creation (Firm Credentials, Representative Acquirors)• M&A Targeting (Active Strategic/Sponsor Acquirors, Target Company Screener)• Negotiation (T&C Benchmarking)
Thomson Reuters Deals Business Intelligence enables you to slice and dice our renowned Deals and Fees data to create ad hoc reports, analyze market trends, benchmark your performance and identify opportunities – all within a tool built into your workflow in Excel®, saving you valuable time and giving you a competitive edge.
Solution for:• Conducting market analysis and identifying trends• Benchmarking your performance and monitoring competitors• Targeting clients by wallet size and banking relationship• Allocating resources more effectively by evaluating and analyzing lost deals
FOR INVESTMENT BANKERS
evaluating and analyzing lost deals
Send us a sales enquiry at: financial.thomsonreuters.com/salesRead more about our products at: financial.thomsonreuters.com/products
To purchase individual Thomson reuters Deals or League Table reports, please contact our Thomson Reuters On Demand group:
Email: [email protected]
Access unique analysis for free anytime using Thomson Reuters Deals Intelligence website and receive regular updates, delivered direct to your inbox.
Go to: dmi.thomsonreuters.com/dealsintelligence
Thomson Reuters Eikon is the most intuitive and comprehensive way of staying informed. With natural-language search, you can quickly find global information,news, charts and analytics. Company and industry views provide top-level summaries, and then detailed information is just a click away. Identify new opportunities and gain deep understanding of markets, industries, companies and events.
Thomson Reuters Eikon also includes an Add-In for Microsoft® Office to help you increase your efficiency. From screening and targeting to comparables analysis, building league tables, valuing a company
and developing a client pitch book, you can do all this without leaving Microsoft Office. Search and autosuggest features in Excel make model-building easier.
Solution for:• Managing Client Relationships• Deal Origination• New Issues Pre-Marketing/Roadshows• Financial Modeling• Customized League Tables• Simple Deals screening• Valuation analysis and comparabledeal screening• On-brand pitch book creation
©2018 Thomson ReutersThomson Reuters and the Kinesis logo are trademarks of Thomson Reuters.
13