3Q09 VEng mod - Orange S.A. · CAPEX optimization and adaptation plans are generating the expected...
22
press release Paris, 29 October 2009 sustained commercial activity and controlled expenditure enabled the Group to compensate for the unfavourable impact of economic conditions and the increased impact of regulatory measures • continued growth of the cus continued growth of the cus continued growth of the cus continued growth of the customer base, tomer base, tomer base, tomer base, up 6.6% year up 6.6% year up 6.6% year up 6.6% year on year on year on year on year to 189.1 million customers at 30 September 2009, with an increase of 9.5% in the number of mobile customers to 128.8 million at 30 September 2009 • revenues of revenues of revenues of revenues of 38.1 billion euros for the first nine months of 2009, 38.1 billion euros for the first nine months of 2009, 38.1 billion euros for the first nine months of 2009, 38.1 billion euros for the first nine months of 2009, an increase of 0.4% excluding the impact of regulatory measures (down 1.6% on a comparable basis) growth of 1.9% in France, excluding regulatory measures, including a 5.8% increase in mobile services Africa and the Middle East rose 5.2% on a comparable basis other operations continue to be affected by the deterioration in the economic environment, particularly Romania, where revenues declined 18.1%, and the Enterprise segment, down 2.8% on a comparable basis in the third quarter of 2009, revenues decreased 0.9%, excluding regulatory measures (down 3.7% on a comparable basis), which was still 1.5 points better than the average GDP growth across the Group’s footprint, estimated at -2.4% in the third quarter • EBITDA margin EBITDA margin EBITDA margin EBITDA margin was was was was 35.1% 35.1% 35.1% 35.1%, down 0.7 points compared with the first nine months of 2008 actions undertaken at the beginning of the year limited the impact of regulatory measures on the operating margin EBITDA margin of 35.9% in the third quarter: the decline compared with the previous year was limited to -0.7 points (the same as in the first half), despite the greater impact of regulatory measures in the third quarter • the ratio of C he ratio of C he ratio of C he ratio of CAPEX APEX APEX APEX to revenues to revenues to revenues to revenues wa wa wa was 9.8% s 9.8% s 9.8% s 9.8%, down 1.8 points compared with the first nine months of 2008 (11.6%) CAPEX optimization and adaptation plans are generating the expected savings, particularly in 2G networks, IT and fixed-line legacy services CAPEX to prepare for the future and targeted at innovation and services were maintained • confirmation of confirmation of confirmation of confirmation of the objective the objective the objective the objective of of of of stable stable stable stable organic cash flow organic cash flow organic cash flow organic cash flow at the 2008 level of 8.0 billion euros continuation of cost savings programmes and implementation of the Orange 2012 transformation plan should limit the decline in EBITDA margin compared with 2008 the CAPEX rate should be less than 12% for the year as a whole
-
Upload
hoanghuong -
Category
Documents
-
view
217 -
download
1
Transcript of 3Q09 VEng mod - Orange S.A. · CAPEX optimization and adaptation plans are generating the expected...

press release Paris, 29 October 2009
sustained commercial activity and controlled expenditure enabled the
Group to compensate for the unfavourable impact of economic conditions
and the increased impact of regulatory measures
• continued growth of the cuscontinued growth of the cuscontinued growth of the cuscontinued growth of the customer base, tomer base, tomer base, tomer base, up 6.6% year up 6.6% year up 6.6% year up 6.6% year on yearon yearon yearon year to 189.1 million customers at 30
September 2009, with an increase of 9.5% in the number of mobile customers to 128.8 million at 30
September 2009
• revenues ofrevenues ofrevenues ofrevenues of 38.1 billion euros for the first nine months of 2009, 38.1 billion euros for the first nine months of 2009, 38.1 billion euros for the first nine months of 2009, 38.1 billion euros for the first nine months of 2009, an increase of 0.4% excluding the
impact of regulatory measures (down 1.6% on a comparable basis)
� growth of 1.9% in France, excluding regulatory measures, including a 5.8% increase in mobile
services
� Africa and the Middle East rose 5.2% on a comparable basis
� other operations continue to be affected by the deterioration in the economic environment,
particularly Romania, where revenues declined 18.1%, and the Enterprise segment, down 2.8% on
a comparable basis
� in the third quarter of 2009, revenues decreased 0.9%, excluding regulatory measures (down 3.7%
on a comparable basis), which was still 1.5 points better than the average GDP growth across the
Group’s footprint, estimated at -2.4% in the third quarter
• EBITDA margin EBITDA margin EBITDA margin EBITDA margin waswaswaswas 35.1% 35.1% 35.1% 35.1%, down 0.7 points compared with the first nine months of 2008
� actions undertaken at the beginning of the year limited the impact of regulatory measures on the
operating margin
� EBITDA margin of 35.9% in the third quarter: the decline compared with the previous year was
limited to -0.7 points (the same as in the first half), despite the greater impact of regulatory
measures in the third quarter
• tttthe ratio of Che ratio of Che ratio of Che ratio of CAPEXAPEXAPEXAPEX to revenues to revenues to revenues to revenues wawawawas 9.8%s 9.8%s 9.8%s 9.8%, down 1.8 points compared with the first nine months of
2008 (11.6%) � CAPEX optimization and adaptation plans are generating the expected savings, particularly in 2G
networks, IT and fixed-line legacy services
� CAPEX to prepare for the future and targeted at innovation and services were maintained
• confirmation of confirmation of confirmation of confirmation of the objective the objective the objective the objective of of of of stable stable stable stable organic cash flow organic cash flow organic cash flow organic cash flow at the 2008 level of 8.0 billion euros
� continuation of cost savings programmes and implementation of the Orange 2012 transformation
plan should limit the decline in EBITDA margin compared with 2008
� the CAPEX rate should be less than 12% for the year as a whole

2
The Board of Directors of France Telecom SA met on 28 October 2009 and examined the Group's
financial statements to 30 September 2009.
Commenting on the results for the first nine months of 2009, France TFrance TFrance TFrance Teeeelllleeeecom Chairman and Chief com Chairman and Chief com Chairman and Chief com Chairman and Chief
Executive Officer Didier LoExecutive Officer Didier LoExecutive Officer Didier LoExecutive Officer Didier Lombardmbardmbardmbard stated: “Against a backdrop of difficult economic, social and regulatory
conditions, the Group is proving its ability to maintain its performance. This is to the credit of all of our
employees who work every day towards the Group’s success, and who I personally want to thank.
Today, the France Telecom group has almost 190 million customers around the world, and the number of
people who use our mobile services is up by nearly 10% in one year. Despite mixed conditions across
our footprint, our performance in France was notable. Revenues from France were up 0.6% and the take-
up of new services continues to spread, particularly those related to 3G and our digital TV offers.
Our ability to weather current conditions rests on the Group's financial strength, on our ability to innovate
and on the commitment of our teams around the world. In France, we are currently in negotiations with
trade unions on a new social contract that will be proposed to employees and will form an integral part of
the Group’s development in this country. All of these factors should enable us to rapidly take advantage
of any improvement in the economic environment.”
3
key figureskey figureskey figureskey figures****
• data at 30 September
in millions of euros
at 30
September
2009
at 30
September
2008 comparable
basis
at 30
September
2008 historical
basis
change
comparable
basis (in %)
change
historical
basis (in %)
of which:
change in
exchange rates (in %)
of which:
change in
consolidated group
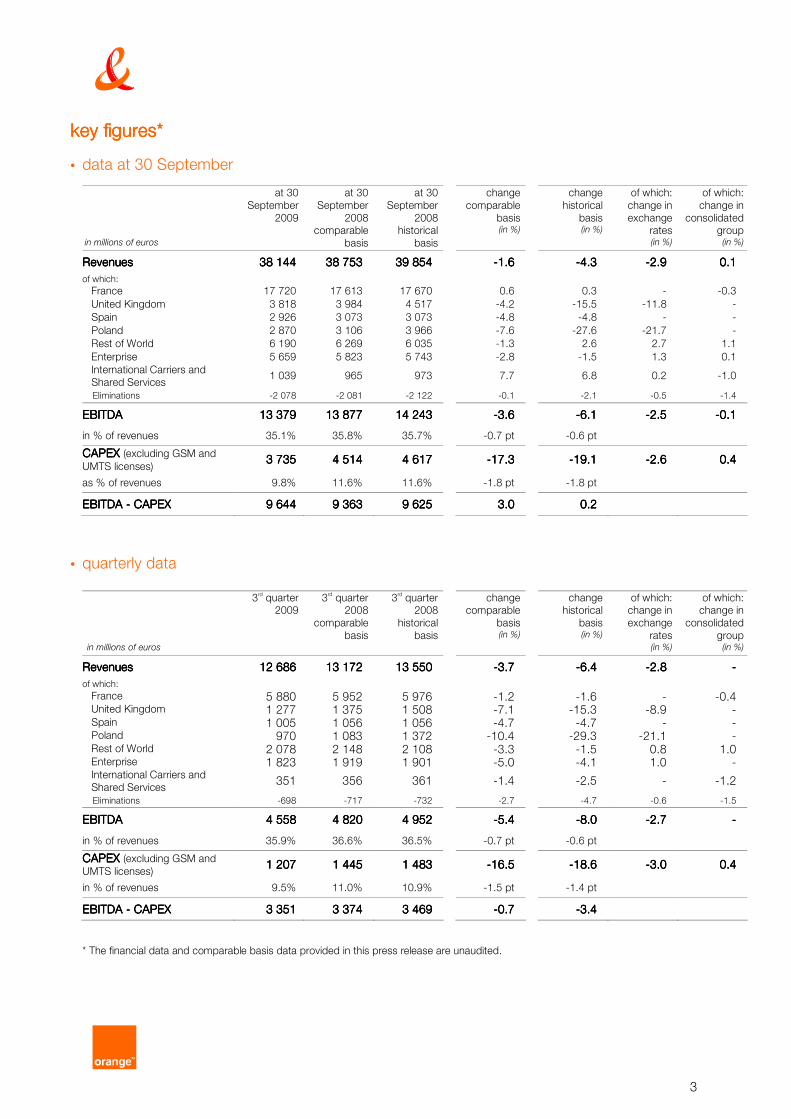
(in %) RevenuesRevenuesRevenuesRevenues 38 14438 14438 14438 144 38 75338 75338 75338 753 39 85439 85439 85439 854 ----1.61.61.61.6 ----4.34.34.34.3 ----2.92.92.92.9 0.10.10.10.1
of which:
France 17 720 17 613 17 670 0.6 0.3 - -0.3
United Kingdom 3 818 3 984 4 517 -4.2 -15.5 -11.8 -
Spain 2 926 3 073 3 073 -4.8 -4.8 - -
Poland 2 870 3 106 3 966 -7.6 -27.6 -21.7 -
Rest of World 6 190 6 269 6 035 -1.3 2.6 2.7 1.1
Enterprise 5 659 5 823 5 743 -2.8 -1.5 1.3 0.1
International Carriers and
Shared Services 1 039 965 973
7.7
6.8 0.2 -1.0
Eliminations -2 078 -2 081 -2 122 -0.1 -2.1 -0.5 -1.4
EBITDAEBITDAEBITDAEBITDA 13 37913 37913 37913 379 13 87713 87713 87713 877 14 24314 24314 24314 243 ----3.63.63.63.6 ----6.16.16.16.1 ----2.52.52.52.5 ----0.10.10.10.1
in % of revenues 35.1% 35.8% 35.7% -0.7 pt -0.6 pt
CAPEX CAPEX CAPEX CAPEX (excluding GSM and
UMTS licenses) 3 7353 7353 7353 735 4 5144 5144 5144 514 4 6174 6174 6174 617
----17.317.317.317.3
----19.119.119.119.1 ----2.62.62.62.6 0.40.40.40.4
as % of revenues 9.8% 11.6% 11.6% -1.8 pt -1.8 pt
EBITDA EBITDA EBITDA EBITDA ---- C C C CAPEXAPEXAPEXAPEX 9 6449 6449 6449 644 9 3639 3639 3639 363 9 6259 6259 6259 625 3.03.03.03.0 0.20.20.20.2
• quarterly data
in millions of euros
3rd quarter
2009 3
rd quarter
2008
comparable
basis
3rd quarter
2008
historical
basis
change comparable
basis (in %)
change historical
basis (in %)
of which: change in
exchange
rates (in %)
of which: change in
consolidated
group (in %)
RevenuesRevenuesRevenuesRevenues 12 68612 68612 68612 686 13 17213 17213 17213 172 13 55013 55013 55013 550 ----3.73.73.73.7 ----6.46.46.46.4 ----2.82.82.82.8 ----
of which:
France 5 880 5 952 5 976 -1.2 -1.6 - -0.4 United Kingdom 1 277 1 375 1 508 -7.1 -15.3 -8.9 - Spain 1 005 1 056 1 056 -4.7 -4.7 - - Poland 970 1 083 1 372 -10.4 -29.3 -21.1 - Rest of World 2 078 2 148 2 108 -3.3 -1.5 0.8 1.0 Enterprise 1 823 1 919 1 901 -5.0 -4.1 1.0 - International Carriers and
Shared Services 351 356 361 -1.4 -2.5 - -1.2
Eliminations -698 -717 -732 -2.7 -4.7 -0.6 -1.5
EBITDAEBITDAEBITDAEBITDA 4 5584 5584 5584 558 4 8204 8204 8204 820 4 9524 9524 9524 952 ----5.45.45.45.4 ----8.08.08.08.0 ----2.72.72.72.7 ----
in % of revenues 35.9% 36.6% 36.5% -0.7 pt -0.6 pt
CAPEX CAPEX CAPEX CAPEX (excluding GSM and
UMTS licenses) 1 2071 2071 2071 207 1 4451 4451 4451 445 1 4831 4831 4831 483
----16.516.516.516.5
----18.618.618.618.6 ----3.03.03.03.0 0.40.40.40.4
in % of revenues 9.5% 11.0% 10.9% -1.5 pt -1.4 pt
EBITDA EBITDA EBITDA EBITDA ---- CAPEXCAPEXCAPEXCAPEX 3 3513 3513 3513 351 3 3743 3743 3743 374 3 4693 4693 4693 469 ----0.70.70.70.7 ----3.43.43.43.4
* The financial data and comparable basis data provided in this press release are unaudited.

4
comments on key Group figures comments on key Group figures comments on key Group figures comments on key Group figures
revenues First nine months of 2009
Group revenues were 38.144 billion euros, down 4.3% on an historical basis. Of this decline, slightly
more than two-thirds – or 2.9 points – was attributable to the unfavourable impact of exchange rates of
which -2.1 points related to the Polish zloty, -1.3 points to the pound sterling and +0.5 points to other
currencies. At the same time, changes in the scope of consolidation generated a favourable impact of
+0.1 points.
On a comparable basis, Group revenues declined 1.6%, reflecting the impact of regulatory measures
(estimated at -2.0 points or -752 million euros). Excluding that impact, Group revenues recorded
underlying growth of 0.4%.
3rd quarter 2009
Group revenues were 12.686 billion euros, a decline of 6.4% on an historical basis compared with the
third quarter of 2008, of which -2.8 points was related to the unfavourable impact of exchange rates
(zloty and pound sterling).
The 3.7% decrease in quarterly revenues on a comparable basis primarily reflected the impact of
regulatory measures, which increased strongly in the third quarter of 2009 (-369 million euros). Excluding
regulatory measures, third quarter revenue was down 0.9%, after rising 0.4% in the second quarter and
1.7% in the first quarter.
The percentage change in revenues in the third quarter of 2009, excluding regulatory measures, was 1.5
points higher than that of the Gross Domestic Product for the geographic areas in which the Group operates
(this economic indicator was down 2.4% in the third quarter, after falling 2.7% in the second quarter and 2.7%
in the first quarter).
In France, third-quarter business continued to be robust with mobile services reporting quarterly growth
(excluding regulatory measures) of 4.1% compared with the third quarter of 2008 due to an increase in
contract customers and the continued growth of data services. Africa and the Middle East also continued
to be dynamic, with quarterly revenues up 4.0%.
Conversely, revenues from Romania continued to be impacted by the difficult economic environment and strong
competitive pressures. Similarly, the Enterprise segment reported a larger decline in revenues in the third quarter,
due in particular to changes in the global market for business services.
customer base growth
The Group had 189.1 million customers at 30 September 2009 (excluding MVNOs), up 6.6% year on
year with 11.7 million additional customers (net of contract terminations) compared to 30 September
2008. Growth in the number of mobile customers continued rising to 128.8 million customers at 30
September 2009 (excluding MVNOs), a year-on-year increase of 9.5% or 11.2 million additional
customers (net of contract terminations). The third quarter continued to be very active, with 3.3 million
additional mobile customers. At the same time, the MVNO customer base in Europe rose 35.5% to 3.8
million customers at 30 September 2009 (including 2.1 million customers in France), compared with 2.8
million customers a year earlier (including 1.7 million customers in France).
Growth in ADSL broadband services1 continued to be strong with 13.4 million customers at 30
September 2009, an increase of 6.0% year on year. Broadband usage was also up sharply (at 30
September 2009) with:
� 2.9 million digital TV subscribers (IPTV and satellite), a 67% increase year on year;
� 7.3 million Voice over IP subscribers, an increase of 22% year on year; and
� 8.5 million Livebox subscribers, an increase of 14% year on year.
1 Including FTTH, satellite and WiMax accesses

5
EBITDA
First nine months of 2009
EBITDA2 was 13.379 billion euros, down 6.1% on an historical basis; of this, -2.5 points was due to the
unfavourable impact of exchange ranges, while -0.1 points related to the impact of changes in the scope
of consolidation. On a comparable basis, the year-on-year decrease was 3.6% (-498 million euros).
The EBITDA margin3 was 35.1%, compared with 35.8% for the first nine months of 2008 on a comparable
basis (35.7% on an historical basis), a decline of 0.7 points between the two periods (-0.6 points on an
historical basis). The decline compared to the first nine months of 2008 mainly reflects:
� the impact of regulatory measures (-310 million euros);
� the increase in content purchases (-180 million euros);
� the impact of the establishment of the telecommunications tax beginning 7 March 2009 (French audiovisual
law) and, since 1 June 2008, of the Chatel law (total impact of -129 million euros).
Excluding these, the EBITDA margin increased 0.9 points, due in particular to reduced overheads and
control of commercial expenses.
The ratios of operating expenses to revenues on a comparable basis were as follows:
� the ratio for labour expenses was 17.3%, an increase of 0.4 points compared with the first nine months
of 2008;
� the ratio of service fees and inter-operator costs was 14.8%, up 0.1 points. The decline in call
termination rates (a positive impact of 442 million euros) offset the growth in unlimited offers for mobile
services;
� the ratio of other network expenses and IT expenses rose 0.1 points to 5.5%;
� the ratio of combined property, overhead and other expenses4 remained stable at 11.9%. The cost
savings programmes and the reduction in restructuring costs offset the impact of the establishment of
the telecommunications tax and the Chatel law;
� before commercial expenses and content purchases, the EBITDA margin was 50.4%, a decline of 0.6
points on a comparable basis compared with the first nine months of 2008 (-0.8 points on an historical
basis);
� the ratio of commercial expenses and content purchases of 15.4% was up 0.2 points on a comparable
basis. The growth in content purchases, in particular for the sports TV and Orange cinema series
channels introduced in the second half of 2008, was largely offset by the drop in commercial expenses
linked to the business slowdown.
3rd quarter 2009
EBITDA fell 8.0% on an historical basis to 4.558 billion euros, which includes a decline of 2.7 points due to the
unfavourable impact of exchange rates. On a comparable basis, EBITDA declined 5.4% compared with the
third quarter of 2008 (-262 million euros).
The EBITDA margin was down 0.7 points to 35.9%, compared with 36.6% in the third quarter of 2008 on
a comparable basis, largely due to:
� the impact of regulatory measures (-155 million euros);
� the telecommunications tax and the Chatel law (-48 million euros); and
� the increase in content purchases (-24 million euros).
Excluding these, the EBITDA margin was up 1.1 points due to reduced overhead expenses and control of
commercial expenses.
2 EBITDA: Earnings Before Interest, Taxes, Depreciation and Amortization. See glossary 3 EBITDA as a proportion of revenues 4 See glossary

6
capital expenditure on tangible and intangible assets (CAPEX)
First nine months of 2009
Capital expenditure on tangible and intangible assets (CAPEX) was 3.735 billion euros, down 19.1% on
an historical basis, including the impact of exchange rates (-2.6 points) and changes in the scope of
consolidation (+0.4 points), in particular related to the consolidation of Telkom Kenya.
CAPEX was 17.3% lower on a comparable basis. Excluding the transaction to purchase operating
premises in France in the first half of 2008 for 163 million euros, CAPEX was down 14.2%. CAPEX
represented 9.8% of revenues, compared with 11.6% for the first nine months of 2008, a decline of 1.8
points between the two periods (-1.4 points excluding the transaction to purchase operating premises in
France in 2008).
The decrease in CAPEX reflects the slowdown in investment related to 2G and 3G mobile network
capacity expansions and slower growth in fixed broadband services in the European countries, which
partially offset increased investment in:
� new operations (network deployment in Kenya, Uganda and Armenia);
� undersea cables (Africa and the Indian Ocean).
Investment plans instituted in 2009 aim to preserve investment in:
� innovation and new services (particularly platforms for the aggregation of content);
� the Group’s transformation programmes (including information and billing systems).
3rd quarter 2009
CAPEX was 1.207 billion euros, down 16.5% on a comparable basis (-18.6% on an historical basis). The
CAPEX rate to revenues was 9.5%, down 1.5 points in relation to the third quarter of 2008. This is in line
with the CAPEX rate reported for the first half of 2009 (9.9%).
outlook for 2009outlook for 2009outlook for 2009outlook for 2009
The Group confirms its objective of stable cash flow at the 2008 level, which was 8 billion euros (excluding
the acquisition of new frequencies for mobile services, which is however unlikely before the end of the year).
In order to continue to limit erosion of the EBITDA margin and deal with the more stringent regulatory
measures, the action plans put in place in the first quarter of 2009 will continue to be pursued, in particular: � plans aimed at reducing expenses; and
� the implementation of the Orange 2012 programmes.
CAPEX as a proportion of revenues should remain at less than 12% for 2009 as a whole. Capital
expenditure will be higher in the fourth quarter due to normal seasonality.
In addition, the Group confirms its financial objectives for the medium term:
� continuation of the debt reduction policy with a net debt to EBITDA ratio of less than 2 to preserve the
Group’s independence and flexibility;
� continuation of the distribution policy announced in March 2009 (distribution rate of 45% or more of
organic cash flow while retaining a strong liquidity position);
� continuation of a policy of selective acquisitions, focusing primarily on markets with high growth
potential and monitoring certain markets in which we are present for consolidation opportunities

7
review by business segment review by business segment review by business segment review by business segment
France France France France
First nine months of 2009
Year-to-date revenues in France were 17.720 billion euros, an increase of 0.6% on a comparable basis and
of 0.3% on an historical basis compared with the first nine months of 2008. Excluding regulatory measures,
growth was 1.9%.
Revenues from Personal Communication Services increased 3.9% on a comparable basis to 8.053 billion
euros and 3.8% on an historical basis. Excluding regulatory measures, growth was 5.8%. The number of contract customers continued to climb, with 17.56 million customers at 30 September
2009 following a 6.1% increase year on year. Contract customers made up 69.3% of the customer base
at that date, compared with 67.5% a year earlier. The total number of customers, excluding MVNOs, was
25.354 million at 30 September 2009, a 3.4% increase year on year. Data services revenues from both SMS revenues and from non-messaging services showed a sharp
increase of 24.6%. Data services represented 25.1% of network revenues, a 4.2-point gain compared
with the first nine months of 2008. There were 6.855 million 3G mobile broadband services customers at
30 September 2008, a 64% increase year-on-year. The MVNO customer base was up 25.4% year on year to 2.114 million at 30 September 2009,
compared with 1.686 million at 30 September 2008.
Revenues from Home Communication Services decreased 1.4% on a comparable basis to 10.569 billion
euros (down 1.8% on an historical basis). Excluding regulatory measures, the downturn was only 0.2%.
Revenues from Internet services continued to rise steadily, increasing 16.6% due to growth in ADSL
broadband services. The number of consumer ADSL accesses rose to 8.763 million at 30 September
2009, a year-on-year increase of 8.5%. At the same time, ARPU5 was up 5.4%, driven by the growth of
Net offers (naked ADSL4 offers), of Voice over IP and of digital TV.
The number of digital TV customers (broadband and satellite TV) rose 59% year on year to 2.547 million
at 30 September 2009. The Orange sport and Orange cinema series channels had a total of 596,000
subscribers at 30 September 2009, compared with 130,000 at 31 December 2008. There were 5.8 million
downloads from paid video on demand (VoD) services over the first nine months of 2009, an increase of 68%.
Revenues from traditional telephone services (subscriptions and traditional telephone communications) fell 10.3%,
reflecting the 9.1% year-on-year decrease of traditional consumer telephone subscriptions (18,368 million at 30
September 2009).
Revenues from Carrier Services remained stable: the impact of wholesale rate reductions (ADSL access,
unbundling, wholesale telephone lines and interconnections) was offset by 25% year-on-year growth in
the number of lines sold to other carriers6, 8.260 million lines at 30 September 2009).
Other revenues from Home Communication Services fell 15.8%, reflecting in particular the impact from
the establishment of the Chatel law, the discontinuation of the e-commerce business, and the decline in
revenues from public telephone booths.
5 See glossary 6 Fully unbundled telephone lines, naked ADSL access and wholesale telephone subscriptions

8
3rd quarter 2009
In France, revenues fell 1.2% on a comparable basis to 5.880 billion euros (-1.6% on an historical basis).
However, excluding the impact of regulatory measures, third quarter revenues in France increased 1.1%, after
rising 1.7% in the second quarter.
Revenues from Personal Communication Services continued to rise, increasing 4.1% in the third quarter
excluding regulatory measures, after rising 5.8% in the second quarter. Customer contracts continued to
climb steadily, with 233,000 new customers (net of contract terminations) in the third quarter. Similarly,
growth for data services remains strong, with a 21.8% increase in the quarter.
Home Communication Services continued to be stable compared with the previous year, excluding
regulatory measures. The 13.7% revenue growth from Internet services and the 4.8% increase in Carrier
Services, excluding regulatory measures, were offset by the 10.2% decline in traditional telephone
services and by the 13.5% downturn in other revenues from Home Communication Services.
UUUUnited Kingdomnited Kingdomnited Kingdomnited Kingdom
First nine months of 2009
In the United Kingdom, revenues were 3.818 billion euros on an historical basis, down 15.5% of which 11.8%
was due to the unfavourable impact of the pound sterling exchange rate. On a comparable basis, revenues fell
4.2% compared with the first nine months of 2008.
Revenues from Personal Communication Services fell 3.6% on a comparable basis to 3.683 billion euros,
almost entirely related to the impact of regulatory measures. Excluding these, revenues fell 0.2%.
The number of contract customers continued to rise steadily to 6.637 million at 30 September 2009, a
year-on-year increase of 10.4%. Contract customers made up 41.2% of the customer base at 30
September 2009, a 3.2-point gain in one year. The total number of customers excluding MVNOs rose
1.9% year on year to 16.110 million at 30 September 2009.
Data services represented 25.2% of network revenues, a 2.1-point gain compared with the first nine
months of 2008. There were 4.717 million 3G mobile broadband services customers at 30 September
2009, a 64% increase year on year.
Revenues from Home Communication Services declined 15.6% on a comparable basis to 180 million
euros (down 25.5% on an historical basis) due to the 12.2% decrease in the ADSL broadband customer
base to 899,000 customers at 30 September 2009. In addition, narrowband Internet revenues decreased
as the number of narrowband Internet customers (69,000 at 30 September 2009), more than halved in
one year.
3rd quarter 2009
Revenues from the United Kingdom decreased to 1.277 billion euros on an historical basis, down 15.3% of
which 8.9% related to the unfavourable impact of the pound sterling exchange rate. On a comparable basis,
the decline was 7.1% and largely reflected the impact of regulatory measures.
Revenues from Personal Communication Services decreased 6.8% on a comparable basis. Excluding the
impact of regulatory measures, third quarter revenues fell 1.9%, after rising 0.1% in the second quarter. The
decline in revenues from voice services was partially offset by: � the steady growth of data services, which represented 25.5% of network revenues in the third quarter
of 2009;
� the recovery in the customer base in the third quarter, with 257,000 new customers (net of contract
terminations), including 194,000 contract customers.
Revenues from Home Communication Services decreased 12.7% on a comparable basis, reflecting the
declining ADSL customer base.

9
SpainSpainSpainSpain
First nine months of 2009
Revenues from Spain fell 4.8% on both an historical and a comparable basis to 2.926 billion euros.
Excluding the impact of regulatory measures, revenues fell 0.7%.
Revenues from Personal Communication Services fell 5.2% on a comparable and on an historical basis to
2.417 billion euros. Excluding the impact of regulatory measures, the decrease is only 0.2% for the first
nine months of 2009. The decline in voice services is almost entirely offset by: � 3.5% year-on-year growth in the number of customers, excluding MVNOs, which was 11.620 million at
30 September 2009. The percentage of customer contracts was stable at 56.1% at 30 September
2009; � 21.8% revenue growth in data services for the first nine months of 2009. The number of 3G mobile
broadband customers was up 63% in one year to 4.604 million customers at 30 September 2009.
Revenues from Home Communication Services were 509 million euros, down 3.0% on an historical basis and
on a comparable basis, due to the downturn in business services and carrier services. At the same time, ADSL
broadband revenues decreased 0.2%. The 7.1% year-on-year decline in the number of ADSL customers,
to 1.091 million at 30 September 2009, was very largely offset by the favourable impact on revenues of:
� the growing share of ADSL subscriptions sold unbundled from the telephone line, which was 81% at
30 September 2009, compared with 72% a year earlier; and
� the 65% growth year on year in the number of customers for Voice over IP services, which reached
408,000 customers at 30 September 2009, and which allowed the telephone line to be unbundled.
3rd quarter 2009
Revenues from Spain fell 4.7% on both an historical basis and a comparable basis to 1.005 billion euros.
The decrease was 2.0% excluding regulatory measures.
Excluding regulatory measures, revenues from Personal Communication Services rose 1.0% in the third
quarter, after decreasing 0.5% in the second quarter, in an economic environment that continues to be
particularly difficult. The customer base expanded in the third quarter with 151,000 new customers (net of
terminations) due to the success of new prepaid offers. Data services continued to register strong growth
with an increase of 1.8% over the quarter.
At the same time, revenues in Home Communication Services fell 5.9% on both an historical basis and a
comparable basis, in particular with the loss of 44,000 customers from the ADSL customer base in the third
quarter (after losing 30,000 customers in the second quarter).
PolandPolandPolandPoland
First nine months of 2009
In Poland, revenues were 2.870 billion euros. The 27.6% decrease on an historical basis largely reflected
the unfavourable impact of the zloty exchange rate, estimated at -21.7%. Revenues from Poland fell 7.6%
on a comparable basis. Excluding the impact of regulatory measures, revenues fell 2.4% on a comparable
basis.
Revenues from Personal Communication Services were 1.340 billion euros, an 8.7% decrease on a
comparable basis, reflecting the impact of regulatory measures. Revenues fell 0.3% excluding those
measures.
The number of contract customers was 6.508 million at 30 September 2009, an increase of 9.1% year on
year, representing 47.4% of the total customer base, a 5.0-point improvement compared to 30 September
2008. The total number of customers, excluding MVNOs, was 13.736 million at 30 September 2009, a
2.3% decline.

10
At the same time, the average usage per user increased 22.4% to 131 minutes per month as lower
prices, particularly for new unlimited offers for contract customers, fuelled growth in usage.
Revenues from Home Communication Services fell 3.9% to 1.711 billion euros on a comparable basis.
Excluding the impact of regulatory measures, revenues decreased only 1.2%. The decline in conventional
telephone services linked to the migration towards mobiles was largely offset by the growth in business data
services and the development of ADSL broadband services.
The number of broadband subscribers increased 5.5% year on year to 2.278 million. In addition,
customer migration to higher speed services and an increase in usage generated ARPU6 growth. In
particular, the number of digital TV customers (ADSL and satellite) more than doubled in nine months to
283,000 at 30 September 2009, compared with 113,000 at 31 December 2008.
3rd quarter 2009
Revenues in Poland fell 29.3% on an historical basis to 970 million euros, 21.1% of which is attributable
to the unfavourable impact of the zloty exchange rate.
On a comparable basis, the decrease was 10.4% and mostly reflected the impact of regulatory measures.
Excluding that impact, third quarter revenues declined 4.3%, after falling 1.8% in the second quarter. The
third quarter downturn was linked to: � Personal Communication Services: the continued erosion of revenues from voice usage as the decline in
communication rates was only partially offset by the rise in volume, and
� Home Communication Services: the slowing of growth in carrier services in the third quarter.
Rest of WorldRest of WorldRest of WorldRest of World
First nine months of 2009
Rest of World revenues were 6.190 billion euros. The 2.6% growth on an historical basis included the 2.7%
favourable impact of exchange rates and 1.1% increase from changes in the scope of consolidation, mostly
linked to the acquisition of Telkom Kenya.
On a comparable basis, revenues fell 1.3% compared with the first nine months of 2008. Excluding
regulatory measures, they rose 0.3%. Revenues from operations in Africa and the Middle East increased
by 5.2% and, in particular, new operations in Africa7 saw combined revenues climb 24%. Revenues fell
5.4% in Europe, mainly due to the 18.1% decline in Romania and to regulatory measures. Excluding
Romania and regulatory measures, revenues increased 2% in Europe.
The number of mobile services customers continued to climb sharply, reaching 62.0 million customers at
30 September 2009, a 19.3% increase year on year. There were 10.0 million additional customers, net of
contract terminations. New operations in Africa total 1.0 million new customers (net of contract
terminations) in the first nine months of 2009.
3rd quarter 2009
Revenues fell 1.5% on an historical basis to 2.078 billion euros, and 3.3% on a comparable basis.
Excluding the impact of regulatory measures, revenues declined by 0.9%, after rising 0.9% in the second
quarter. The third quarter reversal was due to the change in revenues from Romania, which was heavily
impacted by the economic downturn and strong competitive pressures.
7 New operations in Africa: Kenya, Guinea, Guinea-Bissau, Niger, Central African Republic and Uganda.
11
EnterpriseEnterpriseEnterpriseEnterprise
First nine months of 2009
Revenues from the Enterprise sector were 5.659 billion euros, a 1.5% decrease year on year on an
historical basis. The change included the 1.3% favourable impact of exchange rates and the 0.1%
increase following changes in the scope of consolidation linked to the consolidation of Netia and PCM in
October 2008 in the broadcast business.
On a comparable basis, Enterprise revenues fell 2.8%, reflecting the impact of deteriorating economic conditions
in the Enterprise business sector. The decrease in revenues was only 1.6% excluding network equipment sales,
which are more sensitive to the state of the economy.
Revenues from Business Network Legacy declined 7.5%, with revenues from traditional phone services
declining 7.4%, reflecting a decrease in both the number of telephone lines and in communication
volumes. Revenues from traditional data services fell 7.9% as business network migration to more recent
technologies slowed.
Advanced Business Network Services increased 3.9%, buoyed by IP network services and high bandwidth
infrastructure services such as MAN Ethernet and Ethernet Link. Voice over IP services and Business Everywhere
mobility offers also increased and there were 736,000 users in France at 30 September 2009, a year-on-year
increase of 11%.
Revenues for Extended Business Services grew 3.6%, driven by growth in facilities management and
integration operations linked to business network management. This performance was stronger than industrial
analyst estimates for the market as a whole.
Other Business Services reported a 9.2% decline in revenues attributable to the downturn in network
equipment sales. Excluding this impact, Other Business Services revenues increased 5.0%, driven by
broadcast services.
3rd quarter 2009
Third quarter revenues were 1.823 billion euros, a 5.0% decline on a comparable basis compared with
the third quarter of 2008 and a 4.1% decline on an historical basis. Excluding network equipment sales,
revenues decreased 3.9%, after falling 2.2% in the second quarter. Against the backdrop of a difficult
economic environment, the downward trend of the third quarter involved all product lines.
Business Network Legacy revenues fell 9.6% attributable to the 10.5% decline in traditional telephone services,
both in the number of customers and in communication volumes.
Advanced Business Network Services continued to grow, increasing by 1.9%, albeit at a slower rate due to
slower growth in the number of IP-VPN accesses which increased 2% year on year at 30 September 2009.
However, growth was still steady in VoIP and high bandwidth infrastructure services.
Revenues from Extended Business Services fell 0.9% after rising 2.8% in the second quarter.
Other Business Services revenues declined 10.1%, attributable to the downturn in network equipment
sales. Excluding this impact, Other Business Services revenues rose 4.2%, driven by broadcast services.
12
International Carriers and Shared ServicesInternational Carriers and Shared ServicesInternational Carriers and Shared ServicesInternational Carriers and Shared Services
First nine months of 2009
Revenues in the International Carriers and Shared Services segment rose 7.7% on a comparable basis,
and 6.8% on an historical basis, to 1.039 million euros.
Revenues from International Carrier Services were 910 million euros, an increase of 7.6%, driven by
international transit services.
Shared Services increased 8.0% to 129 million euros fuelled by growing cinema revenues (excluding
revenues from Orange TV customers).
3rd quarter 2009
Revenues from the International Carriers and Shared Services segment fell 1.4% on a comparable basis,
and 2.5% on an historical basis, to 351 million euros.
Revenues from International Carrier Services were 305 million euros, an increase of 0.3% which reflected
a significant slowdown in growth impacted by the decline in incoming international call termination rates.
Shared services fell 11.0% to 47 million euros due to a less favourable seasonal impact of R&D revenues
in the third quarter of 2009 than in 2008.

13
schedule of upcoming eventsschedule of upcoming eventsschedule of upcoming eventsschedule of upcoming events
� 25 February 2010: 2009 full-year results
contactscontactscontactscontacts
press contacts:
+33 1 44 44 93 93
Bertrand Deronchaine
Tom Wright
Sebastien Audra
financial communication contacts:
+33 1 44 44 04 32 (analysts and investors)
Vincent Benoit
Xavier Pichon
Reza Samdjee
for further information for further information for further information for further information
The slide presentation prepared for the publication of the third quarter 2009 results can be viewed on the
France Telecom website at www.orange.com; www.francetelecom.com
disclaimerdisclaimerdisclaimerdisclaimer
This press release contains forward-looking statements about France Telecom’s business, in particular for 2009.
Although France Telecom believes these statements are based on reasonable assumptions, these forward-looking
statements are subject to numerous risks and uncertainties, including matters not yet known to us or not currently
considered material by us, and there can be no assurance that anticipated events will occur or that the objectives set
out will actually be achieved. Important factors that could cause actual results to differ materially from the results
anticipated in the forward-looking statements include, among others, overall trends in the economy in general and in
France Telecom’s markets, the effectiveness of the integrated operator strategy including the success and market
acceptance of the Orange brand, the success of the Orange 2012 transformation plan and other strategic, operating
and financial initiatives, France Telecom’s ability to adapt to the ongoing transformation of the telecommunications
industry, regulatory developments and constraints, as well as the outcome of legal proceedings and the risks and
uncertainties related to international operations and exchange rate fluctuations. More detailed information on the
potential risks that could affect France Telecom's financial results can be found in the Registration Document filed
with the French Autorité des Marchés Financiers and in the Form 20-F filed with the U.S. Securities and Exchange
Commission. Except to the extent required by law, France Telecom does not undertake any obligation to update
forward-looking statements.
14
appendix 1: consolidated EBITDAappendix 1: consolidated EBITDAappendix 1: consolidated EBITDAappendix 1: consolidated EBITDA
at 30 September
(in millions of euros)
9 months
2009
9 months
2008
comparable
basis
9 months
2008
historical basis change
comparable
basis (in %)
change
historical basis (in %)
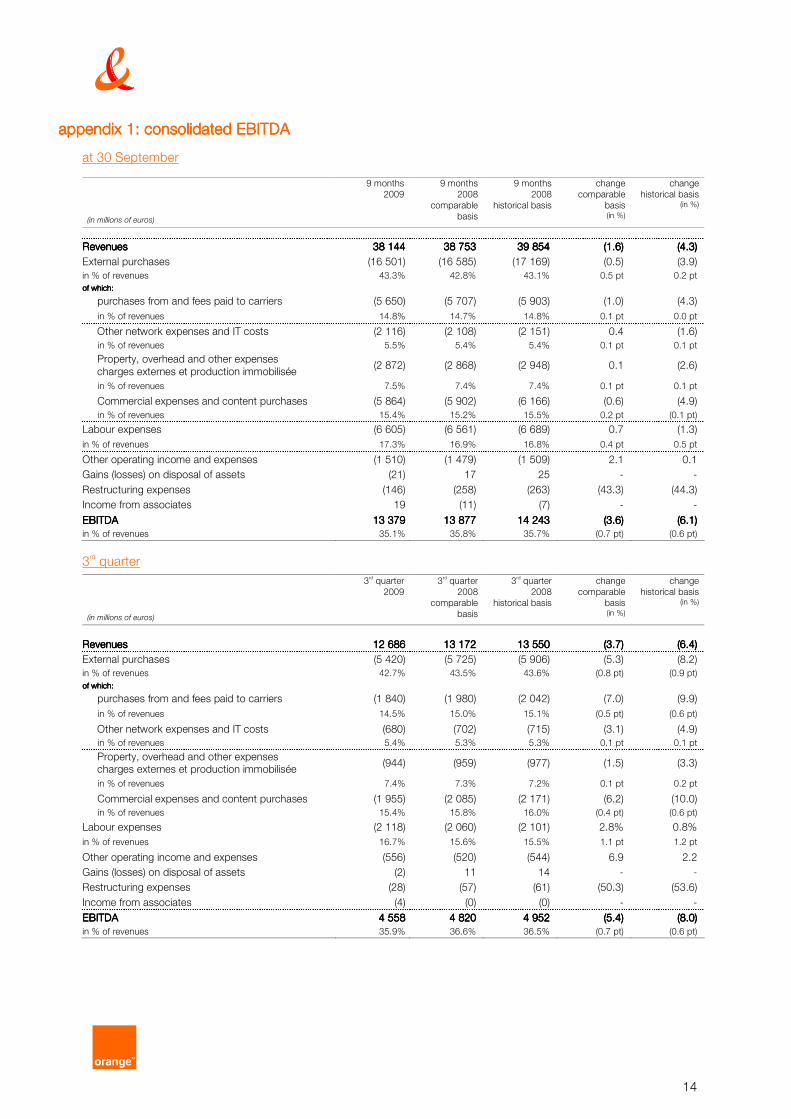
RevenuRevenuRevenuRevenueseseses 38 14438 14438 14438 144 38 75338 75338 75338 753 39 85439 85439 85439 854 (1.6)(1.6)(1.6)(1.6) (4.3)(4.3)(4.3)(4.3)
External purchases (16 501) (16 585) (17 169) (0.5) (3.9)
in % of revenues 43.3% 42.8% 43.1% 0.5 pt 0.2 pt
of which:of which:of which:of which:
purchases from and fees paid to carriers (5 650) (5 707) (5 903) (1.0) (4.3)
in % of revenues 14.8% 14.7% 14.8% 0.1 pt 0.0 pt
Other network expenses and IT costs (2 116) (2 108) (2 151) 0.4 (1.6)
in % of revenues 5.5% 5.4% 5.4% 0.1 pt 0.1 pt
Property, overhead and other expenses
charges externes et production immobilisée (2 872) (2 868) (2 948) 0.1 (2.6)
in % of revenues 7.5% 7.4% 7.4% 0.1 pt 0.1 pt
Commercial expenses and content purchases (5 864) (5 902) (6 166) (0.6) (4.9)
in % of revenues 15.4% 15.2% 15.5% 0.2 pt (0.1 pt)
Labour expenses (6 605) (6 561) (6 689) 0.7 (1.3)
in % of revenues 17.3% 16.9% 16.8% 0.4 pt 0.5 pt
Other operating income and expenses (1 510) (1 479) (1 509) 2.1 0.1
Gains (losses) on disposal of assets (21) 17 25 - -
Restructuring expenses (146) (258) (263) (43.3) (44.3)
Income from associates 19 (11) (7) - -
EBITDAEBITDAEBITDAEBITDA 13 37913 37913 37913 379 13 87713 87713 87713 877 14 24314 24314 24314 243 (3.6)(3.6)(3.6)(3.6) (6.1)(6.1)(6.1)(6.1)
in % of revenues 35.1% 35.8% 35.7% (0.7 pt) (0.6 pt)
3rd quarter
(in millions of euros)
3rd quarter
2009
3rd quarter
2008
comparable
basis
3rd quarter
2008
historical basis change
comparable
basis (in %)
change
historical basis (in %)
RevenuesRevenuesRevenuesRevenues 12 68612 68612 68612 686 13 17213 17213 17213 172 13 55013 55013 55013 550 (3.7)(3.7)(3.7)(3.7) (6.4)(6.4)(6.4)(6.4)
External purchases (5 420) (5 725) (5 906) (5.3) (8.2)
in % of revenues 42.7% 43.5% 43.6% (0.8 pt) (0.9 pt)
of which:of which:of which:of which:
purchases from and fees paid to carriers (1 840) (1 980) (2 042) (7.0) (9.9)
in % of revenues 14.5% 15.0% 15.1% (0.5 pt) (0.6 pt)
Other network expenses and IT costs (680) (702) (715) (3.1) (4.9)
in % of revenues 5.4% 5.3% 5.3% 0.1 pt 0.1 pt
Property, overhead and other expenses charges externes et production immobilisée (944) (959) (977) (1.5) (3.3)
in % of revenues 7.4% 7.3% 7.2% 0.1 pt 0.2 pt
Commercial expenses and content purchases (1 955) (2 085) (2 171) (6.2) (10.0)
in % of revenues 15.4% 15.8% 16.0% (0.4 pt) (0.6 pt)
Labour expenses (2 118) (2 060) (2 101) 2.8% 0.8%
in % of revenues 16.7% 15.6% 15.5% 1.1 pt 1.2 pt
Other operating income and expenses (556) (520) (544) 6.9 2.2
Gains (losses) on disposal of assets (2) 11 14 - -
Restructuring expenses (28) (57) (61) (50.3) (53.6)
Income from associates (4) (0) (0) - -
EBITDAEBITDAEBITDAEBITDA 4 5584 5584 5584 558 4 8204 8204 8204 820 4 9524 9524 9524 952 (5.4)(5.4)(5.4)(5.4) (8.0)(8.0)(8.0)(8.0)
in % of revenues 35.9% 36.6% 36.5% (0.7 pt) (0.6 pt)

15
appendix 2: revenues by business segappendix 2: revenues by business segappendix 2: revenues by business segappendix 2: revenues by business segmentmentmentment
at 30 September
(in millions of euros)
9 months
2009
9 months
2008
comparable
basis
9 months
2008
historical
basis
change
comparable
basis (in %)
change
historical
basis (in %)
FranceFranceFranceFrance
Personal Communication Services 8 053 7 747 7 759 3.9 3.8
Home Communication Services 10 569 10 714 10 762 (1.4) (1.8) Consumer Services 6 553 6 597 6 609 (0.7) (0.8)
Carrier Services 3 483 3 485 3 496 (0.0) (0.4)
Other HCS revenues 533 632 658 (15.8) (19.0)
Eliminations (902) (848) (852) 6.4 5.9
Total FranceTotal FranceTotal FranceTotal France 17 72017 72017 72017 720 17 61317 61317 61317 613 17 67017 67017 67017 670 0.60.60.60.6 0.30.30.30.3 United KingdomUnited KingdomUnited KingdomUnited Kingdom
Personal Communication Services 3 683 3 820 4 331 (3.6) (15.0)
Home Communication Services 180 213 241 (15.6) (25.5) Eliminations (45) (49) (56) (8.8) (19.5)
Total Total Total Total United KingdomUnited KingdomUnited KingdomUnited Kingdom 3 8183 8183 8183 818 3 9843 9843 9843 984 4 5174 5174 5174 517 (4.2)(4.2)(4.2)(4.2) (15.5)(15.5)(15.5)(15.5) SpainSpainSpainSpain
Personal Communication Services 2 417 2 549 2 549 (5.2) (5.2)
Home Communication Services 509 524 524 (3.0) (3.0)
Total SpainTotal SpainTotal SpainTotal Spain 2 9262 9262 9262 926 3 0733 0733 0733 073 3 0733 0733 0733 073 (4.8)(4.8)(4.8)(4.8) (4.8)(4.8)(4.8)(4.8) PolandPolandPolandPoland
Personal Communication Services 1 340 1 468 1 874 (8.7) (28.5)
Home Communication Services 1 711 1 781 2 275 (3.9) (24.8) Eliminations (181) (143) (183) 26.7 (0.9)
Total PolandTotal PolandTotal PolandTotal Poland 2 8702 8702 8702 870 3 1063 1063 1063 106 3 9663 9663 9663 966 (7.6)(7.6)(7.6)(7.6) (27.6)(27.6)(27.6)(27.6) Rest of WorldRest of WorldRest of WorldRest of World
Total Rest of World *Total Rest of World *Total Rest of World *Total Rest of World * 6 1906 1906 1906 190 6 2696 2696 2696 269 6 0356 0356 0356 035 (1.3)(1.3)(1.3)(1.3) 2.62.62.62.6 EnterpriseEnterpriseEnterpriseEnterprise
Business Network Legacy 2 403 2 600 2 577 (7.5) (6.7)
Advanced Business Network 1 620 1 559 1 522 3.9 6.4
Extended Business Services 1 007 972 956 3.6 5.3
Other Business services 629 692 687 (9.2) (8.6)
TTTTotal Enterprise Communication Servicesotal Enterprise Communication Servicesotal Enterprise Communication Servicesotal Enterprise Communication Services 5 6595 6595 6595 659 5 8235 8235 8235 823 5 7435 7435 7435 743 (2.8)(2.8)(2.8)(2.8) (1.5)(1.5)(1.5)(1.5) International Carriers and Shared ServicesInternational Carriers and Shared ServicesInternational Carriers and Shared ServicesInternational Carriers and Shared Services
International Carriers 910 846 855 7.6 6.4
Shared Services 129 120 118 8.0 9.7
International Carriers and Shared ServicesInternational Carriers and Shared ServicesInternational Carriers and Shared ServicesInternational Carriers and Shared Services 1 0391 0391 0391 039 965965965965 973973973973 7.77.77.77.7 6.86.86.86.8
Inter-segment eliminations (2 078) (2 081) (2 122) (0.1) (2.1)
France Telecom GroupFrance Telecom GroupFrance Telecom GroupFrance Telecom Group
Consolidated revenueConsolidated revenueConsolidated revenueConsolidated revenue 38 14438 14438 14438 144 38 75338 75338 75338 753 39 85439 85439 85439 854 (1.6)(1.6)(1.6)(1.6) (4.3)(4.3)(4.3)(4.3)
* Detail by country for the Rest of World segment is provided in appendix 3

16
3rd quarter
(in millions of euros)
3rd quarter
2009
3rd quarter
2008
comparable
basis
3rd quarter
2008
historical
basis
change
comparable
basis
(in %)
change
historical
basis
(in %)
FranceFranceFranceFrance
Personal Communication Services 2 680 2 698 2 703 (0.7) (0.9)
Home Communication Services 3 496 3 536 3 556 (1.2) (1.7) Consumer Services 2 166 2 194 2 196 (1.3) (1.4)
Carrier Services 1 160 1 146 1 150 1.2 0.9
Other HCS revenues 169 195 210 (13.5) (19.4)
Eliminations (296) (282) (284) 4.8 4.3
Total FranceTotal FranceTotal FranceTotal France 5 8805 8805 8805 880 5 9525 9525 9525 952 5 9765 9765 9765 976 (1.2)(1.2)(1.2)(1.2) (1.6)(1.6)(1.6)(1.6) United KingdomUnited KingdomUnited KingdomUnited Kingdom
Personal Communication Services 1 232 1 322 1 451 (6.8) (15.1)
Home Communication Services 60 69 75 (12.7) (20.1) Eliminations (15) (16) (18) (3.9) (12.2)
Total United KTotal United KTotal United KTotal United Kingdomingdomingdomingdom 1 2771 2771 2771 277 1 3751 3751 3751 375 1 5081 5081 5081 508 (7.1)(7.1)(7.1)(7.1) (15.3)(15.3)(15.3)(15.3) SpainSpainSpainSpain
Personal Communication Services 839 879 879 (4.5) (4.5)
Home Communication Services 166 177 177 (5.9) (5.9)
Total SpainTotal SpainTotal SpainTotal Spain 1 0051 0051 0051 005 1 0561 0561 0561 056 1 0561 0561 0561 056 (4.7)(4.7)(4.7)(4.7) (4.7)(4.7)(4.7)(4.7) PolandPolandPolandPoland
Personal Communication Services 456 523 663 (12.7) (31.1)
Home Communication Services 573 613 778 (6.5) (26.3) Eliminations (60) (54) (68) 11.5 (12.1)
Total PolandTotal PolandTotal PolandTotal Poland 970970970970 1 0831 0831 0831 083 1 3721 3721 3721 372 (10.4)(10.4)(10.4)(10.4) (29.3)(29.3)(29.3)(29.3) Rest of WorldRest of WorldRest of WorldRest of World
Total Rest of World *Total Rest of World *Total Rest of World *Total Rest of World * 2 0782 0782 0782 078 2 1482 1482 1482 148 2 1082 1082 1082 108 (3.3)(3.3)(3.3)(3.3) (1.5)(1.5)(1.5)(1.5) EnterpriseEnterpriseEnterpriseEnterprise
Business Network Legacy 761 842 838 (9.6) (9.2)
Advanced Business Network 537 527 518 1.9 3.8
Extended Business Services 326 329 325 (0.9) 0.4
Other Business services 199 221 221 (10.1) (9.9)
Total Enterprise Communication ServiceTotal Enterprise Communication ServiceTotal Enterprise Communication ServiceTotal Enterprise Communication Servicessss 1 8231 8231 8231 823 1 9191 9191 9191 919 1 9011 9011 9011 901 (5.0)(5.0)(5.0)(5.0) (4.1)(4.1)(4.1)(4.1) International Carriers and Shared ServicesInternational Carriers and Shared ServicesInternational Carriers and Shared ServicesInternational Carriers and Shared Services
International Carriers 305 304 308 0.3 (0.9)
Shared Services 47 52 53 (11.0) (12.3)
International Carriers and Shared ServicesInternational Carriers and Shared ServicesInternational Carriers and Shared ServicesInternational Carriers and Shared Services 351351351351 356356356356 361361361361 (1.4)(1.4)(1.4)(1.4) (2.5)(2.5)(2.5)(2.5)
Inter-segment eliminations (698) (717) (732) (2.7) (4.7)
France Telecom GroupFrance Telecom GroupFrance Telecom GroupFrance Telecom Group
Consolidated revenueConsolidated revenueConsolidated revenueConsolidated revenue 12 68612 68612 68612 686 13 17213 17213 17213 172 13 55013 55013 55013 550 (3.7)(3.7)(3.7)(3.7) (6.4)(6.4)(6.4)(6.4)
* Detail by country for the Rest of World segment is provided in appendix 3

17
appendix 3: Rest of World segment appendix 3: Rest of World segment appendix 3: Rest of World segment appendix 3: Rest of World segment –––– re re re revenues by countryvenues by countryvenues by countryvenues by country
at 30 September
(in millions of euros)
9 months
2009
9 months
2008
comparable
basis
9 months
2008
historical
basis
change
comparable
basis
(in %)
change
historical
basis
(in %) Belgium 1 121 1 115 1 115 0.6 0.6
Romania 800 977 977 (18.1) (18.1)
Egypt - - 637 - -
Slovakia 610 636 607 (4.1) 0.4 of which PCS* 582 617 589 (5.7) (1.3)
Switzerland 635 647 608 (1.8) 4.6
Senegal - - 471 - - of which PCS* - - 317 - -
Côte d’Ivoire 333 325 325 2.4 2.4 of which PCS* 232 232 232 (0.3) (0.3)
Dominican Republic 319 327 307 (2.5) 4.0
Jordan - - 279 - - of which PCS* - - 130 - -
Mali - - 182 - -
Cameroon 161 157 157 2.7 2.7
Moldova 113 100 95 13.4 19.2
Kenya 74 77 - (3.8) - of which PCS* 9 - - - -
Madagascar 59 67 71 (12.2) (17.1)
Botswana 64 54 55 16.6 15.5
Mauritius 47 44 47 6.6 0.0 of which PCS* 20 18 20 7.7 1.1
Other activities and Sofrecom 189 160 173 17.9 9.4 Eliminations (70) (66) (70) 6.5 (0.3)
Total Rest of World Total Rest of World Total Rest of World Total Rest of World 6 1906 1906 1906 190 6 2696 2696 2696 269 6 0356 0356 0356 035 (1.3)(1.3)(1.3)(1.3) 2.62.62.62.6
3rd quarter
(in millions of euros)
3rd quarter
2009
3rd quarter
2008
comparable
basis
3rd quarter
2008
historical
basis
change
comparable
basis (in %)
change
historical
basis (in %)
Belgium 376 386 386 (2.4) (2.4)
Romania 269 349 349 (22.9) (22.9)
Egypt - - 235 - -
Slovakia 203 221 219 (8.2) (7.4) of which PCS* 193 213 211 (9.6) (8.9)
Switzerland 219 221 208 (0.8) 5.2
Senegal - - 158 - - of which PCS* - - 103 - -
Côte d’Ivoire 114 109 109 4.3 4.3 of which PCS* 81 79 79 2.4 2.4
Dominican Republic 100 99 98 1.1 1.7
Jordan - - 98 - - of which PCS* - - 45 - -
Mali - - 61 - -
Cameroon 59 53 53 11.1 11.1
Moldova 38 34 37 11.3 3.9
Kenya 22 24 - (6.8) - of which PCS* 3 - - - -
Madagascar 20 23 26 (15.4) (25.9)
Botswana 22 20 20 8.6 10.1
Mauritius 16 15 16 9.6 1.5 of which PCS* 6 6 6 8.5 0.4
Other activities and Sofrecom 66 57 62 14.4 6.4 Eliminations (24) (24) (27) (2.7) (10.2)
Total Rest of World Total Rest of World Total Rest of World Total Rest of World 2 0782 0782 0782 078 2 1482 1482 1482 148 2 1082 1082 1082 108 (3.3)(3.3)(3.3)(3.3) (1.5)(1.5)(1.5)(1.5)
*PCS: Personal Communication Services

18
appendix 4: France Telecom key performappendix 4: France Telecom key performappendix 4: France Telecom key performappendix 4: France Telecom key performance indicatorsance indicatorsance indicatorsance indicators
* Excluding MVNO customers ** See glossary *** Company estimate **** Including FTTH, satellite and Wimax subscribers
(historical basis) As of
30 Sept.
2008
As of
31 Dec.
2008
As of
31 March
2009
As of
30 June
2009
As of
30 Sept.
2009
France Telecom GroupFrance Telecom GroupFrance Telecom GroupFrance Telecom Group
Total number of customersTotal number of customersTotal number of customersTotal number of customers **** (millions) 177.369 182.312 183.521 185.953 189.058
Personal CoPersonal CoPersonal CoPersonal Communication Services customersmmunication Services customersmmunication Services customersmmunication Services customers **** (millions) 117.604 121.821 122.894 125 501 128.816
- of which contract customers (millions) 44.461 45.735 46.263 46.844 47.497
- of which 3G broadband customers (millions) 15.355 18.583 20.604 22.884 24.498
ADSL bADSL bADSL bADSL broaroaroaroadband customersdband customersdband customersdband customers **** **** **** **** (millions) 12.664 12.973 13.248 13.362 13.425
- of which number of Liveboxes rented (millions) 7.474 7.794 8.162 8.357 8.527
- of which Voice over IP customers (millions) 6.035 6.506 6.901 7.105 7.339
- of which IPTV and satellite TV customers (millions) 1.746 2.109 2.463 2.670 2.916
FranceFranceFranceFrance
Personal Communication ServicesPersonal Communication ServicesPersonal Communication ServicesPersonal Communication Services
Number of customers * (millions) 24.524 25.202 25.076 25.287 25.354
- of which contract customers (millions) 16.557 16.977 17.114 17.327 17.560
- of which broadband customers (millions) 9.922 11.015 11.566 12.073 12.603
Total ARPU (euros) 399 398 400 402 398
Number of MVNO customers (millions) 1.686 1.820 1.872 1.981 2.114
Home Communication ServicesHome Communication ServicesHome Communication ServicesHome Communication Services
Consumer Market
Number of fixed line subscribers (millions) 21.956 21.790 21.549 21.296 21.005
- of which naked ADSL ** customers (millions) 1.733 1.998 2.239 2.390 2.590
Total number of ADSL broadband customers at end of period
(millions) 8.080 8.326 8.540 8.639 8.763
ADSL market share at end of period (%) *** 49.5 49.4 49.2 48.7 48.3
Number of Liveboxes (millions) 6.226 6.544 6.806 6.991 7.154
Number of Voice over IP customers (millions) 5.361 5.774 6.135 6.339 6.580
Number of IPTV and satellite TV customers (millions) 1.603 1.909 2.166 2.339 2.547
Total ARPU (euros) 32.6 32.9 33.3 33.6 33.8
- of which subscription fees (euros) 14.3 14.1 13.9 13.7 13.6
- of which calling services (euros) 7.0 6.8 6.7 6.5 6.3
- of which Internet services (euros) 11.3 12.0 12.8 13.4 13.9
Carrier market
Number of unbundled lines (millions) 6.008 6.332 6.664 6.986 7.325
- of which total unbundling (millions) 4.574 4.939 5.310 5.664 6.002
- of which partial unbundling (millions) 1.434 1.393 1.354 1.322 1.323
Wholesale ADSL rental to third party ISPs (millions) 2.148 2.124 2.098 2.060 1.949
- of which wholesale naked ADSL rental ** (millions) 1.137 1.186 1.232 1.250 1.232
Wholesale line rental (millions) 0.897 0.948 0.939 0.974 1.026
United KingdomUnited KingdomUnited KingdomUnited Kingdom
Personal CommunicPersonal CommunicPersonal CommunicPersonal Communication Servicesation Servicesation Servicesation Services
Number of customers * (millions) 15.815 15.995 15.850 15.853 16.110
- of which contract customers (millions) 6.013 6.173 6.298 6.443 6.637
- of which broadband customers (millions) 2.883 3.349 3.824 4.313 4.717
Total ARPU (GBP) 273 272 271 266 261
Home Communication ServicesHome Communication ServicesHome Communication ServicesHome Communication Services
Number of ADSL broadband customers (millions) 1.023 1.000 0.977 0.954 0.899
SpainSpainSpainSpain
Personal Communication ServicesPersonal Communication ServicesPersonal Communication ServicesPersonal Communication Services
Number of customers * (millions) 11.224 11.374 11.426 11.469 11.620
- of which contract customers (millions) 6.311 6.434 6.485 6.495 6.519
- of which broadband customers (millions) 2.820 3.256 3.730 4.154 4.604
Total ARPU (euros) 295 291 284 277 271
Home Communication ServicesHome Communication ServicesHome Communication ServicesHome Communication Services
Number of ADSL broadband customers (millions) 1.174 1.164 1.165 1.135 1.091

19
* Excluding customers of MVNOs
(historical basis) As of
30 Sept. 2008
As of
31 Dec. 2008
As of
31 March 2009
As of
30 June 2009
As of
30 Sept. 2009
PolandPolandPolandPoland
Personal Communication ServicesPersonal Communication ServicesPersonal Communication ServicesPersonal Communication Services Number of customers * (millions) 14.054 14.182 13.681 13.768 13.736
- of which contract customers (millions) 5.964 6.168 6.311 6.450 6.508
- of which broadband customers (millions) 4.086 4.570 4.731 5.370 5.421
Total ARPU (PLN) 588 591 582 571 551
Home Communication ServicesHome Communication ServicesHome Communication ServicesHome Communication Services Total number of telephone lines (millions) 9.036 8.898 8.750 8.613 8.475
Number of broadband customers (millions) 2.159 2.193 2.243 2.268 2.278
Rest of WorldRest of WorldRest of WorldRest of World
Personal Communication ServicesPersonal Communication ServicesPersonal Communication ServicesPersonal Communication Services Number of customers * (millions) 51.987 55.069 56.861 59.125 61.996
- of which contract customers (millions) 9.616 9.983 10.055 10.130 10.257
Number PCS customers by country (inNumber PCS customers by country (inNumber PCS customers by country (inNumber PCS customers by country (in thousands) thousands) thousands) thousands)
EuropeEuropeEuropeEurope Belgium 3 359 3 393 3 421 3 443 3 421 Luxembourg 78 80 80 80 80
Switzerland 1 530 1 543 1 558 1 568 1 566
Romania 10 208 10 355 10 118 10 354 10 694
Slovakia 2 891 2 927 2 901 2 876 2 869
Moldova 1 379 1 457 1 473 1 496 1 554
Middle EastMiddle EastMiddle EastMiddle East Egypt 13 473 14 331 15 089 16 282 - Jordan 1 544 1 608 1 566 1 613 -
AfricaAfricaAfricaAfrica Senegal 3 188 3 537 3 927 4 038 - Côte d’Ivoire 3 787 4 143 4 195 4 020 3815
Mali 2 559 2 757 2 899 3 114 -
Cameroon 2 003 2 137 2 197 2 408 2 590
Madagascar 1 814 2 016 2 121 2 135 2 160
Botswana 658 692 649 714 791
Mauritius 226 239 242 238 243
Kenya - 360 564 697 772
Guinea 544 618 724 615 -
Guinea-Bissau 48 60 85 88 -
Equatorial Guinea
110 110 113 120 -
CAR 95 127 140 157 173
Niger 165 166 212 275 347
Uganda - - 55 182 241
OtherOtherOtherOther Dominican Republic 2 315 2 401 2 516 2599 2 723 Vanuatu 14 13 14 12 16
Home Communication ServicesHome Communication ServicesHome Communication ServicesHome Communication Services Number of telephone lines (in thousands)
Belgium 612 630 649 635 646
Jordan 526 520 514 506 -
Senegal 245 240 240 241 -
Côte d’Ivoire 273 279 280 275 278
Mali 1 1 1 1 -
Mauritius 133 134 132 132 132
Kenya - 489 479 453 440
Vanuatu 4 4 4 4 4
EnterpriseEnterpriseEnterpriseEnterprise
FranceFranceFranceFrance
Number of legacy telephone lines (thousands) 5 520 5 461 5 390 5 299 5 214
Number of Business Everywhere customers (thousands) 664 683 709 718 736
Number of accesses to IP networks (thousands) 324 328 330 333 335
- of which IP-VPN 267 270 271 273 274
Number of XoIP connections (thousands) 16 19 23 26 29
WorldWorldWorldWorld
Number of IP-VPN accesses \ world (thousands) 318 321 322 324 325

20
appendix 5: highlightsappendix 5: highlightsappendix 5: highlightsappendix 5: highlights
highlightshighlightshighlightshighlights
OOOOctoberctoberctoberctober 20/10/09 Group – New concrete measures on work-related stress at France Telecom
20/10/09 Luxemburg – Mobistar announces that VOXmobile in Luxemburg becomes Orange
12/10/09 United Kingdom – Orange launches new MVNO partner platform with Transatel deal
12/10/09 France – The new Orange Livebox is here: more environmentally-friendly, more ergonomic, more
economical and with improved performance
07/10/09 Group – Didier Lombard’s speech to trade union representatives on France Telecom's new social
contract 05/10/09 Group – Stephane Richard appointed Deputy CEO in charge of Operations in France
SSSSeptembereptembereptembereptember 30/09/09 Group – Didier Lombard announces concrete and immediate measures to trade unions
28/09/09 United Kingdom – Orange UK and Apple have reached an agreement to bring iPhone 3G and 3GS
customers later this year. Orange globally now offers iPhone in 28 countries and territories
17/09/09 Poland – The Management Board of Telekomunikacja informs about the resignation (Richard Shearer)
and appointment (Vincent Lobry) of TP SA managing persons
15/09/09 Group – Extraordinary France Telecom Board of Directors meeting. The Board acknowledged all of
the measures announced today and took part in a detailed discussion on their implementation, about
which it will receive regular updates
15/09/09 Group – Further to recent events, Didier Lombard is proposing a new social contract at France
Telecom
08/09/09 Group – Deutsche Telekom and France Telecom today announce that they have entered into
exclusive negotiations to combine T-Mobile UK and Orange UK in a new 50:50 joint venture company
AAAAugustugustugustugust 28/08/09 United Kingdom – Orange to acquire Unanimis – the UK’s largest exclusive digital advertising
network. Combined ad sales network will create an unparalleled reach of over 70% of internet users in
the UK, extending to over 66% reach cumulated across UK, France, Spain and Poland.
JJJJulyulyulyuly 30/07/09 Group – 1H09 results publication: France Telecom showed resilience in the first half 2009 despite
increased regulatory pressure and continued deterioration in the economic environment
29/07/09 United Kingdom – Orange, Universal Music and Channel 4 join forces to deliver free music and more
for the masses
28/07/09 Africa – Orange, main sponsor of major competitions organised by the Confederation of African
Football over the next 8 years
27/07/09 United Kingdom – Blyk, the mobile engagement media announces Orange as its exclusive partner in
the UK and confirms that it will move from its UK MVNO operation at the end of August
09/07/09 Group – Orange launches Toshiba TG01 in Europe with a first-to-market exclusive. First multi-country
agreement with Toshiba bring Orange customers the latest in handheld mobile entertainment with the
latest available processing speeds
08/07/09 Orange Business Services – Total awards Orange Business Services global networking contract
worth up to EUR 100 million
02/07/09 Group ---- sale of the Alapage website:::: France Telecom e-Commerce, the France Telecom Group
subsidiary, signed an agreement with Rue du Commerce on June 30, 2009 to sell off the Alapage
internet address (URL), brand and certain intellectual property rights and contracts that were operated
up until then by France Telecom e-Commerce
02/07/09 Spain – After its success in France, Orange and Bic® announced the Spanish launch of the BIC
®
phone, the simple 100% “ready-to-use” mobile.
All press releases are available on the Group’s websites:
• www.orange.com
• www.orange.co.uk
• www.orange.es
• www.tp-ir.pl
• www.orange-business.com

21
appendix appendix appendix appendix 6666: glossary: glossary: glossary: glossary
ARPU – Home Communication Services Average annual revenues per line for Fixed Services for Consumers is calculated by dividing the average monthly revenues over
the last twelve months by the weighted average number of customers over the same period. The weighted average number of
customers is the average of the monthly averages during the period in question. The monthly average is the arithmetic mean of the number of customers at the start and end of the month. ARPU is expressed as monthly revenues per customer.
ARPU – Personal Communication Services Average annual revenues per user (ARPU) is calculated by dividing the revenues of the network generated over the last
twelve months (excluding revenues from mobile virtual network operators – MVNO) by the weighted average number of
customers over the same period. The weighted average number of customers is the average of the monthly averages during the period in question. The monthly average is the arithmetic mean of the number of customers at the start and end of the
month. ARPU is expressed as annual revenues per customer.
AUPU – Personal Communication Services
Average monthly usage per user ((AUPU), calculated by dividing the total minutes used over the preceding 12 months
(outgoing calls, incoming calls and roaming, excluding the traffic of mobile virtual network operators – MVNO) by the weighted average number of customers over the same period. ARPU is expressed in minutes as a monthly usage per
customer.
CAPEX
Capital expenditures on tangible and intangible assets excluding telecommunication licenses and investments through
finance leases.
commercial expenses
External purchases including purchases of handsets and other products sold, commissions related to distribution, advertising, promotional and sponsorship expenses, and rebranding expenses.
comparable basis Data based on comparable accounting principles, consolidation scope and exchange rates are presented for previous
periods. The transition from data on an historical basis to data on a comparable basis consists of keeping the results for the
period ended and then restating the results for the corresponding period of the preceding year for the purpose of presenting, over comparable periods, financial data with comparable accounting principles, consolidation scope and exchange rates.
The method used is to apply to the data of the corresponding period of the preceding year, the accounting principles and
scope of consolidation for the period just ended as well as the average exchange rate used for the income statement for the period ended.
EBITDA: Earnings Before Interest, Taxes, Depreciation and Amortisation This indicator corresponds to the operating income before depreciation and amortisation and before impairment of goodwill
and impairment of non-current assets. In addition to items covered by the Gross Operating Margin (GOM) which was used
until 2008, EBITDA includes employee profit sharing and share-based compensation, gains/losses on disposal of assets, restructuring costs and the share of profits/losses of associates.
EBITDA is included as additional information and should not be considered as a substitute for operating income.
EBITDA is not a financial performance indicator as defined by the IFRS standards and is not directly comparable to indicators referenced by the same name in other companies.
MVNO Mobile virtual network operator: mobile network operator that uses third party network infrastructures.
naked ADSL The naked ADSL access offer is aimed at subscribers who do not wish to keep a standard and separate telephone contract.
In France and Poland, France Telecom also offers wholesale naked ADSL to other operators, allowing their customers,
especially those residing in areas where total unbundling is unavailable, to dispense with the traditional telephony subscription.
network revenues (Personal Communication Services) Network revenues represent the revenues (voice and data services) generated by incoming and outgoing calls, network access fees,
roaming revenues from customers of other networks, revenues from value-added services and revenues from mobile virtual network
operators (MVNO).

22
organic cash flow
Net cash flow from operations less acquisitions of tangible and intangible assets (net of changes in accounts payable), plus
proceeds from disposals of tangible and intangible assets. France Telecom uses organic cash flow as an operating performance indicator to measure the cash generated by operations, excluding acquisitions of equity investments (net of
cash acquired) and excluding proceeds from disposals of equity investments (net of cash sold).
revenues from data services (Personal Communication Services)
Revenues from data services are network revenues excluding voice revenues and revenues from MVNOs. They include
revenues generated by text messages (SMS), multimedia messages (MMS), data (WAP, GPRS and 3G) and the cost invoiced to the customer for purchases of content.
roaming Use of a mobile telephone service on the network of an operator other than that of the subscriber.
total property, overhead and other expenses Other expenses include equipment costs, call centre outsourcing expenses, capitalized production of goods and services,
restructuring costs, gains or losses on disposals of assets, the share of profits/losses of associates and other operating
expenses. Other operating expenses include taxes, provisions and losses on accounts receivable, and other expenses and changes in provisions. Other operating expenses are reported net of other operating income.


![SWISS-WAY CAVALIER ET -B7532- - Fieldstone Braunvieh · swiss-way cavalier et -b7532- ! !! ! ! ! negro!mm!4451+[sw]4451+!!!! ! ! normann!+9323+!!!! !!! ! !! ! ! juvelmm!4590+[sw]4590+!!!!](https://static.fdocuments.us/doc/165x107/5e894ead720a7a44a31ffd47/swiss-way-cavalier-et-b7532-fieldstone-braunvieh-swiss-way-cavalier-et-b7532-.jpg)