3Q 2016 - PitchBookfiles.pitchbook.com/pdf/PitchBook-NVCA_3Q_2016_Venture_Monitor.pdf · 3Q 2016...
20
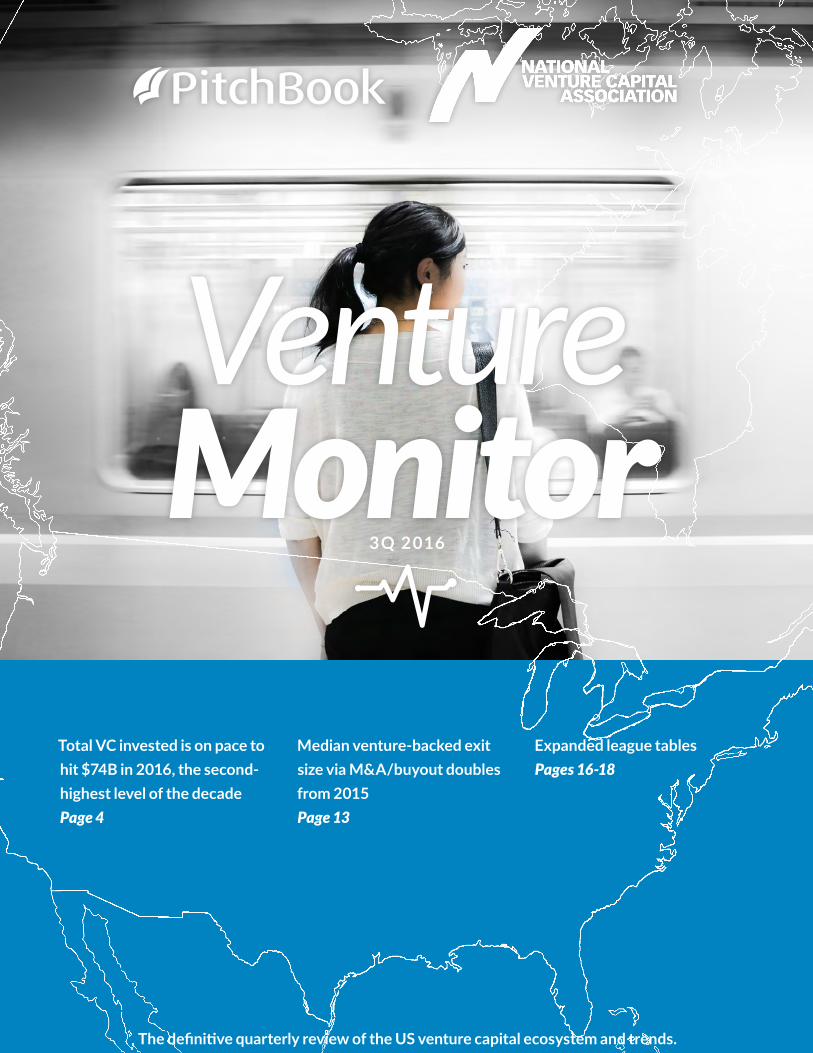
3Q 2016 Total VC invested is on pace to hit $74B in 2016, the second- highest level of the decade Page 4 The definive quarterly review of the US venture capital ecosystem and trends. Median venture-backed exit size via M&A/buyout doubles from 2015 Page 13 Expanded league tables Pages 16-18
Transcript of 3Q 2016 - PitchBookfiles.pitchbook.com/pdf/PitchBook-NVCA_3Q_2016_Venture_Monitor.pdf · 3Q 2016...
3Q 2016
Total VC invested is on pace to hit $74B in 2016, the second-highest level of the decadePage 4
The definitive quarterly review of the US venture capital ecosystem and trends.
Median venture-backed exit size via M&A/buyout doubles from 2015Page 13
Expanded league tablesPages 16-18
Credits & ContactPitchBook Data, Inc.JOHN GABBERT Founder, CEOADLEY BOWDEN Vice President, Market Development & Analysis
ContentNIZAR TARHUNI Senior Analyst GARRETT JAMES BLACK Senior Analyst KYLE STANFORD Analyst ELIZABETH ARMON Analyst ANDY WHITE Data Analysis Manager BRYAN HANSON Data Analyst JENNIFER SAM Senior Graphic Designer
Contact PitchBook pitchbook.com
RESEARCH [email protected]
EDITORIAL [email protected]
SALES [email protected]
National Venture Capital Association (NVCA)BOBBY FRANKLIN President and CEOMARYAM HAQUE Vice President of ResearchBEN VEGHTE Vice President of Communications and Marketing
Contact [email protected]
COPYRIGHT © 2016 by PitchBook Data, Inc. All rights reserved. No part of this publication may be reproduced in any form or by any means—graphic, electronic, or mechanical, including photocopying, recording, taping, and information storage and retrieval systems—without the express written permission of PitchBook Data, Inc. Contents are based on information from sources believed to be reliable, but accuracy and completeness cannot be guaranteed. Nothing herein should be construed as any past, current or future recommendation to buy or sell any security or an offer to sell, or a solicitation of an offer to buy any security. This material does not purport to contain all of the information that a prospective investor may wish to consider and is not to be relied upon as such or used in substitution for the exercise of independent judgment.
Executive Summary 3
Overview 4-5
Angel & Seed 6
Early Stage 7
Late Stage 8
Corporate Venture Capital 9
Growth Equity 10
Rounds by Sector 11
Exits 12-13
Fundraising 14-15
3Q 2016 League Tables 16-18
Methodology 19
Contents
2 PITCHBOOK-NVCA 3Q 2016 VENTURE MONITOR
Executive SummaryWe are excited to release this inaugural issue of the PitchBook-National Venture Capital Association (NVCA) Venture Monitor. The result of a partnership forged between the leading source of private capital data and the venture industry’s flagship trade association, the PitchBook-NVCA Venture Monitor serves as the definitive source of information and analysis about venture capital activity in the entrepreneurial ecosystem. From fundraising to investment to exit, the Venture Monitor paints a complete picture of US venture activity in one comprehensive report each quarter.
Headquartered in our nation’s capital, NVCA’s primary mission is advocacy and working with policymakers to implement a policy agenda to strengthen the entrepreneurial ecosystem. Viewed as a small, cottage industry in the minds of policymakers, it’s always a challenge for venture capital to command a lot of attention in our nation’s capital, especially when competing for airtime with large, entrenched industries. However, as policymakers and other stakeholders better understand venture capital and the unique and irreplaceable role it plays in our economy, more attention is being paid to the issues that matter to our ecosystem.
Most recently, the venture industry reached an important milestone in August when five venture-backed companies—Apple, Alphabet (Google), Microsoft, Amazon, and Facebook—held the top five spots as the most valuable companies in the world by market value. Knowing that these powerful brands, and their 530,000 employees, all trace their roots back to venture capital, it’s not surprising to see venture capital continue to flow to the next generation of great American companies.
In the third quarter, close to 2,000 investors (namely venture capital firms, corporate venture capital firms, angels, accelerators, and incubators) deployed just short of $15 billion to over 1,600 companies in the entrepreneurial ecosystem. These investments spanned 48 states and the District of Columbia and across companies operating in a range of sectors, showing the true reach of the venture ecosystem. The extent of this reach was apparent with investments in companies like CVRx, a Minneapolis-based medical device company developing technology for the treatment of high blood pressure and heart failure; Dallas-based StackPath offering cybersecurity solutions via a web-based security platform; San Francisco-based game development company Unity Technologies; and Cambridge-based Moderna developing alternative treatments for a range of disease conditions. In each case, these innovative companies are driving value creation to our economy, shaping society, and improving the health and wellbeing of our citizens.
Knowing of the transformative changes being driven by these venture-backed companies, investors in venture capital funds, such as endowments, foundations and pensions, continue their strong interest in the asset class. Third-quarter fundraising totaled $9 billion, bringing total funds raised for the year to $32 billion. At this pace, it’s likely 2016 could be one of the best fundraising years in recent memory. This isn’t surprising given that investors increasingly want exposure to high venture capital returns, especially in a low interest-rate environment, as well as a front row seat to innovation.
Naturally, much of the recent attention on the ecosystem has been on the exit environment, as 2016 has proven challenging for venture-backed technology IPOs. In the third quarter, 14 venture-backed companies went public, raising $1.04 billion, and creating over $5.7 billion in public company market value. M&A remains the most likely exit route for venture backed companies, and although the pace of exits via acquisition continued to slow for the fourth straight quarter, the median acquisition/buyout price crossed $100 million, reaching an eleven-year high.
3 PITCHBOOK-NVCA 3Q 2016 VENTURE MONITOR
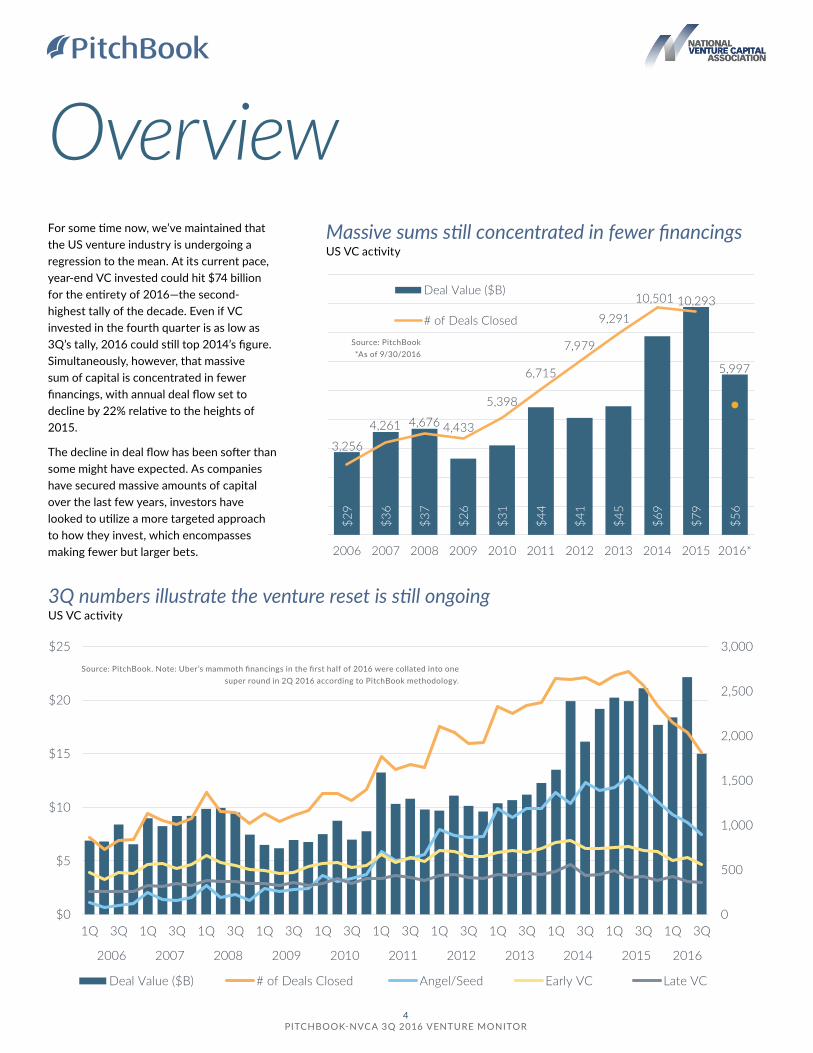
For some time now, we’ve maintained that the US venture industry is undergoing a regression to the mean. At its current pace, year-end VC invested could hit $74 billion for the entirety of 2016—the second-highest tally of the decade. Even if VC invested in the fourth quarter is as low as 3Q’s tally, 2016 could still top 2014’s figure. Simultaneously, however, that massive sum of capital is concentrated in fewer financings, with annual deal flow set to decline by 22% relative to the heights of 2015.
The decline in deal flow has been softer than some might have expected. As companies have secured massive amounts of capital over the last few years, investors have looked to utilize a more targeted approach to how they invest, which encompasses making fewer but larger bets.
3Q numbers illustrate the venture reset is still ongoing US VC activity
Massive sums still concentrated in fewer financings US VC activity
Source: PitchBook. Note: Uber’s mammoth financings in the first half of 2016 were collated into one super round in 2Q 2016 according to PitchBook methodology.
Source: PitchBook*As of 9/30/2016
Overview
$29
$36
$37
$26
$31
$44
$41
$45
$69
$79
$56
3,256
4,261 4,676 4,433
5,398
6,715
7,979
9,291
10,501 10,293
5,997
2006 2007 2008 2009 2010 2011 2012 2013 2014 2015 2016*
Deal Value ($B)
# of Deals Closed
0
500
1,000
1,500
2,000
2,500
3,000
$0
$5
$10
$15
$20
$25
1Q 3Q 1Q 3Q 1Q 3Q 1Q 3Q 1Q 3Q 1Q 3Q 1Q 3Q 1Q 3Q 1Q 3Q 1Q 3Q 1Q 3Q
2006 2007 2008 2009 2010 2011 2012 2013 2014 2015 2016
Deal Value ($B) # of Deals Closed Angel/Seed Early VC Late VC
4 PITCHBOOK-NVCA 3Q 2016 VENTURE MONITOR
US VC activity ($B) by size
US VC activity (#) by size
Source: PitchBook*As of 9/30/2016
Source: PitchBook*As of 9/30/2016
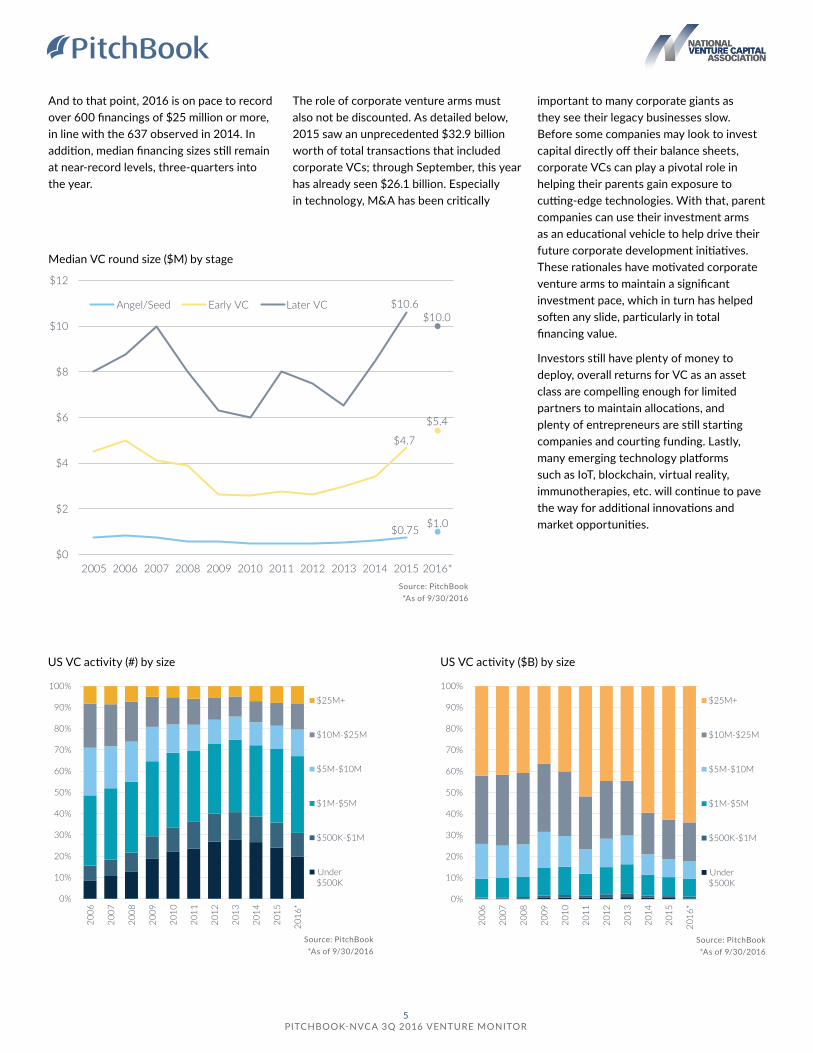
And to that point, 2016 is on pace to record over 600 financings of $25 million or more, in line with the 637 observed in 2014. In addition, median financing sizes still remain at near-record levels, three-quarters into the year.
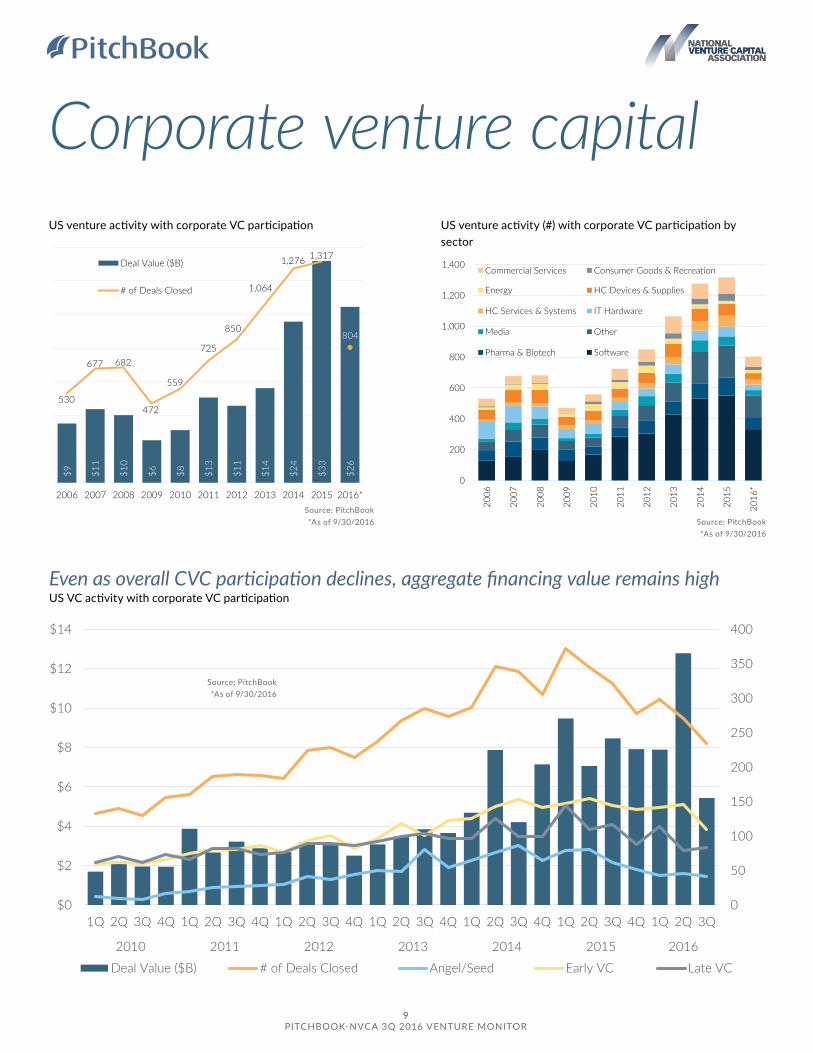
The role of corporate venture arms must also not be discounted. As detailed below, 2015 saw an unprecedented $32.9 billion worth of total transactions that included corporate VCs; through September, this year has already seen $26.1 billion. Especially in technology, M&A has been critically
important to many corporate giants as they see their legacy businesses slow. Before some companies may look to invest capital directly off their balance sheets, corporate VCs can play a pivotal role in helping their parents gain exposure to cutting-edge technologies. With that, parent companies can use their investment arms as an educational vehicle to help drive their future corporate development initiatives. These rationales have motivated corporate venture arms to maintain a significant investment pace, which in turn has helped soften any slide, particularly in total financing value.
Investors still have plenty of money to deploy, overall returns for VC as an asset class are compelling enough for limited partners to maintain allocations, and plenty of entrepreneurs are still starting companies and courting funding. Lastly, many emerging technology platforms such as IoT, blockchain, virtual reality, immunotherapies, etc. will continue to pave the way for additional innovations and market opportunities.
0%
10%
20%
30%
40%
50%
60%
70%
80%
90%
100%
2006
2007
2008
2009
2010
2011
2012
2013
2014
2015
2016
*
$25M+
$10M-$25M
$5M-$10M
$1M-$5M
$500K-$1M
Under$500K
0%
10%
20%
30%
40%
50%
60%
70%
80%
90%
100%
2006
2007
2008
2009
2010
2011
2012
2013
2014
2015
2016
*$25M+
$10M-$25M
$5M-$10M
$1M-$5M
$500K-$1M
Under$500K
Median VC round size ($M) by stage
Source: PitchBook*As of 9/30/2016
$0.75 $1.0
$4.7
$5.4
$10.6 $10.0
$0
$2
$4
$6
$8
$10
$12
2005 2006 2007 2008 2009 2010 2011 2012 2013 2014 2015 2016*
Angel/Seed Early VC Later VC
5 PITCHBOOK-NVCA 3Q 2016 VENTURE MONITOR
Source: PitchBook*As of 9/30/2016
Source: PitchBook*As of 9/30/2016
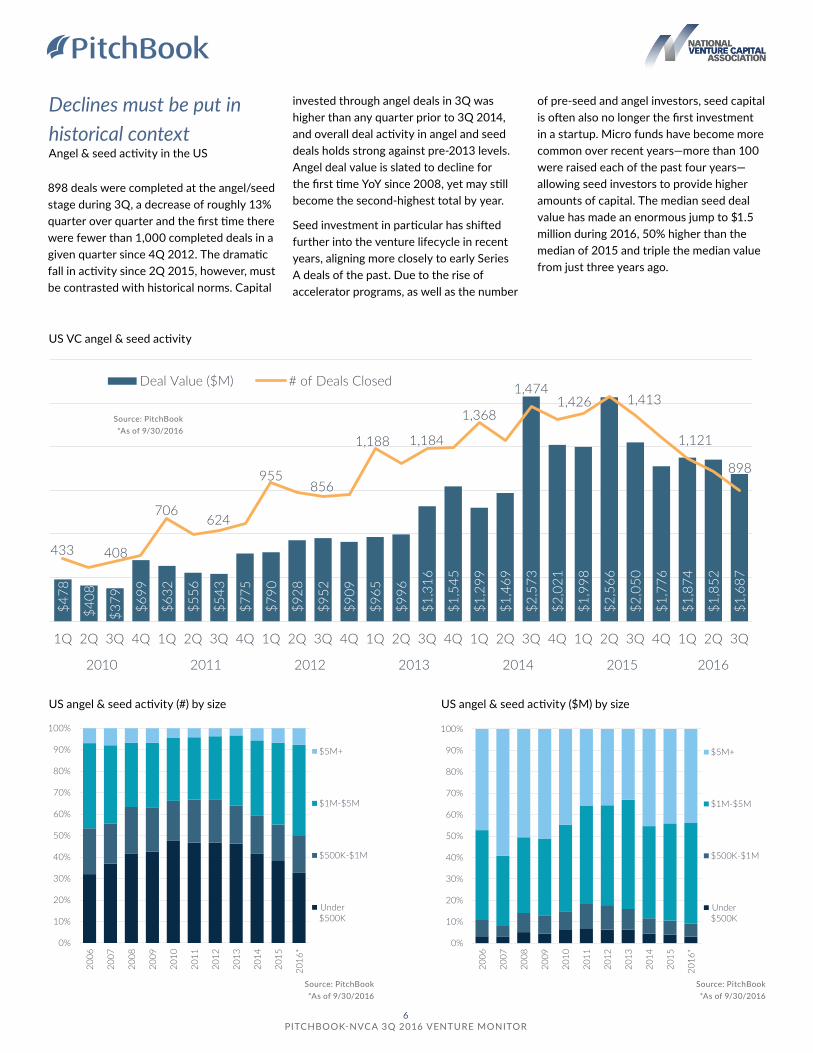
898 deals were completed at the angel/seed stage during 3Q, a decrease of roughly 13% quarter over quarter and the first time there were fewer than 1,000 completed deals in a given quarter since 4Q 2012. The dramatic fall in activity since 2Q 2015, however, must be contrasted with historical norms. Capital
invested through angel deals in 3Q was higher than any quarter prior to 3Q 2014, and overall deal activity in angel and seed deals holds strong against pre-2013 levels. Angel deal value is slated to decline for the first time YoY since 2008, yet may still become the second-highest total by year.
Seed investment in particular has shifted further into the venture lifecycle in recent years, aligning more closely to early Series A deals of the past. Due to the rise of accelerator programs, as well as the number
of pre-seed and angel investors, seed capital is often also no longer the first investment in a startup. Micro funds have become more common over recent years—more than 100 were raised each of the past four years—allowing seed investors to provide higher amounts of capital. The median seed deal value has made an enormous jump to $1.5 million during 2016, 50% higher than the median of 2015 and triple the median value from just three years ago.
Declines must be put in historical context Angel & seed activity in the US
US VC angel & seed activity
$478
$408
$379 $6
99
$632
$556
$543
$775
$790
$928
$952
$909
$965
$996
$1,3
16
$1,5
45
$1,2
99
$1,4
69
$2,5
73
$2,0
21
$1,9
98
$2,5
66
$2,0
50
$1,7
76
$1,8
74
$1,8
52
$1,6
87
433 408
706624
955856
1,188 1,184
1,368
1,4741,426 1,413
1,121
898
1Q 2Q 3Q 4Q 1Q 2Q 3Q 4Q 1Q 2Q 3Q 4Q 1Q 2Q 3Q 4Q 1Q 2Q 3Q 4Q 1Q 2Q 3Q 4Q 1Q 2Q 3Q
2010 2011 2012 2013 2014 2015 2016
Deal Value ($M) # of Deals Closed
US angel & seed activity ($M) by size
US angel & seed activity (#) by size
0%
10%
20%
30%
40%
50%
60%
70%
80%
90%
100%
2006
2007
2008
2009
2010
2011
2012
2013
2014
2015
2016
*
$5M+
$1M-$5M
$500K-$1M
Under$500K
Source: PitchBook*As of 9/30/2016
0%
10%
20%
30%
40%
50%
60%
70%
80%
90%
100%
2006
2007
2008
2009
2010
2011
2012
2013
2014
2015
2016
*
$5M+
$1M-$5M
$500K-$1M
Under$500K
6 PITCHBOOK-NVCA 3Q 2016 VENTURE MONITOR
Source: PitchBook*As of 9/30/2016
Source: PitchBook*As of 9/30/2016
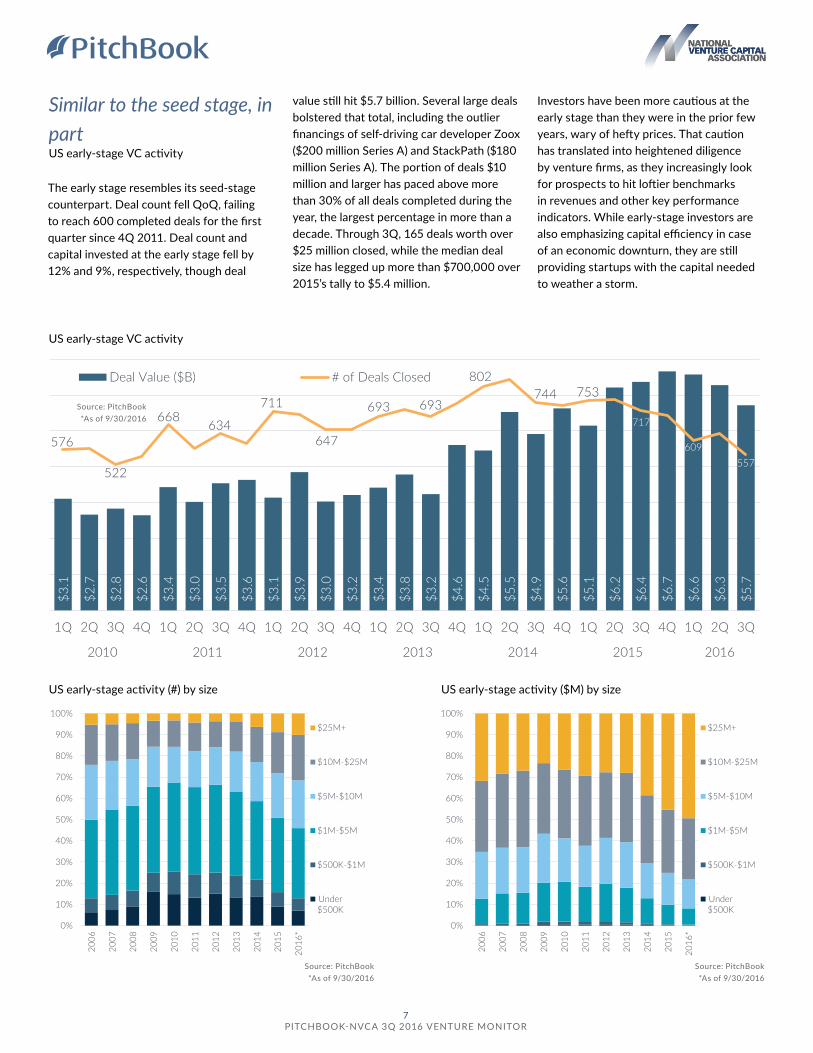
The early stage resembles its seed-stage counterpart. Deal count fell QoQ, failing to reach 600 completed deals for the first quarter since 4Q 2011. Deal count and capital invested at the early stage fell by 12% and 9%, respectively, though deal
value still hit $5.7 billion. Several large deals bolstered that total, including the outlier financings of self-driving car developer Zoox ($200 million Series A) and StackPath ($180 million Series A). The portion of deals $10 million and larger has paced above more than 30% of all deals completed during the year, the largest percentage in more than a decade. Through 3Q, 165 deals worth over $25 million closed, while the median deal size has legged up more than $700,000 over 2015’s tally to $5.4 million.
Investors have been more cautious at the early stage than they were in the prior few years, wary of hefty prices. That caution has translated into heightened diligence by venture firms, as they increasingly look for prospects to hit loftier benchmarks in revenues and other key performance indicators. While early-stage investors are also emphasizing capital efficiency in case of an economic downturn, they are still providing startups with the capital needed to weather a storm.
Similar to the seed stage, in part US early-stage VC activity
US early-stage VC activity
US early-stage activity ($M) by size
US early-stage activity (#) by size
Source: PitchBook*As of 9/30/2016
$3.1
$2.7
$2.8
$2.6
$3.4
$3.0
$3.5
$3.6
$3.1
$3.9
$3.0
$3.2
$3.4
$3.8
$3.2
$4.6
$4.5
$5.5
$4.9
$5.6
$5.1
$6.2
$6.4
$6.7
$6.6
$6.3
$5.7
576
522
668634
711
647
693 693
802744 753
717
609557
1Q 2Q 3Q 4Q 1Q 2Q 3Q 4Q 1Q 2Q 3Q 4Q 1Q 2Q 3Q 4Q 1Q 2Q 3Q 4Q 1Q 2Q 3Q 4Q 1Q 2Q 3Q
2010 2011 2012 2013 2014 2015 2016
Deal Value ($B) # of Deals Closed
0%
10%
20%
30%
40%
50%
60%
70%
80%
90%
100%
2006
2007
2008
2009
2010
2011
2012
2013
2014
2015
2016
*
$25M+
$10M-$25M
$5M-$10M
$1M-$5M
$500K-$1M
Under$500K
0%
10%
20%
30%
40%
50%
60%
70%
80%
90%
100%
2006
2007
2008
2009
2010
2011
2012
2013
2014
2015
2016
*
$25M+
$10M-$25M
$5M-$10M
$1M-$5M
$500K-$1M
Under$500K
7 PITCHBOOK-NVCA 3Q 2016 VENTURE MONITOR
Source: PitchBook*As of 9/30/2016
Source: PitchBook*As of 9/30/2016
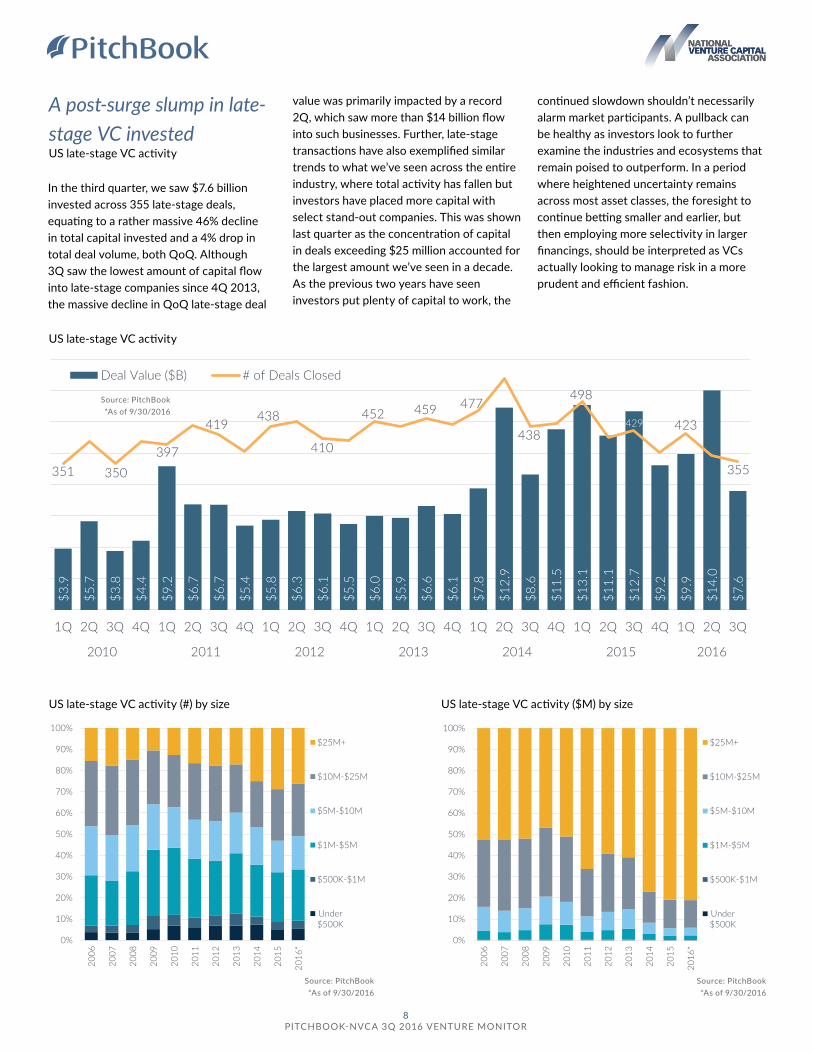
In the third quarter, we saw $7.6 billion invested across 355 late-stage deals, equating to a rather massive 46% decline in total capital invested and a 4% drop in total deal volume, both QoQ. Although 3Q saw the lowest amount of capital flow into late-stage companies since 4Q 2013, the massive decline in QoQ late-stage deal
value was primarily impacted by a record 2Q, which saw more than $14 billion flow into such businesses. Further, late-stage transactions have also exemplified similar trends to what we’ve seen across the entire industry, where total activity has fallen but investors have placed more capital with select stand-out companies. This was shown last quarter as the concentration of capital in deals exceeding $25 million accounted for the largest amount we’ve seen in a decade. As the previous two years have seen investors put plenty of capital to work, the
continued slowdown shouldn’t necessarily alarm market participants. A pullback can be healthy as investors look to further examine the industries and ecosystems that remain poised to outperform. In a period where heightened uncertainty remains across most asset classes, the foresight to continue betting smaller and earlier, but then employing more selectivity in larger financings, should be interpreted as VCs actually looking to manage risk in a more prudent and efficient fashion.
A post-surge slump in late-stage VC invested US late-stage VC activity
US late-stage VC activity
US late-stage VC activity ($M) by size
US late-stage VC activity (#) by size
Source: PitchBook*As of 9/30/2016
0%
10%
20%
30%
40%
50%
60%
70%
80%
90%
100%
2006
2007
2008
2009
2010
2011
2012
2013
2014
2015
2016
*
$25M+
$10M-$25M
$5M-$10M
$1M-$5M
$500K-$1M
Under$500K
$3.9
$5.7
$3.8
$4.4
$9.2
$6.7
$6.7
$5.4
$5.8
$6.3
$6.1
$5.5
$6.0
$5.9
$6.6
$6.1
$7.8
$12.
9
$8.6
$11.
5
$13.
1
$11.
1
$12.
7
$9.2
$9.9
$14.
0
$7.6
351 350397
419 438
410
452 459 477
438
498
429 423
355
1Q 2Q 3Q 4Q 1Q 2Q 3Q 4Q 1Q 2Q 3Q 4Q 1Q 2Q 3Q 4Q 1Q 2Q 3Q 4Q 1Q 2Q 3Q 4Q 1Q 2Q 3Q
2010 2011 2012 2013 2014 2015 2016
Deal Value ($B) # of Deals Closed
0%
10%
20%
30%
40%
50%
60%
70%
80%
90%
100%
2006
2007
2008
2009
2010
2011
2012
2013
2014
2015
2016
*
$25M+
$10M-$25M
$5M-$10M
$1M-$5M
$500K-$1M
Under$500K
8 PITCHBOOK-NVCA 3Q 2016 VENTURE MONITOR
Corporate venture capital
Source: PitchBook*As of 9/30/2016
US venture activity with corporate VC participation
$9 $11
$10
$6 $8 $13
$11
$14
$24
$33
$26
530
677 682
472
559
725
850
1,064
1,276 1,317
804
2006 2007 2008 2009 2010 2011 2012 2013 2014 2015 2016*
Deal Value ($B)
# of Deals Closed
Even as overall CVC participation declines, aggregate financing value remains high US VC activity with corporate VC participation
0
50
100
150
200
250
300
350
400
$0
$2
$4
$6
$8
$10
$12
$14
1Q 2Q 3Q 4Q 1Q 2Q 3Q 4Q 1Q 2Q 3Q 4Q 1Q 2Q 3Q 4Q 1Q 2Q 3Q 4Q 1Q 2Q 3Q 4Q 1Q 2Q 3Q
2010 2011 2012 2013 2014 2015 2016
Deal Value ($B) # of Deals Closed Angel/Seed Early VC Late VC
US venture activity (#) with corporate VC participation by sector
0
200
400
600
800
1,000
1,200
1,400
2006
2007
2008
2009
2010
2011
2012
2013
2014
2015
2016
*
Commercial Services Consumer Goods & Recreation
Energy HC Devices & Supplies
HC Services & Systems IT Hardware
Media Other
Pharma & Biotech Software
Source: PitchBook*As of 9/30/2016
Source: PitchBook*As of 9/30/2016
9 PITCHBOOK-NVCA 3Q 2016 VENTURE MONITOR
Source: PitchBook*As of 9/30/2016
Source: PitchBook*As of 9/30/2016
US growth equity activity
US growth equity activity (#) by size
US growth equity deal size metrics
Source: PitchBook*As of 9/30/2016
0%
10%
20%
30%
40%
50%
60%
70%
80%
90%
100%
2006
2007
2008
2009
2010
2011
2012
2013
2014
2015
2016
*
$200M+
$100M-$200M
$75M-$100M
$50M-$75M
$30M-$50M
$15M-$30M
$39 $35
$180$150
$0
$50
$100
$150
$200
$250
2006 2007 2008 2009 2010 2011 2012 2013 2014 2015 2016*
Median deal size ($M) Median pre-money valuation ($M)
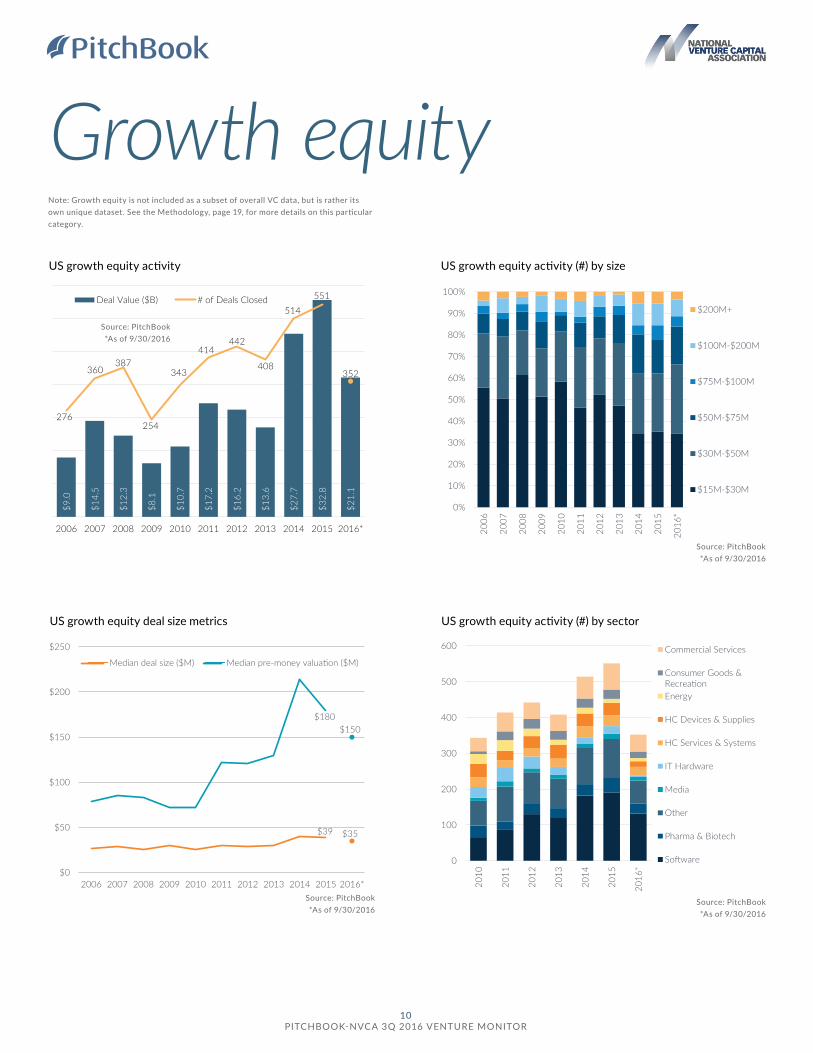
Note: Growth equity is not included as a subset of overall VC data, but is rather its own unique dataset. See the Methodology, page 19, for more details on this particular category.
$9.0
$14.
5
$12.
3
$8.1
$10.
7
$17.
2
$16.
2
$13.
6
$27.
7
$32.
8
$21.
1
276
360 387
254
343
414 442
408
514 551
352
2006 2007 2008 2009 2010 2011 2012 2013 2014 2015 2016*
Deal Value ($B) # of Deals Closed
US growth equity activity (#) by sector
0
100
200
300
400
500
600
2010
2011
2012
2013
2014
2015
2016
*Commercial Services
Consumer Goods &RecreationEnergy
HC Devices & Supplies
HC Services & Systems
IT Hardware
Media
Other
Pharma & Biotech
Software
Source: PitchBook*As of 9/30/2016
Growth equity
10 PITCHBOOK-NVCA 3Q 2016 VENTURE MONITOR
Source: PitchBook*As of 9/30/2016
Source: PitchBook*As of 9/30/2016
Rounds by sector
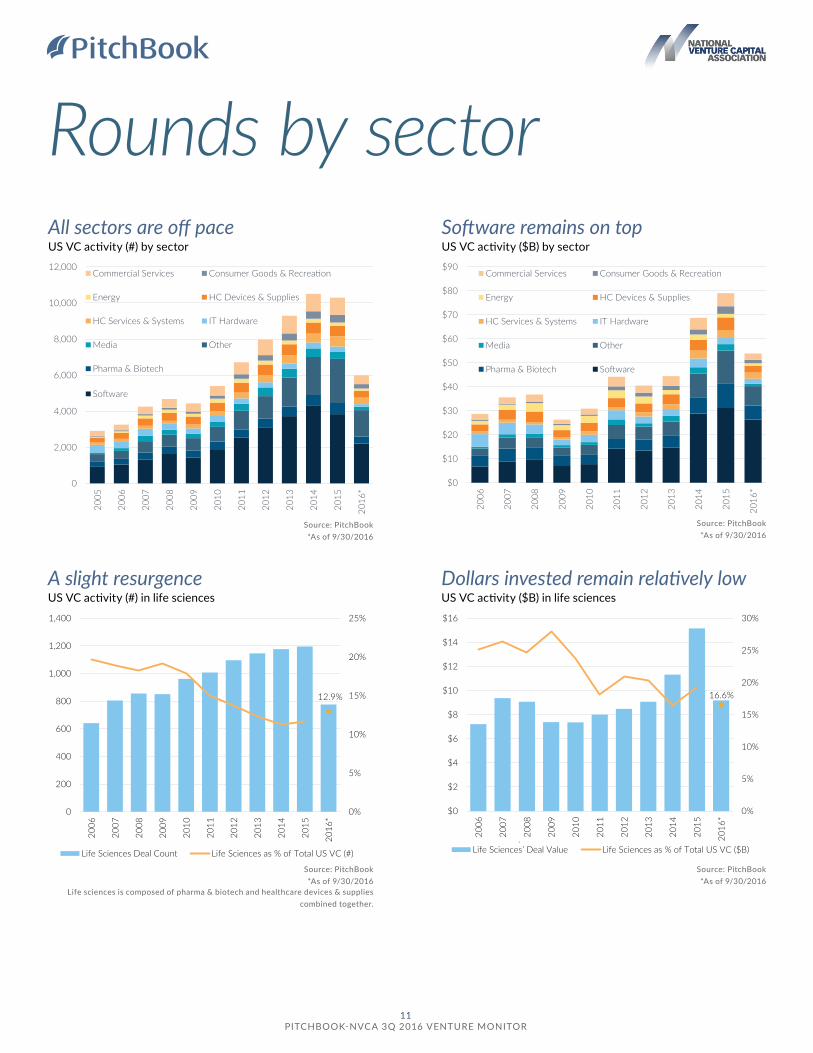
Dollars invested remain relatively low US VC activity ($B) in life sciences
A slight resurgence US VC activity (#) in life sciences
Software remains on top US VC activity ($B) by sector
All sectors are off pace US VC activity (#) by sector
0
2,000
4,000
6,000
8,000
10,000
12,000
2005
2006
2007
2008
2009
2010
2011
2012
2013
2014
2015
2016
*
Commercial Services Consumer Goods & Recreation
Energy HC Devices & Supplies
HC Services & Systems IT Hardware
Media Other
Pharma & Biotech
Software
$0
$10
$20
$30
$40
$50
$60
$70
$80
$90
2006
2007
2008
2009
2010
2011
2012
2013
2014
2015
2016
*
Commercial Services Consumer Goods & Recreation
Energy HC Devices & Supplies
HC Services & Systems IT Hardware
Media Other
Pharma & Biotech Software
12.9%
0%
5%
10%
15%
20%
25%
0
200
400
600
800
1,000
1,200
1,400
2006
2007
2008
2009
2010
2011
2012
2013
2014
2015
2016
*
Life Sciences Deal Count Life Sciences as % of Total US VC (#)
16.6%
0%
5%
10%
15%
20%
25%
30%
$0
$2
$4
$6
$8
$10
$12
$14
$16
2006
2007
2008
2009
2010
2011
2012
2013
2014
2015
2016
*
Life Sciences’ Deal Value Life Sciences as % of Total US VC ($B)
Source: PitchBook*As of 9/30/2016
Life sciences is composed of pharma & biotech and healthcare devices & supplies combined together.
Source: PitchBook*As of 9/30/2016
11 PITCHBOOK-NVCA 3Q 2016 VENTURE MONITOR
Source: PitchBook*As of 9/30/2016
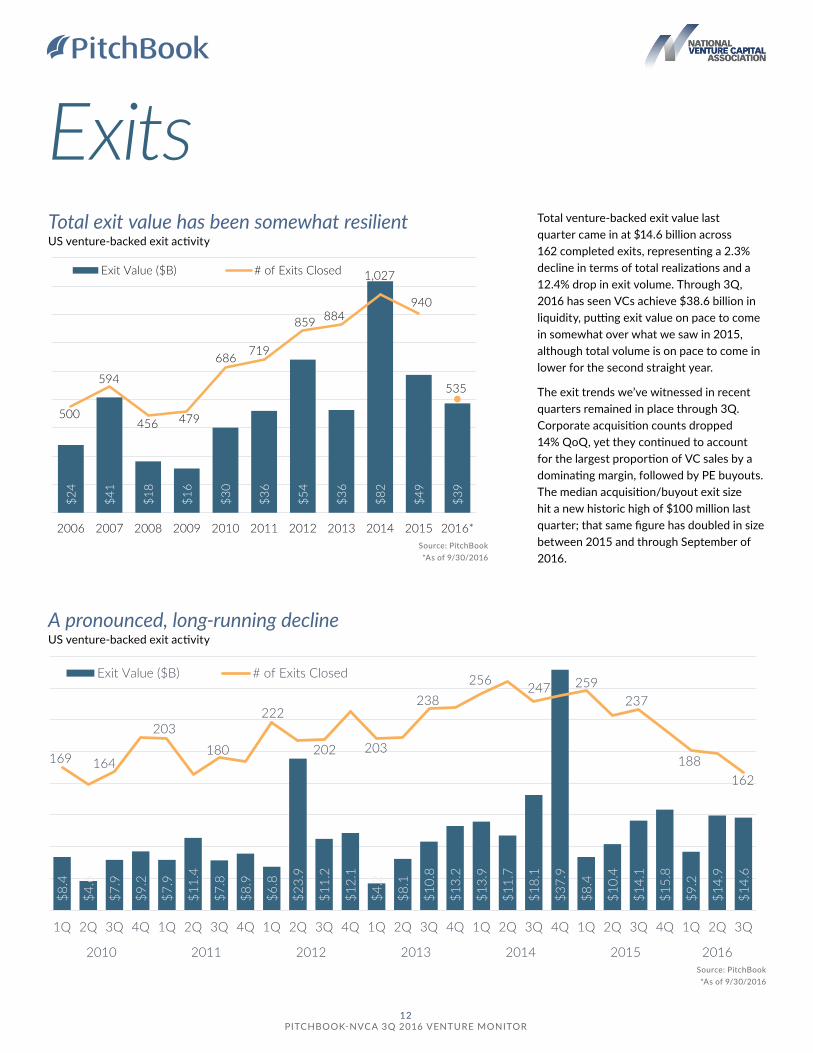
Total venture-backed exit value last quarter came in at $14.6 billion across 162 completed exits, representing a 2.3% decline in terms of total realizations and a 12.4% drop in exit volume. Through 3Q, 2016 has seen VCs achieve $38.6 billion in liquidity, putting exit value on pace to come in somewhat over what we saw in 2015, although total volume is on pace to come in lower for the second straight year.
The exit trends we’ve witnessed in recent quarters remained in place through 3Q. Corporate acquisition counts dropped 14% QoQ, yet they continued to account for the largest proportion of VC sales by a dominating margin, followed by PE buyouts. The median acquisition/buyout exit size hit a new historic high of $100 million last quarter; that same figure has doubled in size between 2015 and through September of 2016.
ExitsTotal exit value has been somewhat resilient US venture-backed exit activity
$24
$41
$18
$16
$30
$36
$54
$36
$82
$49
$39
500
594
456 479
686 719
859 884
1,027
940
535
2006 2007 2008 2009 2010 2011 2012 2013 2014 2015 2016*
Exit Value ($B) # of Exits Closed
A pronounced, long-running decline US venture-backed exit activity
$8.4
$4.6
$7.9
$9.2
$7.9
$11.
4
$7.8
$8.9
$6.8
$23.
9
$11.
2
$12.
1
$4.2
$8.1
$10.
8
$13.
2
$13.
9
$11.
7
$18.
1
$37.
9
$8.4
$10.
4
$14.
1
$15.
8
$9.2
$14.
9
$14.
6169 164
203180
222
202 203
238256 247 259
237
188162
1Q 2Q 3Q 4Q 1Q 2Q 3Q 4Q 1Q 2Q 3Q 4Q 1Q 2Q 3Q 4Q 1Q 2Q 3Q 4Q 1Q 2Q 3Q 4Q 1Q 2Q 3Q
2010 2011 2012 2013 2014 2015 2016
Exit Value ($B) # of Exits Closed
Source: PitchBook*As of 9/30/2016
12 PITCHBOOK-NVCA 3Q 2016 VENTURE MONITOR
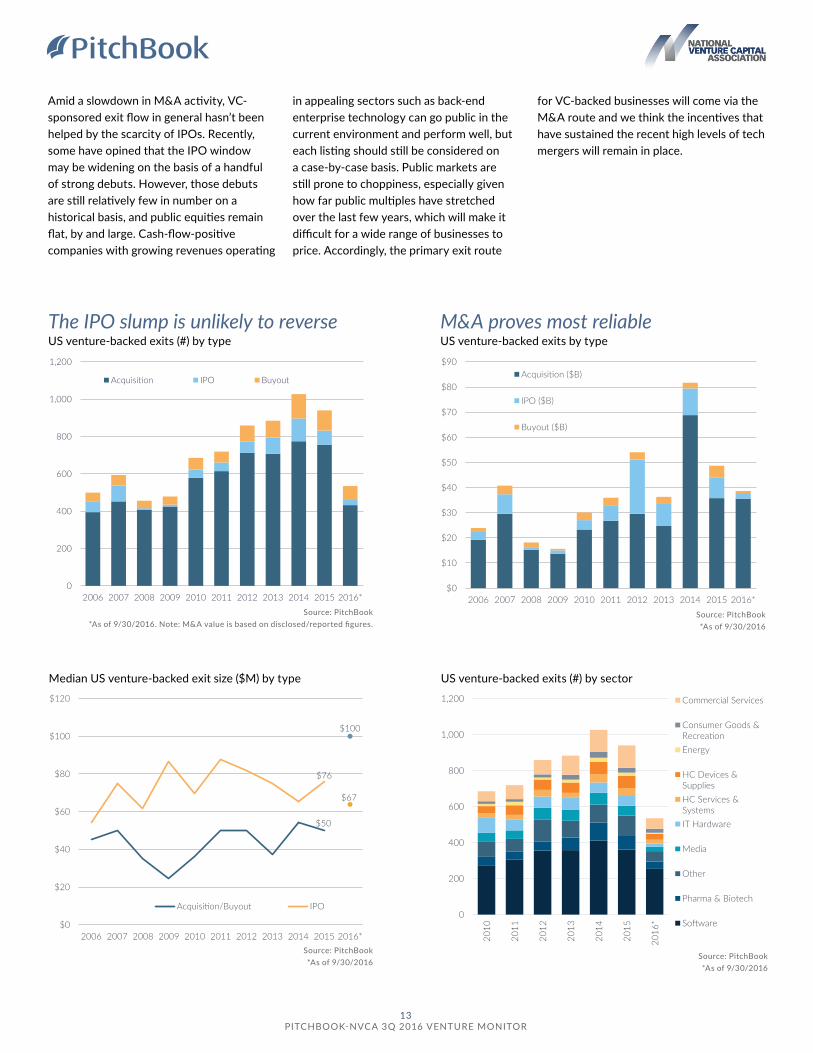
Amid a slowdown in M&A activity, VC-sponsored exit flow in general hasn’t been helped by the scarcity of IPOs. Recently, some have opined that the IPO window may be widening on the basis of a handful of strong debuts. However, those debuts are still relatively few in number on a historical basis, and public equities remain flat, by and large. Cash-flow-positive companies with growing revenues operating
in appealing sectors such as back-end enterprise technology can go public in the current environment and perform well, but each listing should still be considered on a case-by-case basis. Public markets are still prone to choppiness, especially given how far public multiples have stretched over the last few years, which will make it difficult for a wide range of businesses to price. Accordingly, the primary exit route
for VC-backed businesses will come via the M&A route and we think the incentives that have sustained the recent high levels of tech mergers will remain in place.
M&A proves most reliable US venture-backed exits by type
The IPO slump is unlikely to reverse US venture-backed exits (#) by type
Source: PitchBook*As of 9/30/2016. Note: M&A value is based on disclosed/reported figures.
Source: PitchBook*As of 9/30/2016
US venture-backed exits (#) by sector
Median US venture-backed exit size ($M) by type
0
200
400
600
800
1,000
1,200
2006 2007 2008 2009 2010 2011 2012 2013 2014 2015 2016*
Acquisition IPO Buyout
$0
$10
$20
$30
$40
$50
$60
$70
$80
$90
2006 2007 2008 2009 2010 2011 2012 2013 2014 2015 2016*
Acquisition ($B)
IPO ($B)
Buyout ($B)
$50
$100
$76
$67
$0
$20
$40
$60
$80
$100
$120
2006 2007 2008 2009 2010 2011 2012 2013 2014 2015 2016*
Acquisition/Buyout IPO0
200
400
600
800
1,000
1,200
2010
2011
2012
2013
2014
2015
2016
*
Commercial Services
Consumer Goods &RecreationEnergy
HC Devices &SuppliesHC Services &SystemsIT Hardware
Media
Other
Pharma & Biotech
Software
Source: PitchBook*As of 9/30/2016
Source: PitchBook*As of 9/30/2016
13 PITCHBOOK-NVCA 3Q 2016 VENTURE MONITOR
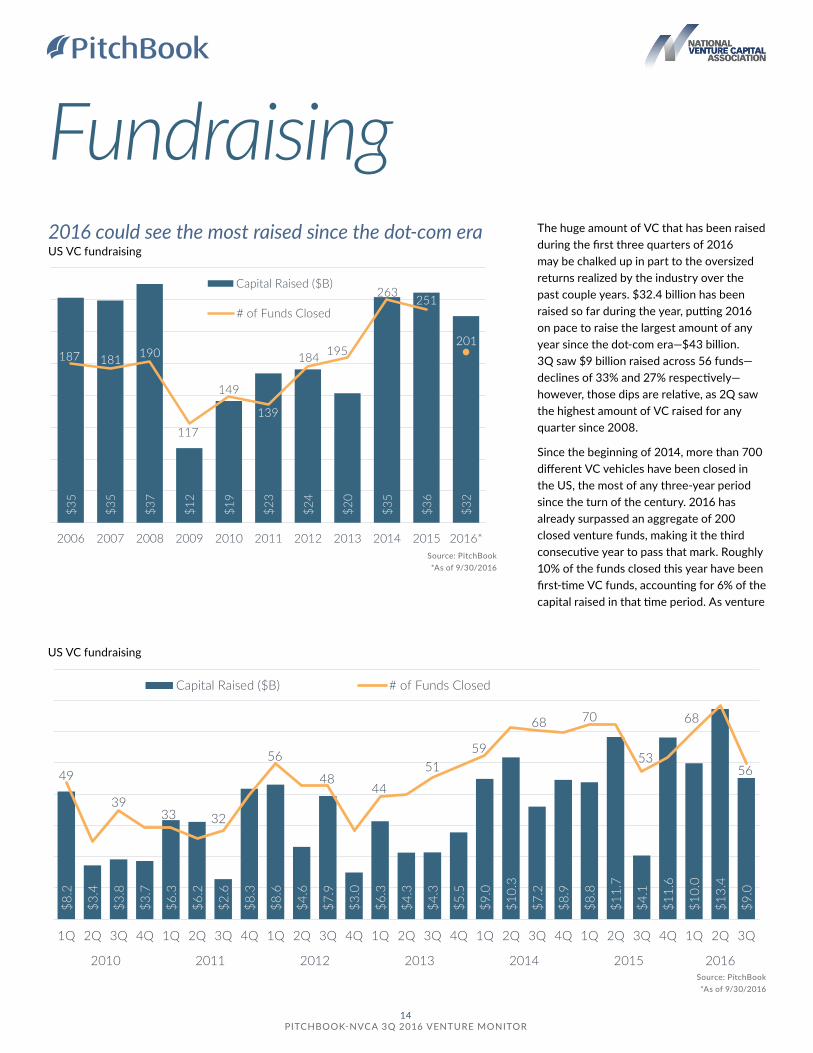
The huge amount of VC that has been raised during the first three quarters of 2016 may be chalked up in part to the oversized returns realized by the industry over the past couple years. $32.4 billion has been raised so far during the year, putting 2016 on pace to raise the largest amount of any year since the dot-com era—$43 billion. 3Q saw $9 billion raised across 56 funds—declines of 33% and 27% respectively—however, those dips are relative, as 2Q saw the highest amount of VC raised for any quarter since 2008.
Since the beginning of 2014, more than 700 different VC vehicles have been closed in the US, the most of any three-year period since the turn of the century. 2016 has already surpassed an aggregate of 200 closed venture funds, making it the third consecutive year to pass that mark. Roughly 10% of the funds closed this year have been first-time VC funds, accounting for 6% of the capital raised in that time period. As venture
Source: PitchBook*As of 9/30/2016
Fundraising2016 could see the most raised since the dot-com era US VC fundraising
$35
$35
$37
$12
$19
$23
$24
$20
$35
$36
$32
187 181 190
117
149
139
184 195
263251
201
2006 2007 2008 2009 2010 2011 2012 2013 2014 2015 2016*
Capital Raised ($B)
# of Funds Closed
US VC fundraising
$8.2
$3.4
$3.8
$3.7
$6.3
$6.2
$2.6
$8.3
$8.6
$4.6
$7.9
$3.0
$6.3
$4.3
$4.3
$5.5
$9.0
$10.
3
$7.2
$8.9
$8.8
$11.
7
$4.1
$11.
6
$10.
0
$13.
4
$9.0
49
3933 32
56
4844
5159
68 70
53
68
56
1Q 2Q 3Q 4Q 1Q 2Q 3Q 4Q 1Q 2Q 3Q 4Q 1Q 2Q 3Q 4Q 1Q 2Q 3Q 4Q 1Q 2Q 3Q 4Q 1Q 2Q 3Q
2010 2011 2012 2013 2014 2015 2016
Capital Raised ($B) # of Funds Closed
Source: PitchBook*As of 9/30/2016
14 PITCHBOOK-NVCA 3Q 2016 VENTURE MONITOR
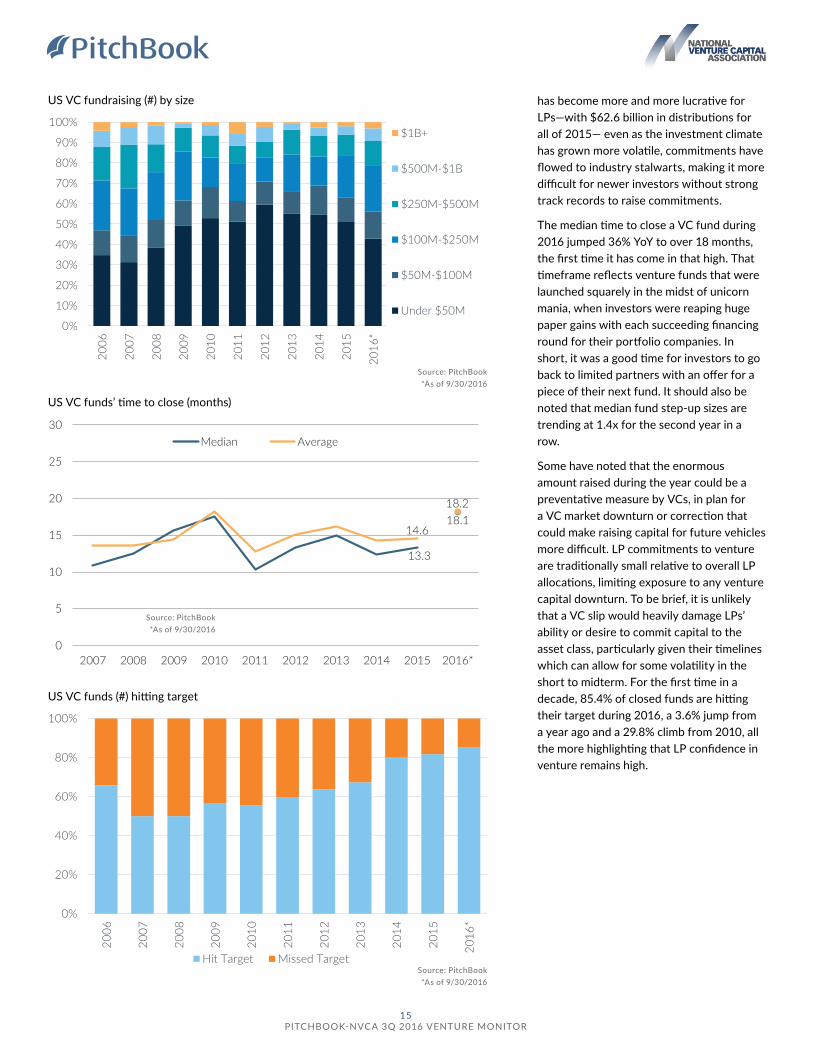
has become more and more lucrative for LPs—with $62.6 billion in distributions for all of 2015— even as the investment climate has grown more volatile, commitments have flowed to industry stalwarts, making it more difficult for newer investors without strong track records to raise commitments.
The median time to close a VC fund during 2016 jumped 36% YoY to over 18 months, the first time it has come in that high. That timeframe reflects venture funds that were launched squarely in the midst of unicorn mania, when investors were reaping huge paper gains with each succeeding financing round for their portfolio companies. In short, it was a good time for investors to go back to limited partners with an offer for a piece of their next fund. It should also be noted that median fund step-up sizes are trending at 1.4x for the second year in a row.
Some have noted that the enormous amount raised during the year could be a preventative measure by VCs, in plan for a VC market downturn or correction that could make raising capital for future vehicles more difficult. LP commitments to venture are traditionally small relative to overall LP allocations, limiting exposure to any venture capital downturn. To be brief, it is unlikely that a VC slip would heavily damage LPs’ ability or desire to commit capital to the asset class, particularly given their timelines which can allow for some volatility in the short to midterm. For the first time in a decade, 85.4% of closed funds are hitting their target during 2016, a 3.6% jump from a year ago and a 29.8% climb from 2010, all the more highlighting that LP confidence in venture remains high.
Source: PitchBook*As of 9/30/2016
Source: PitchBook*As of 9/30/2016
Source: PitchBook*As of 9/30/2016
US VC fundraising (#) by size
0%
10%
20%
30%
40%
50%
60%
70%
80%
90%
100%
2006
2007
2008
2009
2010
2011
2012
2013
2014
2015
2016
*
$1B+
$500M-$1B
$250M-$500M
$100M-$250M
$50M-$100M
Under $50M
US VC funds’ time to close (months)
US VC funds (#) hitting target
13.3
18.114.6
18.2
0
5
10
15
20
25
30
2007 2008 2009 2010 2011 2012 2013 2014 2015 2016*
Median Average
0%
20%
40%
60%
80%
100%
2006
2007
2008
2009
2010
2011
2012
2013
2014
2015
2016
*
Hit Target Missed Target
15 PITCHBOOK-NVCA 3Q 2016 VENTURE MONITOR
Keiretsu Forum 26
Keiretsu Capital 10
Innovation Works 9
500 Startups 6
Liquid 2 Ventures 6
SOSV 5
Y Combinator 5
Greycroft Partners 4
Social Capital 4
StartX 4
Compound Ventures 3
Eniac Ventures 3
General Catalyst Partners 3
Greylock Partners 3
Haystack Partners 3
Kapor Capital 3
Lerer Hippeau Ventures 3
Lightbank 3
Techstars 3
The JumpFund 3
New Enterprise Associates 13
Greycroft Partners 10
GV 10
Khosla Ventures 8
SV Angel 8
500 Startup 6
Accel Partners 6
First Round Capital 6
New Enterprise Associates 7
Battery Ventures 6
Bessemer Venture Partners 6
Comcast Ventures 6
GE Ventures 6
GV 6
Sequoia Capital 6
Andreessen Horowitz 4
Canaan Partners 4
Charles River Ventures 4
EDB Investments 4
Index Ventures 4
Kleiner Perkins Caufield & Byers 4
Norwest Venture Partners 4
Wilson Sonsini Goodrich & Rosati 47
Cooley 42
Gunderson Dettmer 34
DLA Piper 26
Orrick Herrington & Sutcliffe 20
Latham & Watkins 8
WilmerHale 8
Morrison & Foerster 7
Goodwin Procter 5
Morgan, Lewis & Bockius 5
Andrews Kurth 3
O’Melveny & Myers 3
Perkins Coie 3
Most active investorsAngel/seed
Most active investorsEarly stage
Most active investorsLate stage
Most active law firmsEarly stage
Most active law firmsLate stage
Source: PitchBook
Source: PitchBook
Source: PitchBook
Source: PitchBook
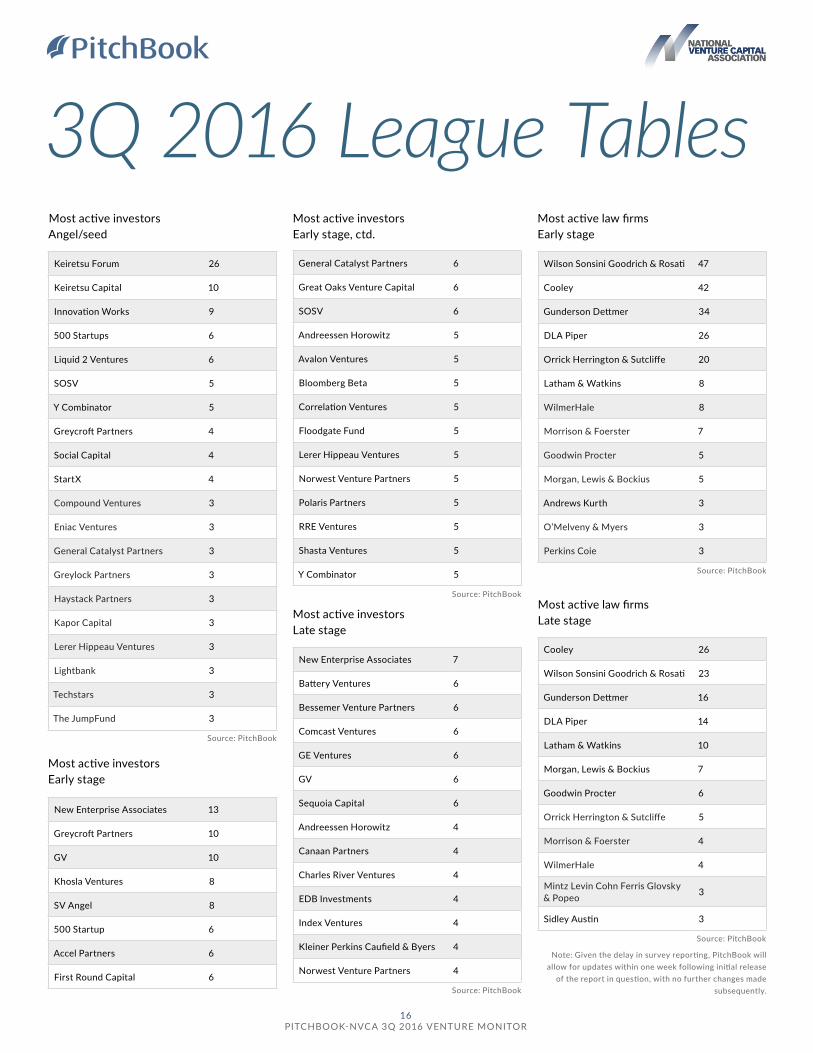
3Q 2016 League Tables
Cooley 26
Wilson Sonsini Goodrich & Rosati 23
Gunderson Dettmer 16
DLA Piper 14
Latham & Watkins 10
Morgan, Lewis & Bockius 7
Goodwin Procter 6
Orrick Herrington & Sutcliffe 5
Morrison & Foerster 4
WilmerHale 4
Mintz Levin Cohn Ferris Glovsky & Popeo 3
Sidley Austin 3
Source: PitchBook
General Catalyst Partners 6
Great Oaks Venture Capital 6
SOSV 6
Andreessen Horowitz 5
Avalon Ventures 5
Bloomberg Beta 5
Correlation Ventures 5
Floodgate Fund 5
Lerer Hippeau Ventures 5
Norwest Venture Partners 5
Polaris Partners 5
RRE Ventures 5
Shasta Ventures 5
Y Combinator 5
Most active investorsEarly stage, ctd.
Note: Given the delay in survey reporting, PitchBook will allow for updates within one week following initial release
of the report in question, with no further changes made subsequently.
16 PITCHBOOK-NVCA 3Q 2016 VENTURE MONITOR
Top 10 largest US venture financings in 3Q 2016
Source: PitchBook
Company Deal size ($M) Series/Stage Date HQ City State Industry
Moderna $474 Late Stage 9/7/2016 Cambridge MA Pharma & Biotech
Solar Mosaic $220 Series C 8/17/2016 Oakland CA Other Financial Services
Zoox $200 Series A 7/1/2016 Menlo Park CA Transportation
FreshDirect $189 Late Stage 9/26/2016 Long Island City NY Retail
Carbon (3D Printing Technology) $181 Series C 9/15/2016 Redwood City CA Commercial Products
Unity Technologies $181 Series C 7/13/2016 San Francisco CA Software
StackPath $180 Series A 7/25/2016 Dallas TX Software
Compass Therapeutics $170 Series A 9/21/2016 Cambridge MA Pharma & Biotech
MetroMile $153 Series D 9/21/2016 San Francisco CA Insurance
DraftKings $153 Late Stage 9/1/2016 Boston MA Software
Top 10 largest US venture funds closed in 3Q 2016
Investor Fund Fund size ($M) Close date State
Technology Crossover Ventures TCV IX $2,500 8/1/2016 CA
Thrive Capital Thrive Capital Partners V $700 7/18/2016 NY
Bain Capital Ventures Bain Capital Venture Fund 2016 $600 7/8/2016 MA
Foundry Group Foundry Group Next $500 9/19/2016 CO
8 | partners Eight Partners VC Fund I $420 7/13/2016 CA
True Ventures True Ventures V $310 8/25/2016 CA
Drive Capital Drive Capital Fund II $300 8/31/2016 OH
Edison Partners Edison Partners VIII $275 7/6/2016 NJ
Danhua Capital Danhua Capital II $255 8/26/2016 CA
Volition Capital Volition Capital Fund III $250 7/26/2016 MA
Top five largest IPOs of US-based companies in 3Q 2016
Company Total raised ($M) Post-valuation ($M) Date HQ City State Industry
Nutanix $238 $2,196 9/30/2016 San Jose CA Software
Apptio $96 $597 9/22/2016 Bellevue WA Software
Talend $95 $503 7/29/2016 Redwood City CA Software
Protagonist Therapeutics $90 $196 8/11/2016 Milpitas CA Pharma & Biotech
Everbridge $90 $323 9/16/2016 Glendale CA Software
Top five largest mergers and acquisitions of US-based companies in 3Q 2016
Company Deal size ($M) Date HQ City State Industry
Jet $3,300 9/19/2016 Hoboken NJ Retail
Afferent Pharmaceuticals $1,250 7/29/2016 San Mateo CA Pharma & Biotech
Dollar Shave Club $1,000 8/10/2016 Santa Monica CA Consumer Non-Durables
Telogis $900 8/1/2016 Aliso Viejo CA Software
Quip $750 8/8/2016 San Francisco CA Software
Source: PitchBook
Source: PitchBook
Source: PitchBook
17 PITCHBOOK-NVCA 3Q 2016 VENTURE MONITOR
San Francisco-Oakland-Fremont, CA 308
New York-Northern New Jersey-Long Island, NY-NJ-PA 199
Boston-Cambridge-Quincy, MA-NH 123
San Jose-Sunnyvale-Santa Clara, CA 116
Los Angeles-Long Beach-Santa Ana, CA 102
Seattle-Tacoma-Bellevue, WA 71
San Diego-Carlsbad-San Marcos, CA 49
Washington-Arlington-Alexandria, DC-VA-MD-WV 49
Chicago-Naperville-Joliet, IL-IN-WI 46
Austin-Round Rock, TX 37
Metropolitan Statistical Area (MSA) activity in 3Q 2016
Source: PitchBook
Source: PitchBook
State Congressional District
Deal count
California 12 148
New York 12 100
California 18 63
California 14 51
California 17 43
New York 10 41
Washington 7 35
California 33 32
Massachusetts 7 32
California 52 22
Massachusetts 5 22
California 13 20
Illinois 7 19
Massachusetts 8 18
Colorado 1 17
Colorado 2 16
California 15 14
California 49 13
Virginia 11 12
California 37 11
Texas 21 11
California 24 10
Texas 10 10
Virginia 10 10
States & territories by VC activity in 3Q 2016
State Deal count
California 612
New York 198
Massachusetts 124
Texas 108
Washington 78
Colorado 58
Illinois 53
Florida 49
Pennsylvania 46
Virginia 38
North Carolina 36
Georgia 33
Maryland 29
Ohio 29
Utah 26
Oregon 24
Tennessee 21
Connecticut 19
Indiana 19
New Jersey 19
Michigan 18
Arizona 16
Minnesota 14
Wisconsin 14
Alabama 11
Missouri 11
Kentucky 10
South Carolina 10
District of Columbia 9
Iowa 8
Delaware 7
Kansas 7
Rhode Island 6
Vermont 6
Congressional Districts by VC activity in 3Q 2016
State Deal count
Louisiana 5
Montana 5
Nevada 5
New Hampshire 5
Arkansas 4
Maine 3
Hawaii 2
Idaho 2
Mississippi 2
New Mexico 2
West Virginia 2
Alaska 1
Nebraska 1
North Dakota 1
Oklahoma 1
Puerto Rico 1
South Dakota 1
States & territories by VC activity in 3Q 2016, ctd.
Source: PitchBook
18 PITCHBOOK-NVCA 3Q 2016 VENTURE MONITOR

MethodologyFundraising We define venture capital funds as pools of capital raised for the purpose of investing in the equity of startup companies. In addition to funds raised by traditional venture capital firms, PitchBook also includes funds raised by any institution with the primary intent stated above. Funds identifying as growth-stage vehicles are classified as PE funds and are not included in this report. A fund’s location is determined by the country in which the fund is domiciled, if that information is not explicitly known, the HQ country of the fund’s general partner is used. Only funds based in the United States that have held their final close are included in the fundraising numbers. The entirety of a fund’s committed capital is attributed to the year of the final close of the fund. Interim close amounts are not recorded in the year of the interim close.
Deals We include equity investments into startup companies from an outside source. Investment does not necessarily have to be taken from an institutional investor. This can include investment from individual angel investors, angel groups, seed funds, venture capital firms, corporate venture firms, and corporate investors. Investments received as part of an accelerator program are not included, however, if the accelerator continues to invest in follow-on rounds, those further financings are included. All financings are of companies headquartered in the US. Angel/seed: We define financings as angel rounds if there are no PE or VC firms involved in the company to date and we cannot determine if any PE or VC firms are participating. In addition, if there is a press release that states the round is an angel round, it is classified as such. Finally, if a news story or press release only mentions individuals making investments in a financing, it is also classified as angel. As for seed, when the investors and/or press release state that a round is a seed financing, or it is for less than $500,000 and is the first round as reported by a government filing, it is classified as such. If angels are the only investors, then a round is only marked as seed if it is explicitly stated. Early-stage: Rounds are generally classified as Series A or B (which we typically aggregate together as early stage) either by the series of stock issued in the financing or, if that information is unavailable, by a series of factors including: the age of the company, prior financing history, company status, participating investors, and more. Late-stage: Rounds are generally classified as Series C or D or later (which we typically aggregate together as late stage) either by the series of stock issued in the financing or, if that information is unavailable, by a series of factors including: the age of the company, prior financing history, company status, participating investors, and more. Growth equity: Rounds must include at least one investor tagged as growth/expansion, while deal size must either be $15 million or more (although rounds of undisclosed size that meet all other criteria are included). In addition, the deal must be classified as growth/expansion or later-stage VC in the PitchBook Platform. If the financing is tagged as late-stage VC it is included regardless of industry. Also, if a company is tagged with any PitchBook vertical, excepting manufacturing and infrastructure, it is kept. Otherwise, the following industries are excluded from growth equity financing calculations: buildings and property, thrifts and mortgage finance, real estate investment trusts, and oil & gas equipment, utilities, exploration, production and refining. Lastly, the company in question must not have had an M&A event, buyout, or IPO completed prior to the round in question. Corporate venture capital: Financings classified as corporate venture capital include rounds that saw both firms investing via established CVC arms or corporations making equity investments off balance sheets or whatever other non-CVC method actually employed.
Exits We include the first majority liquidity event for holders of equity securities of venture-backed companies. This includes events where there is a public market for the shares (IPO) or the acquisition of majority of the equity by another entity (corporate or financial acquisition). This does not include secondary sales, further sales after the initial liquidity event, or bankruptcies. M&A value is based on reported or disclosed figures, with no estimation used to assess the value of transactions for which the actual deal size is unknown.
19 PITCHBOOK-NVCA 3Q 2016 VENTURE MONITOR
Why we teamed up Meet the PitchBook-NVCA Venture MonitorNVCA is recognized as the go-to organization for
venture capital advocacy, and the statistics we
release are the industry standard. PitchBook is
the leading data software provider for venture
capital professionals, serving more than 1,800
clients across the private market. Our partnership
with PitchBook empowers us to unlock more
insights on the venture ecosystem and better
advocate for an ever-evolving industry.
A brand-new, quarterly report that
details venture capital activity
and delivers insights to inform your
investment strategy. PitchBook’s
data will also bolster our
year-in-review publication.
The PitchBook Platform
Help us help you
More data. Less dough.
T H E P E R K S O F P A R T N E R S H I P
As an NVCA member, your free access to the
PitchBook Platform includes five advanced
searches and five profile views per month.
We will email quarterly surveys to each
member firm, which will give you the
opportunity to report your activity to
PitchBook. The data you provide will
not only power PitchBook-NVCA reports,
but also ensure your firm is represented
accurately in the PitchBook Platform. If
you’d like to send your quarterly activity
report directly to PitchBook, email
Our members get 10% off a new subscription
to the PitchBook Platform (up to a
$10,000 value) or one free, additional seat.
If your firm was a PitchBook client prior
to September 14, 2016, you’re eligible for
one of these discounts the next time you
renew your contract.
The 411 on the PitchBook and National Venture Capital Association (NVCA) partnership
Fundraise faster with targeted searches for limited partners who will likely be interested in your fund.
Conduct better due diligence by diving deep into a company’s round-by-round financing history, executive team and market traction.
Price deals with confidence using pre- and post-money valuations, public and private comps, cap tables and series terms.
Find promising investors quickly by zeroing in on other firms or strategic acquirers whose investment preferences match your portfolio company.
PitchBook Data, Inc. | 206.623.1986 | pitchbook.com/nvca National Venture Capital Association | 202.864.5920 | nvca.org
Ready to get started with the PitchBook Platform? Go to pitchbook.com/nvca