3.FIW-Special Offshoring and Labour Markets final FIW Special Offshoring and Labour Markets 1....
32
3 rd FIW Special - International Economics Offshoring and Labour Markets Author: Neil Foster (wiiw) This report considers the impact of offshoring on labour markets. The report begins by surveying the em- pirical literature linking offshoring activities to changes in employment and the relative wage and em- ployment of high- to low-skilled workers. The report moves on to consider recent developments in off- shoring activities and in labour markets for a sample of 40 developing and developed countries. Based on these developments the report draws conclusions on the likely developments in offshoring and its impact on labour markets.
Transcript of 3.FIW-Special Offshoring and Labour Markets final FIW Special Offshoring and Labour Markets 1....

3rd FIW Special - International Economics
Offshoring and Labour Markets
Author: Neil Foster (wiiw)
This report considers the impact of offshoring on labour markets. The report begins by surveying the em-
pirical literature linking offshoring activities to changes in employment and the relative wage and em-
ployment of high- to low-skilled workers. The report moves on to consider recent developments in off-
shoring activities and in labour markets for a sample of 40 developing and developed countries. Based
on these developments the report draws conclusions on the likely developments in offshoring and its
impact on labour markets.

1 FIW Special
Offshoring and Labour Markets
1. Introduction
The ongoing process of globalisation has seen the increasing frequency and extent of inter-
national outsourcing – or offshoring – of production1, involving the contracting out of activities
that were previously performed within a production unit to foreign subcontractors. Such off-
shoring is expected to bring about gains for consumers and producers, through lower costs
and prices, and through a more efficient allocation of resources. Productivity at the aggre-
gate level may also improve if offshoring leads to the creation of new firms and the destruc-
tion of old ones, or if offshoring is associated with enhanced technology diffusion and knowl-
edge spillovers. By creating linkages between economies we may also expect that offshoring
can increase the extent of business cycle co-movement, as well as providing a means of
smoothing business cycle volatility in countries in offshoring countries. Despite these benefits
there are concerns that the costs of offshoring may fall disproportionately on workers and in
the developed world at least on low-skilled workers in particular.
One of the most pervasive features of the labour market has been the rising demand for
skilled workers relative to unskilled workers in Europe and the United States (Autor and Dorn,
2009). Despite a concomitant increase in the supply of skilled workers, relative wages of skilled
workers have risen in almost all industries. These empirical regularities began to be noticed in
the early 1990s, particularly in the USA, and lead to a literature that developed throughout
the 1990s considering the impact of offshoring on labour markets. Figure 1 for example, which
is from Feenstra (2010), shows how relative wages (i.e. the ratio of high-skilled to low-skilled
wages) and relative employment (i.e. the ratio of high-skilled to low-skilled employment) de-
veloped in the USA over the period 1979-1990.2 What we observe is a tendency for the rela-
tive wage and relative employment of high-skilled workers to increase. This positive co-
movement of relative employment and wages suggests that a shift of the demand curve for
high-skilled labour has taken place resulting in a shift along the supply curve, as depicted in
Figure 1. This pattern was subsequently found for other (developed and developing) countries
and lead to a great deal of effort expended in order to understand the causes of this relative
decline.
1) In what follows we consider offshoring to involve the importation of intermediate goods (including raw materials). This is a broader
definition to that employed by the OECD which also includes FDI, but is narrower than that used in the business literature which con-
centrates on the contracting out of activities.
2) More precisely the figure reports the values for production and non-production workers.

2 FIW Special
Figure 1: Plot of Relative Wages against Relative Employment in the USA (1979-1990)
Source: Feenstra, (2010)
At the same time as these changes have been witnessed in the labour market, the ongoing
globalisation process has seen the increasing frequency of offshoring. An important ongoing
research question of direct policy relevance is the issue of whether increased offshoring is a
cause of the rising demand for skilled workers in advanced countries or whether some unre-
lated factor can explain these changes. Two factors are usually considered as possible ex-
planations for these changes in relative labour demand. The first explanation was that the
shift in demand was caused by skill-biased technological change, due to the increase in the
use of computers and other advanced technology (see Berman et al, 1994 and 1998; Law-
rence and Slaughter, 1993). The second explanation put forward was that the change in rela-
tive labour demand occurred due to the forces of globalisation, and in particular to offshor-
ing of low-skilled jobs to other countries.
The establishment of international production networks associated with offshoring generates
trade in intermediates, as has been shown by Campa and Goldberg (1997), Hummels et al
(2001) and Yeats (2001). While this would be expected to affect the composition of interna-
tional trade it may also change the pattern of trade, as firms look to source intermediates
from low cost suppliers. In the international trade literature one of the main driving forces be-
hind production offshoring is the existence of differences in factor prices across national bor-
ders (e.g. Feenstra and Hanson, 1996; Kohler, 2004). Offshoring differs importantly from import
penetration in final goods in the sense that it explicitly takes into account the extent to which
firms move production (and service) activities abroad. Labour demand is therefore likely to
be affected not only in import-competing industries, but also in all industries that use foreign
inputs and services. The impact of offshoring on the labour market may not be limited to

3 FIW Special
changing labour demands between industries therefore, but may also affect the relative
demand for labour within industries.3 In particular, unskilled labour-intensive stages of produc-
tion tend to be shifted to unskilled labour-abundant developing countries, while more tech-
nologically advanced stages remain in skilled labour-abundant developed countries. Pro-
duction offshoring has lead to the fear in developed countries especially that outsourcing will
tend to reduce the demand for relatively unskilled workers therefore, resulting in either falling
wages of unskilled labour and/or increased unemployment of unskilled labour. From a theo-
retical perspective however, it is by no means clear that this will be the case in a general
equilibrium setting (e.g. Jones and Kierzkowski, 2001; Kohler, 2004). It remains an open and
empirical question therefore as to whether offshoring is a large enough activity to have an
adverse effect on labour market outcomes. As we will see below, the empirical literature has
not been able to provide clear answers to whether offshoring impacts upon labour markets
or on the relative importance of offshoring versus skill-biased technological change.
To an extent the debate and discussion of the causes of the rising employment and wage
shares of high-skilled labour in the 1990s diminished somewhat in the early 2000s, though there
remain concerns regarding the potential impact of offshoring on labour markets, with a
number of recent empirical papers addressing various aspects of the offshoring and labour
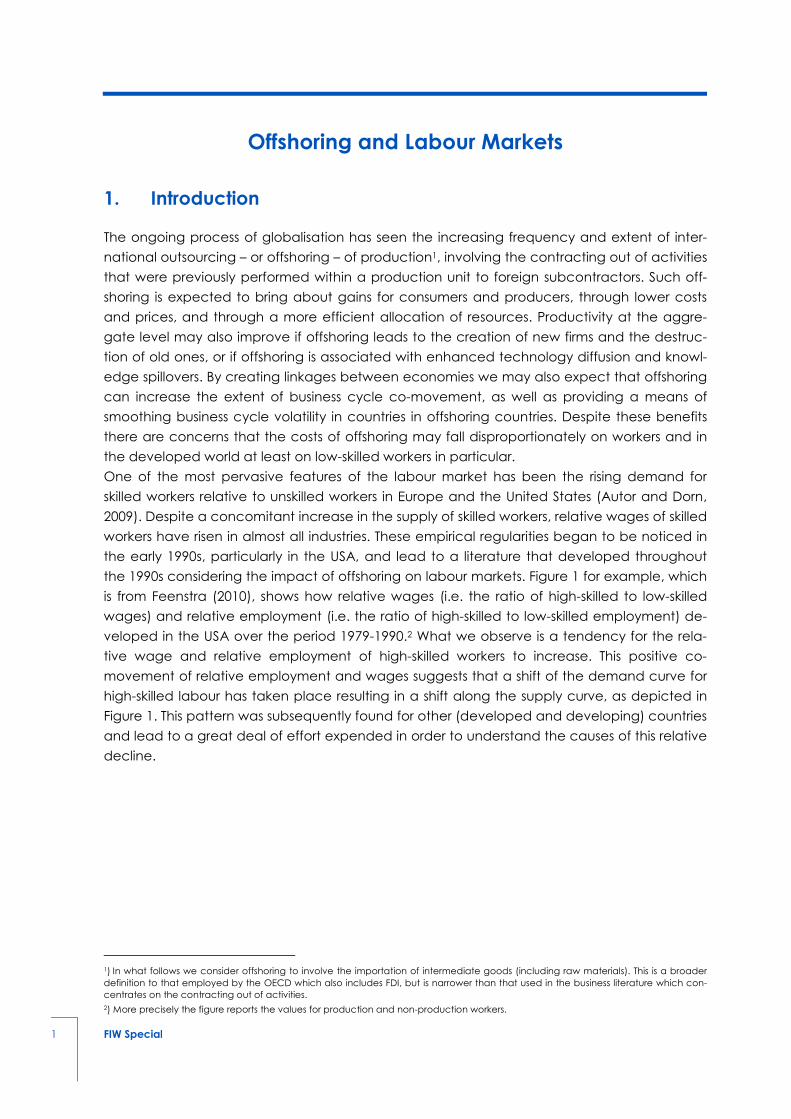
markets debate.4 The continued and renewed interest in this topic has arisen for a number of
reasons. One reason is that since the early 1990s the clear pattern of rising relative wages and
employment of high-skilled labour has tended to become blurred. Figure 2 (again from Feen-
stra, 2010) plots relative wages and employment for the USA from 1990 to 2001, with the data
showing that while relative wages have tended to rise over this period there has been some
decline in the share of high-skilled workers in total employment. A further reason for the re-
newed interest in this topic is that there is some evidence to suggest that the declining rela-
tive wages and employment of low-skilled workers in the developed world have also begun
to become a feature of the relative wages and employment of medium-skilled workers.
3) With heterogeneous firms we may also observe such an effect through reallocation effects within industries towards more produc-
tive firms, which tend to have a larger skilled workforce.
4) Feenstra (2010) for example notes that “The impact of trade on wages after 2000 has received scant attention from trade econo-
mists, and this shortcoming deserves to be rectified” (p. 104).
4 FIW Special
Figure 2: Plot of Relative Wages against Relative Employment in the USA (1990-2001)
Source: Feenstra, (2010)
In this report we concentrate on the impact of offshoring on labour markets, surveying the ex-
isting empirical literature linking offshoring to wages and employment, and providing informa-
tion on recent developments in labour markets and in offshoring for a large number of devel-
oped and developing countries. We begin in the next section (Section 2) by reviewing the
empirical literature that looks to link international trade and offshoring in particular to devel-
opments in labour markets. We then move on to present data from the recently compiled
World Input-Output Database describing recent developments in the extent of offshoring
(Section 3) and in labour markets (Section 4) in a sample of 40 developed and developing
countries. Finally, we look in Section 5 to link existing results on the relationship between off-
shoring and labour markets to the recent developments in offshoring activity and look to
draw conclusions on the likely future developments in offshoring and its likely impact on la-
bour markets.
2. Existing Evidence on the Impact of Offshoring on Labour
Markets
This section reviews and surveys some of the literature linking offshoring to various aspects of
the labour market.5 The discussion of the existing literature is split into two sub-sections. In the
first sub-section we discuss studies examining the relationship between measures of offshoring
5) Some aspects, such as labour standards and working conditions, are not covered in this review. See Robertson et al (2009) for ex-
tensive coverage of these issues.

5 FIW Special
and employment levels, while the second section reviews studies considering the impact of
offshoring on average and relative wages.
2.1 Offshoring and Employment
From a theoretical perspective there are two main effects of offshoring on employment in the
offshoring country. The first is a ‘technology effect’ that reflects the destruction of jobs that
occurs when firms relocate part of their production activities overseas. The second is a ‘scale
effect’ that captures the creation of jobs following the expansion in industry output that may
arise as a result of the productivity gains from offshoring. A third indirect ‘substitution effect’
may also be relevant, in which offshoring affects domestic sub-contracting relationships, thus
leading to a negative impact on employment in other domestic sectors (Cappariello, 2010).
Such an effect would imply that there would be negative employment effects on an industry
of offshoring in other domestic industries. An alternative view (Arndt, 1997) would suggest that
the positive scale effect of offshoring may lead to increased demand for intermediate goods
from the domestic economy also, which may offset this indirect ‘substitution effect’.
There is a fairly large empirical literature considering whether trade liberalisation and open-
ness – broadly defined – impacts upon employment levels, and a smaller literature concen-
trating on the effects of offshoring more specifically. In terms of the former literature Wacziarg
and Wallack (2004) for a number of developed and transition countries, Revenga (1997) for
Mexico, Milner and Wright (1998) for Mauritius and Currie and Harrison (1997) for Morocco
among others find either no effect or a small negative effect of trade liberalisation on em-
ployment.6 Biscourp and Kramarz (2007) concentrate on the impact of imports of mainly fin-
ished goods in France and find a strong relationship between imports and the destruction of
jobs, with the effects being larger for final goods imports than for intermediates.
Recent studies on the impact of offshoring on the level of employment include Hijzen and
Swaim (2007) who examine the relationship between offshoring and industry employment us-
ing data on 17 high-income OECD countries for 1995 and 2000. They distinguish between nar-
row- and broad offshoring7 and find that offshoring has no effect or a slight positive effect on
sectoral employment. Narrow offshoring is found to reduce the labour-intensity of production,
but not the overall level of employment, while broad offshoring does not affect labour-
intensity but has a positive effect on overall sectoral employment. This contrasts with the re-
sults of OECD (2007) who find that offshoring lowers the conditional and unconditional de-
mand for labour in OECD countries.
Some recent studies also consider the possibility of heterogeneity in the impact of offshoring
on employment. Falk and Wolfmayr (2005) for example, examine the impact of offshoring to
low-wage countries on employment for seven EU countries over the period 1995-2000. They
find that importing intermediates from the same industry from low-wage countries has a
negative and significant impact on total employment. When splitting their sample of indus-
tries into low- and high-skill intensity industries they find that while the employment effects of
offshoring are negative and significant in low-skill intensity industries, they are not significant in
high-skill intensive industries. Cadarso et al (2008), on the other hand, find in the case of Spain
that a significant negative impact of offshoring on employment is found only in the case of
6) Much of this literature is surveyed by Winters et al (2004).
7) Narrow offshoring refers to offshoring that takes place within an industry, while broad offshoring refers to intermediate imports from
all industries.

6 FIW Special
narrow offshoring in medium- and high-tech industries and only when inputs come from Cen-
tral and Eastern European countries. Foster et al (2012) use the WIOD database to examine
the impact of offshoring on employment levels for 40 countries over the period 1995-2008. Es-
timating a set of labour demand equations in a manner similar to Hijzen and Swaim (2007)
they also allow for heterogeneity across industry-types (manufacturing and services, and low-,
medium- and high-tech industries) and across geographical regions (EU15, EU12, China, USA,
Other developed and other). Similar to Hijzen and Swaim (2007) they find that the overall im-
pact of offshoring on employment levels is limited, though this general result hides many dif-
ferences across regions and industry types, with some evidence existing to suggest that off-
shoring can have overall negative employment effects on different types of labour and for
different types of – usually manufacturing – industries.
2.2 Offshoring and Wages
The majority of the literature considering the impact of trade, and offshoring specifically, on
wages concentrates on the issue of relative wages, with the impact of trade on absolute
wages addressed in only a small number of studies. One such study is Rama (2003) who em-
ploys data on a large number of countries and finds that there tends to be a negative and
significant relationship between a variety of trade openness and policy variables and wages,
while inward FDI is found to have a positive relationship with wages. Considering the possibility
of a dynamic relationship however Rama finds that the negative impact of trade variables on
wages only arises in the short-run, with the effect turning positive after a number of years.
Discussion of the effects of trade on relative wages is often couched in terms of the Stolper-
Samuelson theorem. This states that a rise in the price of a good will increase the return to the
factor used intensively in the production of that good. For a country well endowed with skilled
labour therefore, an increase in openness would be expected to increase the returns to
skilled labour, resulting in an increase in the wage gap. When considering general measures
of openness and trade liberalisation a number of studies (e.g. Hanson and Harrison, 1999; At-
tanasio et al, 2004; Currie and Harrison, 1997; and Pavcnik et al, 2004) find that measures of
trade protection disproportionately protected unskilled labour in their analyses of developing
countries. Given this it is unsurprising that liberalisation in these countries was associated with
declining relative wages for unskilled labour. Other studies argue that the impact of trade is
likely to be limited. Goldberg and Pavcnik (2005) argue that for trade to play a role it must be
that one observes a movement in employment from contracting to expanding sectors, yet
few studies find such shifts in employment.
Much of the literature considering the relationship between offshoring and relative wages is
summarised in Feenstra and Hanson (2001). Here we provide brief details on these studies
along with results from more recent studies. There are a number of empirical studies examin-
ing the impact of production offshoring on the demand for skilled labour in developed coun-
tries, examples including Feenstra and Hanson (1996) for the US, Falk and Koebel (2002) for
Germany, Strauss-Kahn (2003) for France and Hijzen et al (2005) for the UK. The results tend to
indicate that offshoring has had a negative impact on the demand for unskilled labour, with
one or two exceptions. Feenstra and Hanson (1996) for example consider the case of the
USA, regressing the change in the non-production wage share on the change in the log capi-
tal-output ratio, the change in log output and the change in offshoring. They find that for the
later period in their dataset (i.e. 1979-1990) offshoring contributed around 31 percent of the

7 FIW Special
increase in the nonproduction wage that occurred in the 1980s. Falk and Koebel (2002) use
data for 26 German industries over the period 1978-1990. With their data they estimate a sys-
tem of seven equations, one for each type of variable cost (different types of labour and ma-
terials). Their results provide little support for substitution effects between different types of la-
bour and imported materials, with the increase in imported materials being driven by higher
output growth rather than input substitution. Hijzen et al (2005) also estimate a system of re-
gressions for three different types of labour and materials using data on UK manufacturing in-
dustries over the period 1982-1986. Their results indicate a large negative effect of outsourcing
on the demand for unskilled labour. Similar results to those of Hijzen et al (2005) are presented
by Strauss-Kahn (2003) for France.
Despite these results the consensus view of empirical economists is that while trade has
played a role in observed changes in relative labour demand it was not the major reason for
rising wage inequality in the 1980s and early 1990s. This view is based upon a number of fac-
tors. Firstly, the share of skilled workers increased within most industries (despite increased rela-
tive prices), which contrasts with the predictions of the basic Heckscher-Ohlin theory. Sec-
ondly, the demand for skilled workers was closely related to various measures of technology
such as R&D, but not with measures of trade (Autor et al., 1998). Thirdly, the volume of trade
was not large enough and not unskilled labour intensive enough to explain the large changes
in relative wages. Fourthly, calibrated general equilibrium models found only a small quantita-
tive role for trade (Borjas et al., 1997). Finally, recent research suggests that skill-biased tech-
nological change is still the main determinant of the demand for skilled workers (Michaels et
al., 2010). Krugman (2008) however, argues that trade might have become much more im-
portant in driving the demand for skilled workers in recent years due to the fast growth in im-
ports from low-skill abundant developing countries, notably China.
Box 1: On the Measurement of Offshoring
An initial issue in identifying the impact of offshoring is to decide upon the appropriate
measure of offshoring. The majority of existing studies focus on some measure of trade in
intermediates, though as Hijzen and Swaim (2007) note, this ignores the offshoring of as-
sembly activities. Hijzen et al (2005) discuss some of the data sources used in the existing
literature. One source of such data is data on outward processing trade, which is trade
based on customs arrangements in which complete tariff exemptions or partial levy reduc-
tions are granted in accordance to the domestic input content of imported goods. A sec-
ond source of data is the product classification of trade statistics, which through the use of
the Classification by Broad Economic Categories (BEC) classification, can be used to infer
the extent of trade in intermediate goods. A final source of data are input-output tables,
which allow one to measure the intermediate input purchases by each industry from each
industry, and which when combined across countries allows one to calculate the value of
intermediate inputs imported by each industry.
A further issue relates to how one defines outsourcing. Feenstra and Hanson (1996) distin-
guish between narrow and broad outsourcing, where the former considers imported in-
termediates in a given industry from the same industry only, while the latter considers im-
ported intermediates from all industries. Feenstra and Hanson (1996) prefer the narrow
definition as it is thought to be closer to the essence of fragmentation, which necessarily
takes place within the industry.1 Following Hijzen and Swaim (2007) a measure of narrow
offshoring (or intra-industry offshoring) for industry �, ���, can be calculated as:
��� =
���
(1)

8 FIW Special
where � refers to imported intermediate purchases from industry � = � by industry �, and
refers to value-added. Similarly, broad offshoring (or inter-industry offshoring) for industry �,
��� can be defined as:
��� =
∑ �������
(2)
3. Recent Developments in Offshoring Activity
In this section we describe recent developments in the extent of narrow and broad offshor-
ing. Using data from the recently compiled WIOD database8 we construct the two measures
of offshoring described in Box 1 for 40 developed and developing countries and 35 industries
for each year between 1995 and 2008.9
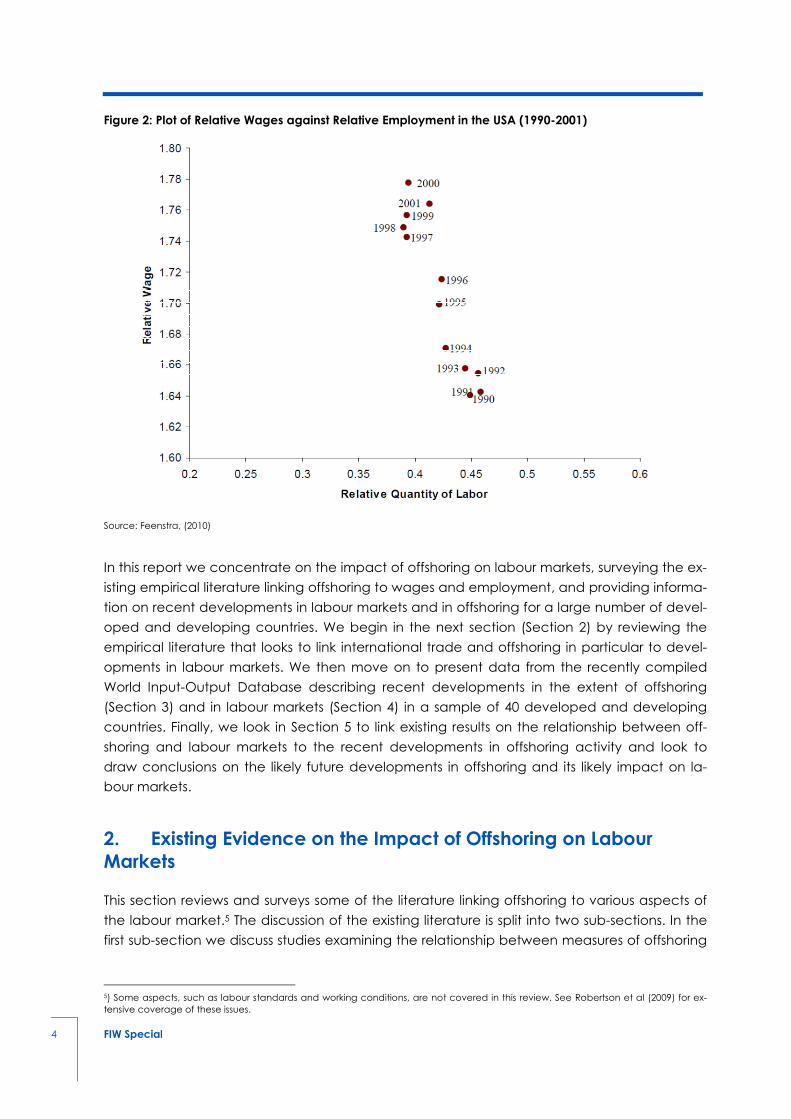
We begin the descriptive analysis by reporting in figures 3 and 4 the average values of narrow
and broad offshoring by country in 1995, the change in the values of these variables be-
tween 1995 and 2008 and the average growth rate of these variables between 1995 and
2008.10 In these figures countries are ranked by the value of the offshoring measures in 1995.
Figures 3 and 4 indicate that there is a great deal of heterogeneity in the extent of offshoring
across countries, and that during the recent past the extent of offshoring has in most cases
continued to increase. In terms of the level of narrow offshoring (Figure 3) we observe that the
levels of offshoring in 1995 were relatively large for small developed economies such as Bel-
gium, Luxembourg, Cyprus, Ireland and Malta, as one would expect, as well as for a number
of transition economies, such as Slovenia, Slovakia, the Czech Republic and Estonia. For most
other EU members the narrow measure of offshoring accounted for around 10 percent of in-
dustry value-added on average. Interestingly, the extent of narrow offshoring in the USA was
relatively low, and lower than that for fellow NAFTA members Canada and Mexico. Figure 3
further indicates that during the recent past (1995-2008) narrow offshoring has grown in the
majority of countries. Indeed, only in three cases do we observe a decline in narrow offshor-
ing between 1995 and 2008. Average growth rates of narrow offshoring have also been rela-
tively large in developing (e.g. China and Turkey) and transition (e.g. Bulgaria, Hungary, Po-
land) economies. Growth rates of narrow offshoring have been relatively low in NAFTA coun-
tries along with many other developed countries. Of the EU15 countries, Austria and Denmark
have seen relatively large increases in narrow offshoring in the recent past.
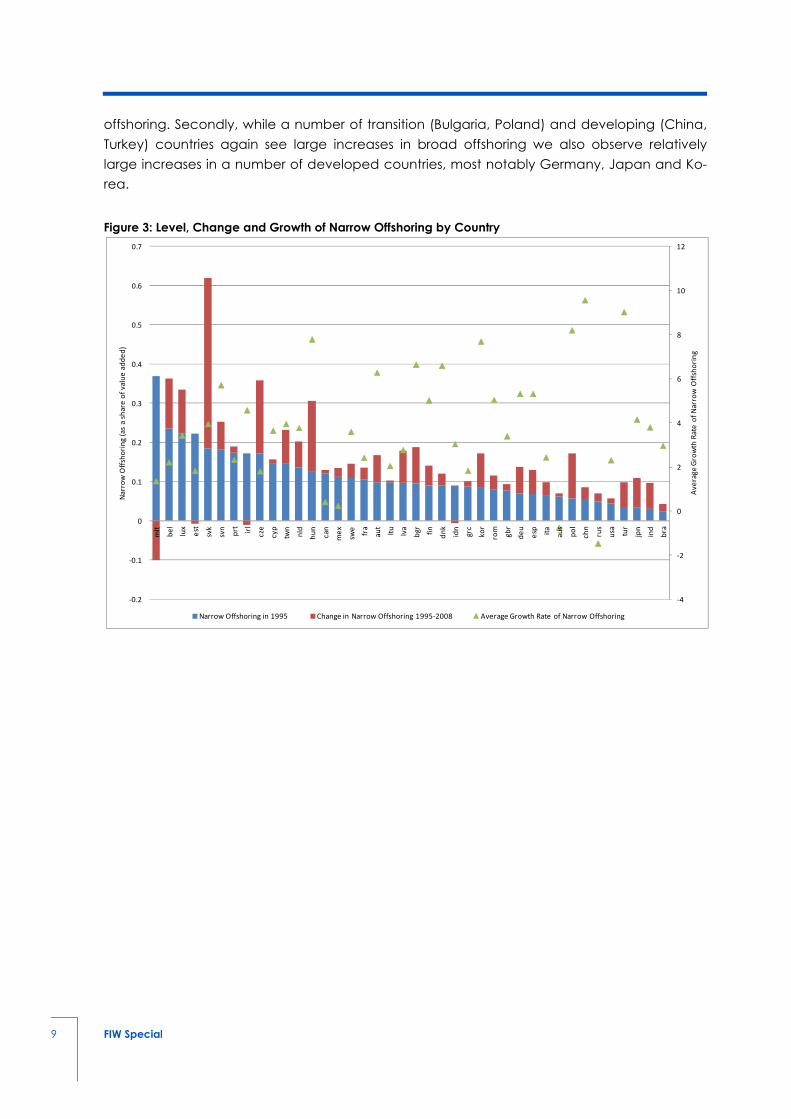
The figures for broad offshoring (Table 4) in 1995 are fairly similar to those for narrow offshoring
with small developed countries such as Belgium and Denmark and transition countries such
as Estonia, Hungary and Lithuania having the highest values for the broad offshoring meas-
ures. The USA as well as Japan report relatively low values for the broad offshoring measure in
1995. When considering changes over time we do observe some differences when com-
pared with developments in the narrow measure however. Firstly, the growth rate of broad
offshoring tends to be positive and has tended to grow at a greater rate than that for narrow
8) www.wiod.org
9) While we have data up to 2009 we choose to limit our analysis to the period 1995-2008 in order to avoid the reported large trade
effects of the financial crisis.
10) The narrow and broad measures are calculated for each industry, country and year. Average values of narrow and broad offshor-
ing for each country are constructed as the simple unweighted averages of industry values for the offshoring measures. The growth
rates of the offshoring measures are also calculated for each industry, country and year with the average growth rates reported in
the figures being the unweighted averages of the growth rates across industries and years.
9 FIW Special
offshoring. Secondly, while a number of transition (Bulgaria, Poland) and developing (China,
Turkey) countries again see large increases in broad offshoring we also observe relatively
large increases in a number of developed countries, most notably Germany, Japan and Ko-
rea.
Figure 3: Level, Change and Growth of Narrow Offshoring by Country
-4
-2
0
2
4
6
8
10
12
-0.2
-0.1
0
0.1
0.2
0.3
0.4
0.5
0.6
0.7
mlt
be
l
lux
est
svk
svn
prt irl
cze
cy
p
twn
nld
hu
n
ca
n
me
x
swe
fra
au
t
ltu
lva
bg
r
fin
dn
k
idn
grc
ko
r
rom
gb
r
de
u
esp ita
au
s
po
l
ch
n
rus
usa tu
r
jpn
ind
bra
Av
era
ge
Gro
wth
Ra
te o
f N
arr
ow
Off
sho
rin
g
Na
rro
w O
ffsh
ori
ng
(a
s a
sh
are
of
va
lue
ad
de
d)
Narrow Offshoring in 1995 Change in Narrow Offshoring 1995-2008 Average Growth Rate of Narrow Offshoring
10 FIW Special
Figure 4: Level, Change and Growth of Broad Offshoring by Country
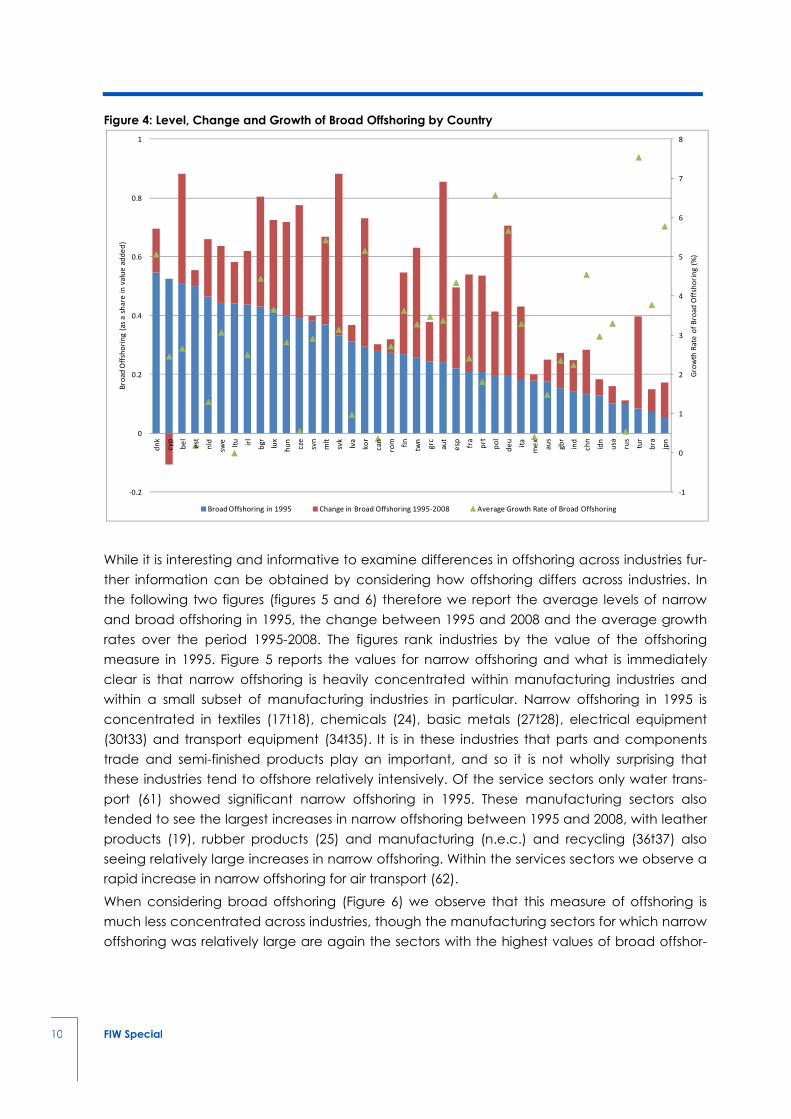
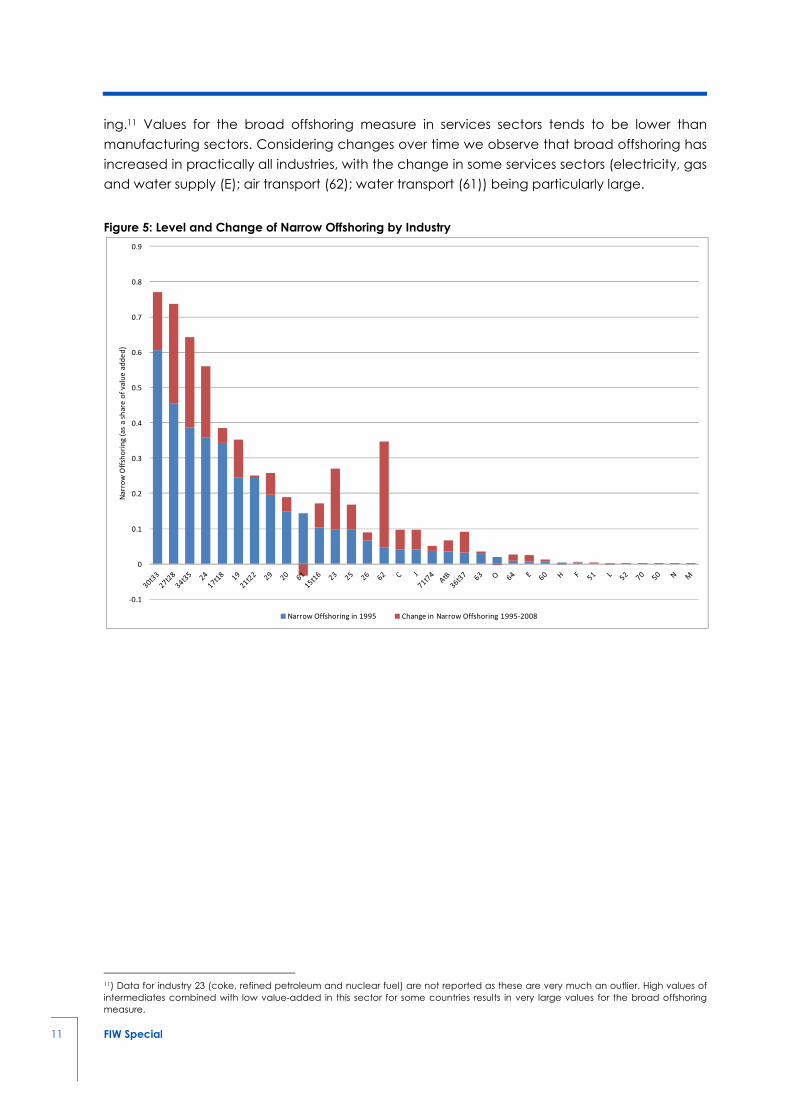
While it is interesting and informative to examine differences in offshoring across industries fur-
ther information can be obtained by considering how offshoring differs across industries. In
the following two figures (figures 5 and 6) therefore we report the average levels of narrow
and broad offshoring in 1995, the change between 1995 and 2008 and the average growth
rates over the period 1995-2008. The figures rank industries by the value of the offshoring
measure in 1995. Figure 5 reports the values for narrow offshoring and what is immediately
clear is that narrow offshoring is heavily concentrated within manufacturing industries and
within a small subset of manufacturing industries in particular. Narrow offshoring in 1995 is
concentrated in textiles (17t18), chemicals (24), basic metals (27t28), electrical equipment
(30t33) and transport equipment (34t35). It is in these industries that parts and components
trade and semi-finished products play an important, and so it is not wholly surprising that
these industries tend to offshore relatively intensively. Of the service sectors only water trans-
port (61) showed significant narrow offshoring in 1995. These manufacturing sectors also
tended to see the largest increases in narrow offshoring between 1995 and 2008, with leather
products (19), rubber products (25) and manufacturing (n.e.c.) and recycling (36t37) also
seeing relatively large increases in narrow offshoring. Within the services sectors we observe a
rapid increase in narrow offshoring for air transport (62).
When considering broad offshoring (Figure 6) we observe that this measure of offshoring is
much less concentrated across industries, though the manufacturing sectors for which narrow
offshoring was relatively large are again the sectors with the highest values of broad offshor-
-1
0
1
2
3
4
5
6
7
8
-0.2
0
0.2
0.4
0.6
0.8
1
dn
k
cy
p
be
l
est
nld
swe
ltu irl
bg
r
lux
hu
n
cze
svn
mlt
svk
lva
ko
r
ca
n
rom fin
twn
grc
au
t
esp fr
a
prt
po
l
de
u
ita
me
x
au
s
gb
r
ind
ch
n
idn
usa
rus
tur
bra
jpn
Gro
wth
Ra
te o
f B
roa
d O
ffsh
ori
ng
(%
)
Bro
ad
Off
sho
rin
g (
as
a s
ha
re i
n v
alu
e a
dd
ed
)
Broad Offshoring in 1995 Change in Broad Offshoring 1995-2008 Average Growth Rate of Broad Offshoring
11 FIW Special
ing.11 Values for the broad offshoring measure in services sectors tends to be lower than
manufacturing sectors. Considering changes over time we observe that broad offshoring has
increased in practically all industries, with the change in some services sectors (electricity, gas
and water supply (E); air transport (62); water transport (61)) being particularly large.
Figure 5: Level and Change of Narrow Offshoring by Industry
11) Data for industry 23 (coke, refined petroleum and nuclear fuel) are not reported as these are very much an outlier. High values of
intermediates combined with low value-added in this sector for some countries results in very large values for the broad offshoring
measure.
-0.1
0
0.1
0.2
0.3
0.4
0.5
0.6
0.7
0.8
0.9
Na
rro
w O
ffsh
ori
ng
(a
s a
sh
are
of
va
lue
ad
de
d)
Narrow Offshoring in 1995 Change in Narrow Offshoring 1995-2008

12 FIW Special
Figure 6: Level and Change of Broad Offshoring by Industry
Given the large number of countries and industries (as well as time periods) it is not a straight-
forward task to summarize developments in the extent of offshoring (or as we will see devel-
opments in labour markets). In much of the remainder of this report therefore we aggregate
the data to concentrate on specific regions (EU15, EU12, China, USA, Other Developed,
Other)12 and specific sectors defined according to technology intensity.13
The following two figures (figures 7 and 8) report the average levels of narrow and broad off-
shoring by region and industry-type for the period 1995-2008 along with the average growth
rates of the offshoring measures over the same period. When considering narrow offshoring
we observe that across regions narrow offshoring is concentrated in manufacturing industries,
and in particular high-tech manufacturing and to a lesser extent low-tech manufacturing. This
is to be expected since the scope for offshoring is likely to be larger for complex manufac-
tured products with a high technology content. Where narrow offshoring in services industries
is present it tends to be concentrated in medium-tech services. Considering the growth rates
we observe that in the recent past China has had the highest growth rates of narrow offshor-
ing. This tends to be true for all industry types, but is particularly pronounced for medium- and
high-tech services. The EU12 and EU15 have also witnessed relatively large growth rates in off-
shoring in the recent past, with growth rates again being highest in medium- and high-tech
services sectors. The USA on the other hand has not seen much change in the extent of off-
shoring, with the growth – where present – being again in medium- and high-tech services
12) Other developed countries are Australia, Canada, New Zealand, Korea and Taiwan, while the remaining ‘Other’ countries are Bra-
zil, India, Indonesia, Mexico, Russia and Turkey.
13) The categories are low-tech manufacturing, medium-tech manufacturing, high-tech manufacturing, low-tech services, medium-
tech services and high-tech services. The classification of industries into these categories is provided in Table A1 in the appendix.
-0.2
0
0.2
0.4
0.6
0.8
1
1.2
1.4
1.6
Bro
ad
Off
sho
rin
g (
as
a s
ha
re o
f v
alu
e a
dd
ed
)
Broad Offshoring in 1995 Change in Broad Offshoring 1995-2008

13 FIW Special
and in medium-tech manufacturing. The Other group and the Other Developed country
group have also seen relatively large increases in offshoring in medium-tech manufacturing
industries, with the growth rate of offshoring in medium-tech services industries also being
relatively large for the Other group.
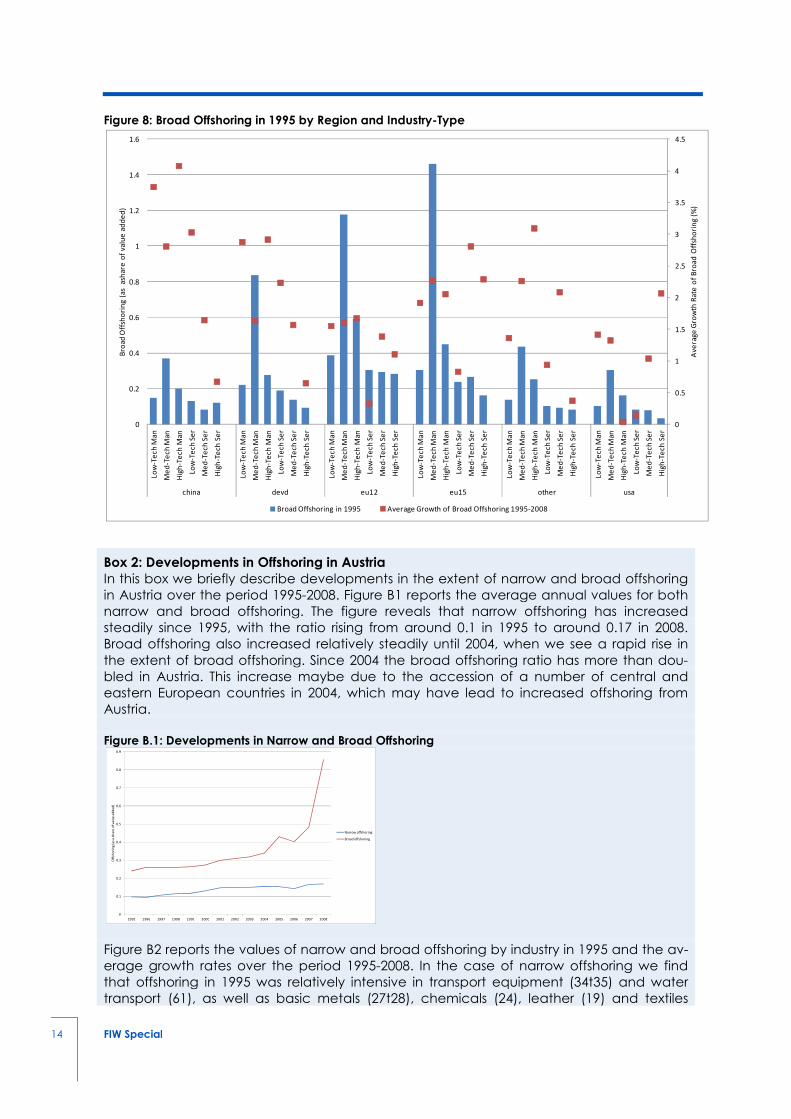
For broad offshoring the figures provide a somewhat different picture. As with the figures
above broad offshoring is more evenly spread across the different industry types, though it
tends to be largest in medium- and high-tech manufacturing industries, with lower values
found in the services sectors. Growth rates when considering the broad measure of offshoring
again look somewhat different to those for the narrow measure. Growth rates again tend to
be relatively high in China, but it is the manufacturing industries rather than the service indus-
tries that have the highest growth rates using this measure of offshoring. Growth rates are also
relatively high in EU15 countries, with offshoring in services industries again having relatively
high growth rates. Growth of broad offshoring in EU12 countries however is lower than that for
most regions, while growth is also relatively low in the USA. Where growth rates are relatively
high for these two regions they tend to be so in manufacturing industries and in medium- and
high-tech services.
Figure 7: Narrow Offshoring in 1995 by Region and Industry-Type
-2
0
2
4
6
8
10
12
14
16
0
0.1
0.2
0.3
0.4
0.5
0.6
0.7
0.8
Lo
w-T
ec
h M
an
Me
d-T
ec
h M
an
Hig
h-T
ec
h M
an
Lo
w-T
ec
h S
er
Me
d-T
ec
h S
er
Hig
h-T
ec
h S
er
Lo
w-T
ec
h M
an
Me
d-T
ec
h M
an
Hig
h-T
ec
h M
an
Lo
w-T
ec
h S
er
Me
d-T
ec
h S
er
Hig
h-T
ec
h S
er
Lo
w-T
ec
h M
an
Me
d-T
ec
h M
an
Hig
h-T
ec
h M
an
Lo
w-T
ec
h S
er
Me
d-T
ec
h S
er
Hig
h-T
ec
h S
er
Lo
w-T
ec
h M
an
Me
d-T
ec
h M
an
Hig
h-T
ec
h M
an
Lo
w-T
ec
h S
er
Me
d-T
ec
h S
er
Hig
h-T
ec
h S
er
Lo
w-T
ec
h M
an
Me
d-T
ec
h M
an
Hig
h-T
ec
h M
an
Lo
w-T
ec
h S
er
Me
d-T
ec
h S
er
Hig
h-T
ec
h S
er
Lo
w-T
ec
h M
an
Me
d-T
ec
h M
an
Hig
h-T
ec
h M
an
Lo
w-T
ec
h S
er
Me
d-T
ec
h S
er
Hig
h-T
ec
h S
er
china devd eu12 eu15 other usa
Gro
wth
Ra
te o
f N
arr
ow
Off
sho
rin
g (
%)
Na
rro
w O
fsh
ori
ng
(a
s a
sh
are
of
va
lue
ad
de
d)
Narrow Offshoring in 1995 Average Growth Rate of Narrow Offshoring 1995-2008
14 FIW Special
Figure 8: Broad Offshoring in 1995 by Region and Industry-Type
Box 2: Developments in Offshoring in Austria
In this box we briefly describe developments in the extent of narrow and broad offshoring
in Austria over the period 1995-2008. Figure B1 reports the average annual values for both
narrow and broad offshoring. The figure reveals that narrow offshoring has increased
steadily since 1995, with the ratio rising from around 0.1 in 1995 to around 0.17 in 2008.
Broad offshoring also increased relatively steadily until 2004, when we see a rapid rise in
the extent of broad offshoring. Since 2004 the broad offshoring ratio has more than dou-
bled in Austria. This increase maybe due to the accession of a number of central and
eastern European countries in 2004, which may have lead to increased offshoring from
Austria.
Figure B.1: Developments in Narrow and Broad Offshoring
Figure B2 reports the values of narrow and broad offshoring by industry in 1995 and the av-
erage growth rates over the period 1995-2008. In the case of narrow offshoring we find
that offshoring in 1995 was relatively intensive in transport equipment (34t35) and water
transport (61), as well as basic metals (27t28), chemicals (24), leather (19) and textiles
0
0.5
1
1.5
2
2.5
3
3.5
4
4.5
0
0.2
0.4
0.6
0.8
1
1.2
1.4
1.6
Lo
w-T
ec
h M
an
Me
d-T
ec
h M
an
Hig
h-T
ec
h M
an
Lo
w-T
ec
h S
er
Me
d-T
ec
h S
er
Hig
h-T
ec
h S
er
Lo
w-T
ec
h M
an
Me
d-T
ec
h M
an
Hig
h-T
ec
h M
an
Lo
w-T
ec
h S
er
Me
d-T
ec
h S
er
Hig
h-T
ec
h S
er
Lo
w-T
ec
h M
an
Me
d-T
ec
h M
an
Hig
h-T
ec
h M
an
Lo
w-T
ec
h S
er
Me
d-T
ec
h S
er
Hig
h-T
ec
h S
er
Lo
w-T
ec
h M
an
Me
d-T
ec
h M
an
Hig
h-T
ec
h M
an
Lo
w-T
ec
h S
er
Me
d-T
ec
h S
er
Hig
h-T
ec
h S
er
Lo
w-T
ec
h M
an
Me
d-T
ec
h M
an
Hig
h-T
ec
h M
an
Lo
w-T
ec
h S
er
Me
d-T
ec
h S
er
Hig
h-T
ec
h S
er
Lo
w-T
ec
h M
an
Me
d-T
ec
h M
an
Hig
h-T
ec
h M
an
Lo
w-T
ec
h S
er
Me
d-T
ec
h S
er
Hig
h-T
ec
h S
er
china devd eu12 eu15 other usa
Av
era
ge
Gro
wth
Ra
te o
f B
roa
d O
ffsh
ori
ng
(%
)
Bro
ad
Off
sho
rin
g (
as
ash
are
of
va
lue
ad
de
d)
Broad Offshoring in 1995 Average Growth of Broad Offshoring 1995-2008
0
0.1
0.2
0.3
0.4
0.5
0.6
0.7
0.8
0.9
1995 1996 1997 1998 1999 2000 2001 2002 2003 2004 2005 2006 2007 2008
Off
sho
rin
g (
as
a s
ha
re o
f v
alu
e a
dd
ed
)
Narrow offshoring
Broad offshoring

15 FIW Special
(17t18). Growth rates were particularly high in inland transport (60), post and telecommu-
nications (64), and health and social care (N). When considering broad offshoring we ob-
tain large values for offshoring of coke, refined petroleum and nuclear fuel (23) with signifi-
cant offshoring also taking place in transport equipment, rubber and plastics (25), water
transport (61) and auxiliary transport activities (63). Growth rates were high in the case of
coke, refined petroleum and nuclear fuel, post and telecommunications, air transport (62)
and electricity, gas and water supply (E).
Figure B.2: Narrow and Broad Offshoring by Industry for Austria
Narrow Offshoring Broad Offshoring
4. Developments in Labour Markets
The empirical evidence described above provides at least partial support for the view that
offshoring has some impact on labour markets, and on the wages (and employment) of low-
skilled workers in some sectors at least. The previous section further indicates that offshoring
has continued apace in the last 15 years or so. In this section we again use the WIOD dataset
to examine developments in labour markets. In particular, we consider developments in av-
erage wages and employment across industries and regions, examining whether those sec-
tors in which offshoring is more important have witnessed different developments in their la-
bour markets. Using data from the WIOD dataset we are able to consider how relative wages
and employment have developed over the period 1995-2007 for 40 developed and develop-
ing countries.14 The data further allow us to distinguish between three types of labour (low-,
medium- and high-skilled), which thus allows us to isolate developments for workers in the
middle of the wage distribution who – it is argued – have tended to lose ground to others in
recent years.
4.1 Developments in Employment
In Figure 9 we report the shares of low-, medium- and high-skilled employment in total em-
ployment in 1995 for each of the six regions considered.15 The figures are largely as one would
expect with nearly half of employment in China being made up of low-skilled employment
and only a small percentage made up of high-skilled labour. The figures for other developing
countries look fairly similar to that for China. In other regions however medium-skilled em-
ployment makes up the largest share of workers, with the shares being particularly large for
the USA and to a lesser extent the EU12. In these developed regions high-skilled workers make
14) While the data is available up to 2009 we concentrate on the data for the period 1995-2007 as there were significant changes in
the data in 2008 and 2009 due to the crisis, which may distort the general picture.
15) Employment is measured using hours worked rather than total number of employees.
-30
-20
-10
0
10
20
30
40
0
0.1
0.2
0.3
0.4
0.5
0.6
Av
era
ge
Gro
wth
ra
te (
%)
Na
rro
w o
ffsh
ori
ng
(as
a s
ha
re o
f v
alu
e a
dd
ed
)
Narrow Offshoring in 1995 Average Growth Rate of Narrow Offshoring
-10
-5
0
5
10
15
20
25
0
0.2
0.4
0.6
0.8
1
1.2
1.4
1.6
Av
era
ge
Gro
wth
Ra
te (
%)
Bro
ad
Off
sho
rin
g (
as
a s
ha
re o
f v
alu
e a
dd
ed
)
Broad offshoring in1995 Average growth rate of broad offshoring

16 FIW Special
up a larger share of employment than they do in developing regions, with the shares ranging
from a low of 16 percent in the EU12 and EU15 to a high of 22 percent in the USA. In the USA
we further observe a relatively small share of employment taken up by the low-skilled (just
13%).
Table 1 complements Figure 9 by reporting the growth rates of employment and the growth
rate of employment by skill level for the six regions over the period 1995-2009. The table re-
veals that with the exception of other developed countries all regions have seen positive
growth rates of total employment, with the growth rates being particularly high in China and
in other developing countries. Despite rising offshoring therefore we continue to observe in-
creases in employment, a result that is consistent with those arguing that in the long-run the
demand for labour tends to adjust with labour supply. These positive growth rates for total
employment do hide significant differences by skill-level however. The growth of high-skilled
employment has been relatively large for all regions, and particularly so for China. The rela-
tively high growth rates of high-skilled employment may have arisen for a number of reasons
including changes in industry structure, skill-biased technological change and supply-side ef-
fects. That the growth of high-skilled workers has been particularly large in China and other
developing countries may indicate a catching-up process in high-tech industries, and may
suggest that increased offshoring from these countries should be expected. The growth of
medium-skilled employment has also been relatively rapid in China and other developing
countries, with much smaller growth rates observed in other regions. In the case of low-skilled
employment however we have witnessed negative growth rates in all regions except China
and other developing countries.
Table 1: Regional Growth Rates of Employment and Employment by Skill Type (1995-2009)
Average Growth Rates (%)
Region Total
Employment
High-Skilled
Employment
Medium-Skilled
Employment
Low-Skilled
Employment
China 1.77 8.42 2.77 0.77
Other Developed -0.27 2.58 -0.42 -4.11
EU12 0.17 3.92 0.07 -1.62
EU15 0.56 3.49 0.84 -1.96
Other 1.36 4.52 2.67 0.20
USA 0.47 1.96 -0.04 -1.18

17 FIW Special
Figure 9: Employment Shares by Skill-Level in 1995
China Other Developed
EU12 EU15
Other USA
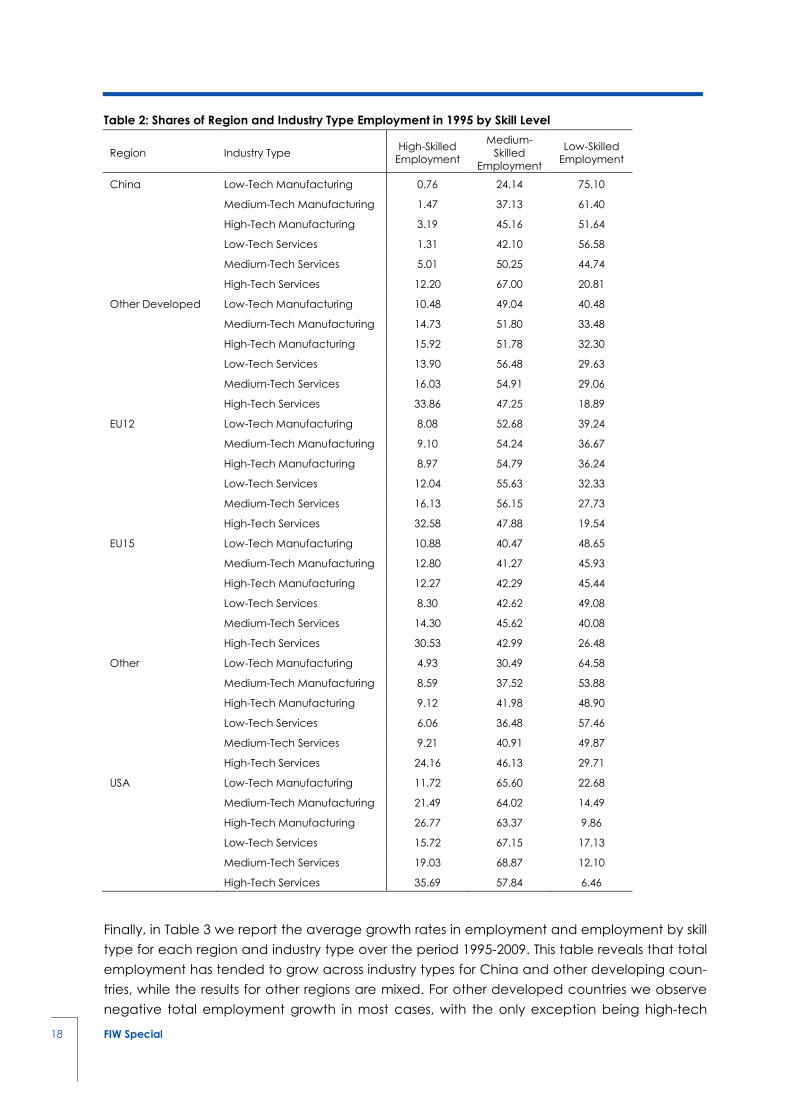
Table 2 extends the discussion of Figure 9 by reporting the shares in 1995 of employment by
skill type (in total employment) for each region and industry type. In China and other devel-
oping countries low- and high-skilled workers make up by far the largest shares of employ-
ment across all industry types, with the high-skilled employment share only becoming signifi-
cant in medium- and high-tech services. In the USA medium-skilled workers make up the
highest shares of employment in all industry types, with the high-skilled share exceeding the
low-skilled share in medium- and high-tech manufacturing and services industries. The figures
for the other three regions follow those for the USA to a degree, with the medium-skilled
shares usually being the largest. In these regions the low-skilled shares remain relatively large
however, with the high-skilled share only exceeding the low-skilled share in high-tech services.
5%
47%
48%
High-Skilled
Medium-Skilled
Low-Skilled
18%
52%
30%
High-Skilled
Medium-Skilled
Low-Skilled
16%
53%
31%
High-Skilled
Medium-Skilled
Low-Skilled
16%
43%
41%
High-Skilled
Medium-Skilled
Low-Skilled
11%
40%
49%High-Skilled
Medium-Skilled
Low-Skilled
22%
65%
13%
High-Skilled
Medium-Skilled
Low-Skilled
18 FIW Special
Table 2: Shares of Region and Industry Type Employment in 1995 by Skill Level
Region Industry Type High-Skilled
Employment
Medium-
Skilled
Employment
Low-Skilled
Employment
China Low-Tech Manufacturing 0.76 24.14 75.10
Medium-Tech Manufacturing 1.47 37.13 61.40
High-Tech Manufacturing 3.19 45.16 51.64
Low-Tech Services 1.31 42.10 56.58
Medium-Tech Services 5.01 50.25 44.74
High-Tech Services 12.20 67.00 20.81
Other Developed Low-Tech Manufacturing 10.48 49.04 40.48
Medium-Tech Manufacturing 14.73 51.80 33.48
High-Tech Manufacturing 15.92 51.78 32.30
Low-Tech Services 13.90 56.48 29.63
Medium-Tech Services 16.03 54.91 29.06
High-Tech Services 33.86 47.25 18.89
EU12 Low-Tech Manufacturing 8.08 52.68 39.24
Medium-Tech Manufacturing 9.10 54.24 36.67
High-Tech Manufacturing 8.97 54.79 36.24
Low-Tech Services 12.04 55.63 32.33
Medium-Tech Services 16.13 56.15 27.73
High-Tech Services 32.58 47.88 19.54
EU15 Low-Tech Manufacturing 10.88 40.47 48.65
Medium-Tech Manufacturing 12.80 41.27 45.93
High-Tech Manufacturing 12.27 42.29 45.44
Low-Tech Services 8.30 42.62 49.08
Medium-Tech Services 14.30 45.62 40.08
High-Tech Services 30.53 42.99 26.48
Other Low-Tech Manufacturing 4.93 30.49 64.58
Medium-Tech Manufacturing 8.59 37.52 53.88
High-Tech Manufacturing 9.12 41.98 48.90
Low-Tech Services 6.06 36.48 57.46
Medium-Tech Services 9.21 40.91 49.87
High-Tech Services 24.16 46.13 29.71
USA Low-Tech Manufacturing 11.72 65.60 22.68
Medium-Tech Manufacturing 21.49 64.02 14.49
High-Tech Manufacturing 26.77 63.37 9.86
Low-Tech Services 15.72 67.15 17.13
Medium-Tech Services 19.03 68.87 12.10
High-Tech Services 35.69 57.84 6.46
Finally, in Table 3 we report the average growth rates in employment and employment by skill
type for each region and industry type over the period 1995-2009. This table reveals that total
employment has tended to grow across industry types for China and other developing coun-
tries, while the results for other regions are mixed. For other developed countries we observe
negative total employment growth in most cases, with the only exception being high-tech

19 FIW Special
services. In the other three regions we observe negative growth rates of total employment in
all three manufacturing sectors, and in low-tech manufacturing in most cases in particular,
and positive growth rates in the services sectors. In most cases the growth of high-tech ser-
vices has outstripped that for low- and medium-tech services, with the exception of the EU12
where low-tech services have also grown relatively quickly. Considering results by skill-level we
find that the growth in employment in China and other developing countries has been driven
to a large extent by the growth in high-skilled employment, and to a lesser extent medium-
skilled employment. For the other regions we find that the negative growth rates in total em-
ployment are being driven by relatively large negative growth rates for low-skilled employ-
ment, with medium-skilled employment also declining in the other developed group and in
manufacturing industries across these regions. Results in Tables 2 and 3 would again support
therefore a catching-up process, with a catching-up of skill structures by industry for develop-
ing countries.
Table 3: Growth Rates of Employment by Region and Industry Type (1995-2009)
Region Industry Type
Average Growth Rates (%)
Total
Employment
High-Skilled
Employment
Medium-
Skilled
Employment
Low-Skilled
Employment
China Low-Tech Manufacturing -0.21 5.76 2.56 -0.48
Medium-Tech Manufacturing 2.51 9.65 3.35 1.79
High-Tech Manufacturing 4.13 10.25 4.42 3.25
Low-Tech Services 3.74 9.39 4.72 2.81
Medium-Tech Services 2.60 9.49 2.91 1.29
High-Tech Services 3.22 7.79 1.42 4.52
Other Developed Low-Tech Manufacturing -3.15 -0.45 -2.01 -6.80
Medium-Tech Manufacturing -1.23 0.75 -0.81 -4.08
High-Tech Manufacturing -1.27 1.29 -1.24 -4.16
Low-Tech Services -0.53 1.72 -0.34 -3.70
Medium-Tech Services -0.97 2.46 -1.33 -4.12
High-Tech Services 1.83 3.71 1.25 -1.89
EU12 Low-Tech Manufacturing -2.59 2.51 -2.29 -3.25
Medium-Tech Manufacturing -0.59 3.62 -0.47 -2.13
High-Tech Manufacturing -0.32 3.97 0.10 -2.32
Low-Tech Services 2.07 3.72 2.08 1.54
Medium-Tech Services 0.36 4.47 0.04 -0.88
High-Tech Services 1.87 3.88 0.93 -0.07
EU15 Low-Tech Manufacturing -1.91 2.20 -0.61 -3.76
Medium-Tech Manufacturing -1.79 1.73 -1.40 -3.89
High-Tech Manufacturing -1.22 2.07 -0.63 -3.73
Low-Tech Services 1.03 3.98 1.84 -0.51
Medium-Tech Services 0.06 3.55 0.57 -2.17
High-Tech Services 1.74 3.68 1.41 -1.09
Other Low-Tech Manufacturing 0.27 3.96 1.89 -0.29
Medium-Tech Manufacturing 1.49 3.85 2.65 0.07

20 FIW Special
High-Tech Manufacturing 0.15 3.43 -0.33 -0.52
Low-Tech Services 4.14 5.23 5.38 3.31
Medium-Tech Services 2.39 5.85 3.78 0.67
High-Tech Services 1.77 4.18 1.67 -0.55
USA Low-Tech Manufacturing -1.42 -0.15 -1.32 -2.76
Medium-Tech Manufacturing -2.05 -0.69 -2.09 -4.38
High-Tech Manufacturing -2.52 0.22 -3.51 -6.05
Low-Tech Services 0.63 2.14 0.43 0.04
Medium-Tech Services -0.02 1.05 -0.05 -1.76
High-Tech Services 1.33 2.44 0.56 -0.01
4.2 Developments in Wages and Relative Wages
Table 4 reports the average growth rate of average wages for total employment and the
growth rates for average wages by skill-type over the period 1995-2008.16 The data reveal
that (nominal) wage growth has been growing in all six of our regions, with the growth rates
being relatively high in other developing countries, the EU12 and China, and relatively low in
three developed regions (EU15, USA and other developed). More interestingly however are
developments in wages by skill-level. In many regions (i.e. China, other developed, USA) we
observe that wages for high-skilled workers have grown faster than for the other two types of
workers. While the differences are not pronounced for China and other developed countries,
the difference in growth rates in the case of the USA is striking with the growth rate of high-
skilled workers being more than twice as large as those for medium- and low-skilled workers.
For the other three regions we observe a higher growth rate for low-skilled workers in the case
of the EU12 and other developing countries and for medium-skilled workers in the case of the
EU15. In all of these three cases the differences in growth rates are not pronounced.
Table 4: Regional Growth Rates of Wages and Wages by Skill Type (1995-2008)
Average Growth Rates (%)
Region All High-Skilled Medium-Skilled Low-Skilled
China 9.13 10.00 9.00 7.97
Other Developed 3.55 3.56 3.22 3.01
EU12 11.38 10.37 11.02 11.61
EU15 3.56 3.06 3.33 3.03
Other 15.57 14.80 14.76 15.23
USA 3.91 8.33 3.55 3.15
These differences in wage growth across skill-types imply that there would have been
changes in relative wages. These changes can be seen more clearly in the following figures,
which plot the relative employment and wages for each year and region. Figure 10 plots the
relative wage of high- to low-skilled workers against relative employment of high to low skilled
16) As with the offshoring measures these are simple unweighted averages across industries and time periods.

21 FIW Special
workers for each of the six regions, while Figure 11 does the same for the ratios of high- to
medium-skilled workers.
Considering firstly developments in the ratios of high- to low-skilled workers we see that there
have been differences across regions. For China we observe developments similar to those
found for the USA in the 1980s, with a strong increase in the relative employment and relative
wages of high-skilled workers. This is also the case for the USA, and since 2000, at least, this has
also been the case for other developed countries. Prior to 2000 we observe an increase in the
ratio of high- to low-skilled employment but no significant changes in relative wages for other
developed countries. In the case of the EU12 there has been an increase in the ratio of high-
to low-skilled employment and a slight decline in the relative wage of high-skilled workers. For
the EU15 we find that both relative wages and relative employment tend to rise up to the
year 2000, but after this year relative wages begin to fall (despite a continuing rise in relative
employment). Finally, for other developing countries we obtain an interesting pattern with the
ratio of high- to low-skill wages declining up to 2000 and then increasing (along with relative
employment) after 2000.
When considering the relative wages and employment of high- to medium-skilled workers we
find more consistent results for non-EU regions. In the case of China, other developed and
developing countries and the USA we observe an increase in the relative wage and relative
employment of high- to medium-skilled workers over the entire sample period. For the EU
however, the patterns look different. In the case of the EU15 we see since 2000 at least a de-
cline in the relative wage and an increase in the relative employment of high- to medium-
skilled workers. For the EU12 we find that during the 1990s there was a decline in the relative
wages and employment of high- to medium-skilled workers, while in the 2000s we see an in-
crease in relative employment and a decline in relative wages of high- to medium-skilled
workers.
Figure 10: Developments in Relative Wages and Employment of High-Low Skilled Workers
China Other Developed
EU12 EU15
Other Developing USA
19951996
19971998
19992000
20012002
200320042005
20062007
1
1.1
1.2
1.3
1.4
1.5
1.6
1.7
1.8
0 0.05 0.1 0.15 0.2 0.25
Ra
tio
of
hig
h-
to lo
w-s
kil
l w
ag
es
Ratio of high- to low-skill employment
1995
19961997199819992000
2001
20022003
2004 2005
2006
2007
1.5
1.52
1.54
1.56
1.58
1.6
1.62
1.64
1.66
0.5 1 1.5 2 2.5 3 3.5 4
Ra
tio
of
hig
h-
to lo
w-s
kil
l w
ag
es
Ratio of high- to low-skill employment
1995199619971998199920002001 2002
2003
2004 200520062007
1
1.2
1.4
1.6
1.8
2
2.2
2.4
2.6
2.8
0.5 0.7 0.9 1.1 1.3 1.5 1.7 1.9 2.1
Ra
tio
of
hig
h-
to lo
w-s
kil
l w
ag
es
Ratio of high- to low-skill employment
1995199619971998
1999200020012002
2003
2004200520062007
1.2
1.3
1.4
1.5
1.6
1.7
1.8
1.9
0.3 0.4 0.5 0.6 0.7 0.8 0.9 1
Ra
tio
of
hig
h-
to lo
w-s
kil
l w
ag
es
Ratio of high- to low-skill employment

22 FIW Special
Figure 11: Developments in Relative Wages and Employment of High-Medium Skilled Workers
China Other Developed
EU12 EU15
Other Developing USA
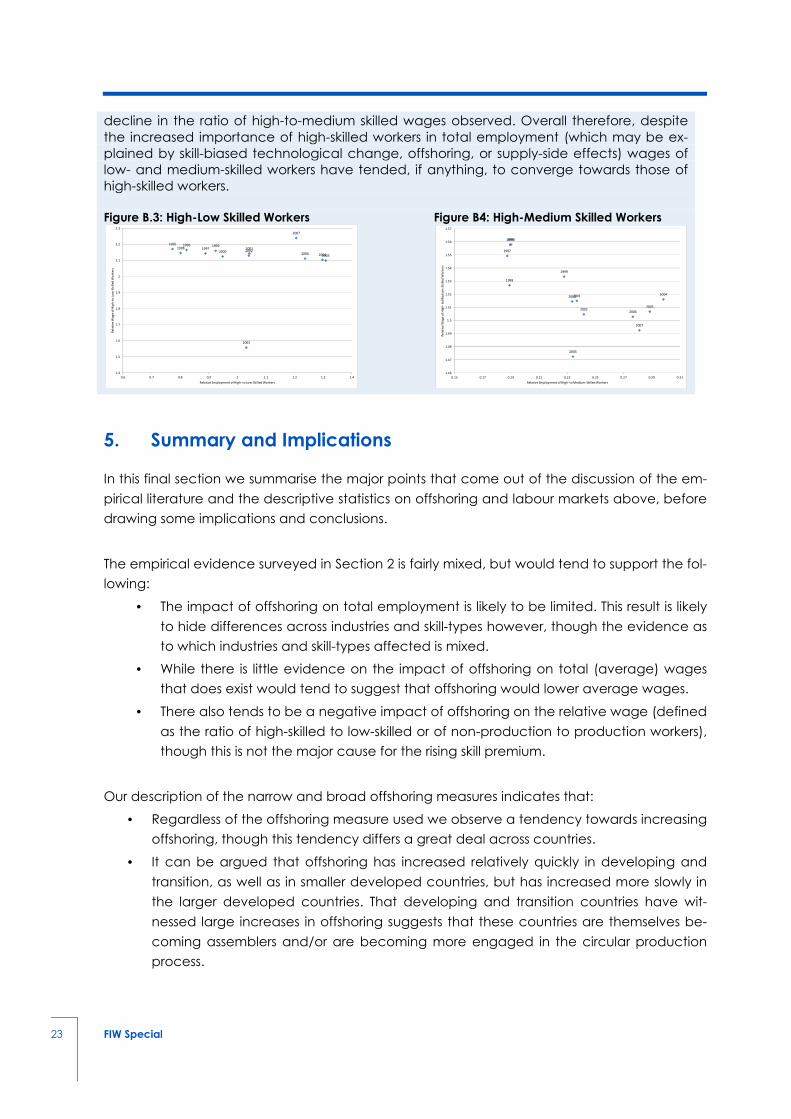
Box 3: Developments in Austrian Labour Markets
In this box we briefly describe developments in labour markets in Austria. In particular we
plot in Figure B3 the ratio of high- to low- skilled employment against the ratio of high-to-
low skilled wages and in Figure B4 the ratio of high-to-medium skilled employment against
the ratio of high-to-medium skilled wages. The data indicate that while the ratio of high-to-
low skilled workers increased consistently over the period 1995-2007, the relative wage
rates of high-to-low skilled workers has tended to decline slightly over the period. Similar re-
sults are also found when considering the relative wages and employment of high-to-
medium skilled workers, with a rise in the ratio of high-to-medium skilled employment and a
1995
1996
1997
1998
1999
20002001
20022003 2004
2005
2006
2007
3.4
3.45
3.5
3.55
3.6
3.65
3.7
3.75
3.8
0.2 0.3 0.4 0.5 0.6 0.7
Ra
tio
of
hig
h-
to lo
w-s
kil
l w
ag
es
Ratio of high- to low-skill employment
1995
1996
1997
1998
1999 20002001
20022003 20042005
2006 2007
1.5
1.7
1.9
2.1
2.3
2.5
2.7
1.5 2 2.5 3 3.5
Ra
tio
of
hig
h-
to lo
w-s
kil
l w
ag
es
Ratio of high- to low-skill employment
19951996199719981999200020012002
2003
2004
2005
2006
2007
1.24
1.26
1.28
1.3
1.32
1.34
1.36
1.38
1.4
1.42
1.44
0 0.02 0.04 0.06 0.08 0.1 0.12 0.14 0.16
Ra
tio
of
hig
h-
to m
ed
ium
-sk
ill w
ag
es
Ratio of high- to medium-skill employment
1995
19961997 19981999
2000
200120022003
2004
20052006
2007
1.32
1.33
1.34
1.35
1.36
1.37
1.38
1.39
1.4
0.3 0.35 0.4 0.45 0.5 0.55
Ra
tio
of
hig
h-
to m
ed
ium
-sk
ill w
ag
es
Ratio of high- to medium-skill employment
199519961997
19981999
2000
2001
2002
2003
20042005
2006
2007
1.72
1.74
1.76
1.78
1.8
1.82
1.84
1.86
1.88
1.9
1.92
1.94
0.2 0.25 0.3 0.35 0.4
Ra
tio
of
hig
h-
to m
ed
ium
-sk
ill w
ag
es
Ratio of high- to medium-skill employment
19951996
19971998
1999
2000
2001
2002
2003
200420052006
2007
1.42
1.44
1.46
1.48
1.5
1.52
1.54
0.25 0.3 0.35 0.4 0.45 0.5 0.55
Ra
tio
of
hig
h-
to m
ed
ium
-sk
ill w
ag
es
Ratio of high- to medium-skill employment
1995199619971998
1999
20002001
2002
20032004
2005
2006
2007
2
2.05
2.1
2.15
2.2
2.25
2.3
2.35
2.4
2.45
0.25 0.26 0.27 0.28 0.29 0.3 0.31 0.32
Ra
tio
of
hig
h-
to m
ed
ium
-sk
ill w
ag
es
Ratio of high- to medium-skill employment
1995
19961997
1998
1999
2000
2001
2002
2003
2004
2005
20062007
1.6
1.65
1.7
1.75
1.8
1.85
0.2 0.25 0.3 0.35 0.4 0.45
Ra
tio
of
hig
h-
to m
ed
ium
-sk
ill w
ag
es
Ratio of high- to medium-skill employment
23 FIW Special
decline in the ratio of high-to-medium skilled wages observed. Overall therefore, despite
the increased importance of high-skilled workers in total employment (which may be ex-
plained by skill-biased technological change, offshoring, or supply-side effects) wages of
low- and medium-skilled workers have tended, if anything, to converge towards those of
high-skilled workers.
Figure B.3: High-Low Skilled Workers Figure B4: High-Medium Skilled Workers
5. Summary and Implications
In this final section we summarise the major points that come out of the discussion of the em-
pirical literature and the descriptive statistics on offshoring and labour markets above, before
drawing some implications and conclusions.
The empirical evidence surveyed in Section 2 is fairly mixed, but would tend to support the fol-
lowing:
• The impact of offshoring on total employment is likely to be limited. This result is likely
to hide differences across industries and skill-types however, though the evidence as
to which industries and skill-types affected is mixed.
• While there is little evidence on the impact of offshoring on total (average) wages
that does exist would tend to suggest that offshoring would lower average wages.
• There also tends to be a negative impact of offshoring on the relative wage (defined
as the ratio of high-skilled to low-skilled or of non-production to production workers),
though this is not the major cause for the rising skill premium.
Our description of the narrow and broad offshoring measures indicates that:
• Regardless of the offshoring measure used we observe a tendency towards increasing
offshoring, though this tendency differs a great deal across countries.
• It can be argued that offshoring has increased relatively quickly in developing and
transition, as well as in smaller developed countries, but has increased more slowly in
the larger developed countries. That developing and transition countries have wit-
nessed large increases in offshoring suggests that these countries are themselves be-
coming assemblers and/or are becoming more engaged in the circular production
process.
1995 199619971998
1999
200020012002
2003
200420052006
2007
1.4
1.5
1.6
1.7
1.8
1.9
2
2.1
2.2
2.3
0.6 0.7 0.8 0.9 1 1.1 1.2 1.3 1.4
Re
lati
ve
Wa
ge
of
Hig
h-
to L
ow
-Sk
ille
d W
ork
ers
Relative Employment of High- to Low-Skilled Workers
19951996
1997
1998
1999
20002001
2002
2003
2004
2005
2006
2007
1.46
1.47
1.48
1.49
1.5
1.51
1.52
1.53
1.54
1.55
1.56
1.57
0.15 0.17 0.19 0.21 0.23 0.25 0.27 0.29 0.31
Re
lati
ve
Wa
ge
of
Hig
h-
to M
ed
ium
-Sk
ille
d W
ork
ers
Relative Employment of High- to Medium-Skilled Workers

24 FIW Special
• Offshoring – however defined – is heavily concentrated in manufacturing industries
(though particularly when measured by the narrow measure) and this remains so de-
spite the growth in offshoring in services industries.
• Results on the extent and growth of offshoring depend partly upon the measure of
offshoring used, with the descriptive results often differing between the narrow and
broad offshoring measure.
Considering the major developments in employment in the recent past we find that:
• Employment growth has been positive for all regions except for Other Developed
countries.
• In the USA and in Europe this growth has been driven by growth in high-tech services,
in particular. In China employment growth has been largest in high-tech manufactur-
ing and services industries, with services also showing relatively high growth rates for
other country groups.
• Across industries we observe relatively high growth rates of employment for high-
skilled workers. The growth rate of low-skilled employment has been negative in all re-
gions except for China and Other Developing countries.
• Medium- and high-skilled workers dominate employment in all regions except China
and Other Developing countries.
• The relative shift of employment towards high-skilled workers is therefore something
that we observe across all countries in the sample, though we don’t observe absolute
declines in low-skilled employment in the developing countries. This process has ad-
vanced furthest in the USA where only a small fraction of workers are considered to be
low-skilled.
Finally, when considering changes in relative wages we find that:
• While growth rates of wages by skill-level are found to be fairly similar, the growth rates of
wages are somewhat higher for medium-skilled workers in the EU15 and for low-skilled
workers in the EU12 and Other Developing countries, but in the remaining cases we get
the familiar pattern that wages for high-skilled workers have outstripped those for the
other two skill types.
• The major exception to this is the USA, where a large gap between the growth rates of
wages of high-skilled labour and the growth rates of wages for the other two skill types ex-
ist.
• While relative employment of high-skilled labour has risen for all regions over the sample
period (both the high-low and high-medium ratios of employment), there have been dif-
ferences in the development of relative wages across regions.
• In most cases we observe an increasing relative wage, but in EU countries the relative
wage has declined somewhat (at least since 2000). This may be related to the European
Growth Model where wage developments are more the result of existing regulation and
institutionalised wage rather than free market mechanisms.

25 FIW Special
While it is very difficult to draw any firm conclusions on the (likely future) impact of offshoring
on labour markets without more formal statistical analysis, the patterns described above
would suggest the following:
• Offshoring continues to be an important activity and it is likely that it will become
more so over time. Offshoring is likely to develop fairly rapidly in developing countries
in particular, with their rates of offshoring expected to converge towards rates seen in
the developed world.
• Offshoring will continue to be centred on specific industries, particularly medium- and
high-tech manufacturing industries in which parts and components trade and semi-
finished products are important. Despite this – and depending on the measure of off-
shoring we are concerned with – offshoring in other industries, and in service industries
in particular, will continue to grow.
• The skill structure of employment in developing countries differs from that in the devel-
oped world. Developing countries tend to be increasing their levels of employment
faster than the developed world however, and much of this growth in employment is
taking place among high-skilled (and to a lesser extent medium-skilled) workers.
• In both the developed and developing world we have witnessed a shift in employ-
ment increasingly towards the service sector. This shift has been relatively strong for
China and Other Developing countries, with the growth of employment in high-tech
manufacturing also strong in the case of China.
• Over time therefore we would expect to see a convergence in the skill structure of
employment across regions and industries.
• Given the descriptive statistics presented above (and the existing empirical evidence)
it would be difficult to argue that offshoring impacts negatively upon total employ-
ment within a country. The growth rate of employment has been relatively large in
both China and Other Developing countries where offshoring was either relatively in-
tensive or where it has been growing relatively quickly in the recent past.
• This doesn’t mean that offshoring doesn’t impact upon employment however. Much
of the growth in employment in China and Other Developing countries has taken
place for high-skilled workers, with the average growth rates of high-skilled employ-
ment being 10.9 (22.6) times higher than the corresponding growth rates for low-skilled
employment in China (Other Developing) countries. This is suggestive of offshoring
shifting employment towards more highly-skilled labour, an outcome that would be
consistent with some of the recent empirical literature on offshoring and employment.
• It is further difficult to argue that offshoring has been the primary force in increasing
the relative wage of high-skilled workers in most regions. Two pieces of evidence pre-
sented above would support this stance
o The USA which has seen the most rapid increase in the relative wage has one
of the lowest ratios of (either narrow or broad) offshoring to value added, and
also has a relatively low growth rate of offshoring according to these two
measures. For the USA therefore, other factors (e.g. skill-biased technological
change) must play a major role in influencing relative wages.
o In both the EU12 and the EU15 we have witnessed declining relative wages
despite relatively high rates and growth rates of offshoring in these countries.

26 FIW Special
Austria for example had one of the highest growth rates of narrow offshoring
between 1995-2008, yet relative wages have declined somewhat since 1995. If
there is an impact of offshoring on relative wages it would not seem to hold for
the EU therefore, a result which may be explained by increased labour market
regulation in European countries.
For other regions however, we can’t rule out the possibility that offshoring has played a (ma-
jor) role in increasing the skill premium. China, for example, has witnessed a relatively large in-
crease in the relative wage of high-to-low skilled workers at the same time as offshoring has
been growing rapidly. This is also true to an extent in Other Developed and Other Developing
countries. In these cases therefore there may exist some evidence indicating that offshoring
plays a role in impacting upon relative wages.

27 FIW Special
References
Arndt, S., 1997. Globalization and the open economy. North American Journal of Economics and Finance, 8, 71-79.
Attanasio, O., Goldberg, P., and N. Pavcnik, 2004. Trade reforms and wage inequality in Colombia. Journal of Devel-opment Economics, 74, 331-366.
Autor, D. and D. Dorn, 2009. This job is “getting old”: Measuring changes in job opportunities using occupational age structure. American Economic Review, 99, 45-51.
Autor, D.H., Katz, L.F. and A.B. Krueger, 1998. Computing inequality: Have computers changed the labor market? Quarterly Journal of Economics, 113, 1169-1213.
Berman, E., Bound, J. and Z. Griliches, 1994. Changes in the demand for skilled labor within U.S. manufacturing: Evi-dence from the Annual Survey of Manufactures. Quarterly Journal of Economics, 104, 367-398.
Berman, E., Bound, J. and S. Machin, 1998. Implications of skill-biased technological change: International evidence. Quarterly Journal of Economics, 113, 1245-1280.
Biscourp, P. and F. Kramarz, 2007. Employment, skill structure and international trade: Firm-level evidence for France. Journal of International Economics, 72, 22-51.
Borjas, G.J., Freeman, R.B. and L.F. Katz, 1997. How much do immigration and trade affect labor market outcomes? Brookings Papers on Economic Activity, 1-90.
Cadarso, M.A., Gomez, N., Lopez, L.A. and M.A. Tobarra, 2008. The EU enlargement and the impact of outsourcing on industrial employment in Spain, 1993-2003. Structural Change and Economic Dynamics, 19(1), 95-108.
Campa, J. and L.S. Goldberg, 1997. The evolving external orientation of manufacturing: A profile of four countries. Economic Policy Review, Federal Reserve Bank of New York, 53-81.
Cappariello, R., 2010. The implications of international outsourcing on employment: Estimates for the Italian manufac-turing industry. Mimeo, Bank of Italy.
Currie, J. and A.E. Harrison, 1997. Sharing the costs: The impact of trade reform on capital and labor in Morocco. Journal of Labor Economics, 15, S44-S71.
Falk, M. and B.M. Koebel, 2002. Outsourcing, imports and labour demand. Scandinavian Journal of Economics, 104(4), 567-586.
Falk, M. and B.M. Wolfmayr, 2005. Employment effects of outsourcing to low wage countries: Empirical evidence for EU countries. WIFO Working Paper no. 262, WIFO.
Feenstra, R.C., 2010. Offshoring in the Global Economy: Microeconomic Structure and Macroeconomic Implications. Cambridge; MA, the MIT Press.
Feenstra, R.C. and G. H. Hanson, 1996. Foreign investment, outsourcing and relative wages. In R.C. Feenstra, G.M. Grossman, and D.A. Irwin (eds.), The Political Economy of Trade Policy: Papers in Honor of Jagdish Bhagwati. Cambridge: MIT Press, pp. 89-127.
Feenstra, R.C. and G. H. Hanson, 2001. Global production sharing and rising inequality: A survey of trade and wages. NBER Working Paper no. 8372, National Bureau of Economic Research.
Foster, N., Poeschl, J. and R. Stehrer, 2012. Offshoring and employment levels. Mimeo, Vienna Institute for Interna-tional Economic Studies.
Goldberg, P.K. and N. Pavcnik, 2005. Trade, wages, and the political economy of trade protection: Evidence from the Colombian trade reforms. Journal of International Economics, 66, 75-105.
Hijzen. A., Görg, H. and R.C. Hine, 2005. International outsourcing and the skill structure of labour demand in the United Kingdom. Economic Journal, 115, 860-878.
Hijzen, A. and P. Swaim, 2007. Does offshoring reduce industry employment? GEP Research Paper no. 2007/24, The Leverhulme Centre for Research on Globalisation and Economic Policy, the University of Nottingham.
Hummels, D., Ishii, J. and K-M Yi, 2001. The nature and growth of vertical specialization in world trade. Journal of Inter-national Economics, 54, 75-96.
Jones, R. and H. Kierzkowski, 2001. Globalization and the consequences of international fragmentation. In R. Dorn-busch (ed.), Money, Capital Mobility and Trade: Essays in Honor of Robert A. Mundell. Cambridge, MIT Press.
Kohler, W., 2004. International outsourcing and factor prices with multistage production. Economic Journal, 114, 166-185.
Krugman, P.R., 2008. Trade and wages, reconsidered. Brookings Panel on Economic Activity, Spring, 103-137.
Lawrence, R.Z. and M.J. Slaughter, 1993. International trade and American wages in the 1980s: Giant sucking sound or small hiccup? Brookings Paper on Economic Activity, 161-210.
Michaels, G., Natraj, A. and J. van Reenen, 2010. Has ICT polarized skill demand? Evidence from eleven countries over 25 years. Mimeo, London School of Economics.
Milner, C. and P. Wright, 1998. Modelling labour market adjustment to trade liberalisation in an industrialising econ-omy. Economic Journal, 108, 509-528.
OECD, 2007. Offshoring and employment: Trends and policy implications. Paris, OECD.
Pavcnik, N., Blom, A., Goldberg, P. and N. Schady, 2004. Trade liberalization and industry wage structure: Evidence from Brazil. World Bank Economic Review, 18, 319-344.
Rama, M., 2003. Globalization and the labor market. World Bank Research Observer, 18, 159-186.
Revenga, A., 1997. Employment and wage effects of trade liberalization: The case of Mexican manufacturing. Jour-nal of Labor Economics, 15, S20-S43.
Robertson, R., Brown, D., Pierre, G. and M.L. Sanchez-Puerta, 2009. Globalization, Wages, and the Quality of Jobs. The World Bank. Washington, DC.
Strauss-Kahn, V., 2003. The role of globalization in the within-industry shift away from unskilled workers in France. NBER Working Paper no. 9716, National Bureau of Economic Research.

28 FIW Special
Wacziarg, R. and J.S. Wallack, 2004. Trade liberalization and intersectoral labor movements. Journal of International Economics, 64, 411-439.
Winters, L.A., McCulloch, N. and A. McKay, 2004. Trade liberalization and poverty: The evidence so far. Journal of Economic Literature, 42, 72-115.
Yeats, A.J., 2001. Just how big is global production sharing? In S.W. Arndt and H. Kiezkowski (eds.), Fragmentation: New Production Patterns in the World Economy, Oxford, Oxford University Press.
Author:
Neil Foster, wiiw [email protected]
FIW Specials are published irregularly by the "Research Centre International Economics" (FIW) and discuss in detail
relevant topics in International Economics. The FIW is sponsored by the Federal Ministry of Economy, Family and Youth
(BMWFJ) in the framework of the Austrian Federal Government's "Internationalisation Drive” and is realised by the co-
operation of three research institutions (WIFO, wiiw, WSR). FIW provides access to a series of databases and a re-
search platform in the field of International Economics.
The sole responsibility for the content of this publication lies with the authors.
Contact:
FIW-project office
c/o WIFO
P.O. Box 91
A-1103 Vienna
Telefon: +43 1 798 26 01 - 333
Email: [email protected]
Website: http://www.fiw.at/
Webseite: http://www.fiw.at/
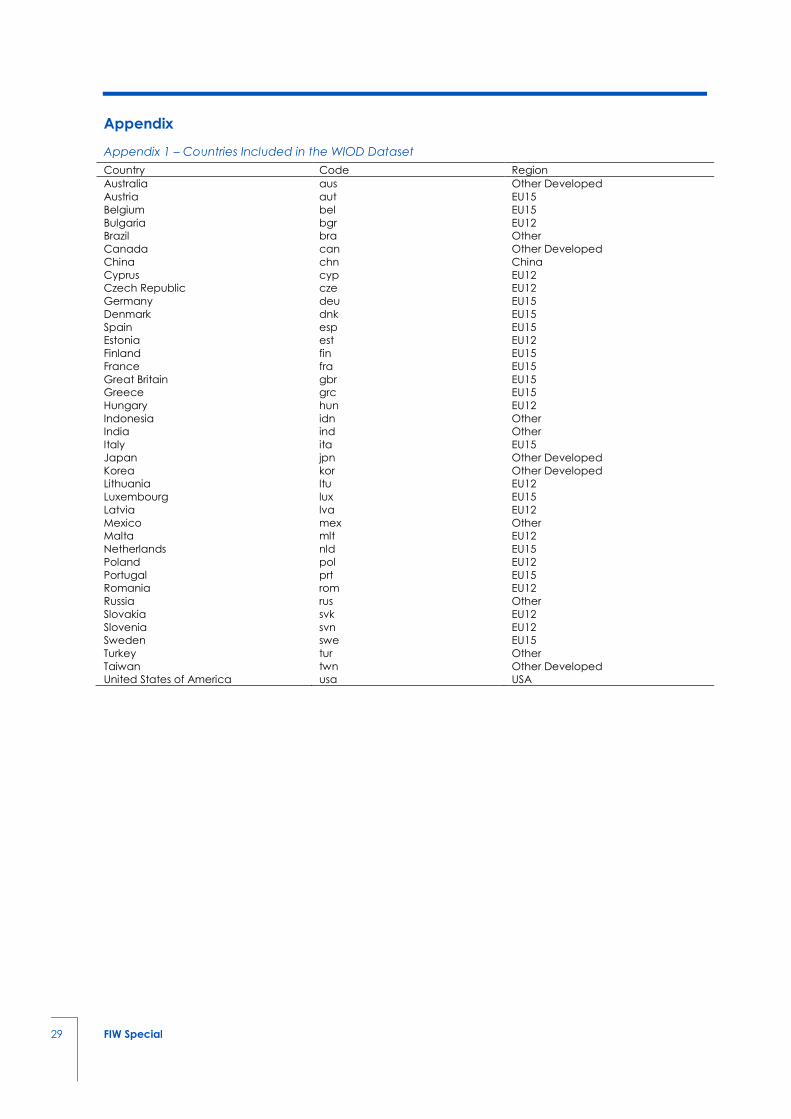
29 FIW Special
Appendix
Appendix 1 – Countries Included in the WIOD Dataset
Country Code Region
Australia aus Other Developed
Austria aut EU15
Belgium bel EU15
Bulgaria bgr EU12
Brazil bra Other
Canada can Other Developed
China chn China
Cyprus cyp EU12
Czech Republic cze EU12
Germany deu EU15
Denmark dnk EU15
Spain esp EU15
Estonia est EU12
Finland fin EU15
France fra EU15
Great Britain gbr EU15
Greece grc EU15
Hungary hun EU12
Indonesia idn Other
India ind Other
Italy ita EU15
Japan jpn Other Developed
Korea kor Other Developed
Lithuania ltu EU12
Luxembourg lux EU15
Latvia lva EU12
Mexico mex Other
Malta mlt EU12
Netherlands nld EU15
Poland pol EU12
Portugal prt EU15
Romania rom EU12
Russia rus Other
Slovakia svk EU12
Slovenia svn EU12
Sweden swe EU15
Turkey tur Other
Taiwan twn Other Developed
United States of America usa USA

30 FIW Special
Appendix 2 – Industries and Industry Classification
Code Industry Type
AtB Agriculture, Hunting, Forestry and Fishing M/Low
C Mining and Quarrying M/Med
15t16 Food, Beverages and Tobacco M/Low
17t18 Textiles and Textile Products M/Low
19 Leather, Leather and Footwear M/Low
20 Wood and Products of Wood and Cork M/Low
21t22 Pulp, Paper, Paper , Printing and Publishing M/Med
23 Coke, Refined Petroleum and Nuclear Fuel M/Med
24 Chemicals and Chemical Products M/High
25 Rubber and Plastics M/Med
26 Other Non-Metallic Mineral M/Low
27t28 Basic Metals and Fabricated Metal M/Low
29 Machinery, Nec M/High
30t33 Electrical and Optical Equipment M/High
34t35 Transport Equipment M/High
36t37 Manufacturing, Nec; Recycling M/Med
E Electricity, Gas and Water Supply S/Med
F Construction S/Low
50 Sale, Maintenance and Repair of Motor Vehicles and Motorcycles; Retail Sale of Fuel S/Low
51 Wholesale Trade and Commission Trade, Except of Motor Vehicles and Motorcycles S/Med
52 Retail Trade, Except of Motor Vehicles and Motorcycles; Repair of Household Goods S/Med
H Hotels and Restaurants S/Low
60 Inland Transport S/Med
61 Water Transport S/Med
62 Air Transport S/High
63 Other Supporting and Auxiliary Transport Activities; Activities of Travel Agencies S/Med
64 Post and Telecommunications S/Med
J Financial Intermediation S/High
70 Real Estate Activities S/Med
71t74 Renting of M&Eq and Other Business Activities S/High
L Public Admin and Defence; Compulsory Social Security S/High
M Education S/High
N Health and Social Work S/High
O Other Community, Social and Personal Services S/High
P Private Households with Employed Persons S/High
Notes: M/Low – Low-tech manufacturing; M/Med – Medium-tech manufacturing; M/High – High-tech manufacturing;
S/Low – Low-tech services; S/Med – Medium-tech services; S/High – High-tech services