3Final R1CleanARD Supplemental Methods (002)
28
Supplemental Methods, Figures and Tables Proteomic, biomechanical, and functional analyses define neutrophil heterogeneity in systemic lupus erythematosus. Kathleen R. Bashant, Angel M. Aponte, Davide Randazzo, Paniz Rezvan Sangsari, Alex JT Wood, Jack A. Bibby, Erin E. West, Arlette Vassallo, Zerai Manna, Martin P. Playford, Natasha Jordan, Sarfaraz Hasni, Marjan Gucek, Claudia Kemper, Andrew Conway Morris, Nicole Y. Morgan, Nicole Toepfner, Jochen Guck, Nehal N. Mehta, Edwin R. Chilvers, Charlotte Summers, Mariana J. Kaplan Supplemental Methods Human subjects: All studies were approved by site-specific IRBs, including the Cambridge Local Research Ethics Committee (REC reference 06/Q0108/281) and NIAMS IRB (NIH 94-AR-0066). All subjects signed informed consent. Subjects with SLE fulfilled the American College of Rheumatology revised criteria for SLE 1 . Subjects were recruited from the University of Cambridge and the NIAMS Lupus Clinics (Supplementary Table 2). Healthy volunteers were recruited by advertisement. Peripheral blood venipuncture: Blood was drawn by venipuncture and collected into 3.8% sodium citrate tubes (Sarstedt, Numbrecht, Germany) Neutrophil isolation: Percoll (Sigma-Aldrich, Dorset, UK) 3 or Ficoll (Sigma-Aldrich, MO, USA) 4 discontinuous gradients were used, as described previously, to separate erythrocytes and granulocytes from peripheral blood mononuclear cells. Normal dense neutrophils were separated from erythrocytes using the EasySep direct neutrophil isolation kit (StemCell Technologies, MA, USA). Low dense neutrophils were purified from the PBMCs using the same EasySep neutrophil isolation kit with customized antibodies targeting CD86 and HLA-DR4 (StemCell Technologies, MA, USA). Cells were counted using a hemocytometer. Cytospin slides were prepared for each neutrophil preparation and cell purity was assessed by light microscopy. Cells prepared in this manner were routinely >95% neutrophils. For specific experiments, cells were resuspended at 5 BMJ Publishing Group Limited (BMJ) disclaims all liability and responsibility arising from any reliance Supplemental material placed on this supplemental material which has been supplied by the author(s) Ann Rheum Dis doi: 10.1136/annrheumdis-2020-218338 –218. :209 80 2021; Ann Rheum Dis , et al. Bashant KR
Transcript of 3Final R1CleanARD Supplemental Methods (002)

Supplemental Methods, Figures and Tables
Proteomic, biomechanical, and functional analyses define neutrophil heterogeneity in systemic lupus erythematosus. Kathleen R. Bashant, Angel M. Aponte, Davide Randazzo, Paniz Rezvan Sangsari, Alex JT Wood, Jack A. Bibby, Erin E. West, Arlette Vassallo, Zerai Manna, Martin P. Playford, Natasha Jordan, Sarfaraz Hasni, Marjan Gucek, Claudia Kemper, Andrew Conway Morris, Nicole Y. Morgan, Nicole Toepfner, Jochen Guck, Nehal N. Mehta, Edwin R. Chilvers, Charlotte Summers, Mariana J. Kaplan
Supplemental Methods
Human subjects: All studies were approved by site-specific IRBs, including the Cambridge Local
Research Ethics Committee (REC reference 06/Q0108/281) and NIAMS IRB (NIH 94-AR-0066).
All subjects signed informed consent. Subjects with SLE fulfilled the American College of
Rheumatology revised criteria for SLE 1. Subjects were recruited from the University of Cambridge
and the NIAMS Lupus Clinics (Supplementary Table 2). Healthy volunteers were recruited by
advertisement.
Peripheral blood venipuncture: Blood was drawn by venipuncture and collected into 3.8%
sodium citrate tubes (Sarstedt, Numbrecht, Germany)
Neutrophil isolation: Percoll (Sigma-Aldrich, Dorset, UK) 3 or Ficoll (Sigma-Aldrich, MO, USA) 4
discontinuous gradients were used, as described previously, to separate erythrocytes and
granulocytes from peripheral blood mononuclear cells. Normal dense neutrophils were separated
from erythrocytes using the EasySep direct neutrophil isolation kit (StemCell Technologies, MA,
USA). Low dense neutrophils were purified from the PBMCs using the same EasySep neutrophil
isolation kit with customized antibodies targeting CD86 and HLA-DR4 (StemCell Technologies,
MA, USA). Cells were counted using a hemocytometer. Cytospin slides were prepared for each
neutrophil preparation and cell purity was assessed by light microscopy. Cells prepared in this
manner were routinely >95% neutrophils. For specific experiments, cells were resuspended at 5
BMJ Publishing Group Limited (BMJ) disclaims all liability and responsibility arising from any relianceSupplemental material placed on this supplemental material which has been supplied by the author(s) Ann Rheum Dis
doi: 10.1136/annrheumdis-2020-218338–218.:209 80 2021;Ann Rheum Dis, et al. Bashant KR

million/mL in phosphate buffer saline (PBS) (Sigma-Aldrich, MO, USA) (Sigma-Aldrich, Dorset,
UK) and rested for 20 minutes at 37°C. Neutrophils were subsequently exposed to fMLF (Sigma-
Aldrich, MO, USA) (Sigma-Aldrich, Dorset, UK), IFNα (Sigma-Aldrich, Dorset, UK), SmRNP
immune complexes (Arotech Diagnostics, Wellington, NZ) 5, 0.1 µM cytochalasin D (Thermo
Fisher Scientific, MA, USA), dimethyl sulfoxide (DMSO), or autologous/heterologous serum at the
dosages and times described in the text.
Generation of immune complexes: SLE-specific immune complexes were generated as
previously described [49]. In brief, serum samples from SLE patients within the NIH lupus cohort
expressing high titers of anti-RNP/Sm antibodies were identified. Age/sex/race-matched control
sera was also identified. IgG was purified from these samples via the Melon Gel IgG spin
purification kit (Thermo Fisher Scientific). Gel electrophoresis was performed to assess IgG purity.
Colloidal blue stain indicated protein bands at 150 kDa, the molecular weight for IgG, as well as
at 25kDa and 50kDa (heavy and the light chains respectively). These results matched those in
the Melon purification manual. To generate immune complexes, purified IgG or commercially
available BSA IgG (AbCam ab19260) were incubated with U1 RNP/Sm antigen (Arotech
Diagnostics ATR01-10) or BSA (2mg/ml, Thermo Fisher Scientific) respectively at a 1:1 ratio for
30 minutes at room temperature. Neutrophils were exposed to 10µg/ml of immune complexes or
IgG for induction of NETs.
Induction of NETs: Neutrophils purified by ficoll gradient were resuspended in RPMI-1640 (Life
Technologies). Poly-L-lysine (Sigma-Aldrich) pre-coated coverslips were placed in each well of a
24 well plate. 1*106 neutrophils/ml were exposed to 10µg/ml of IgG or immune complexes,
500ng/ml PMA (Sigma-Aldrich), or no additional stimulus for 4 hours at 37°C. Total sample
volume was 50µl. After 4 hours, 1mL of 4% paraformaldehyde was placed over the sample and
the plate was incubated at 4°C overnight.
BMJ Publishing Group Limited (BMJ) disclaims all liability and responsibility arising from any relianceSupplemental material placed on this supplemental material which has been supplied by the author(s) Ann Rheum Dis
doi: 10.1136/annrheumdis-2020-218338–218.:209 80 2021;Ann Rheum Dis, et al. Bashant KR

Visualization of platelets and NETs: Coverslips of neutrophils were imaged as previously
described [50]. In brief, coverslips were washed, then incubated at room temperature with 0.2%
gelatin for 30 minutes. After washing, coverslips were incubated 1 hour at 37°C with anti-
myeloperoxidase (MPO; 1:1000, Jackson ImmunoResearch) or anti-CD41a (1:1000,
ThermoFisherScientific) as indicated in the figure legends. After washing, coverslips were
incubated 30 minutes at 37°C with secondary fluorochrome-conjugated antibodies (1:400,
Jackson ImmunoResearch). After washing, coverslips were stained with Phalloidin
(ThermoFisherScientific) and/or Hoechst (1:1000, Thermo Fisher Scientific) as indicated in the
figure legends. Coverslips were mounted with ProLong Gold Antifade (Thermo Fisher Scientific)
and three images/slide were taken with a Leica 4000B inverted light microscope (Leica
Microsystems) with a x40 objective.
Quantification of NETs: Netting neutrophils were manually counted (MPO and DAPI-
colocalization on strand-like DNA structures) and divided by the total number of cells (DAPI-only
and MPO/DAPI-colocalization) under blinded conditions. An average value for percentage of
neutrophils undergoing NET formation on each slide was calculated.
Preparation of lysates for proteomics: NDNs and LDGs were isolated from SLE patients and
age/sex-matched healthy volunteers. Cells were resuspended at 10 million/mL in PBS and rested
for 25 minutes at 37°C with or without 100nM fMLF. Samples were centrifuged at 400g for 5
minutes at 4°C, supernatants were aspirated, and cell pellets were snap frozen in liquid nitrogen.
Ice cold lysis buffer with 0.5% sodium dodecyl sulfate (SDS) (Sigma-Aldrich, MO, USA), 0.1M
tetraethylammonium bromide (TEAB) (Thermo Fisher Scientific, MA, USA),, and 1X HALTTM
protease and phospho-protease inhibitor cocktail (Thermo Fisher Scientific, MA, USA) (200µL)
was added to each cell pellet and cells were mechanically lysed for 10 minutes. Lysates were
BMJ Publishing Group Limited (BMJ) disclaims all liability and responsibility arising from any relianceSupplemental material placed on this supplemental material which has been supplied by the author(s) Ann Rheum Dis
doi: 10.1136/annrheumdis-2020-218338–218.:209 80 2021;Ann Rheum Dis, et al. Bashant KR

centrifuged at 20,000g for 10 minutes at 4°C, the supernatant was removed, and the protein was
stored at -70°C. Protein integrity was assessed by SDS-polyacrylamide gel electrophoresis
(PAGE) and colloidal blue staining (Thermo Fisher Scientific, MA, USA). Lysate protein
concentrations were determined by bicinchoninic acid (BCA) assay (Bio-Rad, CA, USA).
11-Plex TMT labeling: Approximately, 40μg of protein per sample and internal standard (pooled
equivalent amounts of each sample) were reduced in 5 mM Tris(2-carboxyethyl)phosphine
(TCEP) for one hour at 55°C, which was followed by alkylation of cysteines with 18mM
iodoacetamide for 30 minutes in the dark at room temperature. Six volumes of chilled acetone
were added, and precipitation proceeded overnight. Lysates were resuspended in 0.1M TEAB
before trypsin was added at a 1:40 trypsin:protein ratio by mass. Digestion was carried out
overnight at 37°C. Tandem mass tag (TMT) reagents (0.4 mg) were reconstituted in 41μL
anhydrous acetonitrile and peptide samples were labelled according to the manufacturer’s
protocol. Following incubation at room temperature for one hour, the reaction was quenched with
hydroxylamine to a final concentration of 5% (v/v) for 15 min at room temperature. The TMT-
labelled samples including internal standard were pooled across the 11 samples for each TMT
set (patient, healthy volunteer). Pooled TMT sample sets were concentrated and desalted using
Oasis HLB 1 cc cartridge (Waters). The pooled samples were vacuum centrifuged to dryness
and subjected to basic pH reversed-phase (bRP) fractionation.
Offline Reversed-Phase Fractionation: For each TMT set, high pH reversed-phase liquid
chromatography was performed on an offline Agilent 1200 series HPLC. Approximately, 0.44
mgs of desalted peptides from each set were resuspended in 0.1 ml 10 mM triethyl ammonium
bicarbonate with 2% (v/v) acetonitrile. Peptides were loaded onto an Xbridge C18 HPLC column
(Waters; 2.1mm inner diameter x 100 mm, 5μm particle size), and profiled with a linear gradient
of 5–35 % buffer B (90% acetonitrile, 10 mM triethyl ammonium bicarbonate) over 60 min, at a
BMJ Publishing Group Limited (BMJ) disclaims all liability and responsibility arising from any relianceSupplemental material placed on this supplemental material which has been supplied by the author(s) Ann Rheum Dis
doi: 10.1136/annrheumdis-2020-218338–218.:209 80 2021;Ann Rheum Dis, et al. Bashant KR

flowrate of 0.25 ml/min. The chromatographic performance was monitored by sampling the eluate
with a diode array detector (1200 series HPLC, Agilent) scanning between wavelengths of 200
and 400 nm. Fractions were collected at 1 min intervals followed by fraction concatenation 6. 15%
(v/v) of each of the 12 concatenated fractions were separated into a new tube dried and
resuspended in 0.01% formic acid, 2% acetonitrile for full proteome analysis. Approximately 500
ng of peptide fraction mixture was loaded per liquid chromatography-mass spectrometry run. The
remaining volume in each fraction was subjected to phosphopeptide enrichment.
Phosphoprotein enrichment: The initial 12 fractions were combined into 6 fractions and
sequential metal oxide affinity chromatography (SMOAC) phosphopeptide enrichment was
performed. Briefly, TMT labeled tryptic digest was subjected to the High-Select TiO2
Phosphopeptide Enrichment kit according to manufacturer’s protocol (Thermo Fisher Scientific).
The TiO2 eluent was saved for MS analysis. The TiO2 flow through and wash fractions were
pooled, and the phosphopeptides were enriched using the High-Select Fe-NTA Phosphopeptide
Enrichment kit according to manufacturer’s protocol (Thermo Fisher Scientific), eluent was saved
for MS analysis.
Mass Spectrometry: All fractions were analyzed on an Ultimate 3000-nLC coupled to an Orbitrap
Fusion Lumos Tribrid instrument (Thermo Fisher Scientific) equipped with a nanoelectrospray
source. Peptides were separated on an EASY-Spray C18 column (75 μm x 50cm inner diameter,
2 μm particle size and 100 Å pore size, Thermo Fisher Scientific). Peptide fractions were placed
in an autosampler and separation was achieved by 120 min gradient from 4-32% buffer B (100%
ACN and 0.1% formic acid) at a flow rate of 300 nL/min. An electrospray voltage of 1.9 kV was
applied to the eluent via the EASY-Spray column electrode. The Lumos was operated in positive
ion data-dependent mode, using Synchronous Precursor Selection (SPS-MS3) 7. Full scan MS1
was performed in the Orbitrap with a precursor selection range of 375–1,275 m/z at nominal
BMJ Publishing Group Limited (BMJ) disclaims all liability and responsibility arising from any relianceSupplemental material placed on this supplemental material which has been supplied by the author(s) Ann Rheum Dis
doi: 10.1136/annrheumdis-2020-218338–218.:209 80 2021;Ann Rheum Dis, et al. Bashant KR

resolution of 1.2 x 10⁵. The AGC target and maximum accumulation time settings were set to 4
x 105 and 50 ms, respectively. The top ten precursors were then selected for MS2/MS3 analysis.
MS2 was triggered by selecting the most intense precursor ions above an intensity threshold of 5
x 104 for collision induced dissociation (CID)-MS2 fragmentation with an AGC target and
maximum accumulation time settings of 1 x 10⁴ and 90 ms, respectively. Mass filtering was
performed by the quadrupole with 0.7 m/z transmission window, followed by CID fragmentation
in the linear ion trap with 35% normalized collision energy in rapid scan mode and parallelizable
time option was selected. SPS was applied to co-select 10 fragment ions for HCD-MS3 analysis.
SPS ions were all selected within the 400–1,200 m/z range and were set to preclude selection of
the precursor ion and TMTC ion series 8. The AGC target and maximum accumulation time were
set to 1 x 10⁵ and 150 ms (respectively) and parallelizable time option was selected. Co-selected
precursors for SPS-MS3 underwent HCD fragmentation with 65% normalized collision energy
and were analyzed in the Orbitrap with nominal resolution of 5 x 10⁴.
Proteomics Analysis: Raw data files were processed using Proteome Discoverer (v2.4, Thermo
Fisher Scientific), with Sequest HT (Thermo Fisher Scientific) search node. All peak lists were
searched against the UniProtKB/Swiss-Prot protein database released 2019_11 with Homo
sapiens taxonomy (20,316 sequences) and concatenated with reversed copies of all sequences
The following search parameters were set with fixed modifications carbamidomethylation of Cys,
TMT 11-plex modification of lysines and peptide N-terminus; variable modification of methionine
oxidation. For SPS-MS3 the precursor and fragment ion tolerances were set to 10 ppm and 0.6
Da, respectively. Up to two-missed tryptic cleavages were permitted. Percolator algorithm
(v.3.02.1, University of Washington) was used to calculate the false discovery rate (FDR) of
peptide spectrum matches (PSM), set to a q-value <0.05 9-12.
Proteins were quantified by summing reporter ion counts across all matching PSMs, also as
BMJ Publishing Group Limited (BMJ) disclaims all liability and responsibility arising from any relianceSupplemental material placed on this supplemental material which has been supplied by the author(s) Ann Rheum Dis
doi: 10.1136/annrheumdis-2020-218338–218.:209 80 2021;Ann Rheum Dis, et al. Bashant KR

described previously 13. Reporter ion intensities were adjusted to correct for the isotopic impurities
of the different TMT reagents according to manufacturer specifications. The signal-to-noise (S/N)
measurements of peptides assigned to each protein were summed and these values were
normalized so that the sum of the signal for all proteins in each channel was equivalent to account
for equal protein loading. Finally, each protein abundance measurement was scaled to internal
standard channels to reduce multibatch variability 14. The p-values were calculated for the
reported quantitative ratios using ANOVA testing.
Data from the phosphopeptide enrichment were processed and quantified similarly except an
additional variable modification of phosphate on serine, threonine, and tyrosine residues was
included as a Sequest search parameter. Quantitative values were based at the peptide group
level for site specific phosphorylation quantitation. For more detail into the proteomics method
used, see 15.
Network Mapping: Network mapping to GO biological processes was performed using
opensource software ShinyGo 16 and online platform MetaScape 17. Proteins upregulated with an
abundance ratio of >1.5 or downregulated with an abundance ratio of <0.5 in at least four of the
five matched samples were included in network mappings to account for individual variation. For
phospho-proteomics, proteins with differential phosphorylation at a given phospho-site in at least
4/5 matched samples were included. False discovery rate (FDR) was used to rank enriched
networks based on significance. Heatmaps were generated in GraphPad Prism to display relative
protein expression in different neutrophil subsets.
Real-time Deformability Cytometry: RT-DC was performed as described previously 18 19. In
brief, neutrophils were resuspended by gentle mixing in CellCarrier buffer (Zellmechanik Dresden
GmbH, Germany) at concentrations of 2.5 × 10⁷ cells/mL. CellCarrier is based on 1 × PBS buffer
BMJ Publishing Group Limited (BMJ) disclaims all liability and responsibility arising from any relianceSupplemental material placed on this supplemental material which has been supplied by the author(s) Ann Rheum Dis
doi: 10.1136/annrheumdis-2020-218338–218.:209 80 2021;Ann Rheum Dis, et al. Bashant KR

containing 0.5% methylcellulose. Cell suspensions were drawn into 1 mL syringes and placed in
a syringe pump (neMESYS, Cetoni Gmbh, Korbussen, Germany) of the AcCellerator
(Zellmechanik Dresden GmbH, Germany), an extension for an inverted microscope. Syringes
were connected to polymer tubing, which was attached to the sample inlet of a Flic20 PDMS
microfluidic chip (Zellmechanik Dresden GmbH, Germany). The chip contains reservoirs that are
connected by a square measurement channel with a 20 × 20 μm2 cross-section. Another syringe
without cells was filled with CellCarrier buffer, placed in the syringe pump, and connected to the
sheath inlet of the microfluidic chip. RT-DC measurements were collected at a cellular flow rate
of 0.12 μL/s (0.03 μL/s sample flow and 0.09 μL/s sheath flow). For isolated cell populations, an
open gating strategy was employed. For whole blood measurements, 50 μL blood was diluted
into 950 μL CellCarrier buffer and a gate for cells sized 5–16 μm parallel to and 5–20 μm
perpendicular to flow direction was applied. This was sufficient to exclude single erythrocytes and
erythrocyte doublets. An inverted microscope in combination with a high-speed CMOS camera
(Mikrotron GmbH, Unterschleißheim, Germany) captured images of cells at a frame rate of 2000
frames per second as they reached the end of the constriction channel. Real-time image analysis
was performed during the measurement process and data files necessary for single-cell MORE
analysis (see below) exported for all detected cells.
Morpho-Rheological Analysis: Previous reports have already described methods to analyze
RT-DC data files 20-22. In brief, a cell tracing algorithm implemented in C/LabVIEW, in combination
with off-line analysis using ShapeOut software and custom-written Python scripts allow for
generation of a neutrophil morpho-rheological or “MORE” profile. For each cell detected, data
describing a bright field image of the cell, the contour of the cell, and the cell size (as the cross-
sectional area of the cell) were exported and analyzed. Cell size was obtained from the area
inside the convex hull, a processed contour, where all points contributing to concave curvature
BMJ Publishing Group Limited (BMJ) disclaims all liability and responsibility arising from any relianceSupplemental material placed on this supplemental material which has been supplied by the author(s) Ann Rheum Dis
doi: 10.1136/annrheumdis-2020-218338–218.:209 80 2021;Ann Rheum Dis, et al. Bashant KR

PBS at 0.4mL/minute. Cells were imaged using a DMI6000 inverted microscope (Leica) using an
oil immersion Plan-Apo 20X/0.8 numerical aperture (NA) objective (Leica). During the entire
experiment, cells were constantly maintained at controlled temperature (37oC) and CO2 (5%).
Neutrophils were flowed across the endothelial surface for 3 minutes at the same rate. Time-lapse
recordings were captured using a cooled Andor EM-CCD camera driven by the LAS X software
(Leica) at a rate of 56fps to evaluate neutrophil-endothelial interactions. The percentage of
neutrophils adhering to or rolling alongside the endothelium out of the total number of neutrophils
flowing past the field of view was calculated for SLE LDGs, SLE NDNs, HC NDNs, and primed
HC NDNs. Rates of interaction with the endothelium for different neutrophil subsets were
compared.
PDMS microvasculature mimetic: To mimic the trafficking of cells in pulmonary vasculature, we
developed the microvasculature mimetic (MM). After conceptualization, the design was
undertaken using L-Edit (Mentor Graphics) for the MM: a branched pyramidal network without
constrictions (constant width of 15 μm). A polyester photomask of the designs was printed
commercially (Fineline Imaging, CO, USA). Using the photomask, the master molds were
fabricated at the Biomedical Engineering and Physical Science Shared Resource in the National
Institute of Biomedical Imaging and Bioengineering following standard photolithographic
techniques. Briefly, SU-8 2015 (Kayaku Advanced Materials, Westborough MA) was deposited
on silicon wafer substrates using a spin-coater (Laurell Technologies, PA, USA), prebaked,
patterned using the masks and a collimated light source (OAI Instruments, CA, USA), post-
exposure baked, and developed. To increase durability, the master molds were hard-baked at
150°C for 2 minutes, after which they were treated with a vapor of (tridecafluoro-1,1,2,2-
tetrahydrooctyl)-1-trichlorosilane (UCT Specialties, PA, USA) in a vacuum desiccator for one
hour. For soft lithography, PDMS (Sylgard 184, Dow Corning) was combined in a 10:1 w:w ratio
of base to curing agent in a planetary mixer (THINKY, CA, USA), then poured onto the master
BMJ Publishing Group Limited (BMJ) disclaims all liability and responsibility arising from any relianceSupplemental material placed on this supplemental material which has been supplied by the author(s) Ann Rheum Dis
doi: 10.1136/annrheumdis-2020-218338–218.:209 80 2021;Ann Rheum Dis, et al. Bashant KR

molds, briefly degassed under vacuum, and baked for 45 minutes at 80°C. After demolding the
cured PDMS and cutting out the device, inlet and outlet holes were punched (Acuderm, 1.5mm
punch). The PDMS devices were cleaned with tape in a HEPA filtered hood and bonded to glass
cover slips using oxygen plasma (PE-100, Plasma Etch, USA). Using one device at a time for
experiments, the inlet and outlet were connected to a microfluidic pressure control unit (Flow-EZ,
Fluigent) using polyethylene tubing (Scientific Commodities, AZ, USA), such that less than 500
μL of cell suspension was introduced for each experiment. Cells were suspended in PBS at
3.33 × 10⁵ cells/mL and flowed through the microchannels using driving pressures within the
physiological range (25, 50, and 100 mbar). For imaging, the device was mounted on a DMI6000
inverted widefield microscope (Leica). Imaging was performed using a Plan-Apo 10X/0.45NA
objective (Leica) to measure the transit time through the entire device. During the entire
experiment, cells were constantly maintained at controlled temperature (37oC) and CO2 (5%).
Time-lapse recordings were captured using a cooled Andor EM-CCD camera driven by the LAS
X software (Leica) at a rate of 56fps. Transit times were extracted from the videos manually. The
concept of using a PDMS mimetic for the pulmonary microvasculature to study neutrophil
trafficking was inspired by 23 but in this work we opted for a branched channel network rather than
a single channel with constrictions. Viability testing was completed using trypan blue (Thermo
Fisher Scientific, MA, USA). Transit times were calculated manually and represent the difference
between the times of a given cell entering and exiting the mimetic.
Brightfield and lattice light-sheet fluorescence microscopy: Neutrophils were suspended in
Hank’s Buffered Salt Solution with 25 mM N-(2-Hydroxyethyl)piperazine-N’-(2-ethanesulfonic
acid) (HEPES) (Thermo Fisher Scientific, MA, USA), at a concentration of 1 million/mL. 200 µL of
cell solutions was aliquot into an 8-well glass chamber slide (Ibidi, WI, USA). Cells were
concomitantly stained with 167nM sytox green (Thermo Fisher Scientific, MA, USA) and 500nM
of SiR-Actin (Spirochrome, CO, USA) for 30 minutes, kept at 37oC and 5% CO2. Brightfield and
BMJ Publishing Group Limited (BMJ) disclaims all liability and responsibility arising from any relianceSupplemental material placed on this supplemental material which has been supplied by the author(s) Ann Rheum Dis
doi: 10.1136/annrheumdis-2020-218338–218.:209 80 2021;Ann Rheum Dis, et al. Bashant KR

fluorescence live recordings of actin changes in response to priming with 100 nM fMLF or 25 nM
PMA (Sigma-Aldrich, MO, USA) were acquired using a Zeiss Lattice Lightsheet 7 inverted
microscope equipped with a Plan-Apo 48X/1.0NA detection objective, a cooled PCO.edge
sCMOS camera and driven by the Zen Blue 3.1 software (Zeiss). Brightfield images were obtained
by illumination of samples with white LED light. As for fluorescence acquisition, a 650nm-waist
light sheet was employed. Image volumes were acquired with a lateral translation of 0.2µm, and
the 488nm and 640nm laser lines were used for Sytox green and SiR-Agin (shown in red),
respectively. Time-lapse recordings were acquired in dithering mode and then deconvolved in the
processing module of the Zen Blue 3.1 software applying the “Constrain Iterative” algorithm. Data
were then transformed (“deskewed”) to achieve a conventional x, y, z visualization and exported
as .CZI files. Finally, data were imported into IMARIS 9.5.1 software (Bitplane) for processing.
Neutrophils were visually inspected to compare morphologies.
Analysis of RNA sequencing: For analysis of the RNA-sequencing data, raw counts for SLE
patients were obtained from GSE139358 and counts for HC NDNs cultured with or without heat-
killed Staphylococcus Aureus were obtained from GSE73313. Data were then TMM normalized
using the EdgeR package (REF). No filtering of genes based on expression level was done as
undetected genes were informative in the analysis. All subsequent data were then plotted using
counts per million (CPM) values. For comparisons to RNA-sequencing data, proteomic
abundances were converted to abundance per million data (referred to here as CPM). Generation
of complement datasets was done through combining unique genes from multiple MSigDB gene
sets, these being: BIOCARTA_COMP_PATHWAY, HALLMARK_COMPLEMENT,
KEGG_COMPLEMENT_AND_COAGULATION_CASCADES, REACTOME_ COMPLEMENT_
CASCADE, BIOCARTA_ALTERNATIVE_PATHWAY, BIOCARTA_CLASSIC_PATHWAY.
Graphical representation was done using ggplot2 (v3.3.2) or ComplexHeatmap (REF), or
GraphPadPrism.
BMJ Publishing Group Limited (BMJ) disclaims all liability and responsibility arising from any relianceSupplemental material placed on this supplemental material which has been supplied by the author(s) Ann Rheum Dis
doi: 10.1136/annrheumdis-2020-218338–218.:209 80 2021;Ann Rheum Dis, et al. Bashant KR
Statistical analysis: For each sample analyzed by RT-DC, the median measurement of over 500
cells was graphed as an individual point. The mean± SEM of all median measurements for each
neutrophil subset is depicted and analyzed with statistical tests, Graphs were generated in
GraphPad Prism and statistical tests were performed as described in each figure.
BMJ Publishing Group Limited (BMJ) disclaims all liability and responsibility arising from any relianceSupplemental material placed on this supplemental material which has been supplied by the author(s) Ann Rheum Dis
doi: 10.1136/annrheumdis-2020-218338–218.:209 80 2021;Ann Rheum Dis, et al. Bashant KR

Supplementary Table 1. Demographic and clinical characteristics of SLE patients (n=5) and HC
volunteers (n=5) donating blood for proteomics and phosphoproteomic analysis of LDGs and
NDNs.
BMJ Publishing Group Limited (BMJ) disclaims all liability and responsibility arising from any relianceSupplemental material placed on this supplemental material which has been supplied by the author(s) Ann Rheum Dis
doi: 10.1136/annrheumdis-2020-218338–218.:209 80 2021;Ann Rheum Dis, et al. Bashant KR

Supplementary Table 2. Demographic and clinical characteristics of all SLE patients donating blood
for this study. SLEDAI for the first top nine patients on the table is based on clinical and serological activity, while SLEDAI for the rest of the patients also includes data from CBC and urinalysis.
BMJ Publishing Group Limited (BMJ) disclaims all liability and responsibility arising from any relianceSupplemental material placed on this supplemental material which has been supplied by the author(s) Ann Rheum Dis
doi: 10.1136/annrheumdis-2020-218338–218.:209 80 2021;Ann Rheum Dis, et al. Bashant KR

Supplementary Table 3. Phospho-site information for phosphoproteins referenced in the
manuscript. Information for all phosphoproteins identified can be found in the PRIDE database. Lowercase letter indicates site of phosphorylation.
BMJ Publishing Group Limited (BMJ) disclaims all liability and responsibility arising from any relianceSupplemental material placed on this supplemental material which has been supplied by the author(s) Ann Rheum Dis
doi: 10.1136/annrheumdis-2020-218338–218.:209 80 2021;Ann Rheum Dis, et al. Bashant KR

Supplementary Figure 1. Isolation of neutrophils was controlled to conserve mechanical
properties observed in whole blood. (A) Biomechanical profiling by RT-DC of neutrophils in whole blood and following various isolation techniques (n≥3). Significance was established by Kruskal-Wallis test with a post hoc Dunn’s test to compare isolated neutrophils to neutrophils in whole blood. (B) Isolation of neutrophils by density gradient, followed by a StemCell EasySep Column-free negative isolation strategy yields neutrophils biomechanically identical to their whole blood counterparts by RT-DC and (C) >98% pure by cytospin (n=3). Significance was established by Mann-Whitney U-test. For each sample analyzed by RT-DC, the median of >500 neutrophils was graphed and the mean±SEM for each cell subset was depicted. Significance was set at *p<0.05, **p<0.01, ***p<0.001, ****p<0.0001, ns=not significant. (D) Neutrophil preparations did not show significant platelet contamination, as assessed by staining with platelet markers (images representatively of n=6).
BMJ Publishing Group Limited (BMJ) disclaims all liability and responsibility arising from any relianceSupplemental material placed on this supplemental material which has been supplied by the author(s) Ann Rheum Dis
doi: 10.1136/annrheumdis-2020-218338–218.:209 80 2021;Ann Rheum Dis, et al. Bashant KR

Supplementary Figure 2. Proteomics analysis of SLE LDGs, SLE NDNs, HC NDNs, and
primed HC NDNs. (A) Principal components analysis of proteomics and phospho-proteomics data (n=5 healthy volunteers, n=5 SLE patients). (B) Distribution of 4109 identified proteins across all neutrophil subsets. (C) Distribution of 875 identified phospho-proteins across all neutrophil subsets. Volcano plots show separation between SLE NDN and HC NDN proteomes (D) and phosphoproteomes (E). The upregulated (red) and downregulated (green) (phospho)proteomes are SLE NDNs, as HC NDNs are the reference (phospho)proteome. Volcano plots show separation between primed HC NDN and unstimulated HC NDN proteomes (F) and phosphoproteomes (G). The upregulated (red) and downregulated (green) (phospho)proteomes are primed HC NDNs as unstimulated HC NDNs are the reference (phospho)proteome. (H) Abundance of L-selectin in arbitrary units. Results are mean ± SEM.(I) Gene ontology biological process analysis highlighting biological networks associated with proteins differentially phosphorylated in SLE NDNs relative to HC NDNs. Proteins with differential phosphorylation at a specific phosphosite in at least 4/5 samples and with an abundance ratio less than 0.5 or greater than 1.5 were included and significance was established by false discovery rate (FDR).
BMJ Publishing Group Limited (BMJ) disclaims all liability and responsibility arising from any relianceSupplemental material placed on this supplemental material which has been supplied by the author(s) Ann Rheum Dis
doi: 10.1136/annrheumdis-2020-218338–218.:209 80 2021;Ann Rheum Dis, et al. Bashant KR

Supplementary Figure 3. Investigation of proteins identified by mass spectrometry at the
transcript level. Relative expression of mRNA transcripts (A) and proteins (B) in HC NDNs, SLE NDNs, and SLE LDGs. C) Comparison of mRNA transcript expression and protein expression in SLE LDGs, SLE NDNs, and HC NDNs. D) Genes not detected by transcriptomics in HC NDNs, SLE NDNs, or SLE LDGs, but which encode proteins detected by mass spectrometry.
BMJ Publishing Group Limited (BMJ) disclaims all liability and responsibility arising from any relianceSupplemental material placed on this supplemental material which has been supplied by the author(s) Ann Rheum Dis
doi: 10.1136/annrheumdis-2020-218338–218.:209 80 2021;Ann Rheum Dis, et al. Bashant KR

Supplementary Figure 4. The biomechanical properties of lymphocytes and monocytes
do not differ between healthy individuals and clinically quiescent SLE. (A) Biomechanical profiling of monocytes from SLE patients (n=8) and healthy volunteers (n=6) by RT-DC. (B) Biomechanical profiling of lymphocytes from SLE patients (n=8) and healthy volunteers (n=6) by RT-DC. For each sample analyzed by RT-DC, the median measurement of over 300 lymphocytes or monocytes is graphed and the mean ± SEM for each cell subset is depicted. Significance was established by Mann-Whitney U-tests and was set at *p<0.05, ns=not significant. (C) Sex and age-matched demographics of HC donors (n=11) and SLE patients (n=11) giving samples analyzed by RT-DC for neutrophil biomechanical properties.
BMJ Publishing Group Limited (BMJ) disclaims all liability and responsibility arising from any relianceSupplemental material placed on this supplemental material which has been supplied by the author(s) Ann Rheum Dis
doi: 10.1136/annrheumdis-2020-218338–218.:209 80 2021;Ann Rheum Dis, et al. Bashant KR

Supplementary Figure 5. Association of biomechanical properties with SLE clinical
features. (A) Correlation of LDG roughness with SLE patient age in SLE (n=11). (B) Correlation of LDG numbers with age of SLE patient (n=21). (C) Correlation of LDG roughness with BMI in SLE patients (n=8). For all correlations, significance was assessed by linear regression analysis and set at *p ≤ 0.05, ns=not significant. (D) LDG roughness in SLE subjects treated with hydroxychloroquine (n=5) or other treatments (n=3). (E) LDG roughness in SLE patients positive (n=4) or negative (n=4) for serum anti-dsDNA antibodies. Roughness was determined by RT-DC. The median roughness measurement from over 100 neutrophils from each subject is graphed and the mean± SEM for each treatment or clinical category is depicted. For D and E, significance was established by Mann-U-Whitney tests and set at *p<0.05, ns=not significant.
BMJ Publishing Group Limited (BMJ) disclaims all liability and responsibility arising from any relianceSupplemental material placed on this supplemental material which has been supplied by the author(s) Ann Rheum Dis
doi: 10.1136/annrheumdis-2020-218338–218.:209 80 2021;Ann Rheum Dis, et al. Bashant KR

Supplementary Figure 6. SLE-relevant immune stimuli do not significantly modulate
biomechanical properties of healthy control neutrophils. (A, B) Sm/RNP immune complexes used for RT-DC assay are shown to be functional by inducing in vitro NET formation in HC NDNs (n=6). Red indicates MPO, blue indicates DNA. (C) Biomechanical profiling of HC NDNs incubated with 10ng/µl Sm/RNP immune complexes or with DMSO over three hours by RT-DC (n=3). (D) Biomechanical profiling of HC NDNs treated with autologous HC, heterologous HC, or heterologous, active SLE patient serum for 45 minutes by RT-DC. Some NDNs were also treated with 10ng/µl Sm/RNP immune complexes and 1000units/mL IFNα (n=3). (E) Biomechanical profiling over time of neutrophils in HC blood stimulated with DMSO, 100nM fMLF, or 1000units/mL IFNα (n=3). For each sample analyzed by RT-DC, the median of >500 neutrophils was graphed and the mean±SEM for each cell subset was depicted. For C & E, unstimulated neutrophils treated with DMSO were compared to stimulated neutrophils from autologus donors at matched time points. For D, neutrophils from autologus donors treated with different serum samples were compared. Significance was established by Kruskal-Wallis test (B, C, E) or Friedman’s test (D) with post hoc Dunn’s tests for multiple comparisons and set at *p<0.05, **p<0.01, ***p<0.001, ns=not significant.
BMJ Publishing Group Limited (BMJ) disclaims all liability and responsibility arising from any relianceSupplemental material placed on this supplemental material which has been supplied by the author(s) Ann Rheum Dis
doi: 10.1136/annrheumdis-2020-218338–218.:209 80 2021;Ann Rheum Dis, et al. Bashant KR
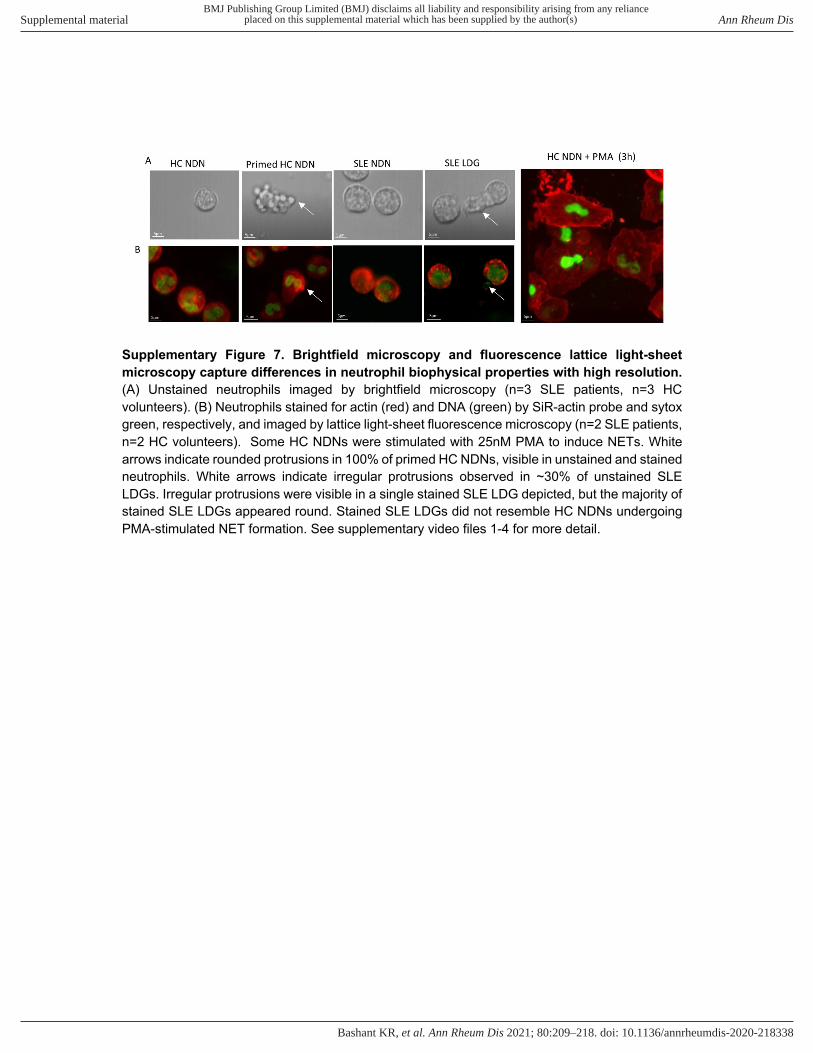
Supplementary Figure 7. Brightfield microscopy and fluorescence lattice light-sheet
microscopy capture differences in neutrophil biophysical properties with high resolution.
(A) Unstained neutrophils imaged by brightfield microscopy (n=3 SLE patients, n=3 HC volunteers). (B) Neutrophils stained for actin (red) and DNA (green) by SiR-actin probe and sytox green, respectively, and imaged by lattice light-sheet fluorescence microscopy (n=2 SLE patients, n=2 HC volunteers). Some HC NDNs were stimulated with 25nM PMA to induce NETs. White arrows indicate rounded protrusions in 100% of primed HC NDNs, visible in unstained and stained neutrophils. White arrows indicate irregular protrusions observed in ~30% of unstained SLE LDGs. Irregular protrusions were visible in a single stained SLE LDG depicted, but the majority of stained SLE LDGs appeared round. Stained SLE LDGs did not resemble HC NDNs undergoing PMA-stimulated NET formation. See supplementary video files 1-4 for more detail.
BMJ Publishing Group Limited (BMJ) disclaims all liability and responsibility arising from any relianceSupplemental material placed on this supplemental material which has been supplied by the author(s) Ann Rheum Dis
doi: 10.1136/annrheumdis-2020-218338–218.:209 80 2021;Ann Rheum Dis, et al. Bashant KR

Supplementary Figure 8. The MMM does not impact neutrophil viability. (A) Neutrophil viability before and after transiting the microvasculature mimetic (n=3). Significance was established by paired Student’s T-test and set at *p<0.05, ns=not significant.
BMJ Publishing Group Limited (BMJ) disclaims all liability and responsibility arising from any relianceSupplemental material placed on this supplemental material which has been supplied by the author(s) Ann Rheum Dis
doi: 10.1136/annrheumdis-2020-218338–218.:209 80 2021;Ann Rheum Dis, et al. Bashant KR

Supplementary Figure 9. SLE LDGs do not display enhanced adherence to activated
endothelial cells in a two-dimensional system of flow.
The percentage of neutrophils interacting with activated endothelium under a system of flow (n=3 HC volunteers, n=3 SLE patients). Results are mean ± SEM with comparisons between autologus SLE LDGs and SLE NDNs as well as autologus primed HC NDNs and HC NDNs. Significance was established by Kruskal-Wallis test with post hoc Dunn’s tests for multiple comparisons and set at **p≤ 0.01, ns=not significant.
BMJ Publishing Group Limited (BMJ) disclaims all liability and responsibility arising from any relianceSupplemental material placed on this supplemental material which has been supplied by the author(s) Ann Rheum Dis
doi: 10.1136/annrheumdis-2020-218338–218.:209 80 2021;Ann Rheum Dis, et al. Bashant KR

Supplementary Figure 10. C3 expression is upregulated at the transcript level in
neutrophils activated by Staphylococcus aureus. mRNA expression of C3 in HC NDNs cultured with heat-killed Staphylococcus aureus for indicated time points. mRNA expression determined by RNA-SEQ using two HC donors. Data in GEO GSE73313.
Supplementary video files:
Video File 1: Unstimulated HC NDNs imaged by brightfield lattice light-sheet microscopy.
Video File 2: Primed HC NDNs imaged by brightfield lattice light-sheet microscopy.
Video File 3: SLE NDNs imaged by brightfield lattice light-sheet microscopy.
Video File 4: SLE LDGs imaged by brightfield lattice light-sheet microscopy.
BMJ Publishing Group Limited (BMJ) disclaims all liability and responsibility arising from any relianceSupplemental material placed on this supplemental material which has been supplied by the author(s) Ann Rheum Dis
doi: 10.1136/annrheumdis-2020-218338–218.:209 80 2021;Ann Rheum Dis, et al. Bashant KR

Supplementary References
1. Aringer M, Costenbader K, Daikh D, et al. 2019 European League Against
Rheumatism/American College of Rheumatology Classification Criteria for Systemic
Lupus Erythematosus. Arthritis & Rheumatology 2019;71(9):1400-12. doi:
10.1002/art.40930
2. Hochberg MC. Updating the American college of rheumatology revised criteria for the
classification of systemic lupus erythematosus. Arthritis & Rheumatism 1997;40(9):1725-
25. doi: 10.1002/art.1780400928
3. Haslett C, Guthrie LA, Kopaniak MM, et al. Modulation of multiple neutrophil functions by
preparative methods or trace concentrations of bacterial lipopolysaccharide. The
American Journal of Pathology 1985;119(1):101-10.
4. Clark RA, Nauseef WM. Isolation and Functional Analysis of Neutrophils. Curr Protoc
Immunol 1996;19(1):7.23.1-7.23.17. doi: 10.1002/0471142735.im0723s19
5. Lood C, Blanco LP, Purmalek MM, et al. Neutrophil extracellular traps enriched in oxidized
mitochondrial DNA are interferogenic and contribute to lupus-like disease. Nature
medicine 2016;22(2):146-53. doi: 10.1038/nm.4027
6. Yang F, Shen Y, Camp DG, 2nd, et al. High-pH reversed-phase chromatography with fraction
concatenation for 2D proteomic analysis. Expert Rev Proteomics 2012;9(2):129-34. doi:
10.1586/epr.12.15
7. Ting L, Rad R, Gygi SP, et al. MS3 eliminates ratio distortion in isobaric multiplexed
quantitative proteomics. Nature Methods 2011;8(11):937-40. doi: 10.1038/nmeth.1714
8. Wühr M, Haas W, McAlister GC, et al. Accurate multiplexed proteomics at the MS2 level
using the complement reporter ion cluster. Anal Chem 2012;84(21):9214-21. doi:
10.1021/ac301962s [published Online First: 2012/10/25]
9. Käll L, Canterbury JD, Weston J, et al. Semi-supervised learning for peptide identification
from shotgun proteomics datasets. Nature Methods 2007;4(11):923-25. doi:
10.1038/nmeth1113
10. Kall L, Storey JD, MacCoss MJ, et al. Posterior error probabilities and false discovery rates:
two sides of the same coin. J Proteome Res 2008;7(1):40-4. doi: 10.1021/pr700739d
[published Online First: 2007/12/07]
11. Brosch M, Yu L, Hubbard T, et al. Accurate and sensitive peptide identification with Mascot
Percolator. J Proteome Res 2009;8(6):3176-81. doi: 10.1021/pr800982s [published
Online First: 2009/04/03]
12. Spivak M, Weston J, Bottou L, et al. Improvements to the percolator algorithm for Peptide
identification from shotgun proteomics data sets. J Proteome Res 2009;8(7):3737-45. doi:
10.1021/pr801109k [published Online First: 2009/04/24]
13. McAlister GC, Huttlin EL, Haas W, et al. Increasing the multiplexing capacity of TMTs
using reporter ion isotopologues with isobaric masses. Anal Chem 2012;84(17):7469-78.
doi: 10.1021/ac301572t [published Online First: 2012/08/14]
14. Cominetti O, Nunez Galindo A, Corthesy J, et al. Proteomic Biomarker Discovery in 1000
Human Plasma Samples with Mass Spectrometry. J Proteome Res 2016;15(2):389-99.
doi: 10.1021/acs.jproteome.5b00901 [published Online First: 2015/12/02]
15. Wood AJT, Vassallo AM, Ruchaud-Sparagano M-H, et al. Complement C5a impairs
phagosomal maturation in the neutrophil through phosphoproteomic remodelling. bioRxiv
2020:2020.01.17.907618. doi: 10.1101/2020.01.17.907618
BMJ Publishing Group Limited (BMJ) disclaims all liability and responsibility arising from any relianceSupplemental material placed on this supplemental material which has been supplied by the author(s) Ann Rheum Dis
doi: 10.1136/annrheumdis-2020-218338–218.:209 80 2021;Ann Rheum Dis, et al. Bashant KR

16. Ge SX, Jung D, Yao R. ShinyGO: a graphical gene-set enrichment tool for animals and
plants. Bioinformatics 2019 doi: 10.1093/bioinformatics/btz931
17. Zhou Y, Zhou B, Pache L, et al. Metascape provides a biologist-oriented resource for the
analysis of systems-level datasets. Nature Communications 2019;10(1):1523. doi:
10.1038/s41467-019-09234-6
18. Otto O, Rosendahl P, Mietke A, et al. Real-time deformability cytometry: on-the-fly cell
mechanical phenotyping. Nature Methods 2015;12:199. doi: 10.1038/nmeth.3281
https://www.nature.com/articles/nmeth.3281#supplementary-information
19. Herbig M, Kräter M, Plak K, et al. Real-Time Deformability Cytometry: Label-Free
Functional Characterization of Cells. In: Hawley TS, Hawley RG, eds. Flow Cytometry
Protocols. New York, NY: Springer New York 2018:347-69.
20. Herbig M, Mietke A, Müller P, et al. Statistics for real-time deformability cytometry:
Clustering, dimensionality reduction, and significance testing. Biomicrofluidics
2018;12(4):042214. doi: 10.1063/1.5027197
21. Mietke A, Otto O, Girardo S, et al. Extracting Cell Stiffness from Real-Time Deformability
Cytometry: Theory and Experiment. Biophysical Journal 2015;109(10):2023-36. doi:
http://dx.doi.org/10.1016/j.bpj.2015.09.006
22. Toepfner N, Herold C, Otto O, et al. Detection Of Human Disease Conditions By Single-Cell
Morpho-Rheological Phenotyping Of Whole Blood. bioRxiv 2017 doi: 10.1101/145078
23. Ekpenyong AE, Toepfner N, Fiddler C, et al. Mechanical deformation induces depolarization
of neutrophils. Science Advances 2017;3(6) doi: 10.1126/sciadv.1602536
BMJ Publishing Group Limited (BMJ) disclaims all liability and responsibility arising from any relianceSupplemental material placed on this supplemental material which has been supplied by the author(s) Ann Rheum Dis
doi: 10.1136/annrheumdis-2020-218338–218.:209 80 2021;Ann Rheum Dis, et al. Bashant KR