3D Mapping and Marking of Underground Utilities during ... · Project delays and cost overruns ......
26
Research Contract DTFH61-12-C-00025 Federal Highway Administration Cesar Quiroga Senior Research Engineer, Texas A&M Transportation Institute
Transcript of 3D Mapping and Marking of Underground Utilities during ... · Project delays and cost overruns ......

Research Contract DTFH61-12-C-00025Federal Highway Administration
Cesar QuirogaSenior Research Engineer, Texas A&M Transportation Institute

Agenda Introduction State of the practice on 3D technology Case studies Use of RFID technology for underground utilities
3D Mapping and Marking of Underground Utilities during Project Development and Delivery 2

Problems of Utility Inefficiencies Disruptions when utility installations are found
unexpectedly during construction Damage to utility installations leading to:
Disruptions in utility service Release of environmentally sensitive liquids and gases Health and safety risks
Project delays and cost overruns Unnecessary utility relocations Overdesign of structures or facilities
3D Mapping and Marking of Underground Utilities during Project Development and Delivery 3

Research Objectives Feasibility of having SHAs as the central repository of
utility data within the state highway right-of-way Potential benefits of having accurate utility data
available during project development and delivery Barriers for collecting and managing utility location
data, as well as strategies to overcome those barriers Cost to manage 3D utility location data and mark
utilities with RFID technology
3D Mapping and Marking of Underground Utilities during Project Development and Delivery 4

2D Utility Data CollectionEMI pipe and cable locator GPR unit
3D Mapping and Marking of Underground Utilities during Project Development and Delivery 5

2D Utility Mapping Utility location services: X, Y Test holes at specified locations: Z (X, Y if surveyed) ASCE/CI 38-02 Standard Guideline:
QLD: Review of existing records: X, Y QLC: Survey of visible appurtenances: X, Y QLB: Geophysical methods for underground utilities: X, Y QLA: Exposed utilities at specified locations: X, Y, Z
Test holes Valves Manholes Vaults Building basement walls
3D Mapping and Marking of Underground Utilities during Project Development and Delivery 6

Locations with QLA Data
3D Mapping and Marking of Underground Utilities during Project Development and Delivery 7
Test hole Test holeValve
Manhole

Assumed Curved Pipe Alignment
3D Mapping and Marking of Underground Utilities during Project Development and Delivery 8
Test hole Test holeValve
Manhole

Assumed Straight Pipe Alignment
3D Mapping and Marking of Underground Utilities during Project Development and Delivery 9
Test hole Test holeValve
Manhole

Assumed Horizontal Interpolation
3D Mapping and Marking of Underground Utilities during Project Development and Delivery 10
Test hole Test holeValve
Manhole
GPR and EMI ArraysGPR array EMI array
3D Mapping and Marking of Underground Utilities during Project Development and Delivery 11

3D Imagery – EMI Array
3D Mapping and Marking of Underground Utilities during Project Development and Delivery 12
Zoomed-in view, all levels shown
Zoomed-in view, with one level hidden

3D Imagery – GPR Array3D imagery Interpreted pipe locations
3D Mapping and Marking of Underground Utilities during Project Development and Delivery 13

3D Model of Existing Facilities
3D Mapping and Marking of Underground Utilities during Project Development and Delivery 14

3D Utility Visualization – Ireland
3D Mapping and Marking of Underground Utilities during Project Development and Delivery 15

Case Studies California: Data model, 3D modeling, 3D utility inventory Connecticut: Guidelines for use of 3D in projects Florida: Radar tomography for 3D utility mapping Iowa: 3D for design and grading and paving AMG North Carolina: data collection costs, 3D visualization Texas: 3D for design and construction, utility conflict Virginia: RFID for utility monitoring and inventory Washington State: 3D for design and visualization Wisconsin: 3D utility data collection
3D Mapping and Marking of Underground Utilities during Project Development and Delivery 16
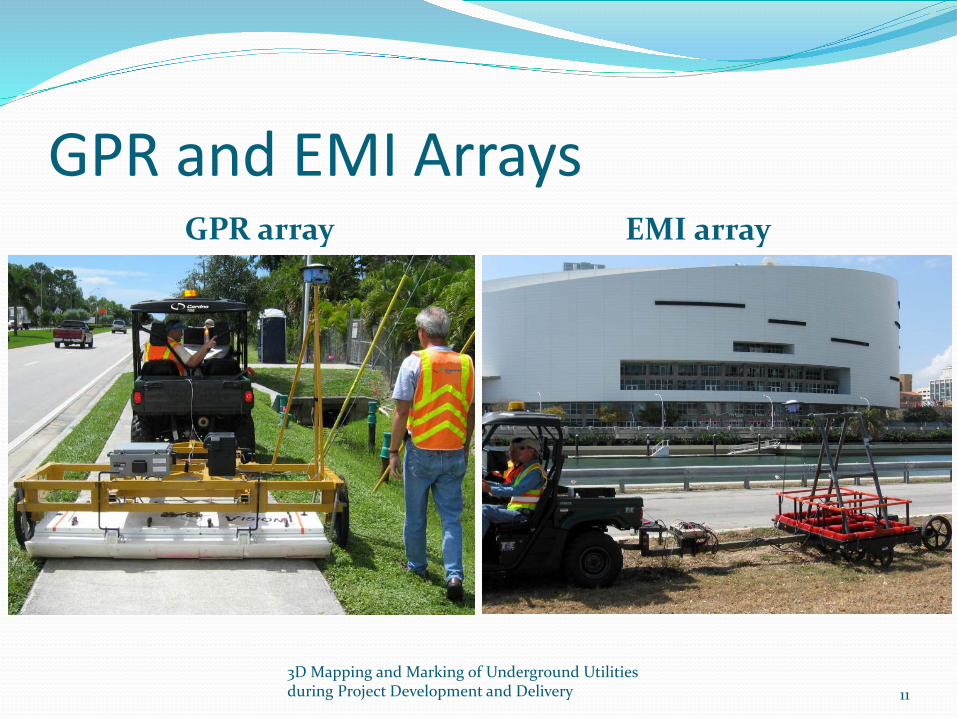
California – Port of Los Angeles $42M Berths 144-145 Backland Improvement Project 21 acres of container terminal backland improvements Design while existing berth was in operation
Limited utility investigation capability Existing utility records and info from utility companies
Utility conflict management during construction GPR-based utility inventory + test holes 3D of existing and proposed utility installations Effective web-based communication with designer
3D Mapping and Marking of Underground Utilities during Project Development and Delivery 17

Florida – FDOT Pilot radar tomography project
Two active contracts Vertical locations up to 10 feet deep Expected positional accuracy: 0.5 feet (H and V) Two modes of operation:
Standalone Combination with conventional QLB and QLA investigations
Data collected for actual projects undergoing design ‘No frills’ 3D visualizations
3D Mapping and Marking of Underground Utilities during Project Development and Delivery 18

Iowa – Iowa DOT Migrated from 2D to 3D design environment 3D modeling is now part of standard process First 3D design was in 2006
9-mile machine control grading project Four segments, three contractors
General supplemental specification that includes provisions for AMG
No separate estimate for the cost to develop 3D models Design completed in 3D, except drainage and utilities
3D Mapping and Marking of Underground Utilities during Project Development and Delivery 19

Texas – TxDOT 3D utility model and utility conflict resolution:
Review all previous utility information, including QLB data Collect additional QLB and QLA data
New utility installations on the ground after bidding
Strengthen utility permitting process PE signature and seal required Field inspection and surveying required
Build 3D utility model and integrate into main 3D model Conduct ‘hard’ and ‘soft’ clash detections Use UCM approach from SHRP 2 R15B
3D Mapping and Marking of Underground Utilities during Project Development and Delivery 20

Washington State – WDOT 3D utility model at discrete locations
3D Mapping and Marking of Underground Utilities during Project Development and Delivery 21

Washington State – WSDOT Process to develop 3D utility model:
Calculate spot utility elevations from data gathered at points such as vaults, valves, basements, and records
Use SMEs to estimate depths between spot locations Develop 3D utility model Collect QLA data at critical locations Update 3D utility model as needed
3D Mapping and Marking of Underground Utilities during Project Development and Delivery 22

Virginia – VDOT RFID marker implementation:
Mainly at VDOT’s Northern Virginia District 40% of construction projects at VDOT
Some at Fredericksburg District Purpose:
Damage prevention Evolved to support utility asset inventory and management
Motivation: Changes to utility installations after initial QLB investigation Changes to VDOT’s own underground installations
3D Mapping and Marking of Underground Utilities during Project Development and Delivery 23
3D Mapping and Marking of Underground Utilities during Project Development and Delivery 24
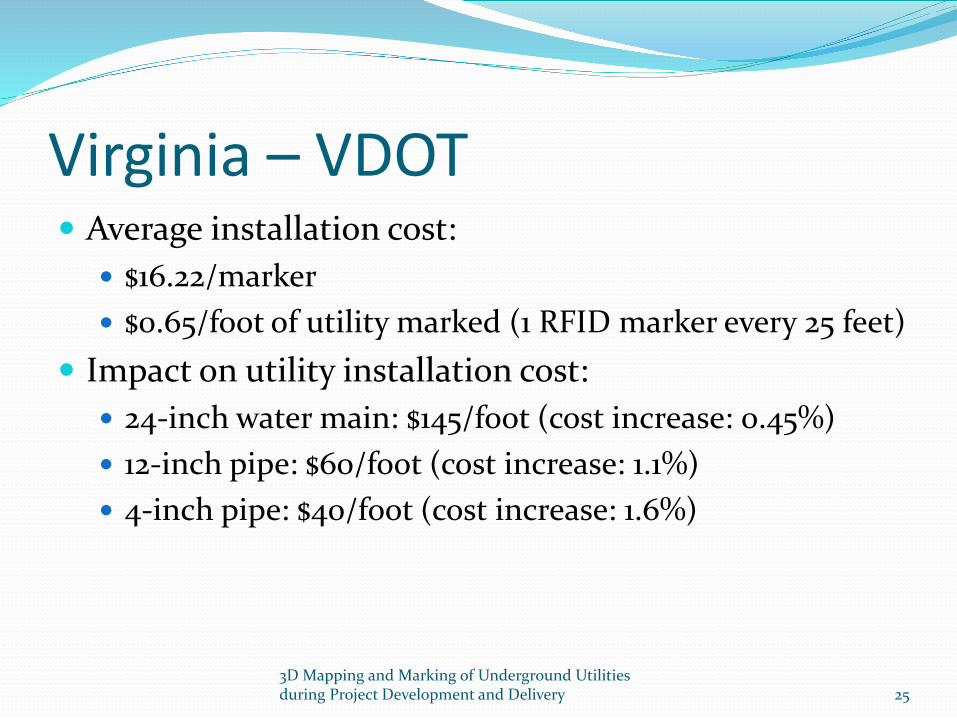
Virginia – VDOT Average installation cost:
$16.22/marker $0.65/foot of utility marked (1 RFID marker every 25 feet)
Impact on utility installation cost: 24-inch water main: $145/foot (cost increase: 0.45%) 12-inch pipe: $60/foot (cost increase: 1.1%) 4-inch pipe: $40/foot (cost increase: 1.6%)
3D Mapping and Marking of Underground Utilities during Project Development and Delivery 25

Thank You! Additional information:
Richard DuvalConstruction Civil EngineerOffice of Infrastructure Research and DevelopmentTurner-Fairbank Highway Research CenterFederal Highway AdministrationPhone: (202) 493-3365 Email: [email protected]
Cesar QuirogaSenior Research EngineerTexas A&M Transportation InstitutePhone: (210) 321-1229 Email: [email protected]
3D Mapping and Marking of Underground Utilities during Project Development and Delivery 26