
3D LIVE D1.2 Study and Create the Holistic User Experience. · 3D LIVE – 3D Live Interactions...
82
3D LIVE – 3D Live Interactions through Visual Environments Project N. 318483 D1.2 Study and Creation of the Holistic User Experience Model Date 27/11/2013 D1.2 Report on the Study and Creation of the Holistic User Experience Model Deliverable data Deliverable no & name D1.2 Report on the Study and Creation of the Holistic User Experience Model Main Contributors CENG Other Contributors IT Innovation, CERTH ITI, ARTS, Cyber Deliverable Nature Report/ Dissemination level PU Public X PP Restricted to other programme participants (including the Commission Services) RE Restricted to a group specified by the consortium (including the Commission Services) CO Confidential, only for members of the consortium (including the Commission Services) Date 27/11/2013 Status Final
Transcript of 3D LIVE D1.2 Study and Create the Holistic User Experience. · 3D LIVE – 3D Live Interactions...

3D LIVE – 3D Live Interactions through Visual Environments Project N. 318483
D1.2 Study and Creation of the Holistic User Experience Model Date 27/11/2013
D1.2 Report on the Study and Creation of the
Holistic User Experience Model Deliverable data
Deliverable no & name D1.2 Report on the Study and Creation of the Holistic User ExperienceModel
Main Contributors CENG
Other Contributors IT Innovation, CERTH ITI, ARTS, Cyber
Deliverable Nature Report/
Dissemination level PU Public X
PP Restricted to other programme participants (including the Commission Services)
RE Restricted to a group specified by the consortium (including the Commission Services)
CO Confidential, only for members of the consortium (including the Commission Services)
Date 27/11/2013
Status Final

3D LIVE – 3D Live Interactions through Visual Environments Project N. 318483
D1.2 Study and Creation of the Holistic User Experience Model Date 27/11/2013
3D LIVE Consortium Dissemination: Public 2/82
Document history
Version Date Author /Reviewer Description
V0.1 22/01/2013 Pallot, CENG Initial Structure
V0.2 6/02/2013 Pallot, CENG First draft
V0.3 20/02/2013 Pallot, CENG; Crowle, IT Innovation; Asteriadis, CERTH-ITI
Second draft
V1.0 28/02/2013 Pallot, CENG; Poussard, ARTS Final version V2.0 04/11/2013 Marco Conte, CENG
Simon Crowle, IT Innovation Dimitris Zarpalas, Stelios Astreriadis, CERTH
Updated version after the Mid-Term Review with the EC and peer review comments from 3D LIVE partners
Table of Contents 1 EXECUTIVE SUMMARY ....................................................................................................................... 4 2 INTRODUCTION ..................................................................................................................................... 5
2.1 SUMMARY OF 3D LIVE PROJECT......................................................................................................... 5 2.2 PARTNERS IN 3D LIVE PROJECT .......................................................................................................... 5 2.3 PURPOSE, INTENDED AUDIENCE AND SCOPE........................................................................................ 5 2.4 APPLICABLE DOCUMENTS.................................................................................................................... 6 2.5 DISCUSSIONS ON THE RECEIVED COMMENTS AND MODIFICATIONS MADE ON PREVIOUS VERSION ........ 6
3 HOLISTIC USER EXPERIENCE MODEL DEFINITION: ADOPTED APPROACH..................... 8 4 PREVIOUS WORK AND RELATED CONCEPTS .............................................................................. 9
4.1 USER EXPERIENCE ............................................................................................................................... 9 4.2 QUALITY OF SERVICE......................................................................................................................... 11 4.3 QUALITY OF EXPERIENCE .................................................................................................................. 11 4.4 QOS AND QOE ................................................................................................................................... 13 4.5 QUALITY OF EXPERIENCE IN 3D TELE-IMMERSIVE ENVIRONMENTS.................................................. 18
5 HOLISTIC MODEL FOR THE 3D LIVE “TWILIGHT” USER EXPERIENCE............................ 26 5.1 3D LIVE IMMERSIVE USER EXPERIENCE MODEL .............................................................................. 26 5.2 DESCRIPTION OF THE RATIONAL PART............................................................................................... 31 5.3 DESCRIPTION OF THE EXPERIENTIAL PART ........................................................................................ 32 5.4 THE PERCEPTION OF SOCIAL PRESENCE ............................................................................................. 34
6 THE EVALUATION OF USER EXPERIENCE.................................................................................. 35 6.1 EVALUATION IN 3D TELE-IMMERSIVE ENVIRONMENTS ..................................................................... 35 6.2 3D LIVE QUALITY OF SERVICE METRICS.......................................................................................... 38 6.3 3D LIVE QUALITY OF EXPERIENCE................................................................................................... 41 6.4 HOW TO USE THE UX MODEL AND QOE AND QOS METRICS............................................................... 47
7 CONCLUSIONS ...................................................................................................................................... 48 8 REFERENCES ........................................................................................................................................ 49

3D LIVE – 3D Live Interactions through Visual Environments Project N. 318483
D1.2 Study and Creation of the Holistic User Experience Model Date 27/11/2013
3D LIVE Consortium Dissemination: Public 3/82
9 ANNEX I EXISTING WORKS ON UX MODELS .............................................................................. 55 9.1 HOLISTIC VIEW OF UX ...................................................................................................................... 55 9.2 INSTANTIATING THE HOLISTIC MODEL OF USER EXPERIENCE ........................................................... 66 9.3 UX LIFE CYCLE.................................................................................................................................. 67
10 ANNEX II EVALUATION OF UX........................................................................................................ 69 10.1 INTRODUCTION .................................................................................................................................. 69 10.2 EVALUATION AND MEASUREMENT .................................................................................................... 71 10.3 EXAMPLES OF UX EVALUATION INSTRUMENTS................................................................................. 73 10.4 EVALUATION OF EMOTION................................................................................................................. 74 10.5 BRAIN–COMPUTER INTERFACES......................................................................................................... 74
11 ANNEX III EXPERIMEDIA EXPERIMENTAL DATA MANAGEMENT PLATFORM ............. 78 11.1 EDC................................................................................................................................................... 78 11.2 ES...................................................................................................................................................... 79 11.3 ESC ................................................................................................................................................... 79 11.4 EM (AND AMQP BUS) ...................................................................................................................... 79 11.5 EDM.................................................................................................................................................. 79 11.6 PHASE 0: CLIENT CONNECTION TO THE ECC...................................................................................... 79 11.7 PHASE 1: DISCOVERY PHASE.............................................................................................................. 80 11.8 PHASE 2: SET-UP PHASE ..................................................................................................................... 80 11.9 PHASE 3: LIVE MONITORING PHASE.................................................................................................... 80 11.10 PHASE 4: POST-REPORTING PHASE ..................................................................................................... 80 11.11 PHASE 5: TEAR-DOWN PHASE ............................................................................................................ 80

3D LIVE – 3D Live Interactions through Visual Environments Project N. 318483
D1.2 Study and Creation of the Holistic User Experience Model Date 27/11/2013
3D LIVE Consortium Dissemination: Public 4/82
1 Executive Summary The objective of this document is to describe the Holistic User Experience Model, to be used for the design and experimentation of the 3D LIVE teleimmersive environment and the relevant sporting applications. The results of this task consist of a UX Holistic model, suitable for providing the basis for describing any User eXperience in Tele Immersive Environments and of the relevant metrics to assess and evaluate the User eXperience (QoE and QoS metrics). The purpose of the Holistic User Experience Model is to formalise the categories of the User eXperience and, consequently, to identify specific metrics with the specific purpose of:
– Designing the User eXperience, i.e. determining which are the experience facets and categories that need to be considered for correctly involving users in the design and experimentation loop of new applications in the Future Media Internet domain;
– Evaluating the results of experimentation with users, according to scientifically defined metrics, with the aim of adopting a robust approach in a consistent way.
– providing the basis to design the User eXperience, in order to bring together earlier and in a better and structured way the user voice in the design and development loop of Future Internet Media applications.
In order to derive the Holistic User Experience Model for the 3D LIVE project, the following approach was followed:
– Extensive and detailed State-of-the-Art survey on existing work on User eXperience and relevant modelling;
– Analysis of the specific needs emerged from the first phases of the 3D LIVE project, especially the ones connected to the initially detailed scenarios for the three sporting applications (see AD(3));
– Definition of Holistic User Experience Model for the 3D LIVE project; – Definition of the QoE and QoS metrics, related to the 3D LIVE Holistic User
Experience Model, suitable for framing and evaluating the User eXperience in a structured and objective way.
Similarly to what has been done in previous works and project, the Holistic User Experience Model for the 3D LIVE project is issued in a tabular form, in which the experience is described in terms of Values or Experience Types (highlighting all the different forms in which an experience could take place), Elements of the User eXperience (describing how different elements contribute to the experience type), UX Properties (how the experience is captured), the relevant Indicators, Devices & Tools (through which the parameters relevant to the User eXperience are collected and the Data (the values collected through the sensors, suitable for supporting metrics evaluation). On this basis, Quality of Experience and Quality of Services issues were analysed, and 3D LIVE QoE and QoS metrics proposed, with a view to providing the basis for the design and the evaluation of the user experience. Possible updates of both the UX Models and relevant metrics can be done after the conduction of the 3D LIVE experimentation activities.

3D LIVE – 3D Live Interactions through Visual Environments Project N. 318483
D1.2 Study and Creation of the Holistic User Experience Model Date 27/11/2013
3D LIVE Consortium Dissemination: Public 5/82
2 Introduction The deliverable D1.2 is produced by the task T1.2 that is intended to study the most appropriate 3D LIVE User Experience Model for looking at the technological, social, and economical aspects of the 3D-LIVE Tele-Immersive Environment that form the dimensions of the User Experience Model. This report presents the resulting model that will be used at the experimentation stage in order to evaluate/measure the UX of the 3D-LIVE Tele-Immersive Environment.
2.1 Summary of 3D LIVE Project The 3D LIVE project aims to develop and experiment a User Driven Mixed Reality and Immersive (Twilight) platform connected to EXPERIMEDIA facilities (FIRE testbeds) in order to investigate the Future Internet (FI) broadband capacity to support Real-Time immersive situations as well as evaluate both the Quality of Experience (QoE) and Quality of Services (QoS) when users are fully immersed into Future Internet (IoS and IoT) based live (sport) mixed environments. The main objective consists to explore 3D/Media technologies and Internet of things in real and virtual environments in order to sense and experiment live situations. The combination of FIRE testbeds and Living Labs would enable both researchers and users to explore Future Internet capacities to enter the Tele-Immersive application market and to establish new requirements for Internet technology and infrastructure. It is expected that combining both FI technology pull and Tele-Immersion market pull would promote and accelerate the creation and adoption of innovative sportive events based FI Services by user communities (e.g. sport practitioners).
2.2 Partners in 3D LIVE project – Collaborative Engineering, Italy (Project Coordinator) – Centre for Research and Technology Hellas, Informatics and Telematics Institute,
Greece – University of Southampton, IT Innovation, UK – Arts & Metiers ParisTech, France – SportsCurve, Germany – Cyberlightning Ltd, Finland
2.3 Purpose, Intended Audience and Scope This document is reporting about the outcome of the work conducted in the task T1.2, within the Workpackage WP1, dedicated to the study and creation of the 3D LIVE User Experience Model. This deliverable D1.2, beside the traditional introduction, presents the approach followed, previous work and related concepts that are used for creating the 3D LIVE User Experience Model as well as the basic constructs adopted for modelling the 3D LIVE experience. Finally, the metric framework designed for evaluating the 3D LIVE experience is reported.

3D LIVE – 3D Live Interactions through Visual Environments Project N. 318483
D1.2 Study and Creation of the Holistic User Experience Model Date 27/11/2013
3D LIVE Consortium Dissemination: Public 6/82
The intended audience of this deliverable comes from the field of researchers and developers as well as designers up to solution architects and project managers that would like to explore innovative FI Media based applications or services in a technology push and application pull confrontation. The resulting 3D LIVE user experience model is intended to be publicly accessible. The main principle resides in the accumulated experiences that are expected to dramatically increase the level of maturity and knowledge in specific areas, or sectors, such as Augmented Sport, or in broader scope 3D Tele-Immersive, applications or services that will be duly explored, experimented and evaluated during the experimentation stage.
2.4 Applicable Documents
AD(1). 3D LIVE DOW
AD(2). 3D LIVE D6.1 Project Handbook and Quality Plan
AD(3). 3D LIVE D1.1 “Investigating and Formalise an Experiential Design Process”
AD(4). ELLIOT D1.51 “KSB Experience model evaluation and refinement report”
2.5 Discussions on the received comments and modifications made on previous version
The table of content is not up to date. The numbering of pages is incorrect. There are some typos, mainly missing white spaces probably caused by a well known bug when exchanging documents between windows 2007 and windows 2010. Table of contents, page numbering and typos were addressed. The executive summary is not a summary of the report but a brief presentation of the project. The executive summary was re-written, describing the objective of the activities, the adopted approach and the results obtained. Figure 5.6.1 is empty. The original figure 5.6.1 (which is now is 6.1 due to the document structure modification as suggested by the reviewing team) is fixed (see also point below). Here again, many parts are excerpted from other reports and books without proper references. Some major parts come directly from the reports (e.g. D1.5.1) of the Elliot project. As suggested by the reviewing team, the part coming from the ELLIOT project is now reported in the annexes. All the works considered in the state-of-the-art survey are duly reported in Chapter 8.

3D LIVE – 3D Live Interactions through Visual Environments Project N. 318483
D1.2 Study and Creation of the Holistic User Experience Model Date 27/11/2013
3D LIVE Consortium Dissemination: Public 7/82
As for D1.1, this is a good state-of-the-art but the added value for the project is unclear as the link with 3D live scenarios lacks substance. The specificities of the project are not addressed in a fully developed manner. Further to the comments received during the review meeting, the following modifications were done: All the background information was placed as Annex and only the part relevant to the 3D LIVE specific context was left in the main document body; A Chapter describing the approach and work logic adopted for the activities conducted in T1.2 (and also in conjunction with the interlinked T1.1. task) was added (see chapter 3 in the current version), in which it is explained how the specific needs of the 3D LIVE project were considered. As reported for the T1.1 activities, 3D LIVE sporting scenarios were analysed within the project as first project activities, in order to provide the UX design tasks with clear and concrete reference examples.

3D LIVE – 3D Live Interactions through Visual Environments Project N. 318483
D1.2 Study and Creation of the Holistic User Experience Model Date 27/11/2013
3D LIVE Consortium Dissemination: Public 8/82
3 Holistic User Experience Model definition: adopted approach The task to derive the Holistic User Experience Model for the 3D LIVE project is of course conceptually interlinked with the task to define the methodology to design the User Experience. In order to do that, the following approach was followed:
– Extensive and detailed State-of-the-Art survey on existing work on User eXperience and relevant modelling. Existing work on User Experience modelling and underlining concepts was deeply analysed, with a twofold objective: • To avoid duplication of work and overlapping with available results; • To build upon those, with a view of designing the 3D LIVE model using
already adopted methodologies and consolidated approach for describing the User eXperience.
Available results from other EC projects were considered (see Annex I), while an extensive desk search was performed to align the 3D LIVE research effort to current trends. References to the consulted work (see also Annex II) are duly reported in Chapter 8;
– Analysis of the specific needs emerged from the first phases of the 3D LIVE project, especially the ones connected to the initially detailed scenarios for the three sporting applications as well as the ones captured from the specific EXPERIMEDIA context. As explained before, this task was logically interlinked with T1.1 of the 3D LIVE project, in which the three sporting scenarios were duly analysed and described. This gave us the opportunity to have a specific context against which to create the Holistic User Experience Model and to verify if at least it matches the project modelling needs. Additionally, the EXPERIMEDIA project was analysed, in terms of the system which is being implemented and what possibilities are on offer for the capturing and analysis of data which are relevant for describing the User eXperience (see Annex III);
– Definition of Holistic User Experience Model for the 3D LIVE project. On the basis of the previous steps, the modelling approach for the Use eXperience for 3D LIVE project was derived. The model is supposed to be Holistic, as it contains all the elements and properties which are supposed to be used for the User eXperience description. On the basis of the specific cases, some of the elements and properties could be more relevant with respect to others and the model (and the QoE and QoS below) needs to be instantiated, i.e. to select those specific experience elements which fit the needs of a specific experience (for instance, our sporting applications) to be designed;
– Definition of the QoE and QoS metrics, related to the 3D LIVE Holistic User Experience Model, suitable for framing and evaluating the User eXperience in a structured and objective way. The Holistic User Experience Model is completed by tables for QoE and QoS metrics, which provide a suggested framework for assessing and evaluating the User eXperience in an objective, structured and repetitive way.
3D LIVE – 3D Live Interactions through Visual Environments Project N. 318483
D1.2 Study and Creation of the Holistic User Experience Model Date 27/11/2013
3D LIVE Consortium Dissemination: Public 9/82
4 Previous Work and Related concepts
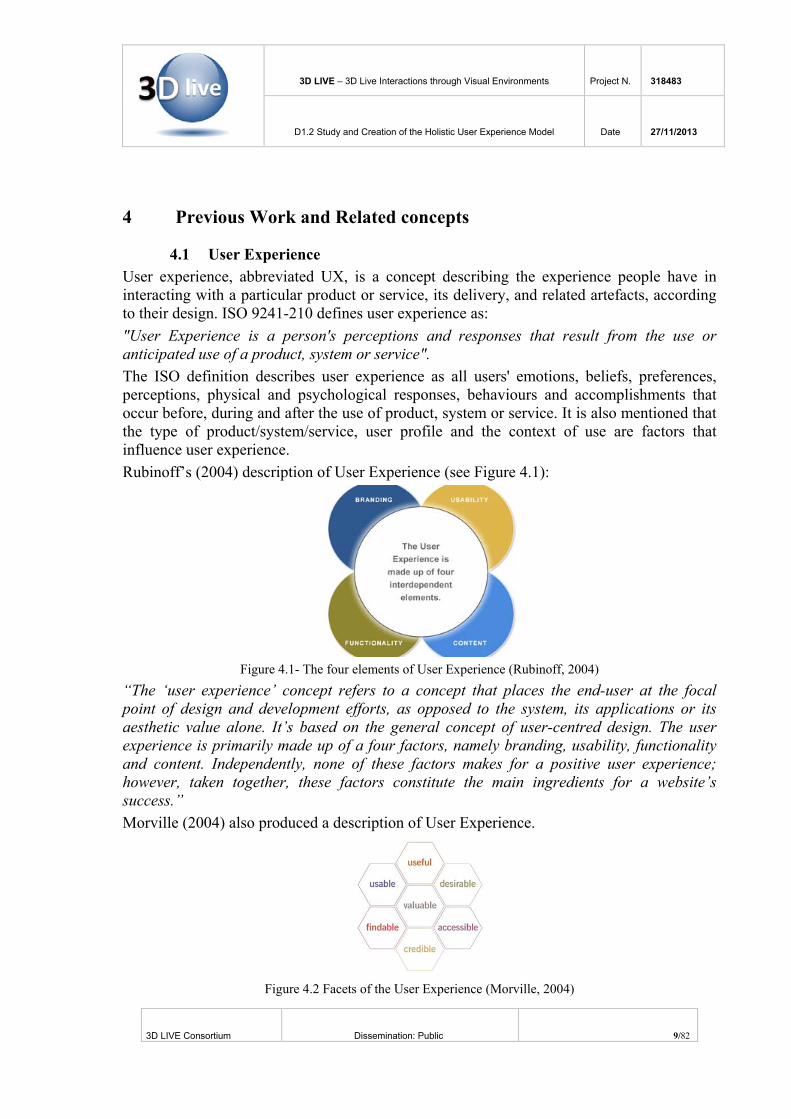
4.1 User Experience User experience, abbreviated UX, is a concept describing the experience people have in interacting with a particular product or service, its delivery, and related artefacts, according to their design. ISO 9241-210 defines user experience as: "User Experience is a person's perceptions and responses that result from the use or anticipated use of a product, system or service". The ISO definition describes user experience as all users' emotions, beliefs, preferences, perceptions, physical and psychological responses, behaviours and accomplishments that occur before, during and after the use of product, system or service. It is also mentioned that the type of product/system/service, user profile and the context of use are factors that influence user experience. Rubinoff’s (2004) description of User Experience (see Figure 4.1):
Figure 4.1- The four elements of User Experience (Rubinoff, 2004)
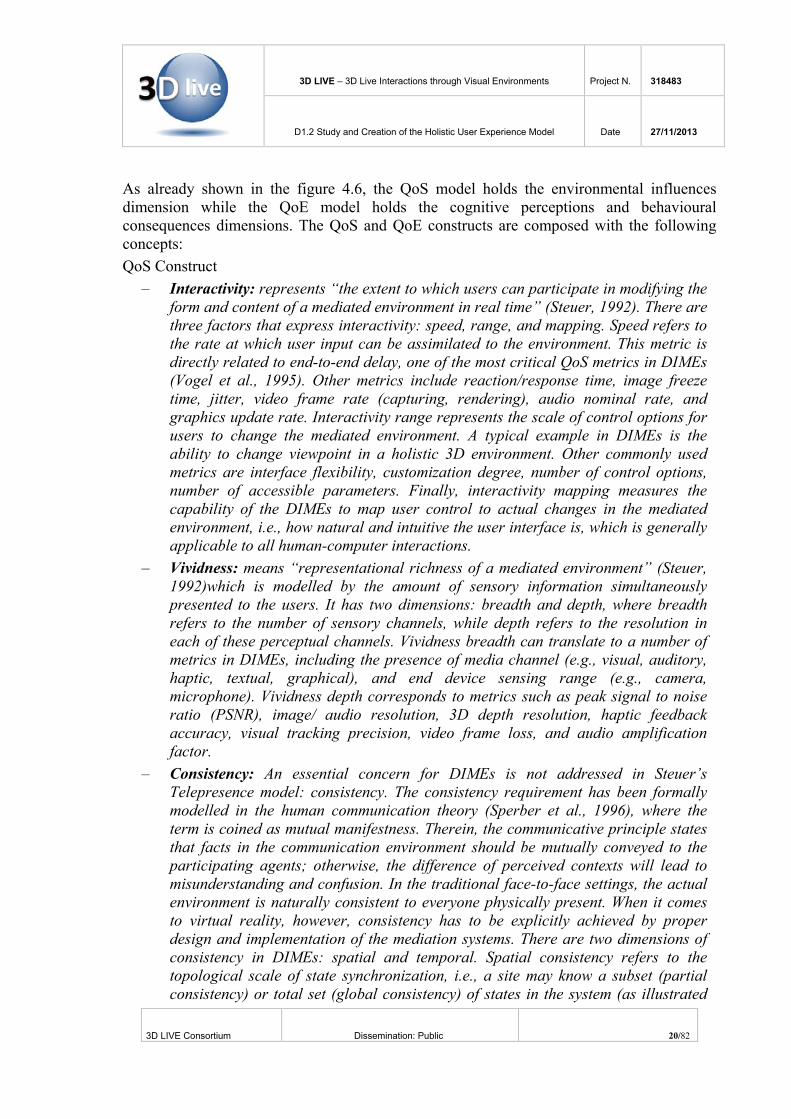
“The ‘user experience’ concept refers to a concept that places the end-user at the focal point of design and development efforts, as opposed to the system, its applications or its aesthetic value alone. It’s based on the general concept of user-centred design. The user experience is primarily made up of a four factors, namely branding, usability, functionality and content. Independently, none of these factors makes for a positive user experience; however, taken together, these factors constitute the main ingredients for a website’s success.” Morville (2004) also produced a description of User Experience.
Figure 4.2 Facets of the User Experience (Morville, 2004)

3D LIVE – 3D Live Interactions through Visual Environments Project N. 318483
D1.2 Study and Creation of the Holistic User Experience Model Date 27/11/2013
3D LIVE Consortium Dissemination: Public 10/82
Morville explains each facet (see Figure 4.2) or quality of the user experience in the following way:
– Useful. As practitioners, we can't be content to paint within the lines drawn by managers. We must have the courage and creativity to ask whether our products and systems are useful, and to apply our deep knowledge of craft and medium to define innovative solutions that are more useful.
– Usable. Ease of use remains vital, and yet the interface-centred methods and perspectives of human-computer interaction do not address all dimensions of web design. In short, usability is necessary but not sufficient.
– Desirable. Our quest for efficiency must be tempered by an appreciation for the power and value of image, identity, brand, and other elements of emotional design.
– Findable. We must strive to design navigable web sites and locatable objects, so users can find what they need.
– Accessible. Just as our buildings have elevators and ramps, our web sites should be accessible to people with disabilities (more than 10% of the population). Today, it's good business and the ethical thing to do. Eventually, it will become the law.
– Credible. Thanks to the Web Credibility Project, we're beginning to understand the design elements that influence whether users trust and believe what we tell them.
– Valuable. Our sites must deliver value to our sponsors. For non-profits, the user experience must advance the mission. With for-profits, it must contribute to the bottom line and improve customer satisfaction.”
Hassenzahl et al (2000) argued that usability could be broadly defined as quality of use. However, they found that this broad definition neglects the contribution of perceived fun and enjoyment to user satisfaction and preferences. Therefore, they recently suggested a model taking “hedonic quality” (HQ; i.e., non-task-oriented quality aspects such as innovativeness, originality, etc.) and the subjective nature of “Appealingness” into account. The results of an empirical study carried out by Schrepp et al (2006)show that pragmatic and hedonic qualities have an impact on attractiveness. They concluded: “The more attractive an interface, the higher is the preference of subjects for this interface.” Van Schaik and Ling (2008) explained that recent research into user experience has identified the need for a theoretical model to build cumulative knowledge in research addressing how the overall quality or ‘goodness’ of an interactive product is formed. They built an experiment for testing and extending Hassenzahl’s model of aesthetic experience (Hassenzahl et al, 2000). Their study used an experimental design with principles of screen design, principles for organising information on a web page and experience of using a web site. The hedonic perceptions and evaluations of a web site, as well as measures of task performance, navigation behaviour and mental effort constituted the dependent variables. Measures were sensitive to manipulation of web design. Beauty was influenced by hedonic attributes (identification and stimulation), but Goodness by both hedonic and pragmatic (user-perceived usability) attributes as well as task

3D LIVE – 3D Live Interactions through Visual Environments Project N. 318483
D1.2 Study and Creation of the Holistic User Experience Model Date 27/11/2013
3D LIVE Consortium Dissemination: Public 11/82
performance and mental effort. Hedonic quality was more stable with experience of web-site use than pragmatic quality and Beauty was more stable than Goodness.
4.2 Quality of Service Quality of Service (QoS) attempts to objectively measure the service delivered by the vendor. QoS is tied closely to the black and white of a contract and measures how well the vendor lives up to its end of the bargain. A vendor may be living up to the terms of a contract's language, thus rating high in QoS, but, the users may be very unhappy, thus causing a low QoE. Conversely, the users may be very happy with a product or a vendor, resulting in an artificially high QoE if the vendor is not, in fact, doing what he was paid to do, thus rating low in QoS. According to the 4WARD Project, implementation of QoS techniques on a large scale is far from trivial and is often seen as a cost, which many network operators would prefer to avoid, or at least minimise, as they are difficult to configure properly, requiring a full understanding of the complex mechanisms behind. In this scenario, In-Network Management constitutes a promising tool to simplify and improve scalability of QoS management operations. It overcomes traditional network management limitations through real-time monitoring functions and automated configuration management. Also, it can support adaptation and self-configuration of large-scale networks according to external events and permits low-cost operation. These capabilitie scan be used to push QoS management capabilities into the network and distribute QoS management logic across all nodes. Another major transformation in future networks is virtualisation of resources and the decoupling of networks and infrastructure. This requires QoS to be handled at two levels in a virtualisation-based environment – inside a virtual network, any standard QoS mechanism should in principle be defined and deployed; at the substrate level, QoS isolation between virtual networks is the key requirement. This 2-level approach is particularly complicated in multi-domain scenarios, as the underlying substrate path will probably be based on multiple disparate physical network domains. Finally, solely QoS cannot measure users’ satisfaction, as it requires a broader set of metrics, which are usually combined in the Quality of Experience (QoE) concept. In this regard, NetInf can bring important benefits in terms of upgrading the QoE perceived by the user. Examples are efficient large-scale distribution, increased information availability, and increased security.
4.3 Quality of Experience Quality of Experience (QoE), some times also known as "Quality of User Experience," is a subjective measure of a customer's experiences with a vendor. It looks at a vendor's, or purveyor's, offering from the standpoint of the customer or end user, and asks, "What mix of goods, services, and support, do you think will provide you with the perception that the total product is providing you with the experience you desired and/or expected?" It then asks, "Is this what the vendor/purveyor has actually provided?" If not, "What changes need to be made to enhance your total experience?"

3D LIVE – 3D Live Interactions through Visual Environments Project N. 318483
D1.2 Study and Creation of the Holistic User Experience Model Date 27/11/2013
3D LIVE Consortium Dissemination: Public 12/82
Alben (1996) describes QoE in the following way: By “experience” we mean all the aspects of how people use an interactive product: the way it feels in their hands, how well they understand how it works, how they feel about it while they’re using it, how well it serves their purposes, and how well it fits into the entire context in which they are using it. If these experiences are successful and engaging, then they are valuable to users and noteworthy to the interaction design awards jury. We call this “quality of experience.”
Figure 4.3 – Criteria for Effective Interaction Design
The following question synthetises all the below detailed criteria (see Figure 4.3): “How does effective interaction design provide people with a successful and satisfying experience?” Understanding of users: How well was the design team grounded in understanding the needs, tasks and environments of the people for whom the product was designed? How was that learning reflected in the product? Effective design process: Is the product a result of a well-thought out and well-executed design process? What were the major design issues that arose during the process and what was the rationale and method for resolving them? What methodologies were employed, such as user involvement, iterative design cycles and interdisciplinary collaboration? How were budgeting, scheduling and other practical issues, such as interpersonal communications, managed to support the goals of the design process? Needed: What need does the product satisfy? Does it make a significant social, economic or environmental contribution? Learnable and Usable: Is the product easy to learn and use? Does the product communicate a sense of its purpose, how to begin and how to proceed? Is this learning easy to retain over time? Are the product’s features self-evident and self-revealing?How well does the product support and allow for the different ways people will approach and use it,

3D LIVE – 3D Live Interactions through Visual Environments Project N. 318483
D1.2 Study and Creation of the Holistic User Experience Model Date 27/11/2013
3D LIVE Consortium Dissemination: Public 13/82
considering their various levels of experience, skills and strategies for problem solving? Appropriate: Does the design of the product solve the right problem at the right level? Does the product serve users in efficient and practical ways? How did considering social, cultural, economic and technical aspects of the problem contribute to an appropriate solution? Aesthetic experience: Is using the product an aesthetically pleasing and sensually satisfying one? Is the product cohesively designed, exhibiting continuity and excellence across graphic, interaction, information and industrial design? Is there a consistency of spirit and style? Does the design perform well within technological constraints? Does it accomplish an integration of software and hardware? Mutable: Have the designers considered whether mutability is appropriate or not? How well can the product be adapted to suit the particular needs and preferences of individuals and groups? Does the design allow the product to change and evolve for new, perhaps unforeseen, uses? Manageable: Does the design of the product move beyond understanding “use” merely as functionality and support the entire context of use? For example, does the product account for and help users manage needs such as installation, training, maintenance, costs and supplies? Have these needs and others been considered in an individual as well as an organizational sense? Does the design of the product take into account issues such as negotiating competition for use and the concept of “ownership,” including rights and responsibilities?
4.4 QoS and QoE De Marez and De Moor (2007) describe a conceptual model, based on QoE dimensions, which integrates the previously separated visions (Wright, McCarthy, 2003) and intends to enable more appropriate measurement and understanding of the QoE concept. This model consists of five main building blocks:
– Quality of Effectiveness: represents the traditional ‘Quality of Service’ approach on QoE;
– Usability: often already integrated in many QoE-definitions, is however approached in terms of behavioural usability focused on the ease of working, user friendliness, the man-machine interaction;
– Quality of Efficiency: is meant to cover the subjective character of Quality of Experience, such as a certain type of interface will be very clear for one user, while it remains very complex for another;
– Expectations: is included in the conceptual model to enable the measurement of the previous subjective dimension (the degree to meet expectations determines the Quality of Efficiency) in an adequate way;
– Context: comprises five types of context: environmental, personal/social, cultural, technological and organisational.
Authors explain that the conceptual model cannot be considered as exhaustive on the level

3D LIVE – 3D Live Interactions through Visual Environments Project N. 318483
D1.2 Study and Creation of the Holistic User Experience Model Date 27/11/2013
3D LIVE Consortium Dissemination: Public 14/82
of sub-dimensions. They proposed a tentative model for covering both the technology performance measurement (QoS,) and the users’ perceived performance (QoE). It means that they evaluate what people expect, do, would like to do with the technology and in what context they intend to use it. It also means to evaluate up to what degree it is meeting users’ expectations, happiness and resulting satisfaction. The concept of ‘Quality of Experience’ acquired a central place in the literature, as the success or failure of new technologies has become highly dependent on the user’s experience. As a result, gaining insight in this ‘Quality of Experience’ can be seen as a necessary condition for delivering good experiences. De Marez and De Moor (2007) identify two main challenges with regard to QoE. Due to the inconsistency and conceptual ambiguity in the literature, the first challenge consists to decipher the QoE concept through the description of a QoE conceptual model (Figure 4.4). From this proposed QoE model, authors aim to stress the multidimensional and subjective character of the QoE concept and propose the base for an improved measurement approach.
Figure 4.4 – Quality of Experience from a user point of view (De Marez, De Moor, 2007)
In De Moor and colleagues(2010) previous research study, they explored the relevance of Living Labs for QoE measurement of mobile multimedia applications and services. They do believe that the Living Lab approach would facilitate the continuous and systematic involvement of users and enable researchers to better understand the drivers and barriers of Quality of Experience in multiple real life contexts. They further explain that the increased emphasis on users and their QoE has stimulated the involvement of users in the technology R&D process, though, still limited by traditional boundaries due to user research methods (e.g. translation of user requirements into technical requirements and vice versa). They

3D LIVE – 3D Live Interactions through Visual Environments Project N. 318483
D1.2 Study and Creation of the Holistic User Experience Model Date 27/11/2013
3D LIVE Consortium Dissemination: Public 15/82
conclude that to fully seize the opportunities of the Living Lab approach, more interdisciplinary and systematic approaches should be explored. Other papers on QoS and QoE related to 3D LIVE are listed in the following table 4.1.

3D LIVE – 3D Live Interactions through Visual Environments Project N. 318483
D1.2 Study and Creation of the Holistic User Experience Model Date 27/11/2013
3D LIVE Consortium Dissemination: Public 16/82
Ref QoS/QoE Reference Description
Q1 The Memory Effect and Its
Implications on Web QoE Modelling
(Hossfeld et al., 2011)
Existing QoE models for this domain do not consider temporal dynamics or historical experiences of the user’s satisfaction while consuming a certain service.
Q2 QoE Evaluation of Voice Communication Systems
using Affect‐based Approach
(Bhattacharya et al., 2011)
Investigate a new affect‐based approach for QoE evaluation. Our hypothesis states that QoE in voice communication is correlated to user’s affective behaviour, which will vary across networking conditions.
Q3 QoE ‐ a Buzzword or the Key
to Successful Multimedia Delivery Across Networks?
(Reiter, 2011) Looks at QoE as a means to successfully deliver multimedia content across networks. It briefly summarizes the current state of the art in QoE research and focuses on the problem of content categorization as a main requirement for a proper QoE management implementation.
Q4
Game Cloud Design with Virtualized CPU/GPU Servers
and Initial Performance Results
(Zhao et al., 2012)
Enable interactive gaming by taking full advantage of the cloud and local resources for high quality of experience (QoE) gaming.
Q5 ConEx Based QoE Feedback
to Enhance QoS (Shirazipour et
al., 2012) Quality of service (QoS) generally represents the performance of packet networks. Quality of experience (QoE) defines the quality perceived by end‐users of applications running on these networks.
Q6 A Service Quality
Coordination Model Bridging QoS and QoE
(Yamazaki and Eguchi, 2012)
After sorting out the concepts and specification of QoS and QoE, a service quality coordination model combining these is proposed. The model is applied to a video‐sharing service and its coordination model is derived based on subjective experiments. The structural equation modelling is used to compute the user satisfaction from QoS and QoE.
Q7
A Vertical Handover Decision based Context Awareness
Guaranteeing the User Perceived QoS
(Maaloul et al., 2012)
Investigate all type of information that can form the context‐aware that integrate the Quality of Experience (QoE) or the Perceived Quality of Service (PQoS) by the user in making handover decision. We propose a handover making decision algorithm based on the user requirements that reduces the decision delay in network selection by reducing the number of the target PoAs for different class of service features and improve the user perceived quality.
Q8
A Probabilistic Context‐Aware Approach for QoE
Measurement in Pervasive Systems
(Mitra et al., 2011)
Our approach accommodates user, device and quality of service (QoS) related context parameters to determine the overall QoE of the user.

3D LIVE – 3D Live Interactions through Visual Environments Project N. 318483
D1.2 Study and Creation of the Holistic User Experience Model Date 27/11/2013
3D LIVE Consortium Dissemination: Public 17/82
Ref QoS/QoE Reference Description
Q9 Adaptive QoE measurement
on video‐streaming IP services
(Lozano et al., 2012)
Essential for these services is the Quality of Experience (QoE) as it is perceived by the user. This paper presents a low cost device and a procedure to measure on‐line the quality of a video streaming according to the end user perception.
Q10 QOE: Defining the Criteria for Effective Interaction Design
(Alben, 1996) Experience means all the aspects of people using an interactive product: the way it feels in their hands, how well they understand how it works, how they feel about it while they’re using it, how well it serves their purposes, and how well it fits into the entire context in which they are using it.
Q11
QoE in Distributed Interactive Multimedia Environments:
Toward a Theoretical Framework
(Wu et al., 2009)
The past decades have witnessed a rapid growth of Distributed Interactive Multimedia Environments (DIMEs). Despite their intensity of user‐involved interaction, the existing evaluation frameworks remain very much system‐centric. As a step toward the human‐centric paradigm, we present a conceptual framework of Quality of Experience (QoE) in DIMEs, to model, measure, and understand user experience and its relationship with the traditional QoS metrics.
Q12 Linking Users’ subjective QoE
Evaluation (De Moor et al,
2010)
Although the literature on Quality of Experience (QoE) has boomed over the last few years, only a limited number of studies have focused on the relation between objective technical parameters and subjective user‐centric indicators of QoE. Building on an overview of the related literature, this paper introduces the use of a software‐monitoring tool as part of an interdisciplinary approach to QoE measurement.
Q13 Quality of Experience in
communications Ecosystem (Kilkki et al.,
2008)
Communications ecosystem covers a huge area from technical issues to business models and human behaviour. Engineers talk about network performance and quality of service; business people talk about average revenue per user and customer churn while behavioural scientists talk about happiness and experiences. In addition to the apparent conceptual ambiguity, the main challenges of ecosystem analysis are to realistically model human behaviour, and to efficiently combine the models developed for different domains. A central aspect is on the role of QoE by means of a common framework that covers the whole communications ecosystem.
Table 4.1 – Titles, References and abstracts of existing papers on QoS and QoE related to 3D LIVE

3D LIVE – 3D Live Interactions through Visual Environments Project N. 318483
D1.2 Study and Creation of the Holistic User Experience Model Date 27/11/2013
3D LIVE Consortium Dissemination: Public 18/82
4.5 Quality of Experience in 3D Tele-Immersive Environments Few years ago, Wu and colleagues (2009) described a user-centric QoE conceptual framework for the area of distributed interactive multimedia environments as he found the existing evaluation frameworks very much system-centric despite the intensity of user-involved interaction. This QoE theoretical framework is expected to help model, measure and understand user experience (UX) as well as the relationship with QoS metrics. This framework is based on theoretical results from different fields of research, namely: psychology, cognitive sciences, sociology and information technology. They use a mapping methodology to quantify the QoS and QoE correlations. Authors identify 3D Tele-Immersion (3DTI) comparable to video-conferencing and multi-player gaming environments in terms of highest level of user interaction. It is important to note that it is not only about user interaction with the technology but among the users through different communication channels. Even more important, they emphasise that empirical findings have shown that systems excelling in the QoS area can completely fail with the user adoption due to the remaining gap between system and user centric evaluations (Davis et al., 1989). Wu and colleagues represent QoE as a multidimensional construct of user perceptions and behaviours where the QoS-QoE relationship is a causal chain of the following sequence: “environmental influences (QoS)-> cognitive perceptions -> behavioural consequences (QoE) (Mehrabian et al., 1980)”. Their definition of QoE is the following: “QoE is a multi-dimensional construct of perceptions and behaviours of a user, which represents his/her emotional, cognitive, and behavioural responses, both subjective and objective, while using a system.” Figure 4.5 illustrates QoS metrics as environmental factors that influence QoE while there is also a feedback loop from QoE to QoS (dashed arrow) as users’ requirements and responses may drive the QoS configuration. Authors explore the QoS-QoE mapping (correlation) methodology through the empirical studies of a 3DTI system. The holistic virtual environment (see Figure 4.5) represents the 3DTI systems relying on Real-Time multi-view 3D video as the 3D representations of remote users are immersed into a virtual space allowing body movement interactions.
Figure 4.5 – Causal Chain in the QoS-QoE Framework and Communication Model (Wu et al., 2009)

3D LIVE – 3D Live Interactions through Visual Environments Project N. 318483
D1.2 Study and Creation of the Holistic User Experience Model Date 27/11/2013
3D LIVE Consortium Dissemination: Public 19/82
While they define QoS a set of measures for turning or quantifying the performance of applications, systems and networks, QoE is, for ITU-T standardisation group, represented by Mean Opinion Score (MOS) or the degree to which a system meets the users’ tacit and explicit experience expectations (Beauregard et al., 2007); or even the degree of users’ satisfaction, user perceived performance and finally the subjective measure of a customer’s experiences with a vendor.
Figure 4.6 –QoS-QoE Protocol Stack (Wu et al, 2009)
The QoS of the application-system-network metrics chain directly impact the QoE and especially those that are perceptible to the users, hence directly correlated to QoE (see Figure 4.6).Wu and colleagues present their Distributed Interactive Multimedia Environment (DIME) integrated quality framework with its theoretical foundations (see Figure 4.7) with both QoS and QoE constructs, dimensions and metrics that are identified and modelled in terms of their inter-relationships.
Figure 4.7 – DIME Integrated Quality Framework (Wu et al., 2009)
3D LIVE – 3D Live Interactions through Visual Environments Project N. 318483
D1.2 Study and Creation of the Holistic User Experience Model Date 27/11/2013
3D LIVE Consortium Dissemination: Public 20/82
As already shown in the figure 4.6, the QoS model holds the environmental influences dimension while the QoE model holds the cognitive perceptions and behavioural consequences dimensions. The QoS and QoE constructs are composed with the following concepts: QoS Construct
– Interactivity: represents “the extent to which users can participate in modifying the form and content of a mediated environment in real time” (Steuer, 1992). There are three factors that express interactivity: speed, range, and mapping. Speed refers to the rate at which user input can be assimilated to the environment. This metric is directly related to end-to-end delay, one of the most critical QoS metrics in DIMEs (Vogel et al., 1995). Other metrics include reaction/response time, image freeze time, jitter, video frame rate (capturing, rendering), audio nominal rate, and graphics update rate. Interactivity range represents the scale of control options for users to change the mediated environment. A typical example in DIMEs is the ability to change viewpoint in a holistic 3D environment. Other commonly used metrics are interface flexibility, customization degree, number of control options, number of accessible parameters. Finally, interactivity mapping measures the capability of the DIMEs to map user control to actual changes in the mediated environment, i.e., how natural and intuitive the user interface is, which is generally applicable to all human-computer interactions.
– Vividness: means “representational richness of a mediated environment” (Steuer, 1992)which is modelled by the amount of sensory information simultaneously presented to the users. It has two dimensions: breadth and depth, where breadth refers to the number of sensory channels, while depth refers to the resolution in each of these perceptual channels. Vividness breadth can translate to a number of metrics in DIMEs, including the presence of media channel (e.g., visual, auditory, haptic, textual, graphical), and end device sensing range (e.g., camera, microphone). Vividness depth corresponds to metrics such as peak signal to noise ratio (PSNR), image/ audio resolution, 3D depth resolution, haptic feedback accuracy, visual tracking precision, video frame loss, and audio amplification factor.
– Consistency: An essential concern for DIMEs is not addressed in Steuer’s Telepresence model: consistency. The consistency requirement has been formally modelled in the human communication theory (Sperber et al., 1996), where the term is coined as mutual manifestness. Therein, the communicative principle states that facts in the communication environment should be mutually conveyed to the participating agents; otherwise, the difference of perceived contexts will lead to misunderstanding and confusion. In the traditional face-to-face settings, the actual environment is naturally consistent to everyone physically present. When it comes to virtual reality, however, consistency has to be explicitly achieved by proper design and implementation of the mediation systems. There are two dimensions of consistency in DIMEs: spatial and temporal. Spatial consistency refers to the topological scale of state synchronization, i.e., a site may know a subset (partial consistency) or total set (global consistency) of states in the system (as illustrated

3D LIVE – 3D Live Interactions through Visual Environments Project N. 318483
D1.2 Study and Creation of the Holistic User Experience Model Date 27/11/2013
3D LIVE Consortium Dissemination: Public 21/82
in Figure 4.8). In large-scale systems, it is often not practical or necessary to achieve global spatial consistency. So a player in MMORPGs only gets updates from those players in proximity though many others can be in the same session. The commonly used metrics for spatial consistency include coverage, completeness, and consensus. Temporal consistency refers to the degree of time synchronization of all states in the DIME systems, which is hypothesized to impose a more significant impact on user QoE than its spatial counterpart. In DIMEs, the local states are exchanged over networks to create the shared communicative context for everyone, which inevitably incurs inconsistencies due to the existence of propagation delays, lossy links, etc. Researchers have proposed conceptual models to characterize temporal consistency in distributed environments. Figure 4.8 illustrates the absolute consistency and delayed consistency models for DIMEs (Qin, 2002), where the former ensures that all operations execute at the same time across the system and the latter trades the degree of consistency for response time by allowing local operations to instantaneously take effect. The corresponding QoS metrics for temporal consistency include phase difference, dropping ratio (due to synchronization), uniformity of flow, drift distance, and continuity.
Figure 4.8 – Temporal and Spatial consistency Models (Wu et al., 2009)
QoE construct – Cognitive Perceptions
– Flow: For the role of task executant, flow can measure “the holistic sensation that people feel when they act with total involvement”, which is the main intrinsic motivation for people to perform activities that provide no discernible extrinsic rewards (Csikszentmihalyi, 1990). When in the flow state, people focus their full attention on the task at hand; they perceive a sense of control and great enjoyment. The intense experiential involvement is a natural moment-to-moment flow of mind, and is found universal in human activities such as reading, chess playing, and rock climbing (Csikszentmihalyi, 1997). Flow was originally characterized via eight

3D LIVE – 3D Live Interactions through Visual Environments Project N. 318483
D1.2 Study and Creation of the Holistic User Experience Model Date 27/11/2013
3D LIVE Consortium Dissemination: Public 22/82
components, including clear goals, feedback, challenge/skill balance, concentration, sense of control, loss of self consciousness, distorted sense of time, and intrinsic enjoyment. Although these are valuable components, the flow concept was too broadly defined, failing to capture some specific characteristics of the technological environments. Subsequent research on computer-mediated interaction has adapted its list of metrics (Ghani et al., 1994; Hoffman et al. 1996; Koufaris, 2002). Based on our empirical findings in previous research (Sheppard et al., 2008; Yang, 2006), we identify three metrics that are significantly relevant to DIMEs: concentration, intrinsic enjoyment, and sense of control.
– Telepresence: Users in DIMEs are also participants in remote telecommunication. Telepresence characterizes user’s perceptual “sense of being” or “sense of presence” in the holistic communication environment rather than in the real world. Users have reported their Telepresence experience in various ways, e.g., “I’m noticing a different awareness, somewhat like an out of body experience”, “I feel like our body exists in the 3D virtual environment, rather than the real world” (Sheppard et al., 2008),“My immediate surroundings became less important and/or noticeable - as if I almost forgot them”, “I felt like I came back to the ‘real world’ after a journey.” In fact, the difference between virtual reality and other media was defined as a difference in the level of presence (Steuer, 1992). So the metric is a significant indicator of user experience in DIMEs.
Figure 4.9 – Telepresence dimensions (Wu et al., 2009)
– Perceived Technology Acceptance: The flow metrics convey the psychological experience of users without considering the technological environments. We use the Technology Acceptance Model (TAM) (Davis, 1989) to further account for user’s perceptions/attitudes toward the technology in the role of a technology user. The perceived usefulness and perceived ease of use are the two belief variables of TAM. The former represents “the degree to which a person believes that using a particular system would enhance his/her performance”, whereas the latter defines “the degree to which a person believes that using a particular system would be free of effort”. The flow metric “sense of control” and the TAM’s belief variable “perceived ease of use” are strongly related, and are thus combined into one. According to the theory of reasoned action (Fishbein et al., 1975), beliefs about the consequences of performing the behaviour largely shape one’s behavioural intentions and consequences. By treating DIMEs as IT systems, we can apply TAM and examine how the two belief metrics predict user adoption of technology.

3D LIVE – 3D Live Interactions through Visual Environments Project N. 318483
D1.2 Study and Creation of the Holistic User Experience Model Date 27/11/2013
3D LIVE Consortium Dissemination: Public 23/82
QoE construct – Behavioural Consequences
– Performance Gains: Performance gains represent the amount of increase in user’s performance on certain tasks, which can be measured subjectively and objectively. The metrics of this dimension depend on the actual application environments and task requirements. Researchers usually design controlled studies to quantify performance gains in well-specified tasks, where the widely used metrics are the ratio of successful attempts and completion time (Ranjan et al., 2006). It is hypothesized that cognitive experience is positively correlated with performance gains.
– Exploratory Behaviours: Exploratory behaviours represent user’s spontaneous exploration of the technology with no particular pre-set plans or goals. It has been shown that cognitive perceptions are positively correlated with the yield of exploratory behaviours (Ghani, 1994). Exploratory behaviours can be measured subjectively and objectively. The metrics here are application-specific as those for performance gains. As a simple example, in evaluating web-based services, researchers would ask users to rate for statements like “I often click on a link just out of curiosity” and ”Surfing the web to see what’s new is a waste of time” (reverse-scaled) (Novak et al., 2000). The actual amount of exploratory behaviours can be measured objectively by observing users in uncontrolled studies. Figure 4 outlines the QoE construct, its dimensions and metrics that we have identified and modelled in terms of their inter-relationships.
– Technology Adoption: Intention to use (subjective) and actual usage (objective) are the two variables for technology adoption. They are directly related with user’s perceptual ‘technology acceptance’. For technological systems, intention to use is regarded as the major subjective metric in user experience evaluation [Hsu et al., 2004; Jackson, 2007; Koufaris, 2002; Nysveen et al., 2005). An advantage of this metric is its relative ease of assessment. Its objective counterpart - actual system usage - is an important indicator for the extent of technology adoption. Nevertheless, researchers need to observe users over time to quantify this metric, such as six months of field study (Venkatesh et al., 2003), which can be challenging in controlled studies. According to the theory of planned behaviour (Ajzen, 1991), behavioural intention is a strong predictor of actual behaviours. Thus, “intention to use” often becomes the substitute in actual evaluations (Jackson, 2007).
Comparison Wu and colleagues observe the previous work related to DIME evaluation into their above described quality framework in terms of constructs coverage of the real cases. Here is the list of factors they identified for their three components of the causal chain framework:
– Environmental Influences: Interactivity Speed (IS), Interactivity Range (IR), Interactivity Mapping (IM), Vividness Breath (VB), Vividness Depth (VD), Temporal Consistency (TC), and Spatial Consistency (SC).
– Cognitive Perception: Flow Concentration (FC), Flow Enjoyment (FE),

3D LIVE – 3D Live Interactions through Visual Environments Project N. 318483
D1.2 Study and Creation of the Holistic User Experience Model Date 27/11/2013
3D LIVE Consortium Dissemination: Public 24/82
Telepresence (TP), Perceived Usefulness (PU), and Perceived Ease of Use (PEU). – Behavioural Consequences: Performance Gains (PG), Exploratory Behaviours
(EB), and Technology Adoption (TA). Empirical Set-up Wu and colleagues recruited college students and set-up two 3DTI testbeds containing a plasma display and two 3D camera clusters that were located in a vertical axis for capturing the full human body. The resulting users’ 3D representations were merged into a joint virtual environment in real-time for interaction (see Figure 4.10).
Figure 4.10 – Experimental Setup(Wu et al., 2009)
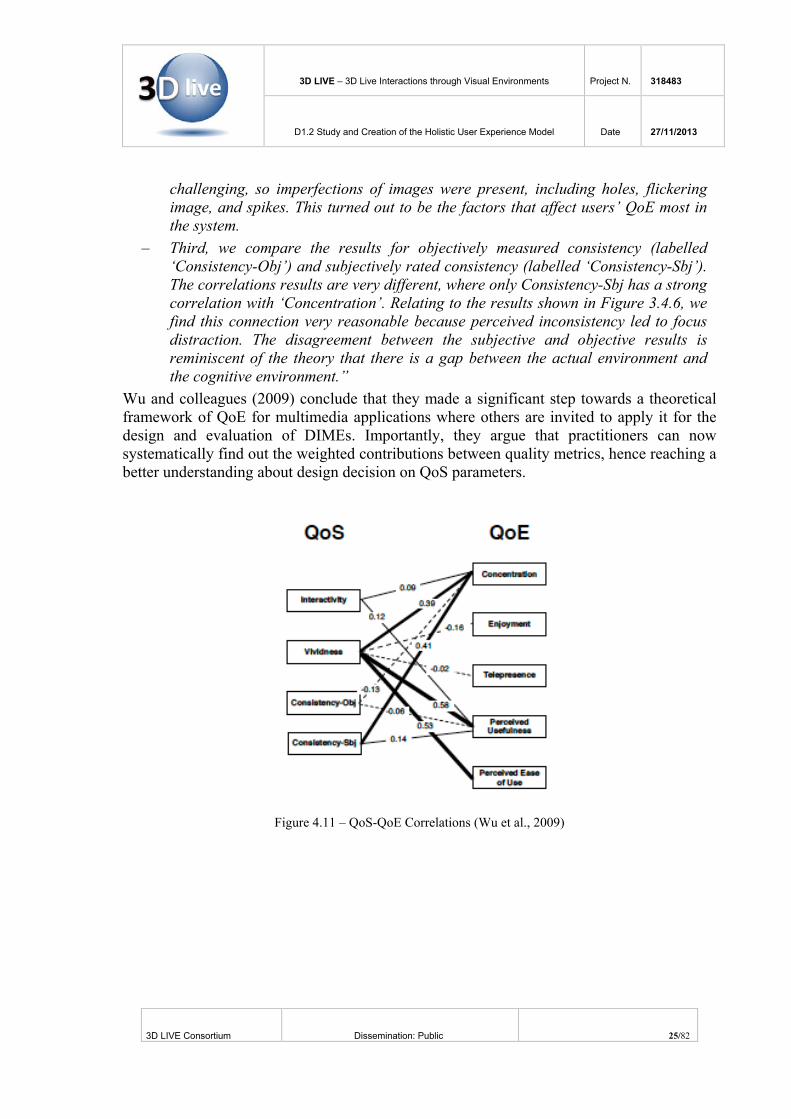
They identified metrics, collected data and computed the correlations. All above described metrics were used except for exploratory behaviours and technology adoption that are too difficult to observe. They translated interactivity by the QoS metric end-to-end delay and vividness breath to the richness of communication channels (audio & video) while the other metrics were self-explanatory. Both objective and subjective data were collected through a post-test questionnaire with Likert scale of seven degrees (1: strongly disagree, 7: strongly agree). As for the objective measurements, they recorded users’ performance inducted by the ratio of successful attempts and completion time for the metric performance gains. Then they checked the correlation between pairs of the QoS and QoE metrics through a statistical assessment of significance for the three experiments. The resulting correlation graph is presented in Figure 4.11 below showing mainly the links with strong significance (p>0.005) with their correlation value. They made the following observations that are worthwhile to note:
– “First, the measured correlations between interactivity and the presented metrics appear not strong. This is mainly due to the fact that we averaged the subjective responses for interactivity where the delay was not much noticeable in three of four cases. When the delay exceeds the perceptive threshold, we expect that users would lose sense of control (which corresponds to perceived ease of use), become distracted (less concentration), and feel lower degree of Telepresence. Further quantitative studies on large interactivity delays need to be performed to confirm the hypotheses.
– Second, the connection between vividness and several QoE metrics (concentration, perceived usefulness, and perceived ease of use) are among the strongest. The main reason is that the real-time 3D reconstruction algorithms in 3DTI systems are still
3D LIVE – 3D Live Interactions through Visual Environments Project N. 318483
D1.2 Study and Creation of the Holistic User Experience Model Date 27/11/2013
3D LIVE Consortium Dissemination: Public 25/82
challenging, so imperfections of images were present, including holes, flickering image, and spikes. This turned out to be the factors that affect users’ QoE most in the system.
– Third, we compare the results for objectively measured consistency (labelled ‘Consistency-Obj’) and subjectively rated consistency (labelled ‘Consistency-Sbj’). The correlations results are very different, where only Consistency-Sbj has a strong correlation with ‘Concentration’. Relating to the results shown in Figure 3.4.6, we find this connection very reasonable because perceived inconsistency led to focus distraction. The disagreement between the subjective and objective results is reminiscent of the theory that there is a gap between the actual environment and the cognitive environment.”
Wu and colleagues (2009) conclude that they made a significant step towards a theoretical framework of QoE for multimedia applications where others are invited to apply it for the design and evaluation of DIMEs. Importantly, they argue that practitioners can now systematically find out the weighted contributions between quality metrics, hence reaching a better understanding about design decision on QoS parameters.
Figure 4.11 – QoS-QoE Correlations (Wu et al., 2009)

3D LIVE – 3D Live Interactions through Visual Environments Project N. 318483
D1.2 Study and Creation of the Holistic User Experience Model Date 27/11/2013
3D LIVE Consortium Dissemination: Public 26/82
5 Holistic Model for the 3D LIVE “Twilight” User eXperience The objective of this chapter is to report and describe the Holistic Model, which will be used to describe the User eXperience in the 3D LIVE project. To achieve the model, the peculiarity of the 3D LIVE context was considered, also capitalising on some previous work as reported in the Annex II. The main objective of the Holistic Model for the 3D LIVE “Twilight” User eXperience is to provide a reference description of all the possible different aspects of a User eXperience, from which to extract the specific elements for a given experience. The purpose of the model is, as much as possible, holistic, meaning that it encompasses the different aspects of the User eXperience in a comprehensive and exhaustive way. Possible feedback from the 3D LIVE activities could be use to refine the current definition which is hereafter reported.
5.1 3D LIVE Immersive User Experience Model Within the 3D LIVE project, the user experience is situated in the context of Distributed Interactive Multimedia Environments. Hence, the aspect of social interaction among players and followers lead to collective user experience rather than only individual user experience. Furthermore, the 3D body reconstruction of players may also have an impact especially on the collective user experience depending on the degree to which users feel more immersed. There is a wide range of factors influencing an individual or collective user experience that were previously identified and classified within three categories, namely: the context of usage, the users’ state and system properties (Roto et al., 2011):
– Usage context: It refers to the specific situation in which users are operating as a place, time, interaction, task and information infrastructure (e.g. on the move, within a group of people, using a smart-phone, Internet connection).
– Users’ state: It refers to motivation, mood of the day, expectations and current mental and physical shape.
– System properties: It refers to the system functionalities, interactiveness, responsiveness and aesthetic as well as brand reputation (e.g. coolness, reliability).
Two 3D LIVE internal workshops allowed project partners to draft, for the context of 3D TIE, a table of user experience model elements and properties that are classified by type of experience/value created (see Table 5.1). This list is based on the previously described holistic model of user experience in Annex II, where the elements appropriate for a 3D TIE were selected, according also to the initial needs emerged from the three use cases scenario (Skiing, Jogging and Golfing). Therefore, it represents an instantiation of the holistic UX model for addressing 3D Tele-Immersive environments that is included in DIME (Distributed Interactive Multimedia Environment). Similarly to what done in previous works and project, the Holistic User Experience Model for the 3D LIVE project is therefore presented here in a tabular form, in which the experience is described in terms of:
– Values or Experience Types (highlighting all the different forms in which an experience could take place),

3D LIVE – 3D Live Interactions through Visual Environments Project N. 318483
D1.2 Study and Creation of the Holistic User Experience Model Date 27/11/2013
3D LIVE Consortium Dissemination: Public 27/82
– Elements of the User eXperience (describing how different elements contribute to the experience type),
– UX Properties (how the experience is captured), – Indicators, – Devices & Tools (through which the parameters relevant to the User eXperience are
collected, and; – Data (the values collected through the sensors, suitable for supporting metrics
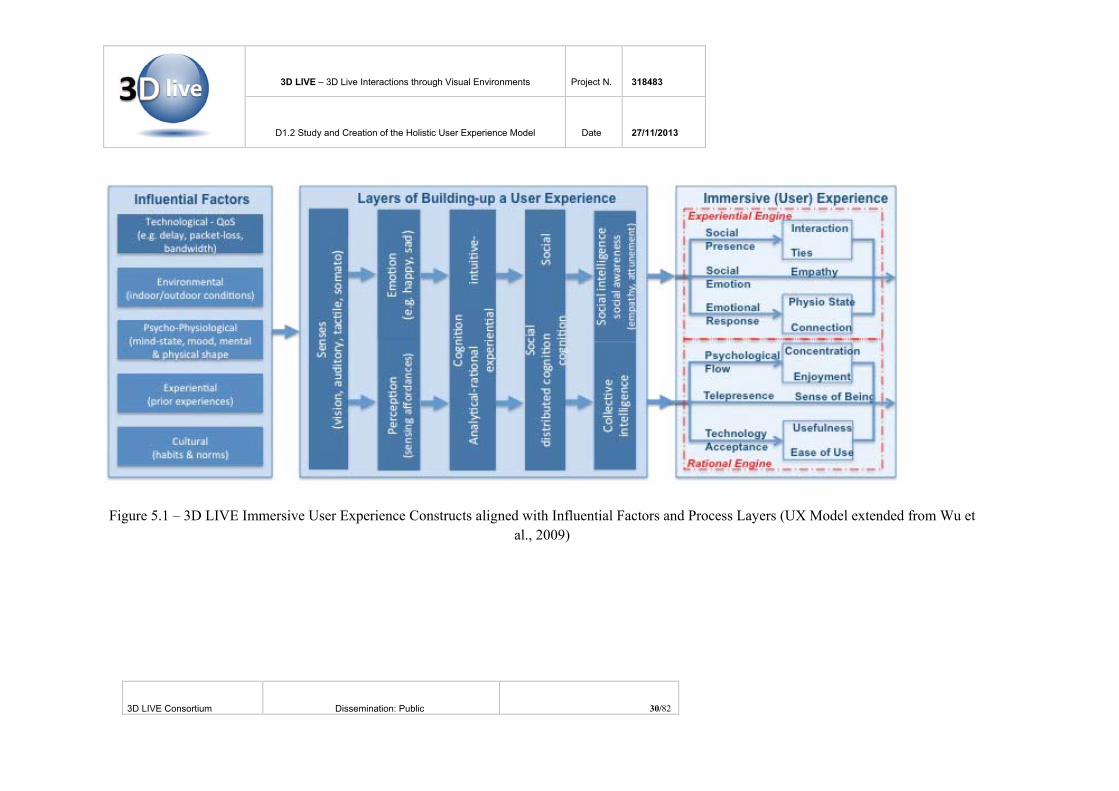
evaluation). However, looking at influential factors, beside the already above mentioned three categories, it appears that there are other categories, such as cultural, experiential (prior experiences) and environmental factors (indoor/outdoor) as listed by Wu and colleagues (2009). Figure 5.1 depicts the sequence from Influential Factors to the building-up of and resulting immersive user experience that are part of the 3D LIVE UX model. In contrast with the Quality Framework in DIME (Wu et al., 2009), the user experience add the notion of rational and experiential parts. The rational part mainly re-uses the DIME cognitive perception model and the experiential part is based on emotion and intuition. While the DIME quality Framework is based on the Fishbein and Ajzen’s (1975, 1980) Theory of Reasoned Action (TRA), the CEST approach is rather based on the Epstein’s (1990, 2003) Cognitive-Experiential Self-Theory (CEST) on the dual-process model of perception. In fact, CEST is based on the idea that people operate in using two separate engines for information processing, namely: analytical-rational and intuitive-experiential. While the first one operates deliberately, slowly but logically, the second one operates quickly, autonomously (as a reflex) but emotionally/intuitively. These two engines are independent from each other and operate concurrently (in parallel with interactions) for producing behaviour and conscious thought (Epstein, 2003). As argued by Epstein, a constant interaction occurs between the two engines during the day-to-day life. The experiential engine, due to its little need of cognitive resources as it occurs outside of the conscious awareness, deals with most of the daily information processing. It leaves most of the cognitive power to the rational engine for dealing on conscious attention.

3D LIVE – 3D Live Interactions through Visual Environments Project N. 318483
D1.2 Study and Creation of the Holistic User Experience Model Date 27/11/2013
3D LIVE Consortium Dissemination: Public 28/82
Values/exp.
Types UX Elements UX Properties Indicators Devices & Tools Data
Sensorial Sensory Vision, Auditory, tactile, Somatosensory
Quality of sound, quality of image, Force-feedback
Sound volume sensor, motion capture, frame rate
Decibels, frame-rate, speed, altitude, image accuracy
Perceptual Perceptive appreciation
Sensing & attunement of affordances
Distance to a natural way of behaving
Compare R/V situations in mining log data Log data
Physiological State Emotional perceiveness State of mind, physiological
parameters, face-expression Face capture (indoor), Armband
Face expression, skin inductance, temp., heart rate,
Emotional Emotional connection
Social affordance, Attractiveness
Voice tone, eyes dilatation, body language, effectiveness of engagement, intensity
Voice analyser, eye dilatation measurement, Log data
Value of voice inflection, value of eye dilatation, usage data
Cognitive Cognitive ergonomics
Mental representation, cognitive artefacts Dynamic simulation, Heart rate Log data
Social ties Networking Connections (duration & intensity) Log data Graph data
Interaction Communication Exchanges, interactions, overlapping Presence
Microphone, headset, chat, video, shared screen, Displays
Decibels, frame-rate, screen resolution, image accuracy
Social
Group dynamics
Co-intelligence, influ behaviour, reward mech., community, trust
Imitation for influential behaviour, common decision for sense of community
Mining Log data Log data

3D LIVE – 3D Live Interactions through Visual Environments Project N. 318483
D1.2 Study and Creation of the Holistic User Experience Model Date 27/11/2013
3D LIVE Consortium Dissemination: Public 29/82
Values/exp. Types UX Elements UX Properties Indicators Devices & Tools Data
Empathical Caring Care for others, sense of belonging
Advices, encouragements, tribes
Count positive messages, Log data, data mining Usage data
Educational Learning Advice Success rate Stroke accuracy Large displays Data mining of
messages
Innovativeness New functionalities Real Time & 3D, use frequency and intensity of new features
Scale survey, Log data, data mining Usage data
Performance Position & reconstruction accuracy
Model accuracy, latency, bandwidth, volume of data, Log data Technological
Usability Ergonomic quality Usability heuristic, Physiological parameters Armband Not real-time
Affordability Ratio cost/usage, use frequency & intensity
Willingness of paying X Euro Bipolar scale data
Usefulness Is it helping to achieve a goal? (Training, remote competition, entertainment, social gathering)
Scale survey, Frequency & intensity Bipolar scale data Economical Satisfaction
Hedonic quality Happiness through face expression &physio. Parame. Face capture, Armband Face expr., skin induct,
T°, heart rate
Legal Ownership User data, user image Heuristic, digital reputation Scale survey Bipolar scale data
Ethical Privacy Anonymity Heuristic Scale survey Bipolar scale data
Table 5.1 – 3D-TIE User Experience Model Elements and properties Classified by Types of Experience
3D LIVE – 3D Live Interactions through Visual Environments Project N. 318483
D1.2 Study and Creation of the Holistic User Experience Model Date 27/11/2013
3D LIVE Consortium Dissemination: Public 30/82
Figure 5.1 – 3D LIVE Immersive User Experience Constructs aligned with Influential Factors and Process Layers (UX Model extended from Wu et
al., 2009)
3D LIVE – 3D Live Interactions through Visual Environments Project N. 318483
D1.2 Study and Creation of the Holistic User Experience Model Date 27/11/2013
3D LIVE Consortium Dissemination: Public 31/82
According to Norris and Epstein (2011): “The two systems have unique disadvantages as well as advantages. Thus, the rational system, although superior to the experiential system in abstract thinking, is inferior in its ability to automatically and effortlessly direct everyday behavior, and the experiential system, although superior in directing everyday behavior, is inferior in its ability to think abstractly, to comprehend cause-and-effect relations, to delay gratification, and to plan for the distant future. Since each system has equally important advantages and disadvantages, neither system can be considered superior to the other system.” People choice for analytical or experiential processing is measured through the Rational Experiential Inventory (REI) that uses two factors, namely: need for cognition (rational measure), faith in intuition (experiential measure). Epstein et al. (1996) claims that several studies have demonstrated REI as a reliable measure of people difference in information processing. Furthermore, the two independent styles (thinking and feeling) measured account for a substantial amount of variance that is not addressed by other personality theories such as the Five Factor Model (Norris & Epstein, 2011). This particular aspect is quite interesting for comparing the processing style of indoor and outdoor players within the 3D LIVE three use cases (Skiing, Jogging and Golfing). During the GENI Opt-In Workshop, in July 2008, Hoffman and Novak (2008) claimed that the synergy between experiential and rational thinking styles creates an emergent nature. It is based on the fact that Novak and Hoffman (2007) found that some tasks demonstrate “synergistic effect” where experiential and rational thinking styles (Norris and Epstein, 2003) correlate positively with performance. Hence, they argued that consumers with an emergent nature score high in rational and experiential thinking style while they do it in a synergistic way. This means that the emergent nature is defined by the interaction between the rational and experiential thinking styles. They demonstrated that consumers scoring high on the emergent nature can co-create product/service concepts perceived by users as significantly better than concepts developed by domain-specific lead users. Therefore, they thought that the concept of emergent nature and the related measurement scale could be a useful instrument in the GENI Web Opt-In project.
5.2 Description of the Rational Part The Rational Part follows the Wu’s (2009) DIME Cognitive Perceptions model; hence it includes the same three elements; except that the Sense of Control from the Psychological Flow is not merge in the ease-of-use of the Technology Acceptance but rather links the two:
– Psychological Flow: as for the DIME Cognitive Perception model, Psychological Flow represents the feelings of someone acting with total involvement procuring the perception of great enjoyment and sense of control. Activities such as reading, gaming or sporting provide an intense feeling of immersion as a natural flow of mind. The three metrics identified in DIMEs are namely: Concentration, Enjoyment and Sense of control.
– Telepresence: as for the DIME Cognitive Perception model, Telepresence represents users’ perceptual Sense of Being within the Distributed Interactive Multimedia Environment that is in 3D LIVE the Mixed Reality environment. In

3D LIVE – 3D Live Interactions through Visual Environments Project N. 318483
D1.2 Study and Creation of the Holistic User Experience Model Date 27/11/2013
3D LIVE Consortium Dissemination: Public 32/82
fact, there will be outdoor participants that will be immersed in Augmented Reality and indoor participants that will be immersed in the Augmented Virtuality. Hence, the sense of being or the sense of presence may be totally different depending on being an outdoor or indoor participant.
– Technology Acceptance: as for the DIME Cognitive Perception model, the Technology Acceptance(TA) is based on the Technology Acceptance Model(TAM) (Davis, 1986) for considering the technology users’ perceptions and attitudes generated by the usage of the technology in use. It is composed of the two believed factors of TAM, namely: perceived usefulness and perceived easiness to use the technology. The perceived usefulness represents the degree to which the user believes that using this technology increase the task performance. The perceived easiness to use represents the degree to which the user believes that using this technology is intuitive enough that it does not require a specific effort. The Technology acceptance and Psychological Flow are linked through the Flow metric Sense of Control.
Figure 5.2 – The Technology Acceptance Model (Davis, 1986)
5.3 Description of the Experiential Part In contrast with DIME Cognitive Perceptions model (see Section 3.4), the Experiential or intuitive part brings in the emotional and social influences that are essential ingredients of people interactions. Though, Ajzen’s Theory-of-Planned-Behaviour – TPB - (1991), which is the theory about the link between beliefs and behaviour further explaining the relationship between behavioural intention and actual behaviour than TRA, has also introduced the social influence in order to improve the predictive power of the Theory of Reasoned Action. However, compared to affective processing models, the TPB misses the emotional aspects, such as mood, fear and feeling of-the-day. It includes the following constructs:
– Social Presence: According to Griffin (2008) several electronic media theories, such as the social presence and media richness or naturalness theories, try to explain the difference between Computer Mediated Communication (CMC) and Face-to-Face communication as well as the lack of social context cues in online communication. The various communication media are classified by the Media richness theory according to the message complexity each medium can effectively and efficiently convey. Kock (2004) defines the naturalness of a communication

3D LIVE – 3D Live Interactions through Visual Environments Project N. 318483
D1.2 Study and Creation of the Holistic User Experience Model Date 27/11/2013
3D LIVE Consortium Dissemination: Public 33/82
medium, in media naturalness theory, as the degree to which it is similar to the face-to-face medium. He argues that a decrease in the degree of naturalness of a communication medium leads to an increase in cognitive effort and communication ambiguity as well as a decrease in physiological arousal. Social presence theory suggests that CMC restricts users’ feeling of having other person(s) involved in the same interaction. It claims that CMC bandwidth is too narrow to convey rich relational messages. Social presence relies on three dimensions, namely: social context, online communication and interactivity. Social context represents the predictable degree of perceived social presence. It involves task orientation and privacy (Steinfield, 1986) as well as topics (Argyle and Dean, 1965; Walther, 1992) but also social relationships and social process (Walther, 1992).
– Social Emotion: Social emotions are emotions that require the representation of the mental states of other people. Examples are embarrassment, guilt, shame, and pride. In contrast, basic emotions such as happiness and sadness only require the awareness of one's own somatic state. Therefore, the development of social emotions is tightly linked with the development of social cognition, the ability to imagine other people's mental states. The impact of social emotions in game theory and economic decision-making was already investigated (Sanfey et al., 2003). When people feel a sense of social connectedness to one another, they may experience similar physiological arousal and not only share emotions. Empathy is considered as an affective response emerging from the perception/comprehension of one another’s emotional state or condition (Eisenberg et al., 1994). The perceived controllability has an important impact on socio-emotional reactions and empathic responses.
– Emotional Response: Emotions in virtual communication differ in a variety of ways compare to those in face-to-face interactions due to the inherited CMC characteristics, which may lack many of the auditory and visual cues normally associated with the emotional aspects of interactions (Kelly and Barsade, 2001).Detecting emotional information begins with passive sensors that capture data about the user's physical state or behaviour without interpreting the input. The data gathered is analogous to the cues humans use to perceive emotions in others. Another area within affective computing is the design of computational devices proposed to exhibit either innate emotional capabilities or that are capable of convincingly simulating emotions. Emotional speech processing recognizes the user's emotional state by analysing speech patterns. The detection and processing of facial expression or body gestures is achieved through detectors and sensors. According to Maruping and Agarwal (2004), the increase of emotional cues allows the better detection of negative affect and greater displays of positive affect to counter any negative emotions. Feedback immediacy depends on how quickly messages are transmitted via a particular communication medium and the expectation for which they will be responded. Feedback immediacy allows individuals to more quickly detect and address frustration and other negative emotions. Authors argue that the more synchronous the communication media, the better for spontaneous comments, such as jokes, which are necessary for positive

3D LIVE – 3D Live Interactions through Visual Environments Project N. 318483
D1.2 Study and Creation of the Holistic User Experience Model Date 27/11/2013
3D LIVE Consortium Dissemination: Public 34/82
affect.
5.4 The perception of Social Presence According to Tu and McIssac (2002), while Social Presence has a positive impact on online interaction, the participation frequency shows low social presence. Tu and McIssac found that while social context is more qualitative to achieve positive impact, online communication is more strongly related to quantifiable and organizational skills of participants and interactivity is a combination of skill sets and communication styles. Interestingly, authors have identified the following list of factors that impact positively the perception of social presence.
Dimensions F Social Context Online Communication Interactivity
1 Familiarity with recipients Keyboarding and accuracy skills Timely Response
2 Assertive/Acquiescent Use of emoticons and paralanguage Communication Styles
3 Informal/formal Characteristics of real-time discussion Length of messages
4 Trusted relationships Characteristics of discussion boards Formal/informal
5 Social relationships (social ties, interpersonal relationship)
Language skills (writing and reading)
Type of tasks (planning, creativity, social tasks)
6 Psychological attitude toward technology Size of groups
7 Access and location Communication strategies 8 User characteristics
Table 5.2 - Factors Positively Impacting the Perception of Social Presence(Tu and McIssac, 2002) Synchronous sessions (real-time, simultaneous live connections) can provide both audio and video connection, allowing an interchange involving both sight and sound, and all the rich nonverbal communication inherent in tone of voice and facial expression. These kind of synchronous sessions providing recipients’ look, actions and sound make possible a full social interchange with the potential to greatly increase social presence. Features like building online trust and promoting informal relationships would provide a stronger sense of social presence while increasing the sense of community and interaction among participants.

3D LIVE – 3D Live Interactions through Visual Environments Project N. 318483
D1.2 Study and Creation of the Holistic User Experience Model Date 27/11/2013
3D LIVE Consortium Dissemination: Public 35/82
6 The Evaluation of User Experience Further to the definition of the 3D LIVE UX model, reported in the previous chapter, this chapter is providing the relevant QoE and QoS metrics, through which to evaluate the experience as represented through the UX model. A discussion on how to apply the UX/QoS/QoE elements is also given. Previous work which was consulted within the activities of the workpackage relevant to UX evaluation is reported as Annex II.
6.1 Evaluation in 3D Tele-Immersive environments Tele-Immersive environments (TIE) constitute a field that requires optimized synchronization and integration of components dealing with a variety of IT technologies: networking, 3D environment and humans’ reconstruction, means of communication between users, haptic feedback and graphics should be fine tuned, in order to provide with the maximum levels of technical accuracy, user friendliness and experience. Various disciplines are taking advantage of the benefits that Tele-immersion can provide: Medicine, Arts, Sports, Education, etc. are some of the most significant fields among which TE play or will soon be playing an important role. Yet, there are no concrete or structured ways to evaluate the appropriateness of different TIE or aspects of them on their different applications. Factors such as the graphics and rendering quality, ease of usage, user preferences and emotional or cognitive state of the user during the course of the interaction describe what is called user experience and, the higher the values that describe them, the higher the overall “Quality of Experience” (QoE). The above parameters, when optimized, lead to increased levels of immersion, in which users tend to consider the TIE as part of the physical world, sensing high levels of flow (Csikszentmihalyi, 1991). Similar to the notion of QoE is that of “Quality of Service” (QoS) which, however, describes more technical aspects of the environment: Response time, inter and intra-modal synchronizations (network and device-dependent, respectively), noisy reconstructions and safety of use. These aspects are easier to be measured and are usually the product of analytical procedures aiming at certain thresholds of efficacy. As thoroughly explained in the previous sections in some works, the two terms of QoE and QoS are distinct and can be independently evaluated (Corrie et al., 2003) while there are works considering QoS as a part of the overall QoE (Hamam, 2008) a system is able to provide (see Figure 6.1)
Figure 6.1 - Different schematic representations of QoE and QoS
For evaluating QoE in different environments (virtual, haptic, etc.), a series of different

3D LIVE – 3D Live Interactions through Visual Environments Project N. 318483
D1.2 Study and Creation of the Holistic User Experience Model Date 27/11/2013
3D LIVE Consortium Dissemination: Public 36/82
criteria need to be fulfilled (Gaggioli et al., 2003; Elliot and Covington, 2007): 1. User Skills: Different tasks difficulty level needs to be aligned with cognitive and
practical skills possessed by the user. 2. Feedback: User’s experience is optimized if the system itself can give her/him
any sort of feedback regarding user performance. 3. Control over the situation: The user should feel comfortable with the amount of
control he has over her/his actions and the interactions with the user. Challenges imposed by the TIE can be gradually increased, as long as experience (and, consequently, performance) increases with time.
4. User friendliness: The user should technically be able to interact with the system. A lot of fine-tuning and pre-processing increase user fatigue, leading to reduced levels of willingness to interact with the system.
5. Clearness of goals: The TIE needs to provide a clear set of goals that are expected to be reached. This ensures directed and structured interaction, which leads to higher levels of user willingness to interact.
One of the most challenging factors is that these criteria are, many times, user dependent and, consequently, measurements need to take this into account. Personalization is a key factor for measuring a TIE’s appropriateness for certain tasks and activities. Parameters like age, physical state, personal preferences and targets, exposure to new technologies and stress levels have high impact on the degree of satisfaction with a TIE or a certain course of interaction. Csikszentmihalyi’s flow model (1991) related one’s perceived skills (as a magnitude described by factors like the above) to the levels of challenge imposed by a task in hand. Figure 6.2 depicts different channels of mental states, as a function of perceived skills and challenge.
Figure 6.2 - Csikszentmihalyi’s flow model (1991): Different mental states experienced as functions of skill and challenge level of a task in hand.
Figure 6.2 is illustrative of different states a user may experience according to the values on the x and y-axis. More specifically, optimal experience (flow) is reported when high skill

3D LIVE – 3D Live Interactions through Visual Environments Project N. 318483
D1.2 Study and Creation of the Holistic User Experience Model Date 27/11/2013
3D LIVE Consortium Dissemination: Public 37/82
levels are tested on challenging tasks. On the other side, tasks of low challenge, when accompanied with low skill levels, are associated with apathy. When skill levels are low, the more difficult a task is, the more the sense of worry is increased, leading high levels of anxiety in conditions of high skill levels imposed by the game. Measuring user-dependent parameters, related to the overall QoE is an open research issue. TV and networking are two of the fields where structured efforts have taken place, with Virtual Reality emerging as a new field where user satisfaction is a high priority. The traditional means of evaluating subjective experiences is through questionnaires and self-reports. The Experience Sampling Method (ESM) (Csikszentmihalyi et al., 1977) and Flow Questionnaires (FQ) (Csikszentmihalyi and Mihaly, 1975) constitute structured manners to infer one’s experience. The former methodology demands from the user to give reports at frequent intervals, regarding their view on certain tasks, their mental state and external factors. FQ is an instrument for directly devising those circumstances where optimal experience is sensed, by posing direct questions, usually making use of Likert scales on questions related to motivational, emotional and cognitive components of their experience. Such self-reports can be easily transferred to TIE environments (Gaggioli et al., 2003). They can unlock relations between used devices and controls and let perform comparative studies between real life and Tele-immersive experiences, with regards to the notion of flow. Making use of questionnaires for evaluating subjective experiences, however, may impose limitations (Ramsay, 1997). Expressing one’s own emotions and mental states is a noisy procedure, as one has to recall recent emotional and cognitive experiences, instead of expressing them while experiencing the interaction. Moreover, posing answers on a scale is also a subjective procedure, with people perceiving differently the meaning of each rating, from each other. Recent studies, however, support comparative reports, as a solution to the above-mentioned problem (Georgios, 2011). For a more objective inference mechanism, authors (Hamam, 2008) do not ask from the users to evaluate their Virtual Reality Experience directly but rather, they use fuzzy logic to infer the QoE, based on a series of questions. Finally, some users may not be willing to express their feelings or perception of a certain task, for their own reasons. For the abovementioned reasons, recently, an abundance of methods and systems methods try to extract knowledge regarding user experience during interaction, using more objective data, which usually consist in context-related knowledge, physiological measurements, user-related information, facial expressions, etc. This information can be acquired online, thus, avoiding the demand to interrupt the interaction procedure and, consequently, the whole user experience. A typical example is the work described (Whalen et al., 2003); this was one of the earliest works proposing automatic evaluation of user experience in VR environments, utilizing physiological measurements. Busscher et al. (2011) utilize heart rate, pre-ejection period and respiratory sinus arrhythmia to estimate the levels of anxiety of people, when they are exposed to virtual environments showcasing circumstances able to provoke anxiety.

3D LIVE – 3D Live Interactions through Visual Environments Project N. 318483
D1.2 Study and Creation of the Holistic User Experience Model Date 27/11/2013
3D LIVE Consortium Dissemination: Public 38/82
6.2 3D LIVE Quality of Service Metrics Although, as mentioned above, Quality of Service (QoS) is, for many researchers, distinguished from the notion of QoE, software, hardware and network-related features highly contribute to the overall user experience. As already shown in the Figure 4.6, the QoS model holds the technological influences dimension. According to Wu et al.(2009), the DIME QoS constructs are composed with the following concepts:
– Interactivity: represents the possibility for the users of Mediated environments to modify both the form and content in real-time through three factors, namely:
• Speed (input assimilation rate) e.g. end-to-end delay, reaction/response time, image freeze time, jitter, video frame rate (capturing, rendering), audio nominal rate, and graphics update rate.
• Range represents the scale of control options for users to change the mediated environment, such as the ability to change viewpoint in a holistic 3D environment: Interface flexibility, Customization degree, Number of control options, Number of accessible parameters.
• Mapping measures the capability to map user control to actual changes in the mediated environment e.g. how natural and intuitive the user interface is.
– Vividness: represents the richness of a mediated environment modelled by the amount of sensory information simultaneously presented to the users. It has two dimensions:
• Breadth refers to the number of sensory channels with metrics including the presence of media channel: Visual, Auditory, Haptic, Textual, Graphical.
End device sensing range: Camera, Microphone.
• Depth refers to the resolution in each of these perceptual channels with metrics: Peak signal to noise ratio (PSNR),
3D LIVE – 3D Live Interactions through Visual Environments Project N. 318483
D1.2 Study and Creation of the Holistic User Experience Model Date 27/11/2013
3D LIVE Consortium Dissemination: Public 39/82
Image/ audio resolution, 3D depth resolution, Haptic feedback accuracy, Visual tracking precision, Video frame loss, Audio amplification factor.
– Consistency: within virtual reality, consistency has to be explicitly achieved by proper design and implementation of the mediation systems.There are two dimensions of consistency in DIMEs:
– Spatial refers to the topological scale of state synchronization, i.e., a site may know a subset (partial consistency) or total set (global consistency) of states in the system. It is often not necessary to achieve global spatial consistency, for example a player in large-scale systems only gets updates from those players in proximity though many others can be in the same session. Metrics for spatial consistency include:
• Coverage, • Completeness, • Consensus.
– Temporal refers to the degree of time synchronization of all states in the DIME systems, which is hypothesized to impose a more significant impact on user QoE than its spatial counterpart. In DIMEs, the local states are exchanged over networks to create the shared communicative context for everyone, which inevitably incurs inconsistencies due to the existence of propagation delays, lossy links, etc. the absolute consistency and delayed consistency models where the former ensures that all operations execute at the same time across the system and the latter trades the degree of consistency for response time by allowing local operations to instantaneously take effect. Metrics for temporal consistency include:
• Phase difference, • Dropping ratio (due to synchronization), • Uniformity of flow, • Drift distance, • Continuity.
In view of the above, 3D LIVE will consider a series of user-centric indicators: security, privacy and safety should be guaranteed and considered part of the overall quality of service which will be provided within the frame of 3D LIVE. Table 6.1 is indicative of the parameters already taken into account, with regards to the various components of the project.
3D LIVE – 3D Live Interactions through Visual Environments Project N. 318483
D1.2 Study and Creation of the Holistic User Experience Model Date 27/11/2013
3D LIVE Consortium Dissemination: Public 40/82
Services needing data compression: As 3D LIVE involves multimodality, a dense flow of information will have to be served among different devices; 3D reconstructions of the environment and moving humans, only, consist of some thousand vertices. Especially in the case of human motion, this information has to be streamed in real-time; current protocols (Mamou et al., 2008) handle compressions of about 75Kb for moving humans (3D meshes). However, lossy compression has a negative impact on the visual quality, which needs to be addressed in parallel. For this reason, novel 3D compression methods are going to be developed within the frame of the project.
Compression algorithms that will de implemented will have to obey to realistic requirements in terms of bandwidth. That is,15Mbps download and upload speeds must be guaranteed. Compression ratios and reconstruction delays will be evaluated through proper metrics
Response time: Interactions among users being at different sites have to be natural and, thus, response time of the system has to be confined within acceptable limits. Coding, as explained above, as well as hardware resources (e.g. taking advantage of the GPU) will help build light systems, guaranteeing naturalistic interactions.
A metric targeting a frame rate of at least 5fps will be used in the installations, even those requiring the transmission of bulky three-dimensional information. Moreover, applications and hardware will be chosen so that network delays will be at the maximum 500ms.
Synchronization: Media synchronization (sensors, cameras, haptic devices) is of high importance, as well, for the overall Quality of Service. The above has to be achieved on two levels: First, efficient and real-time data exchange, as explained above and, second, software design for efficient fusion of different modalities. Towards this aim, low-level fusion will guarantee parallel exploitation of raw data coming from various channels of information. Probabilistic and Artificial Intelligence-based techniques are expected to provide with accurate and reliable activity recognition rates.
In 3D-Live, the possibility of introducing a QoS metric for evaluating the near real time nature of different modules synchronization, necessary for Animation, Activity Recognition, Visual Reconstruction, Environmental parameters acquisition and rendering, etc, will be considered.
Realistic Motion: Visual Quality is an important indicator of the overall quality of the provided service. The system has to be flexible with instantaneous network failures and guarantee correct (both spatially and temporally) integration of different cameras. Issues such as occlusions, multi-Kinect caused interference, color and motion artifacts have to be tackled with. These are procedures that will need to take place both at the encoder and the decoder.
A series of QoS metrics can be used here, in order to evaluate motion as a function of human 3D reconstruction, motion capture devices noise, etc.
Safety: User safety, both Indoors and Outdoors, has to be guaranteed. For instance,

3D LIVE – 3D Live Interactions through Visual Environments Project N. 318483
D1.2 Study and Creation of the Holistic User Experience Model Date 27/11/2013
3D LIVE Consortium Dissemination: Public 41/82
3D reconstructions of human motion while jogging are more accurate when no occlusions occur. However, removing the handles of a treadmill poses a risk of falling. This highlights the necessity for using multi-sensor use, and imposes the necessity of developing novel algorithms for fusion of different information coming from each.
Through experiments, users are expected to provide with proper reports regarding safety they felt during the interaction
Privacy: User performance, profile and history must be controlled, primarily, by the user her/himself.
Users will report on the degree to which they felt unnecessary information may be exposed to followers and their peers.
Table 6.1 - Quality of Service parameters for 3D LIVE
6.3 3D LIVE Quality of Experience Within 3D LIVE, the Rational and Experiential Model represents the Immersive User Experience (IUX) as supporting instantaneously occurring experience while the Quality of Experience represents the Behavioural Consequences Model including the emotional and empathical responses (see Figure 6.3). The bottom part of the QoE Model corresponds to the Rational side of the IUX Model while the top part corresponds to the experiential sideof the IUX Model. The different constructs (Wu et al., 2009), for the Rational side are described as follows:
– Performance Gains: as for the DIME Behavioural Consequences model, it represents the increase of an individual user’s performance for both hedonic (happiness) and ergonomic (effort) values. However, within 3D LIVE, the team (group of users from 2 to mass participation) performance will be considered as well. This can be measured objectively through, for example, a combination of precise metrics such as time recording and percentage of objective(s)achievement(s). These types of metrics are widely used metrics expressed as the ratio of successful attempts and completion time (Ranjan et al., 2006). Furthermore, they would fit perfectly with Augmented Sport applications such as the 3D LIVE three use cases (Skiing, Jogging and Golfing). Like for the DIME Behavioural Consequences model, it is hypothesized that cognitive experience is positively correlated with performance gains.
– Exploratory Behaviour: as for the DIME Behavioural Consequences model (Wu et al., 2009), it represents the curiosity motivational motor for exploring spontaneously the technology at hand without any particular plans or objectives. This can be measured objectively, through, for example, the amount of playing time and the intensity as well as frequency. Like for the DIME Behavioural Consequences model, it has been shown that cognitive perceptions are positively correlated with the yield of exploratory behaviours (Ghani et al., 1994).
3D LIVE – 3D Live Interactions through Visual Environments Project N. 318483
D1.2 Study and Creation of the Holistic User Experience Model Date 27/11/2013
3D LIVE Consortium Dissemination: Public 42/82
– Technology Adoption: as for the DIME Behavioural Consequences model (Wu et al., 2009), it is based on the TAM approach with Intension to use (subjective) and Actual use (objective) that are the two mentioned factors for technology adoption. They are directly related with the user’s perceptual TA (see the Figure 5.8). For technological systems, intention to use is regarded as the major subjective metric in user experience evaluation (Hsu et al., 2004; Jackson et al., 2007; Koufaris, 2002; Nysveen et al., 2005). An advantage of this metric is its relative ease of assessment. Its objective counterpart - actual system usage - is an important indicator for the extent of technology adoption. Nevertheless, researchers need to observe users over time to quantify this metric, such as six months of field study (Venkatesh et al., 2003), which can be challenging in controlled studies. According to the TPB, revised version of the TRA (Ajzen, 1991), behavioural intention is a strong predictor of actual behaviours. Thus, “intention to use” often becomes the substitute in actual evaluations (Jackson et al., 2007).
The different constructs for the Experiential side are described as follow: – Social Behaviour: it represents users’ behaviours and responses during social
interaction and social networking related activities supported by the use of the technology at hand. This can be measured objectively, through, for example, the frequency and intensity of interactions and the graph of the users’ social network in order to count the number of a user connection as previously existing or newly created. There could be metrics such as centrality coefficient and other social networking metrics.
– Empathical Behaviour: it represents users’ behaviours and responses during social interaction and social networking related activities supported by the use of the technology at hand. This can be measured objectively, through, for example, the empathical response frequency, speed and intensity (e.g. sending a supportive message). Deciphering the type of social emotion, such as embarrassment, guilt, shame, and pride, is much more difficult; hence this could be evaluated subjectively, through, for example, the use of bipolar scale surveys or ethnographic observations.
– Emotional Behaviour: it represents users’ behaviours and responses during individual as well as group activities supported by the use of the technology at hand. This can be measured objectively, through, for example, the emotional response frequency, speed and intensity (e.g. smiling when using a specific application feature).Deciphering the type of an individual emotion, such as happiness, excitement, sadness, surprise and scaring, is much more difficult; hence this could be tentatively measured by the capture of face expression and speech analysis as various tools already exist. This could be subjectively evaluated, through, for example, the use of bipolar surveys or ethnographic observation.
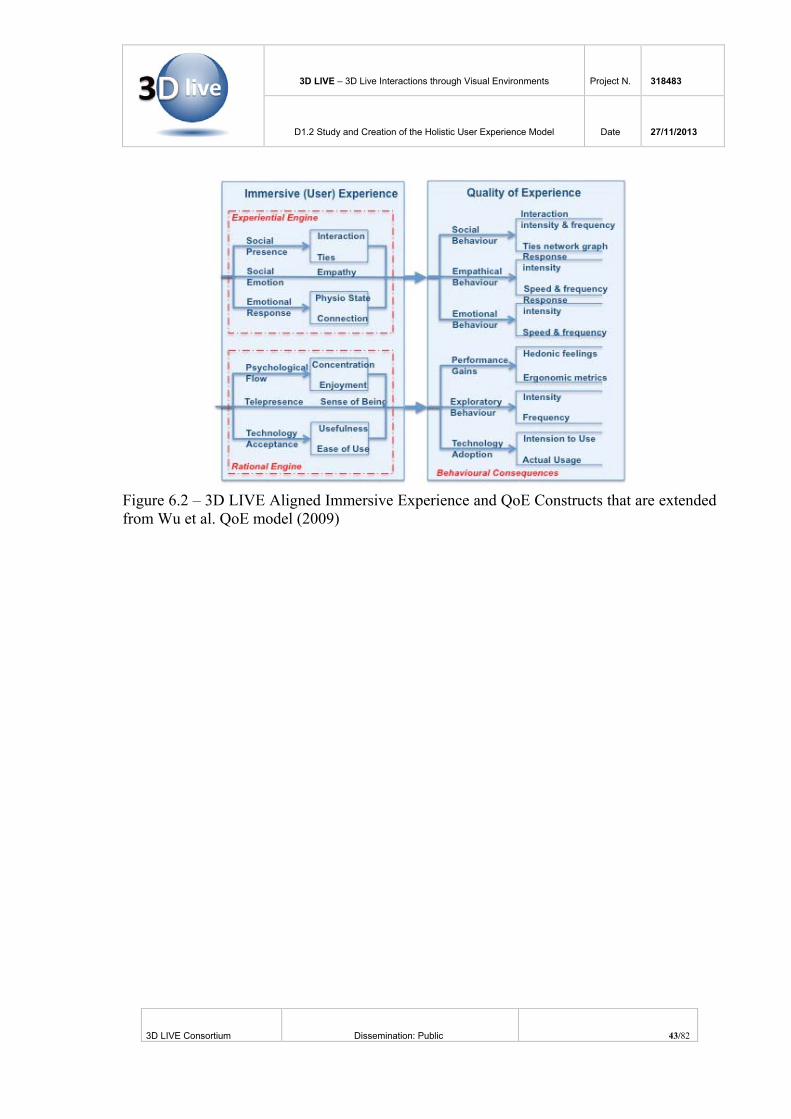
3D LIVE – 3D Live Interactions through Visual Environments Project N. 318483
D1.2 Study and Creation of the Holistic User Experience Model Date 27/11/2013
3D LIVE Consortium Dissemination: Public 43/82
Figure 6.2 – 3D LIVE Aligned Immersive Experience and QoE Constructs that are extended from Wu et al. QoE model (2009)

3D LIVE – 3D Live Interactions through Visual Environments Project N. 318483
D1.2 Study and Creation of the Holistic User Experience Model Date 27/11/2013
3D LIVE Consortium Dissemination: Public 44/82
Table 6.3 – 3D LIVE QoE metric framework

3D LIVE – 3D Live Interactions through Visual Environments Project N. 318483
D1.2 Study and Creation of the Holistic User Experience Model Date 27/11/2013
3D LIVE Consortium Dissemination: Public 45/82
Here below is an example of metrics through collected data and bipolar survey on Immersive User Experience and QoE that was prepared for the “Augmented Putting” Application demonstration/experimentation at Laval Virtual 2013. Demographics:
– Sex: M/F – Age: [15-25], [26-35], [36-45], [46-55], [56-65] – High-tech Y/N – Do you know your game partner: Y/N
For the UX data to be collected, it is based on the UX model described in this document. During the course of the immersive user experience, data were collected for: Social Behaviour
– Counting the occurrences of interaction among the two players (frequency) – The duration (intensity) – Counting the number of new interpersonal relationships
Empathical Behaviour – Counting the occurrences of help provided by the partner (frequency) – The duration (intensity) – The speed to answer
Emotional Behaviour – Counting the occurrences of a new emotion (frequency) – The duration (intensity) – The type of emotion (face expression, body language, voice tone, physiological
parameters) Performance Gains
– The duration for being successful to put the ball in the hole – Shot counter
Exploratory Behaviour – Ratio interaction/shots – Counting the number of occurrences of player feeling lost (face expression, body
language, speech) – Physiological parameters (armband)
Technology Adoption – Final emotion capture (type) – Counting the number of questions to the partner related to usage
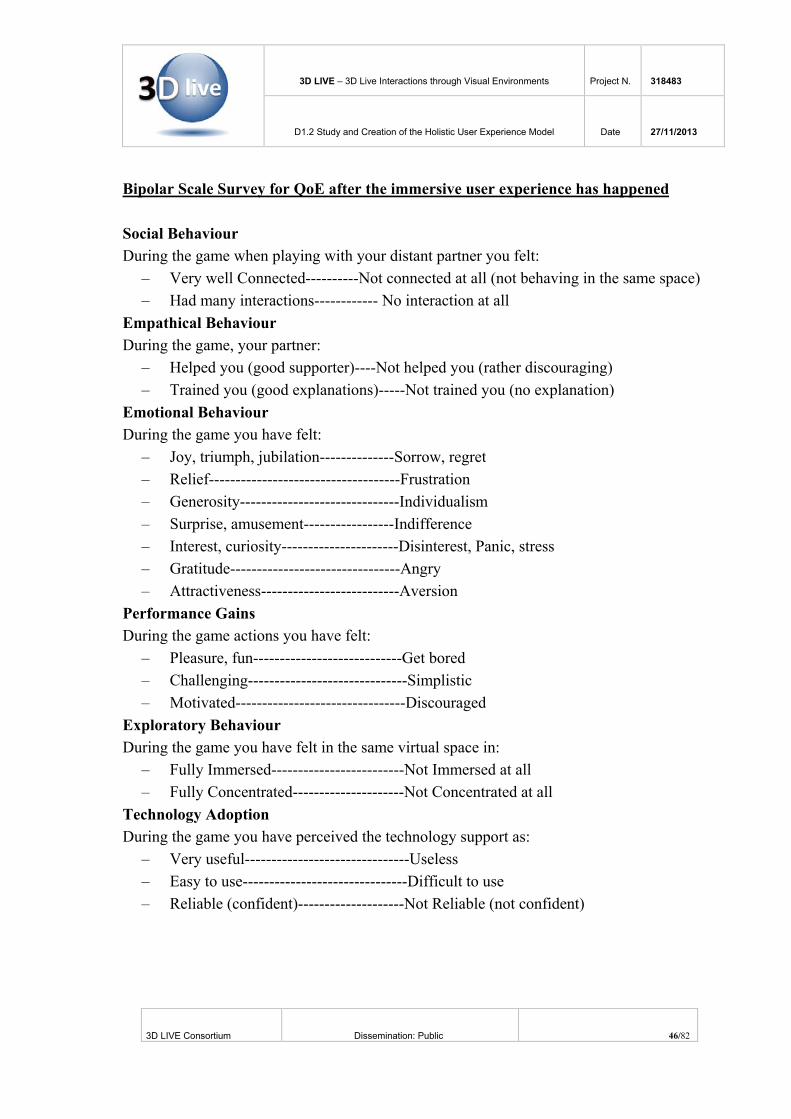
3D LIVE – 3D Live Interactions through Visual Environments Project N. 318483
D1.2 Study and Creation of the Holistic User Experience Model Date 27/11/2013
3D LIVE Consortium Dissemination: Public 46/82
Bipolar Scale Survey for QoE after the immersive user experience has happened Social Behaviour During the game when playing with your distant partner you felt:
– Very well Connected----------Not connected at all (not behaving in the same space) – Had many interactions------------ No interaction at all
Empathical Behaviour During the game, your partner:
– Helped you (good supporter)----Not helped you (rather discouraging) – Trained you (good explanations)-----Not trained you (no explanation)
Emotional Behaviour During the game you have felt:
– Joy, triumph, jubilation--------------Sorrow, regret – Relief------------------------------------Frustration – Generosity------------------------------Individualism – Surprise, amusement-----------------Indifference – Interest, curiosity----------------------Disinterest, Panic, stress – Gratitude--------------------------------Angry – Attractiveness--------------------------Aversion
Performance Gains During the game actions you have felt:
– Pleasure, fun----------------------------Get bored – Challenging------------------------------Simplistic – Motivated--------------------------------Discouraged
Exploratory Behaviour During the game you have felt in the same virtual space in:
– Fully Immersed-------------------------Not Immersed at all – Fully Concentrated---------------------Not Concentrated at all
Technology Adoption During the game you have perceived the technology support as:
– Very useful-------------------------------Useless – Easy to use-------------------------------Difficult to use – Reliable (confident)--------------------Not Reliable (not confident)

3D LIVE – 3D Live Interactions through Visual Environments Project N. 318483
D1.2 Study and Creation of the Holistic User Experience Model Date 27/11/2013
3D LIVE Consortium Dissemination: Public 47/82
6.4 How to use the UX model and QoE and QoS metrics As reported earlier in this document, the UX holistic framework for the 3D LIVE project consists of:
– The UX Holistic model, suitable for providing the basis for describing any User eXperience in Tele Immersive Environments; and,
– The relevant metrics to assess and evaluate the User eXperience (QoE and QoS metrics).
As explained earlier in the reported example, the process for using and applying the UX methodological framework starts from the identification of the specific metric set, representative of the experience to be assessed. Based on the recognition of the specific users needs, it is possible to focus on a suitable set of metrics, extracted from the overall ones, which are deemed to best describe and evaluate the forthcoming experience. As also explained in more detail in AD(3), starting from a structured description of the anticipated experience scenario, it is always possible to map the needs arising from each scenario elements on to the holistic metric set, and to identify the subset which best describes the forthcoming experience. It is expected that, depending upon the specific experience, not all the metrics will be selected. Suitable thresholds of the selected metrics then can be set, in order to anticipate which values will make the experience successful and satisfactory. It is suggested to start with the QoE set, which can be reasonably discussed with the users and then to infer QoS ones, which sets the system requirements from an user point of view. After the conduction of the experiment, the assessment of the selected / identified metrics can be therefore performed, deriving both suggestions / recommendations on the proposed scenario elements as well as requirements on the system performance for providing an acceptable level of reality, immersiveness degree and satisfactoriness of the experience itself. Within the course of the 3D LIVE project, it is also expected that additional metrics could be suggested as a consequence of the experimentation to complement the currently proposed ones. This could originate an update of the overall UX model framework.

3D LIVE – 3D Live Interactions through Visual Environments Project N. 318483
D1.2 Study and Creation of the Holistic User Experience Model Date 27/11/2013
3D LIVE Consortium Dissemination: Public 48/82
7 Conclusions The objective of this document was to report on the activities performed to create a Holistic User eXperience model for describing and evaluating the user experience within the 3D LIVE project. The activities performed within this task were duly described and reported, together with the adopted approach. A detailed review of the State of the Art as far as the modelling of User eXperience recent works was performed and reported in both the document and its annexes. As the result of the activities performed within this task, a Holistic User eXperience model was created, in which the experience is described in terms of:
– Values or Experience Types (highlighting all the different forms in which an experience could take place);
– Elements of the User eXperience (describing how different elements contribute to the experience type);
– UX Properties (how the experience is captured) and the relevant Indicators; – Devices & Tools (through which the parameters relevant to the User eXperience
are collected; – Data (suitable values collected through the sensors, for metrics evaluation).
On the basis of the identified modelling for the User eXperience, tables including Quality of Experience and Quality of Services metrics have been provided, with a view of providing the basis for the design and the evaluation of the user experience. The created UX model and metric framework are deemed to be able to model, describe and appraise any 3D LIVE type (i.e. twilight) experience and need to be instantiated to the specific experience in order to identify and qualify the experience parameters which are most relevant for the specific context and to choose the metric values, associated to a satisfactory experience. This process is described in AD(3). It is also worth noting that the purpose of this document is to define a methodological framework to describe the User eXperience in a holistic way and to set the basis to accommodate future technological developments, which may not be available yet within 3D LIVE project. On the basis of the outcomes of the activities performed, a possible update of the Holistic User Experience model and the relevant metric framework can be done at the project end.

3D LIVE – 3D Live Interactions through Visual Environments Project N. 318483
D1.2 Study and Creation of the Holistic User Experience Model Date 27/11/2013
3D LIVE Consortium Dissemination: Public 49/82
8 References Ajzen, Icek (1 December 1991). "The theory of planned behavior". Organizational Behavior and Human Decision
Processes 50 (2): 179–211. Retrieved at http://dx.doi.org/10.1016%2F0749‐5978%2891%2990020‐T
Ajzen, I. & Fishbein, M. (1980). Understanding attitudes and predicting social behavior. Englewood Cliffs, NJ: Prentice‐Hall.
Ajzen, I. (1991). The theory of planned behavior. Organizational Behavior and Human Decision Processes, 50, pp. 179–211.
Alben, L. (1996). Quality of experience: defining the criteria for effective interaction design. interactions 3, 3 (May 1996), 11‐15. DOI=10.1145/235008.235010 http://doi.acm.org/10.1145/235008.235010
Argyle, M., Dean, J. (1965).Eye contact, distance and affiliation.Sociometry 28(3): 289‐304.
Javier A. Bargas‐Avila and Kasper Hornbæk. 2011. Old wine in new bottles or novel challenges: a critical analysis of empirical studies of user experience. In Proceedings of the SIGCHI Conference on Human Factors in Computing Systems (CHI '11). ACM, New York, NY, USA, 2689‐2698. DOI=10.1145/1978942.1979336 http://doi.acm.org/10.1145/1978942.1979336
Battarbee, K. (2003). Defining co‐experience, in Proceedings of Designing Pleasurable Products and Interfaces, DPPI’03, pp. 109 – 113.
Battarbee, K. (2004). Co‐experience: Understanding user experiences in social interaction. Publication series of the University of Art and Design.Helsinki A 51. Academic dissertation. Helsinki: Yleisjäljennös –Painopörssi.
Beauregard, R., Younkin, A., Corriveau, P., Doherty, R., Salskov, E. (2007). Assessing the Quality of User Experience. Intel Technology Journal 11, 77–87.
Bolger, N., Davis, A., Rafaeli, E., 2003. Diary methods: Capturing life as it is lived. Annual Review of Psychology 54 (1), 579‐616.
Busscher, B., de Vliegher D., Ling Y., & Brinkman W. ‐ P. (2011). Physiological measures and self‐report to evaluate neutral virtual reality worlds. Journal of CyberTherapy and Rehabilitation. 4(1), 15‐25
Corrie, B. , Wong, H., Zimmerman, T., Marsh, S., Patrick, A.S., Singer, J. , Emond, B. , Nol, S. (2003). Towards quality of experience in advanced collaborative
Csikszentmihalyi, Mihaly (1975). Beyond Boredom and Anxiety: Experiencing Flow in Work and Play, San Francisco: Jossey‐Bass.
Csikszentmihalyi, M, Rarson, R and Prescott, S (1977). The ecology of adolescent and experience, Journal of Youth and Adolescence, 6, 261‐294
Csikszentmihalyi, M. & Larson, R. (1987): ‘Validity and reliability of the experience‐sampling method’. Journal of Nervous and Mental Disease, Vol. 175, pp. 526‐536.
Csikszentmihalyi, M. (1990). Flow, the Psychology of Optimal Experience, New York, Harper and Row.
Csikszentmihalyi, M. (1991). Flow: The Psychology of Optimal Experience. Harper Perennial, New York, NY
Csikszentmihalyi, M. (1997). Intrinsic motivation and effective teaching: A flow analysis. In J. J. Bass (Ed.), Teaching well and liking it: Motivating faculty to teach effectively (pp. 72–89). Baltimore, MD: Johns Hopkins University Press.
Davis, F. D. 1989. Perceived usefulness, ease of use, and usage of information technology: a replication. MIS Quarterly, 13(3):319–340.
De Marez, L., De Moor, K. (2007a). The challenge of user‐ and QoE‐centric research and product development in today's ICT environment.Observatorio (OBS*) online journal, (1)3: 1‐22.

3D LIVE – 3D Live Interactions through Visual Environments Project N. 318483
D1.2 Study and Creation of the Holistic User Experience Model Date 27/11/2013
3D LIVE Consortium Dissemination: Public 50/82
De Moor, K., Joseph, W., Ketykó, I., Tanghe, E., Deryckere, T., Martens, L.and De Marez, L. (2010). Linking users' subjective QoE evaluation to signal strength in an IEEE 802.11b/g wireless LAN environment. EURASIP J. Wirel. Commun. Netw. 2010, Article 6 (April 2010), 10 pages. DOI=10.1155/2010/541568 http://dx.doi.org/10.1155/2010/541568
Eisenberg, N., R. A., Fabes et al, (1994).The relations of emotionality and regulation to dispositional and situational empathy‐related responding.Journal of Personality and Social Psychology 66 (4): 776–797.
Elliot, A.J, Covington, M.V.. Handbook of Competence and Motivation, Guilford press, 2007
Epstein, S. (1990). Cognitive‐Experiential Self‐Theory. In Pervin L. (ed.), Handbook of Personality Theory and Research (pp. 165‐192). NY: Guilford Publication.
Epstein, S. (2003). Cognitive‐Experiential Self‐Theory of Personality.In Millon, T.& Lerner, M. J. (Eds), Comprehensive Handbook of Psychology, Vol. 5: Personality and Social Psychology (pp. 159–184). Hoboken, NJ, Wiley & Sons.
Epstein, S., Pacini, R., Denes‐Raj, V., &Heier, H. (1996)."Individual differences in intuitive‐experiential and analytical‐rational thinking styles".Journal of Personality and Social Psychology 71: 390–405. Retrieved at http://www.ncbi.nlm.nih.gov/pubmed/8765488
Fenton, N. (1994) Software Measurement: A Necessary Scientific Basis. IEEE Transactions on Software Engineering. Vol. 20. No. 3. March 1994
Fishbein, M. & Ajzen, I. (1975). Belief, attitude, intention, and behavior: An introduction to theory and research. Reading, MA: Addison‐Wesley. Retrieved at http://www.people.umass.edu/aizen/f&a1975.html
Forlizzi, J., Ford, S. (2000). The building blocks of experience: an early framework for interaction designers. Proceedings of the 3rd conference on Designing Interactive Systems: processes, practices, methods, and techniques (DIS ’00). New York: ACM 2000, 419‐423.
Forlizzi, J. and Battarbee, K. (2004). Understanding experience in interactive systems.In Proc. DIS '04, 261‐‐268.
Forlizzi, J. (2007). How Robotic Products Become Social Products: An Ethnographic Study of Cleaning in the Home. To be published in HRI07 Proceedings.
Gaggioli, A., Bassi, M., & Della Fave, A. (2003).Quality of experience in virtual environments. In G. Riva, F. Davide, &W. A. Ijsselsteijn (Eds.), Being there: Concepts, effects and measurement of user presence in synthetic environments (pp. 4–14). Amsterdam: IOS Press.
Georgios N. Yannakakis, John Hallam: Ranking vs. Preference: A Comparative Study of Self‐reporting. ACII 2011:437‐446
J. A. Ghani et al. 1994.Task characteristics and the experience of optimal flow in human‐computer interaction.The Journal of Psychology.
Griffin, Em. (2008). Social Information Processing Theory of Joseph Walther. A First Look at Communication Theory 8th Ed.. McGraw Hill. Retrieved at http://www.afirstlook.com/edition_8/theory_resources/Social_Information_Processing_Theory
Hassenzahl, M. (2001). The effect of perceived hedonic quality on product appealingness.International Journal of Human‐Computer Interaction, 13, 4, 481‐499.
Hassenzahl, M. (2003). The thing and I: Understanding the relationship between user and product. In: K. Blyth, P.C. Overbeeke, A.F. Monk, P.C. Wright eds.,Funology: From usability to enjoyment. Kluwer Academic Publishers, (2003) 1‐12.
Hamam, A., Eid, M., Saddik, A. and Georganas. N. D. 2008. A Fuzzy Logic System for Evaluating Quality of Experience of Haptic‐Based Applications. In Proceedings of the 6th international conference on Haptics: Perception, Devices and Scenarios (EuroHaptics '08)
Hoffman, D. L.et al. 1996). Marketing in hypermedia computer‐mediated environments: Conceptual Foundations. The Journal of Marketing, 60(3)

3D LIVE – 3D Live Interactions through Visual Environments Project N. 318483
D1.2 Study and Creation of the Holistic User Experience Model Date 27/11/2013
3D LIVE Consortium Dissemination: Public 51/82
Hoffman, D. L., Novak, T. P. (2008). “Emergent Consumers” Can Help Develop Successful Future Ideas. White paper published in the proceedings of the GENI Opt‐In Workshop, July 20‐21, 2008
Hsu, C. et al. 2004.Why do people play on‐line games? An extended TAM with social influences and flow experience. Information Management, 41(7):853–868.
Jackson, C. M. et al. 2007.Toward an understanding of the behavioral intention to use an information system. Decision Sciences, 28(2):357–389.
Karan Mitra, ArkadyZaslavsky, and ChristerÅhlund. 2011. A probabilistic context‐aware approach for quality of experience measurement in pervasive systems. In Proceedings of the 2011 ACM Symposium on Applied Computing (SAC '11). ACM, New York, NY, USA, 419‐424. DOI=10.1145/1982185.1982276 http://doi.acm.org/10.1145/1982185.1982276
Kelly, J. R. and Barsade, S.G. (2001). "Mood and Emotions in Small Groups and Work Teams." Organizational behavior and human decision processes 86(1): 99‐130.
Kilkki, K. (2008). Quality of experience in communications ecosystem, Journal of Universal Computer Science, vol. 14, no. 5, pp.615–624.
Kilkki, K. (2008). Quality of Experience in Communications Ecosystem.in Socio‐Economic Issues in Future Generation Internet, J.UCS Special Issue, April 2008. Retrieve at http://www.jucs.org/jucs_14_5/quality_of_experience_in
Kock, N. (2004). The psychobiological model: Towards a new theory of computer‐mediated communication based on Darwinian evolution. Organization Science, 15(3), 327–348.
Koufaris, M. 2002.Applying the technology acceptance model and flow theory to online consumer behavior. Information Systems Research, 13(2):205–223.
Lauralee Alben. 1996. Quality of experience: defining the criteria for effective interaction design. interactions 3, 3 (May 1996), 11‐15. DOI=10.1145/235008.235010 http://doi.acm.org/10.1145/235008.235010
Khalil urRehmanLaghari, Imran Khan, and Noel Crespi. 2012. Quantitative and qualitative assessment of QoE for multimedia services in wireless environment. In Proceedings of the 4th Workshop on Mobile Video (MoVid '12). ACM, New York, NY, USA, 7‐12. DOI=10.1145/2151677.2151680 http://doi.acm.org/10.1145/2151677.2151680
Law, E., Roto, V., Hassenzahl, M., Vermeeren, A., Kort, J. (2009). Understanding, Scoping and Defining User Experience: A Survey Approach. In Proceedings of Human Factors in Computing Systems conference, CHI’09. 4–9 April 2009, Boston, MA, USA
E. Law and P. van Schaik. Modelling user experience ‐‐ an agenda for research and practice. Interacting with Computers, 22(5):313‐‐322, 2010.
Law, E. L‐C. (2011). The measurability and predictability of user experience.In Proc. EICS 2011 (pp. 1‐10).
Mamou, K.; Zaharia, T.; Preteux, F.; , "FAMC: The MPEG‐4 standard for Animated Mesh Compression," Image Processing, 2008. ICIP 2008. 15th IEEE International Conference on , vol., no., pp.2676‐2679, 12‐15 Oct. 2008
Mari, L., Carbone, P. (2012) Measurment Fundamentals: A Pragmatic View. IEEE Transactions on Instrumentation and Measurement. Vol. 6. No.8. August 2012.
Maruping, L. M. and Agarwal, R. (2004). "Managing team interpersonal processes through technology: a task‐technology fit perspective." Journal of Applied Psychology 89(6): 975.
Mehrabian Albert et James A. Russell (1980), An Approach to Environmental Psychology, The MIT Press, Cambridge, MA, 278 pagesp.
K.Mitra,C. ̊Ahlund,andA.Zaslavsky.(2011). A decision‐theoretic approach for quality of experience measurement and prediction. In Proceedings of the 2011 International Conference on Multimedia and Expo
3D LIVE – 3D Live Interactions through Visual Environments Project N. 318483
D1.2 Study and Creation of the Holistic User Experience Model Date 27/11/2013
3D LIVE Consortium Dissemination: Public 52/82
K. Mitra, A. Zaslavsky, and C. ̊Ahlund (2011). A probabilistic context‐aware approach for quality of experience measurement in pervasive systems. In Proceedings of the 2011 ACM Symposium on Applied Computing
Morville, P. (2004). User experience design. Retrieved January 2012, http://semanticstudios.com/publications/semantics/000029.php
Moshagen, M. Thielsch, M. T. 2010.Facets of visual aesthetics. International Journal of Human ‐ Computer Studies ,68 10 ,!689‐709. doi:10.
Norris, P.,& Epstein, S. (2003). The Investigation of Some Fundamental Issues Concerning Rational‐Analytical and Intuitive‐Experiential Thinking Style with a Short form of the Rational‐Experiential Inventory, Working Paper.
Norris, P.,& Epstein, S. (2011). "An experiential thinking style: Its facets and relations with objective and subjective criterion measures". Journal of Personality 79: 1044–1080. Retrieved at http://dx.doi.org/10.1111%2Fj.1467‐6494.2011.00718.x
Novak, T. P., Hoffman, D. L., & Yung, Y. (2000). Measuring the customer experience in online environments: A structural modeling approach. Marketing Science, 19(1), 22‐42.
Novak, T. P. , Hoffman, D. L., (2007). The Fit of Thinking Style and situation: New Measures of Situation‐Specific Experiential and Rational Cognition. UCR Sloan Center for Internet Retailing Working Paper, August 27.
Nurkka, P., Kujala, S. and Kemppainen, K. (2009). Capturing Users’ Perceptions of Valuable Experience and Meaning. Journal of Engineering Design 20, 5, 449–465.
Nysveen, H. et al. 2005. Intentions to use mobile services: Antecedents and cross‐service comparisons. Journal of the Academy of Marketing Science, 33(3):330–346.
Pallot, M., Pawar, K. S. (2012) A Holistic Model of User Experience for Living Lab Experiential Design , Proceedings of the 18th International Conference on Engineering, Technology and Innovation, ICE'2012 "Innovation by Collaboration and Entrepreneurial Partnerships", Munich, Germany, 18‐20 June 2012
Qin, X. (2002). Delayed consistency model for distributed interactive systems with real‐time continuous media. Journal of Software, 13(6)
Ramsay, A.: Investigation of physiological measures relative to self‐report of virtual reality induced sickness and effects (VRISE). In: The International Workshop on Motion Sickness: Medical and Human Factors, Marbella, Spain, May 26‐28 (1997)
Ranjan, A. et al. 2006.An exploratory analysis of partner action and camera control in a video‐mediated collaborative task. In Proc. of ACM CSCW’06, pages 403–412.
Reiter, U. (2011). Perceived quality in game audio . In Grimshaw, M. (Ed.), Game sound technology and player interaction: Concepts and develop‐ ments. Hershey, PA: IGI Global.
Ricky K.P. Mok, Edmond W.W. Chan, XiapuLuo, and Rocky K.C. Chang. 2011. Inferring the QoE of HTTP video streaming from user‐viewing activities. In Proceedings of the first ACM SIGCOMM workshop on Measurements up the stack (W‐MUST '11). ACM, New York, NY, USA, 31‐36. DOI=10.1145/2018602.2018611 http://doi.acm.org/10.1145/2018602.2018611
Roto V., Law E., Vermeeren, A., Hoonhout, J. (2011) User Experience White Paper: Bringing clarity to the concept of user experience (Result from Dagstuhl Seminar on Demarcating User Experience, Sept. 15‐18, 2010). http://www.allaboutux.org/uxwhitepaper.
Rubinoff, R. (2004). How to Quantify the User Experience. Retrieve January 2012 http://www.sitepoint.com/article/quantify‐user‐experience
Sanfey, A. G.; Rilling, J. K., Aronson, J. A., Nystrom, L. E. and Cohen, J. D. (2003). The Neural Basis of Economic Decision‐Making in the Ultimatum Game.Science 300 (5626): 1755–1758.
Satu Jumisko‐Pyykkö, DominikStrohmeier, TimoUtriainen, and Kristina Kunze. 2010. Descriptive quality of experience for mobile 3D video. In Proceedings of the 6th Nordic Conference on Human‐Computer

3D LIVE – 3D Live Interactions through Visual Environments Project N. 318483
D1.2 Study and Creation of the Holistic User Experience Model Date 27/11/2013
3D LIVE Consortium Dissemination: Public 53/82
Interaction: Extending Boundaries (NordiCHI '10). ACM, New York, NY, USA, 266‐275. DOI=10.1145/1868914.1868947 http://doi.acm.org/10.1145/1868914.1868947
Schrepp, M., Held, T., Laugwitz, B. (2006). The influence of hedonic quality on the attractiveness of user interfaces of business management software. Interact. Comput. 18, 5 (September 2006), 1055‐1069. DOI=10.1016/j.intcom.2006.01.002 http://dx.doi.org/10.1016/j.intcom.2006.01.002
Sheppard , R. M. et al. (2008).Advancing interactive collaborative mediums through tele‐immersive dance (ted): a symbiotic creativity and design environment for art and computer science. In ACM MM’08, Interactive Arts Program
Steinfield, C.W. (1986). Computer mediated communication in an organizational setting: Explaining task‐related and socio‐economical uses. In Communication yearbook 9.ed. M.L. Mclaughlin, 777‐804. Newbury Park, CA: Sage.
Steuer, J. (1946). Defining virtual reality: dimensions determining telepresence. Journal of Communication, 42:73–93, 1992.Stevens, S. S. "On the Theory of Scales of Measurement". Science 103 (2684): 677–680
Sperber, D. et al. (1996).Relevance: Communication and Cognition. Wiley‐Blackwell; 2 edition
Surridge, M., Chakravarthy, A., Bashevoy, M., Hall‐May, M. (2010) SERSCIS‐Ont: A Formal Metrics Model for Adaptive Service Oriented Frameworks. In, Adaptive 2010, Lisbon, Portugal, 1‐9.
Tatsuya Yamazaki, Takumi Miyoshi, Masato Eguchi, and Kyoko Yamori. 2012. A service quality coordination model bridging QoS and QoE. In Proceedings of the 2012 IEEE 20th International Workshop on Quality of Service (IWQoS '12). IEEE Press, Piscataway, NJ, USA, , Article 31 , 4 pages.
Tu, C.H., McIssac, M. (2002). The relationship of social presence and interaction in online classes.The American journal of distance education 16(3). 131‐150.
Van Schaik, P., Ling, J. (2008). Modelling user experience with web sites: Usability, hedonic value, beauty and goodness Original Research Article Interacting with Computers, Volume 20, Issue 3, May 2008, Pages 419‐432
Venkatesh, V., Morris, M. G., Davis, G. B. and Davis F. D. 2003. User acceptance of information technology: Toward a unified view. MIS Quarterly, 27.
Vermeeren, A. P. O. S., Law, E., Roto, V., Obrist, M., Hoonhout, L., and Väänänen‐Vainio‐Mattila, K.(2010). User experience evaluation methods: current state and development needs. In Proceedings of the 6th Nordic Conference on Human‐Computer Interaction: Extending Boundaries (NordiCHI '10). ACM, New York, NY, USA, 521‐530. DOI=10.1145/1868914.1868973 http://doi.acm.org/10.1145/1868914.1868973
Vogel, A. et al. (1995). Distributed multimedia and QoS: A survey. Proc. of IEEE Multimedia, 2(2):10–19
Whalen, T.E., Noel, S., Stewart, J.: Measuring the Human Side of Virtual Reality. In: International Symposium on Virtual Environments, Human Interfaces, and Measurement Systems, Lugano, Switzerland, July 27‐29 (2003)
Walther, J.B. (1992). Interpersonal effects in computer‐mediated interaction: A relational perspective. Communication research 19(1): 52‐90.
Wright, P., & McCarthy, J. (2003). Feature: A framework for analyzing user experience, summery of 'Making sense of Experience'. In A. Monk, M. Blythe & C. Overbeeke (Eds.), Funology: From usability to enjoyment. AA Dordrecht: Kluwer.
Wu, W., AhsanArefin, Raoul Rivas, Klara Nahrstedt, Renata Sheppard, and Zhenyu Yang. 2009. Quality of experience in distributed interactive multimedia environments: toward a theoretical framework. In Proceedings of the 17th ACM international conference on Multimedia (MM '09). ACM, New York, NY, USA, 481‐490. DOI=10.1145/1631272.1631338 http://doi.acm.org/10.1145/1631272.1631338

3D LIVE – 3D Live Interactions through Visual Environments Project N. 318483
D1.2 Study and Creation of the Holistic User Experience Model Date 27/11/2013
3D LIVE Consortium Dissemination: Public 54/82
Yamazaki, T. ;Miyoshi, T. ; Eguchi, M. ; Yamori, K. (2012). A service quality coordination model bridging QoS and QoE, Quality of Service (IWQoS), 2012 IEEE 20th International Workshop on Digital Object Identifier: 10.1109/IWQoS.2012.6245977
Yang, Z., Yu, B., Diankov, R., Wu, W. and Bajcsy, R. (2006).Collaborative dancing in tele‐immersive environment. In ACM MM’06
Zhao, J., Ordonez de Pablos, P. (2011). Regional knowledge management: the perspective of management theory, Behaviour & Information Technology, v.30 n.1, p.39‐49, [doi>10.1080/0144929X.2010.492240]

3D LIVE – 3D Live Interactions through Visual Environments Project N. 318483
D1.2 Study and Creation of the Holistic User Experience Model Date 27/11/2013
3D LIVE Consortium Dissemination: Public 55/82
9 Annex I Existing works on UX Models
9.1 Holistic View of UX As proposed by Pallot and colleagues (2013) in the ELLIOT Project, the generic approach of the holistic UX model is a “Top-Down/Bottom-Up” model type constituted of “User Experience” as a root followed by branches to “Experience Type” from 1 to n leaves (see Figure 9.1). Each “Experience Type” is then subdivided into m “Element” and each element into p “Property”. The value collected for the related properties are then aggregated back into the parent element and the aggregation of the elements is consolidated back into the experience type. It is believed that the cumulative visual representation of the level of performance for each type of experience (e.g. radar graph) could provide a good indication on the overall user experience for design improvements.
Figure 9.1 – Holistic UX Generic Model (Pallot, 2012)
In the 90’s and up to recently, UX related papers were focusing on the individual experience and not considering that much the potentiality of a collective experience. The holistic KSB User Experience Model takes into account the collective experience and the social and empathical experience types as well as other types of user experience that are considered part of the global user experience. This approach is quite in line with Forlizzi and Battarbee (2004) framework that takes an interaction-centred perspective, situated within a social context. It builds on the interaction centred model presented in Forlizzi & Ford (2000) as well as studies on collaborative aspects of user experience (Battarbee, 2003).
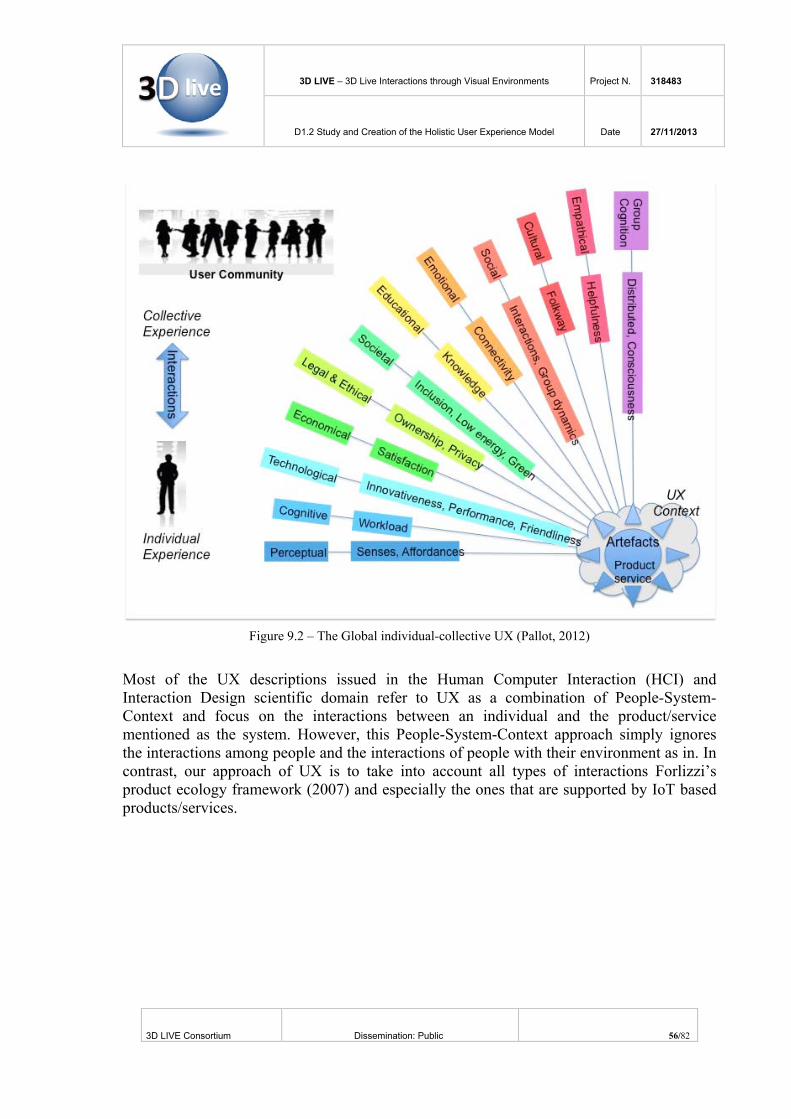
3D LIVE – 3D Live Interactions through Visual Environments Project N. 318483
D1.2 Study and Creation of the Holistic User Experience Model Date 27/11/2013
3D LIVE Consortium Dissemination: Public 56/82
Figure 9.2 – The Global individual-collective UX (Pallot, 2012)
Most of the UX descriptions issued in the Human Computer Interaction (HCI) and Interaction Design scientific domain refer to UX as a combination of People-System-Context and focus on the interactions between an individual and the product/service mentioned as the system. However, this People-System-Context approach simply ignores the interactions among people and the interactions of people with their environment as in. In contrast, our approach of UX is to take into account all types of interactions Forlizzi’s product ecology framework (2007) and especially the ones that are supported by IoT based products/services.

3D LIVE – 3D Live Interactions through Visual Environments Project N. 318483
D1.2 Study and Creation of the Holistic User Experience Model Date 27/11/2013
3D LIVE Consortium Dissemination: Public 57/82
Figure 9.3 – Holistic types of UX and All Types of Interactions (Pallot, 2012), inspired from Forlizzi’s product
ecology framework (2007) The names given to all experience types are voluntarily based on convenience for practical simplicity and understanding rather than deep scientific foundation. Most of them appear to be quite intuitive, though the legal or ethical user experience might be more surprising but interestingly making sense. In the literature, user experience is not broken down into different types such as social experience, cultural experience and perceptual experience and appears more monolithic. Interestingly, our approach of deciphering the elements and properties of a holistic view of user experience is intended to be more precise and rigorous for evaluating the level of user experience. The various experience types, elements and properties will be explored within several experiments to be carried out in real situations. They should provide a sound basis for a validation of the holistic model and all its components. In the same way, indications of potential evaluation (see Table 9.1, 9.2 and 9.3) are provided for each property of all identified elements of the different types of experience.

3D LIVE – 3D Live Interactions through Visual Environments Project N. 318483
D1.2 Study and Creation of the Holistic User Experience Model Date 27/11/2013
3D LIVE Consortium Dissemination: Public 58/82
Experience
Types Elements Ref Properties Description Evaluation Types
Evaluation Data
Ability to take information via the senses
K1.1 Vision Acquisition of data through sight
K1.2 Auditory Acquisition of data through hearing Sensorial Sensory (Sensitivity)
K1.3 Somatosensory Acquisition of data through tactile for touch within the study of haptic artefacts and proprioception for studying the sense of movement
Assessment of
degree of
operationality of
corresponding
senses
Log data Scale survey
K2.1 Detection of invariants Perception of what doesn't change across different situations
Observation on the perception of invariants
Log data Scale survey
Perceptual Perceptive Appreciation (Perceptivity)
K2.2 Sensing and Attunement of affordances
Taking information from senses about clues to the functions of objects (e.g. how long it takes to be able to detect handles to open/close doors); Adjust or accustom or acclimatize oneself with detected affordances in the near environment in order to anticipate the potential way to interact with this object (e.g. how long it takes to be accustomed with handles to open/close doors).
Observation on users' capacity to sense environment properties and identify affordances
Log data Scale survey
Cognitive Ability to process information, applying knowledge and changing preferences

3D LIVE – 3D Live Interactions through Visual Environments Project N. 318483
D1.2 Study and Creation of the Holistic User Experience Model Date 27/11/2013
3D LIVE Consortium Dissemination: Public 59/82
Cognitive Metaphor (Comprehensibility)
K3.1
Internal representation and Mental mapping
Internalisation of experiences' outcomes (mind). Understanding of one idea, often use representation via mental models (concepts). The term "representation" refers to external forms in the environment that are created through social interactions to express meaning. Conceptual mapping that allows to link different mental models and their meanings.
Behavioural observation Observation of internalisation and amount of internalised artefacts
Log data Scale survey
Cognitive Ergonomics (Cognitivity)
K3.2 Cognitive artefacts
Design of information representations that support cognitive tasks.
Observation of changes or improvements made based on experiments
Log data Scale survey
Group or social or distributed cognition (creation of new knowledge)
K4.1 Group Cognition
Cognitive processes may be distributed across the members of a social group. Collaborative Tagging or Group Blogging are examples of technological support for distributed cognition.
Observation of shared artefacts (e.g. tags, blogs, workspace)
Log data Scale survey
Reciprocal Distributed and Situated Cognition (Transductivity)
K4.2 Shared meanings
from mental space to external representation (tacit to explicit knowledge)
Observation on the externalisation (explicit knowledge) of mental models (tacit knowledge)
Log data Scale survey
Table 9.1 – References and Descriptions of the Knowledge Experience sub-model elements and properties (Pallot, 2013)

3D LIVE – 3D Live Interactions through Visual Environments Project N. 318483
D1.2 Study and Creation of the Holistic User Experience Model Date 27/11/2013
3D LIVE Consortium Dissemination: Public 60/82
Experience
Types Elements Ref Properties Description Evaluation Types
Evaluation Data
Association among one or several persons forming a team or expressing solidarity
Social Ties (Connectivity) S1.1
Social Networking and Openness
Ability to establish positive social (interpersonal) ties as information carrying connections among people (social networking)
ties development intensity of dialogue promptness of feed back
Log data Scale survey
S2.1 Communication Interact with one another (dyad) or two other persons (triad) or even more individuals (social group such as user communities)
Interaction frequency, action patterns, production patterns, participation rate
Log data Scale survey Interaction
(Interactivity)
S2.2 Collaboration Sharing knowledge for the common purpose of collective production
Amount of shared contents/objects
Log data Scale survey
Interpersonal
Group dynamics and Enhancement (Solidarity)
S3.1 Collective intelligence
Individuals behaviour within a group (collective intelligence, capacity to influence, wisdom of the crowd)
sense of belonging, commonality of purpose, amount of co-production timing of results
Log data Scale survey

3D LIVE – 3D Live Interactions through Visual Environments Project N. 318483
D1.2 Study and Creation of the Holistic User Experience Model Date 27/11/2013
3D LIVE Consortium Dissemination: Public 61/82
S3.2 Influential behaviour Mental leading within a team or group of individuals
Behavioural observation, amount of followers
Log data Scale survey
S3.3 Relationship enhancement
Active participation in relationship enhancement (larger the arena implies more productive the interpersonal relationship is apt to be, team-based learning). Mutual goodwill and rewarding.
Observation of patterns of relationship
S3.4 Accountability and Trust
Trust can be attributed to relationships between people. Humans have a natural disposition to trust and to judge trustworthiness
Observation on accountability patterns
Log data Scale survey
Complex psycho physiological experience of an individual's state of mind
S4.1 Physiological Arousal
Readiness to respond. Regulates consciousness, attention, and information processing. Extroverts and introverts have different arousability (Csikszentmihalyi, 1998).
Behavioural observation, arousability level
Scale survey
S4.2 Emotional Perceiveness
Physiological Perceiveness, capacity to perceive the emotional state of one another
Behavioural, Perceiveness level
Scale survey
Physiological state (Arousability)
S4.3 Social Affordance
Social affordance refers to the properties of an object or environment that permit social actions. Social affordance is most often used in the context of a social technology such as wiki and chat applications.
Behavioural observation, level of social affordance
Scale survey
S5.1 Attractiveness Level of enthusiasm or boredom or Level of curiosity and desire or disappointment and frustration (includes old 7.2 Appealingness).
Word of mouth, pro-active, intensity
Log data Scale survey
Emotional
Emotional Connection (Affectivity)
S5.2 Emotional Behaviour
Demonstrating emotional reactions when immersed into specific environments and activities.
Body language Facial express Voice tone Eyes dilatation
Log data Scale survey
Empathical Ways to behave within a community
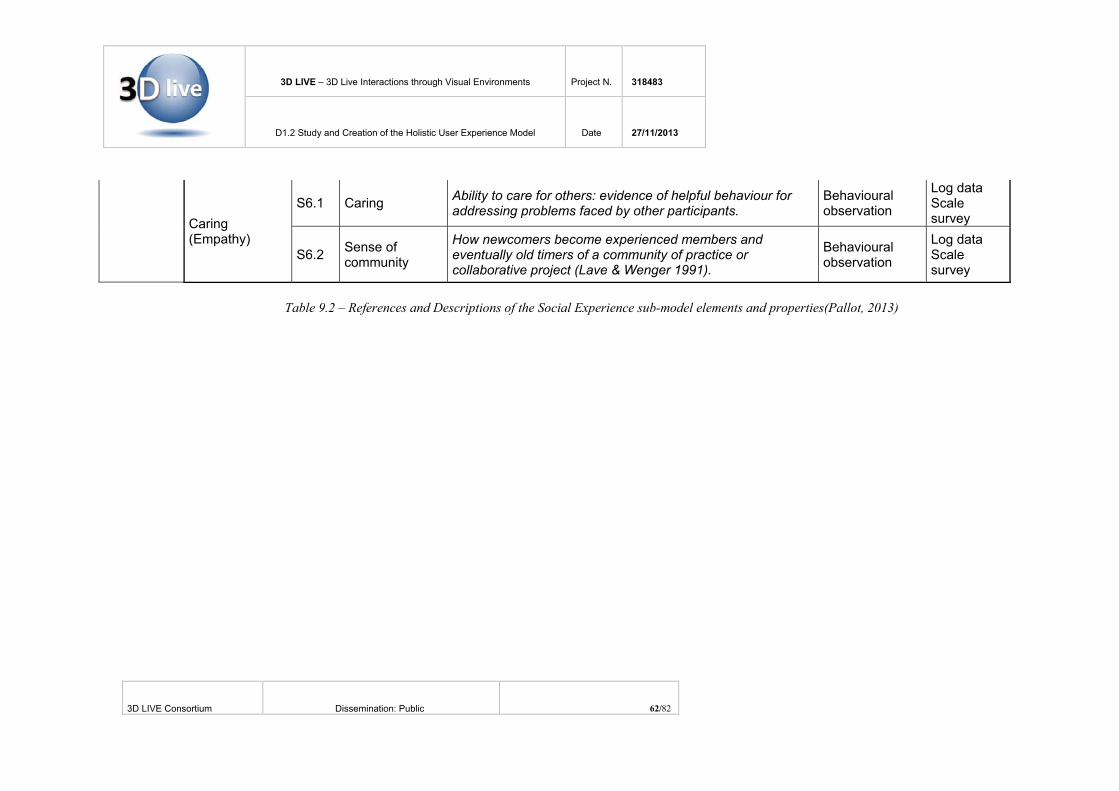
3D LIVE – 3D Live Interactions through Visual Environments Project N. 318483
D1.2 Study and Creation of the Holistic User Experience Model Date 27/11/2013
3D LIVE Consortium Dissemination: Public 62/82
S6.1 Caring Ability to care for others: evidence of helpful behaviour for addressing problems faced by other participants.
Behavioural observation
Log data Scale survey
Caring (Empathy)
S6.2 Sense of community
How newcomers become experienced members and eventually old timers of a community of practice or collaborative project (Lave & Wenger 1991).
Behavioural observation
Log data Scale survey
Table 9.2 – References and Descriptions of the Social Experience sub-model elements and properties(Pallot, 2013)

3D LIVE – 3D Live Interactions through Visual Environments Project N. 318483
D1.2 Study and Creation of the Holistic User Experience Model Date 27/11/2013
3D LIVE Consortium Dissemination: Public 63/82
Experience
Types Elements Ref Properties Description Evaluation Types
Evaluation Data
The degree of conformability reflects the fulfilment of user communities' expectations and needs
B1.1 New functionalities (IoT)
the degree of creativity expressed by newly designed product or service artefacts based on the use of IoT
Nbr of new functionalities, modalities, and artefacts.
Log data Scale survey
B1.2 Performance level (IoT)
The increase of performance level based on the use of IoT. Automation capacity (IoT).
Technical performance
Log data Scale survey
Innovativeness (creativity)
B1.3 Connectivity (IoT)
The degree of connectivity provided by the use of IoT. Ambient Intelligence (IoT).
The degree of automation
Log data Scale survey
B2.1 Reliability The capacity to operate the IoT based product or service without failure. Supportability. Maintainability.
The amount of failures
Log data Scale survey
Performance (conformability)
B2.3 Efficiency (perceived)
The capacity for the user(s) to be more efficient in operating the IoT based product or service. It takes less time to accomplish a particular task.
Perceived efficiency of the IoT based service(s)
Log data Scale survey
Technological
Friendliness (usability) B3.1 Ergonomic
quality
The degree to which the design optimizes human well-being and the overall system performance. Ease of use. Learneability. Simplicity. Flexibility.
Users' wellbeing during the use of the IoT based service(s)
Log data Scale survey
the level of adoptability by user communities and the business model Economical
Satisfaction (Favourability) B4.1 Usefulness
In economics, utility is a measure of relative satisfaction. It refers to the total satisfaction received by a consumer from consuming a good or service. Utility is often modelled to be affected by consumption of various goods and services, possession of wealth and spending of leisure time.
the utility level of the different features of the IoT based service(s)
Log data Scale survey

3D LIVE – 3D Live Interactions through Visual Environments Project N. 318483
D1.2 Study and Creation of the Holistic User Experience Model Date 27/11/2013
3D LIVE Consortium Dissemination: Public 64/82
B4.2 Hedonic quality
Subjective evaluation of the experience positiveness in terms of pleasure, fun, cool, originality, innovativeness, interesting, engaging, appealing, desirability, confortability and attractiveness. Emotional connection.
The level of fun and aesthetic as perceived by users
Log data Scale survey
B4.3 Affordability Economic appraisal Ratio calculation Log data Scale survey
B4.4 Productivity Increase of productivity through the use of technology (IoT) increase of productivity
Log data Scale survey
B4.5 Loyalty The degree of a user loyalty that could be expressed by factors such as frequency and duration of use.
Frequency and duration of use
Log data Scale survey
B5.1 Accessibility The degree to which a product, device, service, or environment is available to as many people as possible.
Nbr of sessions level of interest
Log data Scale survey
Inclusion (Suitability)
B5.2 Availability The degree to which a service is available on as many devices as possible.
Nbr of sessions level of interest
Log data Scale survey
reflect the level of user respectfulness
B6.1 User ideas and created content Things & content created by users. Protected user ideas. (e.g. patents or
copyrights) Log data Scale survey
Ownership (Recognition)
B6.2 User data (digital identity)
Personal data created by users. Elements of personal information contributing to digital reputation
The protection of user profile and digital identity.
Log data Scale survey
B7.1 Data protection The degree to which personal data are protected. The capacity to give permission for selective use of own data. The capacity to delete owned information/data
Own data privacy
Log data Scale survey
Legal & Ethical
Privacy (Protection)
B7.2 Anonymity The capacity to use an artefact without being necessarily identified
Artefacts anonymously use
Log data Scale survey
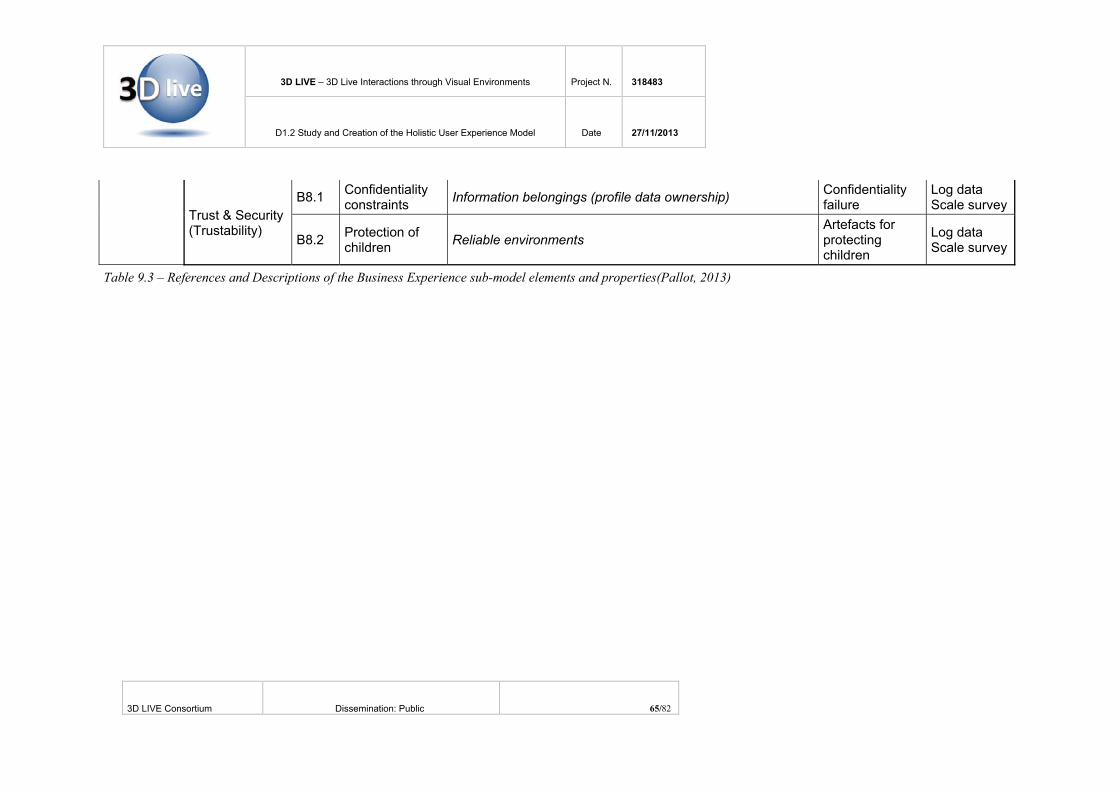
3D LIVE – 3D Live Interactions through Visual Environments Project N. 318483
D1.2 Study and Creation of the Holistic User Experience Model Date 27/11/2013
3D LIVE Consortium Dissemination: Public 65/82
B8.1 Confidentiality constraints Information belongings (profile data ownership) Confidentiality
failure Log data Scale survey
Trust & Security (Trustability)
B8.2 Protection of children Reliable environments
Artefacts for protecting children
Log data Scale survey
Table 9.3 – References and Descriptions of the Business Experience sub-model elements and properties(Pallot, 2013)
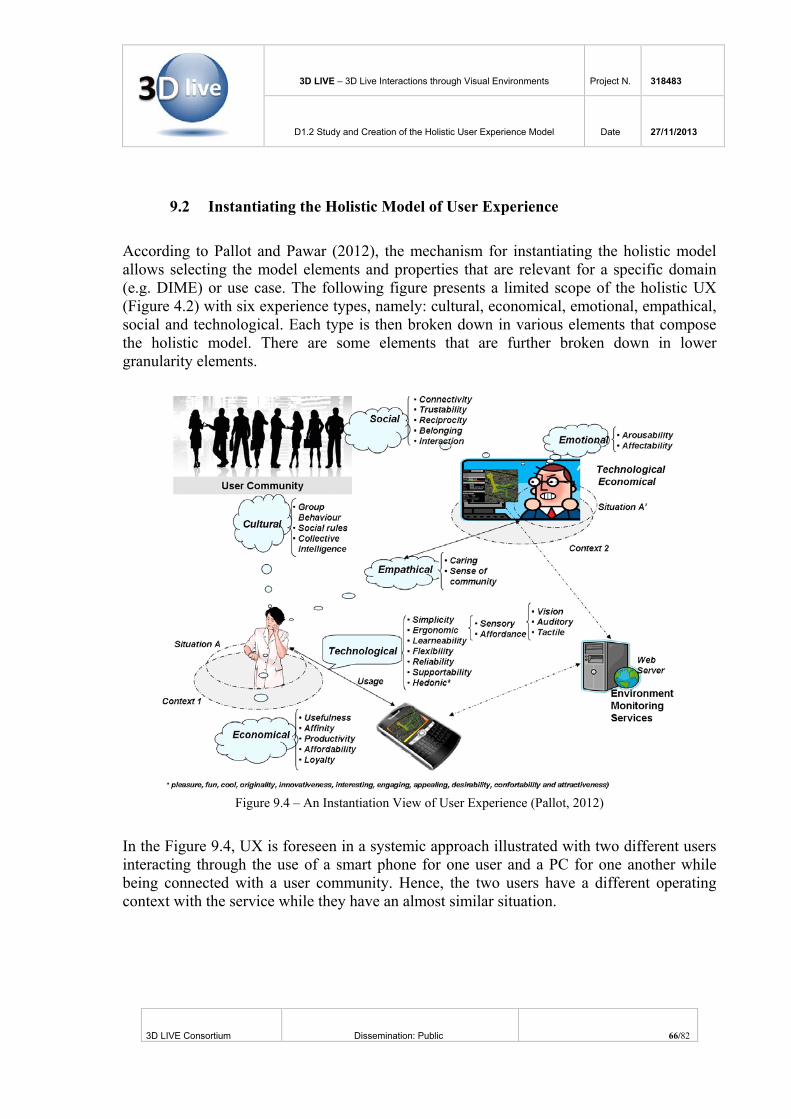
3D LIVE – 3D Live Interactions through Visual Environments Project N. 318483
D1.2 Study and Creation of the Holistic User Experience Model Date 27/11/2013
3D LIVE Consortium Dissemination: Public 66/82
9.2 Instantiating the Holistic Model of User Experience According to Pallot and Pawar (2012), the mechanism for instantiating the holistic model allows selecting the model elements and properties that are relevant for a specific domain (e.g. DIME) or use case. The following figure presents a limited scope of the holistic UX (Figure 4.2) with six experience types, namely: cultural, economical, emotional, empathical, social and technological. Each type is then broken down in various elements that compose the holistic model. There are some elements that are further broken down in lower granularity elements.
Figure 9.4 – An Instantiation View of User Experience (Pallot, 2012)
In the Figure 9.4, UX is foreseen in a systemic approach illustrated with two different users interacting through the use of a smart phone for one user and a PC for one another while being connected with a user community. Hence, the two users have a different operating context with the service while they have an almost similar situation.

3D LIVE – 3D Live Interactions through Visual Environments Project N. 318483
D1.2 Study and Creation of the Holistic User Experience Model Date 27/11/2013
3D LIVE Consortium Dissemination: Public 67/82
9.3 UX Life cycle Considering the UX life-cycle, Roto and colleagues (2011) propose that on the one hand, the observation is on usage and experienced behaviour for a very brief moment (e.g., visceral responses during usage). On the other hand, the observation is rather on cumulative experience formed through a series of usage episodes without any duration limit but include also periods without usage (periods of non-use). For Roto and colleagues, UX could be related to a momentary UX that is a specific change of feeling during interaction, or episodic UX that is the appraisal of a specific usage episode, or cumulative UX as views on a system as a whole, after having used it for a while. They also identified anticipated UX as logically related to the period before first use. However, they consider that anticipated UX could be any of the three other time spans of UX, simply due to the fact that“a person may imagine a specific moment during interaction, a usage episode, or life after taking a system into use.” The picture below (see Figure 9.5) depicts the combination of the four activities of the Experiential Design process with the life cycle of UX. The Co-creation activity refers to anticipated UX as the product or service doesn’t really exist yet; hence users have to imagine the interactions. The Exploration activity refers to both anticipated and momentary UX as some virtual/fake mock-up can help for experiencing the interactions with product or service. The Experimentation activity refers to momentary UX as a physical prototype supports the users for experiencing the product or service.
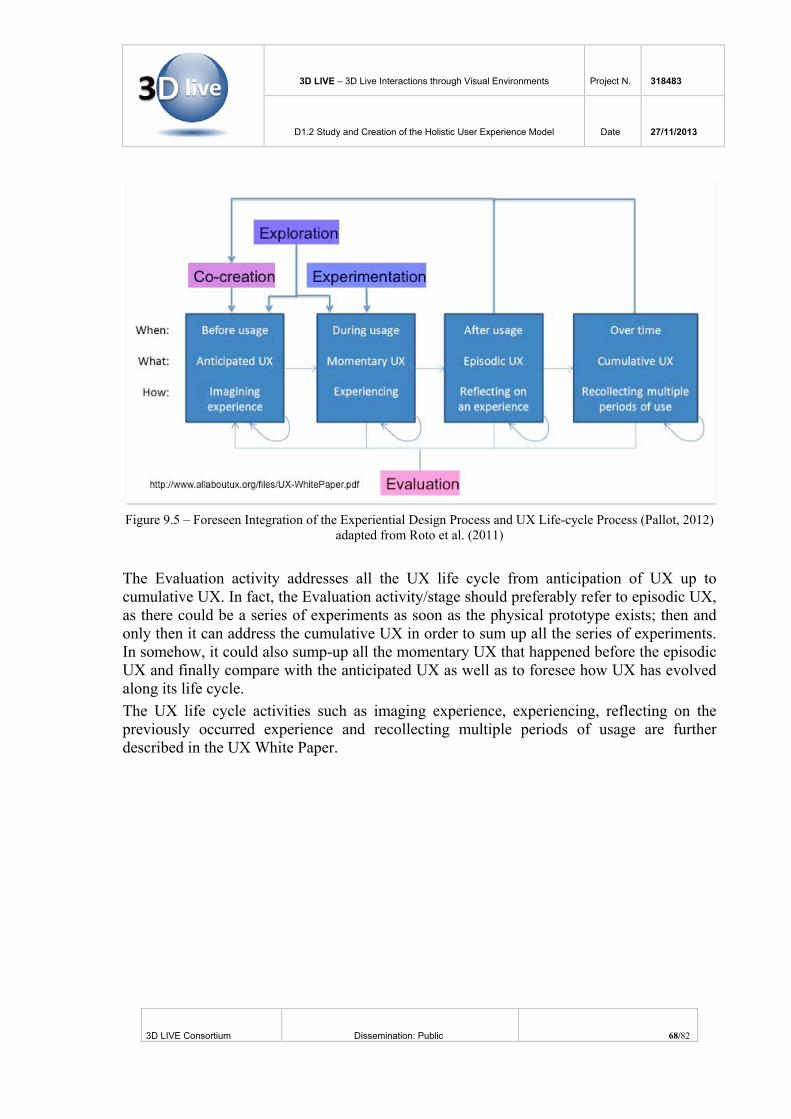
3D LIVE – 3D Live Interactions through Visual Environments Project N. 318483
D1.2 Study and Creation of the Holistic User Experience Model Date 27/11/2013
3D LIVE Consortium Dissemination: Public 68/82
Figure 9.5 – Foreseen Integration of the Experiential Design Process and UX Life-cycle Process (Pallot, 2012)
adapted from Roto et al. (2011) The Evaluation activity addresses all the UX life cycle from anticipation of UX up to cumulative UX. In fact, the Evaluation activity/stage should preferably refer to episodic UX, as there could be a series of experiments as soon as the physical prototype exists; then and only then it can address the cumulative UX in order to sum up all the series of experiments. In somehow, it could also sump-up all the momentary UX that happened before the episodic UX and finally compare with the anticipated UX as well as to foresee how UX has evolved along its life cycle. The UX life cycle activities such as imaging experience, experiencing, reflecting on the previously occurred experience and recollecting multiple periods of usage are further described in the UX White Paper.

3D LIVE – 3D Live Interactions through Visual Environments Project N. 318483
D1.2 Study and Creation of the Holistic User Experience Model Date 27/11/2013
3D LIVE Consortium Dissemination: Public 69/82
10 Annex II Evaluation of UX
10.1 Introduction There is a considerable amount of publication dedicated to User Experience (UX) and Quality of Experience (QoE) as shown in the Table 10.1 about Google-Scholar search results on various terms related to UX, especially the ones related to evaluation or measure as both terms are used. It is clear that there is a growing interest on UX and QoE as demonstrated by the growth from the 90’s up to the less than two years period of 2011-2013 that already scores about more than half value of the previous decade and more than four times for UX and three times for QoE the value of the 90’s. However, the growth rate of UX looks more exponential than the one of QoE.
Google Scholar
Search items 1991‐2000
2001‐2010
2011‐2013
Any‐time
User experience 5320 42800 23500 126000 Quality of Experience 2200 11700 6340 23000 User experience research 21 667 406 1130 User experience evaluation 2 413 368 806 User experience measures 0 48 32 80 Measure user experience 4 158 131 299
Table 10.1: Search results about UX research & evaluation and QoE (extended from Law, 2011) However, the growth rate of both UX research and UX evaluation shows the fast increasing level of interest on these two subjects, especially for the Industry that would be pleased to have more reliable evaluation methods, techniques and tools. Due to the subjective nature of UX, there are more published papers on evaluation than on measure, which requires a quantitative approach for getting metrics rather than a qualitative one. Emotion is often considered as a good example of the evaluation complexity. Nurkka (2009) explores the way to evaluate UX in combining personal values and product emotions. Regarding value, Nurkka argues that values can be seen as guiding principles in people’s lives that influence their usage behaviour for reaching their goal. The goal is mentioned as “the things that really matter to the user.” As for the judgment and selection of products, Nurkka expresses the following: “The judgment is affective, holistic and intuitive, and arouses high emotional states. By contrast, the indirect route for value influence is via product’s tangible attribute importance. The consumer judges the product attribute by attribute in a piecemeal fashion and the primary function of the product is instrumental (need to control and manipulate the environment).” Coming back to UX evaluation based on values and emotions, the author argues

3D LIVE – 3D Live Interactions through Visual Environments Project N. 318483
D1.2 Study and Creation of the Holistic User Experience Model Date 27/11/2013
3D LIVE Consortium Dissemination: Public 70/82
“However, the most important issues from a design point of view seem to be the understanding of the be-goals and the emotional reactions in the interaction, and the relationship between them. The idea behind the UX evaluation approach based on values and emotions is to concentrate on the person experiencing. Identifying values In UX evaluation, users’ motivation to use the product is important to understand, and therefore Portrait Values Questionnaire (PVQ) might be an appropriate tool. It is based on Schwartz’s theory of human values. The PVQ measures values indirectly, and the respondents are unaware that they are answering for a values questionnaire. The PVQ asks the respondent to evaluate whether he/she is similar to the person portrayed in the questionnaire in terms of their goals, aspirations and wishes. Thus, the questionnaire is quite concrete and contextualized, and provides information on which motivational types of values and their goals are important for the respondent. Measurement of emotions The second step in the evaluation process is measuring user’s emotional reaction in interaction with the product. There are several different emotion tools available. The criterion in selection of the tool is that it should be intuitive and usable right after the interaction event (or exposure to the stimulus). Product Emotions measurement instrument (PrEmo) fulfill the requirements. The instrument is based on animations of emotions presented by a cartoon character, which gives more cues about the portrayed emotion. Thus, selecting the “right” emotion is easier than with only pictures or wordings. Evaluating UX The proposition of this paper is that identifying values and measuring product emotions concurrently might set light on two interrelated questions. First, why the product is considered important, and second, why the different emotions are evoked. Analysis of value importance in relation to emotions should answer both questions. For example, if a person values achievement, (s)he is likely to have positive emotions towards a stimulus that represents success, and negative emotions on more modest stimulus. Product Emotion Measurement instrument Desmet introduces PrEmo as an instrument to assess emotional responses to consumer products in measuring a set of 14 emotions. Each emotion in this set is portrayed with an animated cartoon character by means of dynamic facial, bodily, and vocal expression, and presented on a computer interface. Participants can report their responses by selecting those animations that correspond with their felt emotion(s). In a final study, participants (N =23) rated all 41 emotions on a five-point scale (from ‘very relevant to product experience’ to ‘not relevant to product experience’). On the basis of the mean scores, the final set of 14 emotions was selected. Although, evidently, products can elicit more than these 14 emotions, these are the ones that can be considered to occur most frequently. Moreover, PrEmo requires a set that is surveyable. The set of 14 is regarded as a workable balance between comprehensive and surveyable.

3D LIVE – 3D Live Interactions through Visual Environments Project N. 318483
D1.2 Study and Creation of the Holistic User Experience Model Date 27/11/2013
3D LIVE Consortium Dissemination: Public 71/82
10.2 Evaluation and Measurement Law (2009) argues that UX evaluation means investigating how a person feels about using a product, a service or product/service. While UX is subjective by nature and context-dependent as well as time-dynamic, UX is not quite obvious to evaluate for getting appropriate results. While most of the exploration and experimentation of focused aspects of UX are carried out in labs, it is promoted by the Living-Labs community that holistic UX experiments should be carried out in real life environments with real stakeholders and especially user communities. However, there is currently a fast growing interest on evaluation methods, techniques, instruments and equipment that would allow systematising the collection of data, especially quantitative data. As shown in these tables, there do exist evaluation instruments and equipment for the assessment of emotion and other overall UX aspects. Nevertheless, through the current publication, it appears that there is no consensus on the types of user experience, their elements and properties that need to be evaluated/measured. Each product, each service and each combination of the two could generate different kinds of user experience. Overall, a list of UX elements emerge from the literature where they are applied as a basis for describing UX elements that could be assessed/measured in order to deduct the potential level of acceptability or adoption of a product or a service or a combination of the two:
– Utility: Does the user perceive the functions in the system as useful fit for the purpose?
– Usability: Does the user feel that it is easy and efficient to get things done? – Aesthetics: Does the user see the system as visually attractive? Does it feel
pleasurable in hand? (Moshagen, 2010) – Identification: Can I identify myself with the product? Do I look good when using
it? – Stimulation: Does the system give me inspiration? Or wow experiences? – Value: Is the system important to me? What is its value for me?
All participants (project stakeholders) need to agree on the selected UX elements and properties in making sure that there is no ambiguity in the used terminology. Otherwise, a well-known technique/instrument for evaluating some of the high-level UX elements consists to use a scale from negative to positive feelings (e.g. scaling from unsatisfactory up to satisfactory). There are well-known UX evaluation methods (subjective), such as scale survey, questionnaires, interviews, story-telling, focus-group interviews and sometimes combined methods or even triangulation approach for comparing what the users say and what they really do. Another technique is to apply heuristic like for the usability testing as very often usability is considered as one of the elements of user experience. List of overall user experience evaluation methods:
– Diary methods for self-reporting experiences during field studies (Bolger et al.,

3D LIVE – 3D Live Interactions through Visual Environments Project N. 318483
D1.2 Study and Creation of the Holistic User Experience Model Date 27/11/2013
3D LIVE Consortium Dissemination: Public 72/82
2003); – Experience Sampling Method (ESM) for self-reporting during field studies
(Csikszentmihalyi et al., 1987); – Day Reconstruction Method (DRM)– story-telling to reveal the meaningful
experiences during field studies (Kahneman et al., 2004); – AttrakDiff questionnaire for overall UX evaluation (Hassenzahl et al., 2003), see:
http://www.attrakdiff.de/en/Services/Demo-Project/; – Ladder interviews e.g. to find out attitudes or values behind behaviour or
experience; – Usability heuristic (see Wikipedia).
More recently, Bargas-Avila and Hornbaek (2012) reviewed 51 publications from 2005 to 2009, reporting a total of 66 UX empirical studies and looked at the assessed UX dimensions (see Figure 10.1) as well as the used methods (see Figure 10.2). They gave the following names to the found dimensions:
– Generic UX: the most frequently investigated. This dimension summarizes researchers that do not further specify on which aspects of UX they focus. Generic UX stems mostly from qualitative studies, where focus groups, interviews, or probes are used.
– Emotions and affect: the second most frequent dimension (24%). – Enjoyment (17%) and Aesthetics (15%), these are often mentioned as core
dimensions of UX.
Figure 10.1 Dimensions collected in UX research (Bargas-Avila &Hornbaek, 2012)
They also state that while most researchers agree that UX is multidimensional, about 50% of

3D LIVE – 3D Live Interactions through Visual Environments Project N. 318483
D1.2 Study and Creation of the Holistic User Experience Model Date 27/11/2013
3D LIVE Consortium Dissemination: Public 73/82
the studies assessed only one dimension and 71% of the studies assessed two or fewer dimensions. While UX is considered as a multi-aspects and complex construct, it is rather studied in focused and restricted ways. Authors discuss also the suitability of qualitative and quantitative approaches, saying that a key issue is whether and how UX is measured and modelled. They found that 50% of the studies are qualitative, 33% use quantitative methods and 17% combine the two approaches.
Figure 10.2 Data-collection methods in UX research (Bargas-Avila &Hornbaek, 2012)
The study looks also on how UX data is collected (see Figure 10.2). Questionnaires are the dominant UX-assessment method (53%), semi-structured interviews (20%), focus groups (15%) and open interviews (12%), as well as user observation (17%), analysis of video recordings (17%), and finally diaries (11%). While this study has also identified an emerging group of constructive or projective methods, such as probes, collages/drawings, and photographs, objective measurement of UX via psychophysiology is rarely used.
10.3 Examples of UX Evaluation Instruments There already exist a number of instruments and dedicated equipment for capturing data entering in the UX evaluation. They are as diverse as simple as pictures or scale survey (see Table 10.2) that could be used after the users have experienced a product or a service, more sophisticated capture of psycho-physiologic data that could be used during the user experience takes place and even more complex Brain-Computer Interface (BCI) devices as illustrated in the Table 10.2 below.

3D LIVE – 3D Live Interactions through Visual Environments Project N. 318483
D1.2 Study and Creation of the Holistic User Experience Model Date 27/11/2013
3D LIVE Consortium Dissemination: Public 74/82
UX elt Type of Instrument Example
Aesthetics Scale Appealingness, Attractiveness
Affect Scales SAM
Emotion Psychophysiology Heart rate, Eye-tracking
Flow Scale Flow State Scale (FSS)
Fun Scale, Postgame pictures
Play categories; Coding on ‘fun'
Hedonic Scale AttrakDiff
Table 10.2: Measures of UX qualities (adapted from [4])
10.4 Evaluation of Emotion Further information is directly available from the Design and Emotion organisation . This link to the Design & Emotion Society whose goal is to facilitate dialogue among practitioners, researchers and industry for integrating salient themes of emotional experience into the design profession. They provide a good approach for identifying relevant tools & methods categorised through two lines of innovation (incremental, radical or breakthrough) and 5 columns on understanding user/market, exploring ideas/concepts, designing specifications, testing and evaluating, and for market implementation.
There are also direct categories, such as tools to measure: – The emotional reaction to products; – Sensory characteristics; – The expression/meaning of products.
For example in the category of sensory characteristics, one of proposed tool is in fact an instrument named “Eye Tracking Analysis”. The eye tracking for this category is used to capture and analyse evaluation patterns of a product design perception. Relevant information provided by eye tracking is composed of the following triplet: “scan path”, “location of Areas of interest”, and “time in each area of interest”. It is claimed that most prominent features can be identified: “in this methodology gaze behaviour, combined with the knowledge of the features of the product, reveals the features that capture attention.”
10.5 Brain–computer interfaces The following table 10.3 presents a comparison of Brain-Computer Interface (BCI) devices available on the consumer market that could be used for evaluating an emotional state or some specific arousal instead of just using the brain for manipulating the interface with a computer. Most of the BCI are based on Electro-Encephalo-Graphy (EEG). This is the most studied category of BCI because it is a non-invasive interface, mainly due to its fine

3D LIVE – 3D Live Interactions through Visual Environments Project N. 318483
D1.2 Study and Creation of the Holistic User Experience Model Date 27/11/2013
3D LIVE Consortium Dissemination: Public 75/82
temporal resolution, ease of use, portability and low set-up cost. However, it is advised that the main barrier to using EEG as a BCI is the necessary training and calibration effort required before it becomes possible to make relevant emotional measurements.
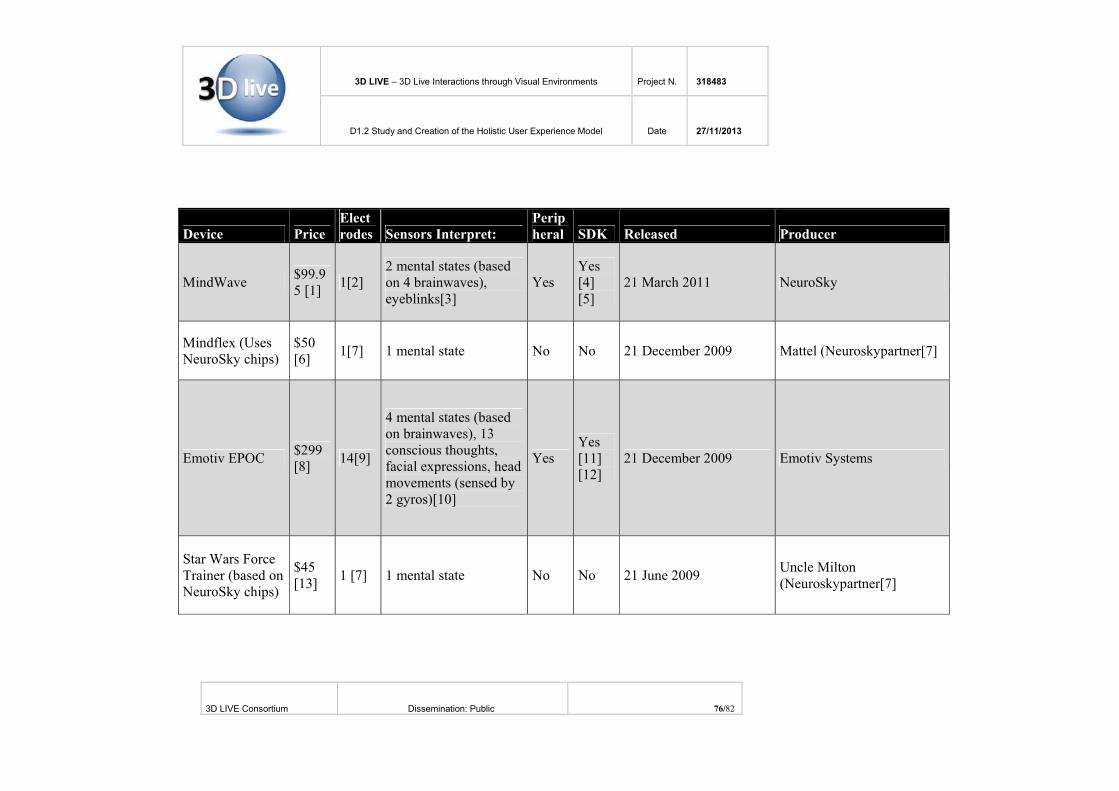
3D LIVE – 3D Live Interactions through Visual Environments Project N. 318483
D1.2 Study and Creation of the Holistic User Experience Model Date 27/11/2013
3D LIVE Consortium Dissemination: Public 76/82
Device Price Electrodes Sensors Interpret:
Peripheral SDK Released Producer
MindWave $99.95 [1] 1[2]
2 mental states (based on 4 brainwaves), eyeblinks[3]
Yes Yes [4] [5]
21 March 2011 NeuroSky
Mindflex (Uses NeuroSky chips)
$50 [6] 1[7] 1 mental state No No 21 December 2009 Mattel (Neuroskypartner[7]
Emotiv EPOC $299 [8] 14[9]
4 mental states (based on brainwaves), 13 conscious thoughts, facial expressions, head movements (sensed by 2 gyros)[10]
Yes Yes [11] [12]
21 December 2009 Emotiv Systems
Star Wars Force Trainer (based on NeuroSky chips)
$45 [13] 1 [7] 1 mental state No No 21 June 2009 Uncle Milton
(Neuroskypartner[7]

3D LIVE – 3D Live Interactions through Visual Environments Project N. 318483
D1.2 Study and Creation of the Holistic User Experience Model Date 27/11/2013
3D LIVE Consortium Dissemination: Public 77/82
MindSet $199 [14] 1[15]
2 mental states (based on 4 brainwaves), eyeblinks[3]
Yes Yes [16] March 2007 NeuroSky
Neural Impulse Actuator
$90 [17] 3[18]
2 brainwaves (Alpha & Beta), facial muscle and eye movements
Yes Yes [19]
May 2008; No longer being manufactured (EOL).[1]
OCZ Technology
Mindball $20,000 [20]
1[21] 1 mental state No No 21 March 2003 Interactive Productline
XWave headset (uses NeuroSky chips)
$90 [22] 1 8 EEG bands Yes Yes
5 January 2011; Windows and iOS apps available now, Android app available soon[23]
XWave
MyndPlayBrainBand (Uses NeuroSky chips [24])
$158 [25] 1 8 EEG bands Yes Yes 1 December 2011 MyndPlay
Table 10.3 - Comparison of consumer brain–computer interfaces (source: Wikipedia)

3D LIVE – 3D Live Interactions through Visual Environments Project N. 318483
D1.2 Study and Creation of the Holistic User Experience Model Date 27/11/2013
3D LIVE Consortium Dissemination: Public 78/82
11 ANNEX III EXPERIMEDIA experimental data management platform
EXPERIMEDIA is a EU project that is closely collaborating with 3D-LIVE; the 3D-LIVE experimental scenarios are expected to make use of EXPERIMEDIA’s ‘Experiment Content Component’ (ECC). The ECC is an Internet based service being developed to support experimenters’ analysis of Future Media Internet (FMI) technologies in wider experimental contexts, including popular leisure, professional sports and cultural venues. 3D-LIVE and EXPERIMEDIA share many of the same experimental challenges and data gathering requirements with respect to understanding FMI technologies and their impact on user experience. In each project experiments are being developed that support a diverse variety of devices and rich media services (2D and 3D) that will be integrated to provide a mixed reality experience for users remotely connected via the Internet. The primary area of experimentation overlap between the two projects is within the ‘experimentation’ phase depicted in Figure 11.1, during which time FMI systems and user experiences are to be monitored using a spectrum of data reflecting quality of service (QoS) and quality of experience (QoE) metrics. The ECC system is comprised of the following sub-components:
Figure 11.1 – ECC component diagram
A brief summary of each component is provided below.
11.1 EDC The ‘Experiment Deployment and Configuration’ component (EDC) deploys services (including the ECC if required) in virtual machines and connects them together. The input to

3D LIVE – 3D Live Interactions through Visual Environments Project N. 318483
D1.2 Study and Creation of the Holistic User Experience Model Date 27/11/2013
3D LIVE Consortium Dissemination: Public 79/82
it is the set of services desired for an experiment and the relationships between them. The system is based on the open source Juju system running under the Ubuntu Linux distribution.
11.2 ES The ‘Experiment Specification’ (ES) component consists of a set of configuration files that allow the experimenter to describe the resources and security details for the ECC components and their dependencies. This includes:
– EM network security certificates – EM entry point ID – EDM database configuration
11.3 ESC The ‘Experiment Security Correctness’ (ESC) component will use the SERSCIS Access Modeller (SAM) takes a model of a system (e.g. a set of objects within a computer program or a set of machines and services on a network) and attempts to verify certain security properties about the system, by exploring all the ways access can propagate through the system. It is designed to handle dynamic systems (e.g. systems containing factories which may create new objects at runtime) and systems where behaviour of some of the objects is unknown or not trusted.
11.4 EM (and AMQP Bus) The ‘Experiment Monitoring’ (EM) component manages the delivery of experiment data (QoS/QoE metrics) to the EDM from experimentally instrumented technology, connected via an AMQP bus (RabbitMQ is used as the implementation). Experimenters have access to a user interface (a web based dashboard) that controls the experimental monitoring process.
11.5 EDM The EDM manages the storage and retrieval of experiment related data. The current release of the EDM persists monitoring data of entities in experiments. This monitoring data is stored in a PostgreSQL 9.1.x (relational) database, according to a schema reflecting the experiment metrics model. Monitoring data is delivered to the EDM for storage by the EM and can be monitored by experimenters via a user interface. For more detailed technical information about EXPERIMEDIA technologies the reader should visit the EXPERIMEDIA website . The remainder of this section will focus on the experimental metric monitoring and data management aspects of the ECC. Experimental metric data is collected from software clients that use the ECC API (currently Java and Ruby versions are available). EXPERIMEDIA’s ECC service supports six sub-phases that are expected to be compatible with the ‘experiment’ process depicted in figure 11.1, these are:
11.6 Phase 0: Client connection to the ECC Before an experiment is said to begin, metric producing software clients must connect to the ECC. The ECC container listens for connections indefinitely until the user (experimenter)

3D LIVE – 3D Live Interactions through Visual Environments Project N. 318483
D1.2 Study and Creation of the Holistic User Experience Model Date 27/11/2013
3D LIVE Consortium Dissemination: Public 80/82
indicates they have the clients they need to proceed to the first phase (proper) of the experiment.
11.7 Phase 1: Discovery phase The discovery phase begins with the ECC requesting all connected clients create a discovery network communications interface. Clients do so, and then acknowledge they are ready to begin. During this phase, clients are queried about a) which of the subsequent phases they support and what ‘metric generators’ (see below) they are able to provide.
11.8 Phase 2: Set-up phase In the set-up phase, the ECC requires the client to progressively set up the metric generators they have available for use. Clients supporting this phase respond with the result of each set-up attempt.
11.9 Phase 3: Live monitoring phase As with the start of all phases, clients are requested to create the network communication interface to support the phase. After creation, clients then communicate to the ECC how they will deliver metric data: either as a pushing or pulling action, or both. ‘Pushing’ clients are able to send metrics to the ECC on an (controlled) ad-hoc basis. ‘Pulling’ clients will receive a request for new data by the ECC on-demand and should respond appropriately.
11.10 Phase 4: Post-reporting phase After the live monitoring phase, the ECC will contact the appropriate clients to begin the post-reporting phase. The purpose of this phase is to allow the ECC to retrieve metric data that was not possible to collect during the live monitoring phase. For example, some clients may generate data too quickly or have a network connection that is too slow for all of their data to be transferred to the ECC in time. During this phase, clients will request to send metric ‘data batches’ that will allow the ECC to complete its centrally stored data set.
11.11 Phase 5: Tear-down phase Finally, some clients may be able to report on their teardown process for some or all of their metric generators. In some cases, it will be useful for the experimenter to know whether the teardown process has succeeded or not. For example, in some cases, the experimenter will need to know whether or not users (represented by the connected client) have been successfully de-briefed on the completion of an experiment. The metrics described and provided by each ECC client are based on a model that has been based upon the general foundation of measurement constructs commonly found in the research, modelling and applied experimentation literature (Mari and Carbone, 2012; Fenton, 1994; Surridge et al., 2010). An outline of this model is provided below (see Figure 11.2).
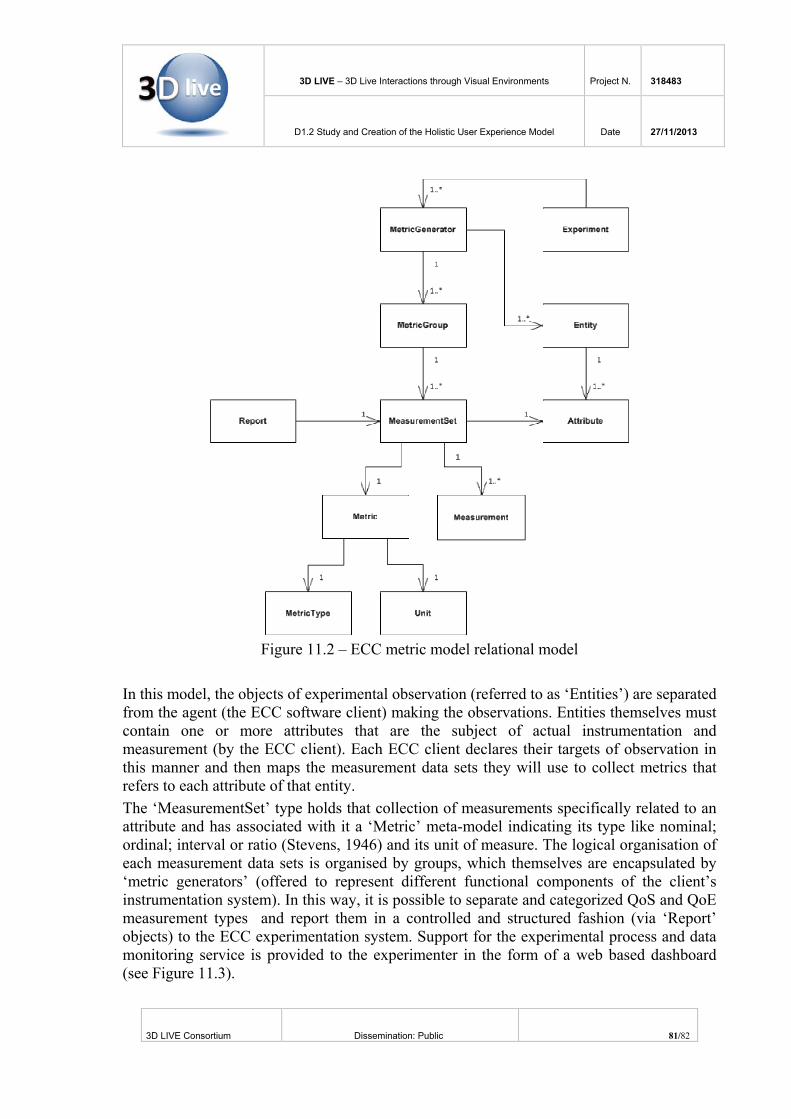
3D LIVE – 3D Live Interactions through Visual Environments Project N. 318483
D1.2 Study and Creation of the Holistic User Experience Model Date 27/11/2013
3D LIVE Consortium Dissemination: Public 81/82
Figure 11.2 – ECC metric model relational model
In this model, the objects of experimental observation (referred to as ‘Entities’) are separated from the agent (the ECC software client) making the observations. Entities themselves must contain one or more attributes that are the subject of actual instrumentation and measurement (by the ECC client). Each ECC client declares their targets of observation in this manner and then maps the measurement data sets they will use to collect metrics that refers to each attribute of that entity. The ‘MeasurementSet’ type holds that collection of measurements specifically related to an attribute and has associated with it a ‘Metric’ meta-model indicating its type like nominal; ordinal; interval or ratio (Stevens, 1946) and its unit of measure. The logical organisation of each measurement data sets is organised by groups, which themselves are encapsulated by ‘metric generators’ (offered to represent different functional components of the client’s instrumentation system). In this way, it is possible to separate and categorized QoS and QoE measurement types and report them in a controlled and structured fashion (via ‘Report’ objects) to the ECC experimentation system. Support for the experimental process and data monitoring service is provided to the experimenter in the form of a web based dashboard (see Figure 11.3).

3D LIVE – 3D Live Interactions through Visual Environments Project N. 318483
D1.2 Study and Creation of the Holistic User Experience Model Date 27/11/2013
3D LIVE Consortium Dissemination: Public 82/82
Figure 11.3 – ECC Web based Dashboard The experimenter can view the metric data meta-model supplied by each client, whilst live data is visualized as it arrives. All metric data is uniquely identified, time-stamped and subsequently stored in a database from which place it can be exported for further analysis.
![[D1.2] Final child models. - hal.archives-ouvertes.fr](https://static.fdocuments.us/doc/165x107/62827de3cfaa80788828ba23/d12-final-child-models-halarchives-.jpg)