3D Laser Scanning for Masonry Arch Bridges - FIG · The enemy of masonry arch structures is ... 3D...
15
TS 4D – TLS Application 1 Thomas Werner and David Morris 3D Laser Scanning for Masonry Arch Bridges FIG Congress 2010 Facing the Challenges – Building the Capacity Sydney, Australia, 11-16 April 2010 1/15 3D Laser Scanning for Masonry Arch Bridges Thomas WERNER and David MORRIS, Australia Key words: Bridge surveying; Deformation measurement; Engineering survey; History; Laser scanning; Risk Management SUMMARY Masonry arch bridges have proven to be durable and reliable structures for centuries. Many masonry arch bridges carry much higher traffic loads than they were originally intended to carry. Over many decades, the main agent for deterioration in masonry arch bridges is a combination of poor drainage behind the abutments and over the arches. If the water is not intercepted and carried away from the bridge, it finds its own route through the structure, usually via the mortar joints. The damaging agent of structural deterioration is that as the cementitious materials in the mortar get leached out, and the mortar gaps begin to close up. Inevitably, mortar loss is not uniformly spread through the arch and gaps close up in a non- uniform way. With increased axle loads and little cover over the arch, the arch can deform asymmetrically under the repeated live loading. Change in shape of a masonry arch is serious as the resistance to the applied loads (line of thrust in the arch) also changes. Such deformations can be comprehensively detected through surveying with Laser Scanning technologies; and information acquired during initial stages can be repeatedly used throughout redevelopment/refurbishment works – without the need to remobilise.
Transcript of 3D Laser Scanning for Masonry Arch Bridges - FIG · The enemy of masonry arch structures is ... 3D...

TS 4D – TLS Application 1
Thomas Werner and David Morris
3D Laser Scanning for Masonry Arch Bridges
FIG Congress 2010
Facing the Challenges – Building the Capacity
Sydney, Australia, 11-16 April 2010
1/15
3D Laser Scanning for Masonry Arch Bridges
Thomas WERNER and David MORRIS, Australia
Key words: Bridge surveying; Deformation measurement; Engineering survey; History;
Laser scanning; Risk Management
SUMMARY
Masonry arch bridges have proven to be durable and reliable structures for centuries. Many
masonry arch bridges carry much higher traffic loads than they were originally intended to
carry. Over many decades, the main agent for deterioration in masonry arch bridges is a
combination of poor drainage behind the abutments and over the arches. If the water is not
intercepted and carried away from the bridge, it finds its own route through the structure,
usually via the mortar joints. The damaging agent of structural deterioration is that as the
cementitious materials in the mortar get leached out, and the mortar gaps begin to close up.
Inevitably, mortar loss is not uniformly spread through the arch and gaps close up in a non-
uniform way. With increased axle loads and little cover over the arch, the arch can deform
asymmetrically under the repeated live loading. Change in shape of a masonry arch is serious
as the resistance to the applied loads (line of thrust in the arch) also changes. Such
deformations can be comprehensively detected through surveying with Laser Scanning
technologies; and information acquired during initial stages can be repeatedly used throughout
redevelopment/refurbishment works – without the need to remobilise.

TS 4D – TLS Application 1
Thomas Werner and David Morris
3D Laser Scanning for Masonry Arch Bridges
FIG Congress 2010
Facing the Challenges – Building the Capacity
Sydney, Australia, 11-16 April 2010
2/15
3D Laser Scanning for Masonry Arch Bridges
Thomas WERNER and David MORRIS, Australia
1. INTRODUCTION – 3D LASER SCANNING
Terrestrial laser scanning is the surveying technique of remotely acquiring a rapid ‘burst’ of
measurements within an area or ‘scene’. Acquisition is performed at a user-defined density
and can range from a coarse ground / contour level of detail to fine-detail modelling of nuts
and bolts on steel lattice elements, for example.
The process (see Fig 1.) uses several instrument set-ups over a project site to obtain the
appropriate level of detail as required. The scans are then merged to obtain a comprehensive
data set of existing conditions available for extraction at any time in the future – reducing site
access/down-time and mobilisation costs.
Various deliverables are available – from diagrammatic to detailed plan sets and the
application areas include many commercial, industrial and civil applications. This paper
outlines the uses for laser scanning in deformation monitoring and existing conditions
applications for bridge redevelopment projects.
3D laser scanning can be used as a cost effective method of surveying heritage steel railway
viaducts (see Fig 2.) to produce as-constructed drawings. Whereas traditional survey methods
required either the installation of extensive access platforms or specialist roped access, laser
scanning surveying has the ability to safely and remotely acquire information without direct
contact.
The height of the steel lattice towers alone presented serious OH&S problems, which were
completely eliminated by the use of the 3D laser scanning technique.

TS 4D – TLS Application 1
Thomas Werner and David Morris
3D Laser Scanning for Masonry Arch Bridges
FIG Congress 2010
Facing the Challenges – Building the Capacity
Sydney, Australia, 11-16 April 2010
3/15
Fig 1: Terrestrial Laser Scanning Process Cycle.

TS 4D – TLS Application 1
Thomas Werner and David Morris
3D Laser Scanning for Masonry Arch Bridges
FIG Congress 2010
Facing the Challenges – Building the Capacity
Sydney, Australia, 11-16 April 2010
4/15
Fig 2: Moorabool Viaduct image and laser scan point cloud.
2. MASONRY ARCH BRIDGES
A significant number of the bridges in Victoria, Australia are masonry arches constructed
during the 19th
century. During the construction of the Regional Fast Rail project, GHD and
Survey21 monitored the condition of these bridges for the Victorian Government Department
of Infrastructure. Masonry arch bridges are clearly durable, with many examples of ancient
arch bridges surviving in Europe from Roman times. The enemy of masonry arch structures is
movement of the foundations and deformation of the arch. Traditionally, the shape of
masonry arch bridges is surveyed at quarter points using precision levelling or by monitoring
survey targets attached to the surface. The limitation of this method is the time taken to install
the targets, the vulnerability of the targets to damage by vehicle impact or weathering, and the
relatively small amount of data captured for analysis and inspection of bridge conditions.
3. INTERPRETATION OF LASER SCANNING DATA
With the large quantity of information captured from Terrestrial Laser Scanning, data
interpretation can potentially be a cumbersome task. Fig 3. shows that laser scanning point-
cloud information can be based upon a relative return-intensity scale – where materials such
as bricks and mortar each have different return brightness.
Fig 3: Raw point cloud of a bridge abutment and wing-wall (cf photo).
When laser scans of a particular project site are repeated at different times, comparisons of the
overlapping surfaces can be compared to identify areas of deviation – of any area measured.
This creates a detailed deformation monitoring set for an entire scene; as opposed to the
conventional method of a discrete set of monitoring points. Data interpretation involves the

TS 4D – TLS Application 1
Thomas Werner and David Morris
3D Laser Scanning for Masonry Arch Bridges
FIG Congress 2010
Facing the Challenges – Building the Capacity
Sydney, Australia, 11-16 April 2010
5/15
initial inspection of overlapping areas by assigning a single colour to each data set – such as
red and blue (see Fig 4.).
Fig 4: Two overlapping surfaces from 2005 and 2009.
An issue arises with repeatability measurements of the two surfaces – where no two
acquisitions can be exactly repeated – so three potential outcomes are drawn from visual
inspection:
− Mixed colour and overlap across all the bridge arch
− Dominating colour in some of the area of the bridge arch
− Dominating colour in all of the bridge arch
Where mixed colour exists, it is interpreted that this is due to random errors through
measurements and that no arch movement has been observed.
Where dominating colour exists in particular areas, close-up section inspections can be
implemented to determine the magnitude of deviations is such areas.
Fig 5. shows a visual and typical cross-section close-up for a bridge arch, to aid in
determining the magnitude of this dominant movement.
Fig 5: Sections along bridge arch with close-up deviations.

TS 4D – TLS Application 1
Thomas Werner and David Morris
3D Laser Scanning for Masonry Arch Bridges
FIG Congress 2010
Facing the Challenges – Building the Capacity
Sydney, Australia, 11-16 April 2010
6/15
When dominating colour occurs over the entire bridge arch, statistical analysis can be
implemented to confirm whether or not any movement through the bridge has occurred. This
can be performed through the automated collection of deviations between the two surfaces
across a grid.
Fig 6: Grid Spacing along Bridge Arch Example (spacing 0.5m).
When several thousand measurements are performed (such as on a 0.1m grid spacing) a
normal distribution of mean µ and standard deviation σ can be assumed and allow for
interpretation for global deformation of the arch underside.
Utilising this information further, localised analysis can also be extracted from laser scanning
data to identify if specific stones are moving more than adjacent stones, similar as shown
below in Fig 7.

TS 4D – TLS Application 1
Thomas Werner and David Morris
3D Laser Scanning for Masonry Arch Bridges
FIG Congress 2010
Facing the Challenges – Building the Capacity
Sydney, Australia, 11-16 April 2010
7/15
4. USE OF LASER SCANNING IN LOAD TESTING
Maintenance inspections of the blue stone bridge carrying the Geelong to Ballarat rail line
near Elaine in Victoria, Australia discovered serious cracking and spalling of the arch stones,
and an investigation was carried out to determine the in service performance of the bridge.
Load testing of Blue Bridge demonstrated that there was movement of the arch under load.
The technique used by GHD to monitor masonry arch structures for indications of any change
in shape is 3D Laser scanning provided by Survey21.
The changes in shape of the Blue Bridge arch were detected by scanning the arch surface
under no load, and then with the locomotive at the most adverse position (see Fig 10.). By
comparing the two scan results for the arch (see Fig. 7); it could be observed that the arch
moved noticeably under live load.
Fig 7: Localised deformation analysis example (contours showing deviation).

TS 4D – TLS Application 1
Thomas Werner and David Morris
3D Laser Scanning for Masonry Arch Bridges
FIG Congress 2010
Facing the Challenges – Building the Capacity
Sydney, Australia, 11-16 April 2010
8/15
5. RELIABILITY OF THE METHOD
Traditional methods of surveying arches (see Fig 8.) rely on the application of targets which
are monitored for movement. Only the targets are observed for movement, which practically
limits the number of points that can be monitored.
Fig 8: Traditional survey method using targets.
Using laser scanning technology, the data generated during the acquisition process takes in
every part of the structure within the line of sight of the laser heads. This ensures that the
position of each part of the surface scanned is faithfully reproduced and more importantly the
relative position of each part of the surface is recorded (see Fig 9.).
Fig 9: Cloud point image (from laser scanning) taken for the entire bridge.

TS 4D – TLS Application 1
Thomas Werner and David Morris
3D Laser Scanning for Masonry Arch Bridges
FIG Congress 2010
Facing the Challenges – Building the Capacity
Sydney, Australia, 11-16 April 2010
9/15
Very small relative movements can be detected between one scanned surface data set and
another taken some time later. The data collected for the semi elliptical arch was compared
(before and after loading – see Fig. 11) and it was observed that measureable movement had
occurred in the shape of the arch under the applied loading (see Fig. 7).
Fig 10: Load test on blue stone bridge.
Fig 11: Heights measured from point cloud data.

TS 4D – TLS Application 1
Thomas Werner and David Morris
3D Laser Scanning for Masonry Arch Bridges
FIG Congress 2010
Facing the Challenges – Building the Capacity
Sydney, Australia, 11-16 April 2010
10/15
The shape of the arch was analysed for the given axle load / position, and it was noted that
resulting high compressive forces are predicted by the model at the positions where the
voussoirs are split and spalling (see Fig 12.).
Fig 12: Thrust line for the semi-elliptical arch.
6. STRENGTHENING TECHNIQUE
Following the load test on the bridge revealing deformation in the arch under load, the bridge
was propped (see Fig 12.) as a temporary measure whilst a permanent solution was discussed
with Heritage Victoria.
Fig 13: Propping using proprietary false-work and grout bags.

TS 4D – TLS Application 1
Thomas Werner and David Morris
3D Laser Scanning for Masonry Arch Bridges
FIG Congress 2010
Facing the Challenges – Building the Capacity
Sydney, Australia, 11-16 April 2010
11/15
A number of strengthening techniques were considered (CIRIA, 2006); however, Heritage
Victoria considered that the bridge was of significance to the State and that any strengthening
technique used:
− would be required to cause no significant damage to the structure
− must be capable of removal at some future time, to restore the bridge to its current
state if required.
The solution developed by GHD involved the detailing of a precast concrete liner, which was
assembled on site and pushed into position under the blue stone bridge. The shape of the blue
stone arch was accurately determined from 3D Laser Scanning data initially acquired and was
used to detail the shape of a precast concrete liner (see Fig 14 & 15.).
Fig 14: sectional analysis plans (example) of existing bridge conditions used for developing
precast concrete liner.
TS 4D – TLS Application 1
Thomas Werner and David Morris
3D Laser Scanning for Masonry Arch Bridges
FIG Congress 2010
Facing the Challenges – Building the Capacity
Sydney, Australia, 11-16 April 2010
12/15
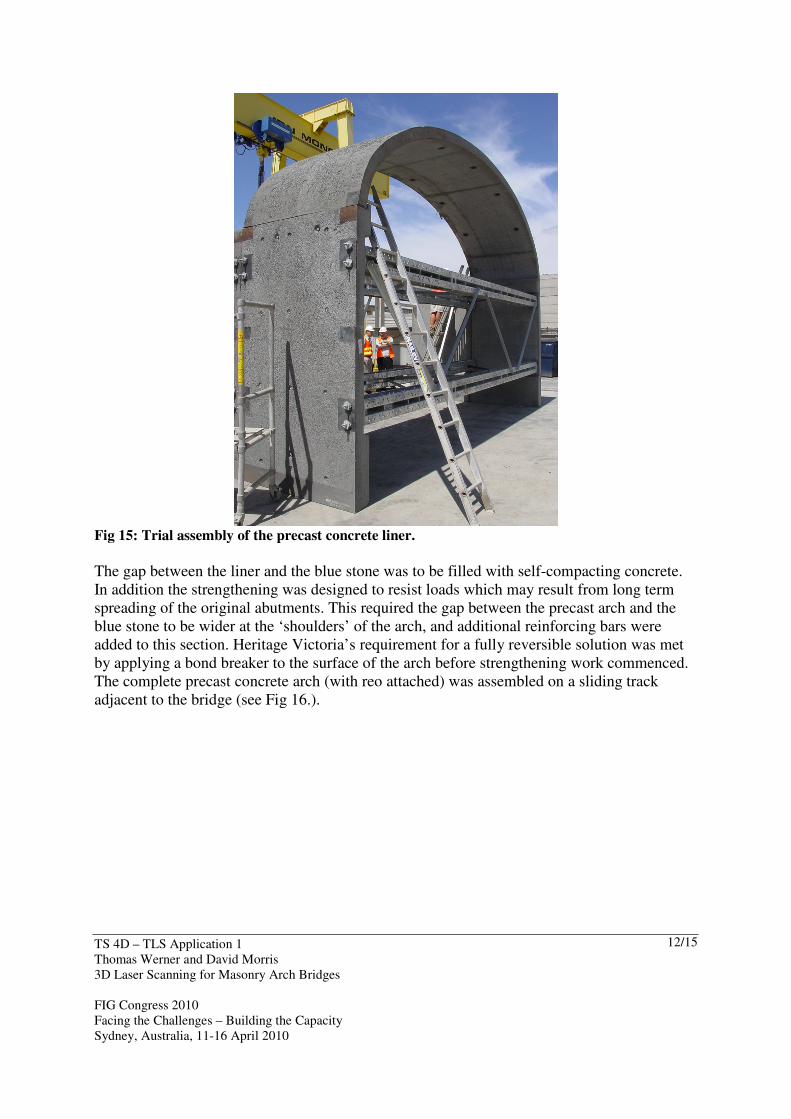
Fig 15: Trial assembly of the precast concrete liner.
The gap between the liner and the blue stone was to be filled with self-compacting concrete.
In addition the strengthening was designed to resist loads which may result from long term
spreading of the original abutments. This required the gap between the precast arch and the
blue stone to be wider at the ‘shoulders’ of the arch, and additional reinforcing bars were
added to this section. Heritage Victoria’s requirement for a fully reversible solution was met
by applying a bond breaker to the surface of the arch before strengthening work commenced.
The complete precast concrete arch (with reo attached) was assembled on a sliding track
adjacent to the bridge (see Fig 16.).

TS 4D – TLS Application 1
Thomas Werner and David Morris
3D Laser Scanning for Masonry Arch Bridges
FIG Congress 2010
Facing the Challenges – Building the Capacity
Sydney, Australia, 11-16 April 2010
13/15
Figure 16: Precast concrete liner ready for sliding (with reo attached).
The construction operations were completed over a long weekend possession. The temporary
propping was removed, the arch slid into position, the gap between the concrete arch and the
blue stone arch was concreted and the bridge opened to rail traffic after the concrete had
achieved the specified minimum strength.
The completed project (see Fig 17.) provided the required strengthening with a well
engineered, well detailed solution which did not damage the heritage structure.
Fig 17: Completed strengthening works.

TS 4D – TLS Application 1
Thomas Werner and David Morris
3D Laser Scanning for Masonry Arch Bridges
FIG Congress 2010
Facing the Challenges – Building the Capacity
Sydney, Australia, 11-16 April 2010
14/15
7. CONCLUSIONS
3D laser scanning is a cost effective technique for
− Producing as-built drawings of bridges, particularly where access is restricted;
− Capturing and monitoring the shape of masonry arches;
− Detecting movement in the shape of masonry arches due to long term deterioration
− Detecting movements in masonry arches under an applied loading.
REFERENCES
CIRIA Guide C656 Masonry arch bridges: condition appraisal and remedial treatment 2006

TS 4D – TLS Application 1
Thomas Werner and David Morris
3D Laser Scanning for Masonry Arch Bridges
FIG Congress 2010
Facing the Challenges – Building the Capacity
Sydney, Australia, 11-16 April 2010
15/15
BIOGRAPHICAL NOTES
Thomas Werner Business Development Manager at Survey21 Pty Ltd, Manager – Terrestrial Laser Scanning,
2009 Victorian Spatial Excellence Awards Winner – 3D Laser Scanning for Masonry Arch
Bridges
2009 Asia-Pacific Spatial Excellence Awards Winner – 3D Laser Scanning for Masonry Arch
Bridges
2008 Victorian Young Spatial Professional of the Year
2007-Present Victorian Surveying and Spatial Sciences Institute Young Professionals
Chairman
David Morris Civil Structures Leader for Arup Pty Ltd (formerly Bridges Group Manager for GHD Pty Ltd)
2009 Victorian Spatial Excellence Awards Winner – 3D Laser Scanning for Masonry Arch
Bridges
2009 Asia-Pacific Spatial Excellence Awards Winner – 3D Laser Scanning for Masonry Arch
Bridges
CONTACTS
Mr. Thomas Werner
Survey21 Pty Ltd
538 Riversdale Rd (PO Box 360)
Camberwell 3124
AUSTRALIA
Tel. +61 3 9882 2268
Fax + 61 3 9882 9109
Email: [email protected]
Web site: www.survey21.com.au
Dr. David Morris
Arup Pty Ltd
Level 17, 1 Nicholson Street
Melbourne
3000
AUSTRALIA
Tel. +61 3 9663 8509
Fax + 61 3 9663 1546
Email: [email protected]
Web site: www.arup.com