Dinosaur decorations, Dinosaur decoration, Dinosaur decorating

3D ICHNOLOGY—RECOVERING DIGITAL 3D MODELS OFDINOSAUR FOOTPRINTS
Fabio Remondino ([email protected])
Alessandro Rizzi ([email protected])
Stefano Girardi ([email protected])
Bruno Kessler Foundation (FBK), Trento, Italy
Fabio Massimo Petti ([email protected])
Marco Avanzini ([email protected])
Museo Tridentino di Scienze Naturali (MTSN), Trento, Italy
(Extended version of a paper presented at the RSPSoc Annual Conference held at theUniversity of Leicester, 8th to 11th September 2009)
Abstract
Ichnology deals with the traces of prehistoric organisms and thus with the studyof dinosaur footprints and tracks. This paper reports on a reliable and precisemethodology developed to integrate high-resolution close range photogrammetry andrange sensors for 3D surveys of dinosaur footprints. The 3D footprint and trackmodels recovered here yield a great deal of accurate morphological and morpho-metrical information, providing palaeoichnologists with a simpler and cheaper wayto document track fossils and the opportunity to formulate new hypotheses about thedynamics of dinosaur locomotion.
Keywords: 3D modelling, close range photogrammetry, dinosaur footprints, imagematching
The only record of the history of our planet lies in the rocks beneath our feet: rocksand the landscape are the memory of the earth. […] The record preserved in therocks and landscape is unique, and much of it is surprisingly fragile. Today it isthreatened more than ever. What is lost can never be recovered, and therefore there isan urgent need to understand and protect what remains of this our common heritage.(The European Association for the Conservation of the Geological Heritage(ProGEO, 2010))
Introduction
Palaeontology is the study of fossil flora and fauna, including their evolution andinteractions with each other and their environments through geological time. Ichnology (fromthe Greek ichnos, trace, track) is the study of organism–substrate interactions of both
The Photogrammetric Record 25(131): 266–282 (September 2010)
� 2010 The Authors. The Photogrammetric Record � 2010 The Remote Sensing and Photogrammetry Society and Blackwell Publishing Ltd.
Blackwell Publishing Ltd. 9600 Garsington Road, Oxford OX4 2DQ, UK and 350 Main Street Malden, MA 02148, USA.

invertebrate and vertebrate organisms. Palaeoichnology is thus a sub-discipline of palaeon-tology that deals with fossil traces (invertebrates) and tracks (vertebrates), while neoichnologyrelates to presently living organisms. Studies and documentation of traces, tracks and fossilsare very important for scientific, conservation and preservation issues. However, suchspecimens often challenge the investigator owing to their sometimes remote locations, todamage by erosion and to their usually very shallow relief (Fig. 1). The emphasis onconservation is also underlined in the policies of international organisations and networks suchas UNESCO, the European Association for the Conservation of the Geological Heritage(ProGEO, 2010), the European Geoparks Network (GeoPark, 2010) or joint initiatives such asthe GEOSEE (an IUGS/IGU/UNESCO joint initiative), to bring together all efforts to protectgeological heritage, to contribute to sustainable economic development, to enhance geoscience,education and public awareness of geosciences and to foster geo-tourism.
Traditionally, surveys and studies of traces and tracks have been made with handdrawings, photographs under grazing light conditions or rubber casts realised on site. Allthese approaches are quite subjective, time-consuming and problematic. The use of alternativenew surveying methods can improve the performance of the documentation as well as thequality and detail of the results. Nowadays, digital 3D technologies can be applied in manyearth science and other research fields. In particular, close range photogrammetry andterrestrial range sensors are suitable for the documentation and modelling of terrestrial scenesincluding such traces, employing easy-to-use instruments and very reliable 3D modellingprocedures.
The work reported here (partially presented at the Annual Conference of the RemoteSensing and Photogrammetric Society in Leicester (Remondino et al., 2009b)) originates fromsome recently discovered dinosaur track sites in the Trentino – Alto Adige region of Italy,under a joint research project between the Bruno Kessler Foundation (FBK) and the MuseoTridentino di Scienze Naturali (MTSN), both based in Trento (Italy). One of the primary goalsof the interdisciplinary project is to deliver a reliable and powerful surveying methodology toproduce digital 3D models of dinosaur track sites. Nowadays, 3D models are mainly generatedby means of non-contact systems using optical active sensors (laser scanners) or passivesensors (digital cameras), or a combination of these (Fig. 5). This project has developed aflexible methodology based on terrestrial photogrammetry and laser scanning which combinesthe intrinsic advantages of each technique. The 3D models thus generated are generallydelivered both as contour images and as colour-coded images. This allows ichnologists (i) todistinguish small-scale anatomical details such as the number and arrangement of digits, padimpressions and claw marks and (ii) to accurately measure different parameters of tracks, suchas foot length, foot width, interdigital angles and foot depth. This latter parameter, hard tomeasure in the field especially on shallow tracks, enables the reconstruction of the weightdistribution on the different parts of the foot and thus is an important key to understandingdinosaur walking dynamics.
Related Work
Dinosaur footprints are generally shallow; they may be organised in continuous tracks;and they tend to be found in mountainous areas which are not easily accessible. 3Ddocumentation is generally done using long-range active sensors (Bates et al., 2006; 2008a) orshort-range scanners (Adams et al., 2009; Wilson et al., 2009). Photogrammetric surveys toanalyse and interpret dinosaur tracks were presented by Matthews and Breithaupt (2001) andSchader et al. (2006), while integrated approaches (images, range data, anaglyph stereoscopicimaging, GPS and GIS) were reported by Breithaupt et al. (2004); Matthews et al. (2006);
The Photogrammetric Record
� 2010 The Authors
The Photogrammetric Record � 2010 The Remote Sensing and Photogrammetry Society and Blackwell Publishing Ltd 267

Bates et al. (2008b); Petti et al. (2008); and Milner et al. (2009). Often the termphotogrammetry is misused, simply meaning the texturing of range data with high-resolutionimages.
Needs and Requirements in Ichnology
During recent decades the role of palaeoichnology has changed considerably thanks to itsclose links with both palaeobiology and sedimentology and its consequent important bearingon palaeoenvironmental and palaeogeographical reconstructions.
The first aim of dinosaur track analysis is the classification of specimens as soon as theyare discovered (ichnotaxonomical assignment). Naming dinosaur tracks and trackways is adifficult task, because of the problem of subjectivity of the traditional approach. Indeed,palaeoichnologists hitherto have mainly used the method of tracing track outlines, suppliedwith photographs. But 2D drawings and photographs can generate problems in defining theactual morphology of the footprints, because their accuracy depends in part on the directionand intensity of incident light. For this reason the basic recommendation in vertebratepalaeoichnology is to reproduce or photograph tracks under grazing light conditions, which arenot always achievable. Furthermore, the footprint drawings are often oversimplified, therebycausing the loss of information and making difficult any comparison with the type material ofthe ichnotaxa. Therefore, rubber casts are produced on site to allow thorough studies of thetracks in the laboratory under artificial light conditions. However, making a physical replica ofa whole track site is technically and economically impossible.
The ultimate goal of palaeoichnology is the identification of the trackmaker, the animalthat produced the trace, at least at a high taxonomic rank, in order to assist in palaeoecologicaland palaeogeographical reconstructions. But dinosaur bones are rarely preserved in association
Fig. 1. Fossil tracks such as dinosaur footprints are studied and surveyed using the modern technologies ofphotogrammetry and laser scanning. The typical dimensions of the tracks analysed are 20 cm · 30 cm with an
average depth of 2 to 3 cm.
Remondino et al. 3D Ichnology—recovering digital 3D models of dinosaur footprints
� 2010 The Authors
268 The Photogrammetric Record � 2010 The Remote Sensing and Photogrammetry Society and Blackwell Publishing Ltd

with tracks. Moreover, dinosaur tracks and trackways are the only available evidence of the lifeof these extinct animals. They are like photographs of dinosaur life which could provideimportant information about their favoured environments, their behaviour (solitary or herdingindividuals), locomotion (posture, limb kinematics) and even their soft tissues (skinimpressions). Furthermore, some anatomical details, such as the number and relative positionof digits, digital pad impressions and claw marks, if preserved, allow the derivation of thenumber and arrangement of phalanges (phalangeal formula). This information is essential inestablishing the identity of the maker of a track. The subjectivity of either traditional drawingsor photographs and the two-dimensional nature of the analyses militate against successfulattainment of these goals. Thus the ability to produce 3D models of dinosaur footprints with thehelp of digital surveying technologies gives ichnologists a most welcome opportunity toinvestigate tracks with three-dimensional images in the laboratory. As already indicated,nowadays the generation of 3D models is mainly achieved using non-contact systems based onlight waves, namely, optical active sensors (laser scanners) delivering range data (Blais, 2004),passive sensors (digital cameras) delivering image data (Remondino and El-Hakim, 2006) orby integrating multiple geomatics sensors (El-Hakim et al., 2004; Ronnholm et al., 2007;Stamos et al., 2008; Guidi et al., 2009; Remondino et al., 2009a).
This paper reports the application of these technologies to the 3D modelling of dinosaurtracks and trackways, thus enabling ichnologists to distinguish small-scale anatomical detailsand to accurately measure various different parameters of such tracks and hence of thetrackmakers.
Methodology for 3D Surveys of Dinosaur Footprints
For comprehensive 3D surveys and digital archiving of the recently discovered dinosaurtrack sites, all available current surveying techniques and methodologies were considered(Table I). On the technology side, a great array of sensors are available: low-, medium- andhigh-resolution satellite images; large- and medium-format digital aerial cameras with linear orarray sensors; hyperspectral cameras with several hundred channels; space- and airborneinterferometric radar platforms; aerial and terrestrial optical range sensors (time-of-flight (TOF)and triangulation-based laser scanners (lidar) as well as stripe projection systems); unpilotedaerial vehicles (UAVs) with SLR or compact digital cameras; linear array panoramic camerasand a large number of diverse consumer-grade still video cameras. All these sensors andplatforms may be coupled with GPS and/or INS systems for precise navigation andpositioning.
Considering the nature and locations of the newly discovered tracks, it was decided thatthe project would initially work at local and object scale. These track sites are in mountainousareas with very difficult access (Fig. 2). The trackways are a few hundred metres long, with
Table I. Scales for ichnological documentation with surveyed objects, related technologies and data.
Ichnologydocumentation
Recorded objects Available data and sources
Regional scale Landscape, topography, sites Medium- and high-resolution satellite imagery,small-scale aerial images, radar and lidar, GPS
Local scale Sites, trackways Large-scale aerial images, lidar, terrestrial opticalrange data (TOF sensors), GPS
Object scale Traces, tracks, footprints, smallpalaeontological remains
High-resolution terrestrial images, terrestrial opticalrange sensors (triangulation-based), GPS
The Photogrammetric Record
� 2010 The Authors
The Photogrammetric Record � 2010 The Remote Sensing and Photogrammetry Society and Blackwell Publishing Ltd 269
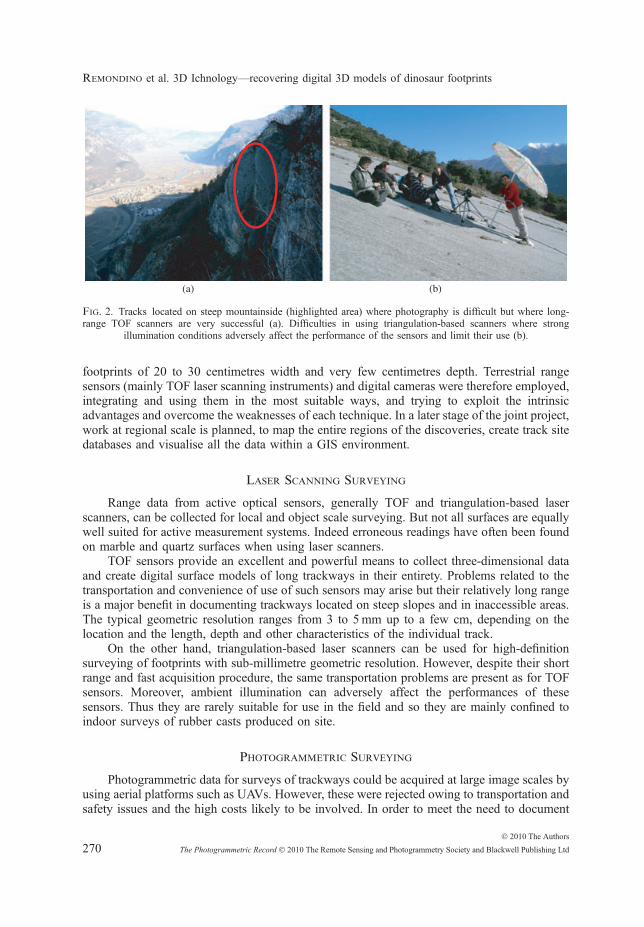
footprints of 20 to 30 centimetres width and very few centimetres depth. Terrestrial rangesensors (mainly TOF laser scanning instruments) and digital cameras were therefore employed,integrating and using them in the most suitable ways, and trying to exploit the intrinsicadvantages and overcome the weaknesses of each technique. In a later stage of the joint project,work at regional scale is planned, to map the entire regions of the discoveries, create track sitedatabases and visualise all the data within a GIS environment.
Laser Scanning Surveying
Range data from active optical sensors, generally TOF and triangulation-based laserscanners, can be collected for local and object scale surveying. But not all surfaces are equallywell suited for active measurement systems. Indeed erroneous readings have often been foundon marble and quartz surfaces when using laser scanners.
TOF sensors provide an excellent and powerful means to collect three-dimensional dataand create digital surface models of long trackways in their entirety. Problems related to thetransportation and convenience of use of such sensors may arise but their relatively long rangeis a major benefit in documenting trackways located on steep slopes and in inaccessible areas.The typical geometric resolution ranges from 3 to 5mm up to a few cm, depending on thelocation and the length, depth and other characteristics of the individual track.
On the other hand, triangulation-based laser scanners can be used for high-definitionsurveying of footprints with sub-millimetre geometric resolution. However, despite their shortrange and fast acquisition procedure, the same transportation problems are present as for TOFsensors. Moreover, ambient illumination can adversely affect the performances of thesesensors. Thus they are rarely suitable for use in the field and so they are mainly confined toindoor surveys of rubber casts produced on site.
Photogrammetric Surveying
Photogrammetric data for surveys of trackways could be acquired at large image scales byusing aerial platforms such as UAVs. However, these were rejected owing to transportation andsafety issues and the high costs likely to be involved. In order to meet the need to document
(a) (b)
Fig. 2. Tracks located on steep mountainside (highlighted area) where photography is difficult but where long-range TOF scanners are very successful (a). Difficulties in using triangulation-based scanners where strong
illumination conditions adversely affect the performance of the sensors and limit their use (b).
Remondino et al. 3D Ichnology—recovering digital 3D models of dinosaur footprints
� 2010 The Authors
270 The Photogrammetric Record � 2010 The Remote Sensing and Photogrammetry Society and Blackwell Publishing Ltd

objects at centimetre or millimetre scale, photogrammetry from high-resolution terrestrialimages was selected, to derive highly detailed 3D geometric models of individual footprints.High tripods were also considered for the acquisition of the image data but the locations of thetracks to be studied, often on steeply inclined surfaces (Fig. 2(b)), suggested the use ofclassical terrestrial configurations.
The chosen SLR cameras were calibrated in the laboratory with a self-calibrating bundleadjustment procedure (Australis software), employing coded targets and always achieving afinal r0 better than 1/10 of a pixel. The lab calibration is considered to yield better networkgeometry than could be achieved on site, where a typical image network consists of fewerimages with a less reliable configuration leading to a less accurate calibration.
For the dinosaur footprint survey, multiple convergent images were acquired, alsoimaging reference targets to integrate the photogrammetric data into the range-based data. Acalibrated scale bar (approximately 1m long with a precision of about 0Æ05mm) was used toderive correct metric results and enable comparison with the range-based measurements. Aftera photogrammetric block adjustment, using the recovered camera poses and sparse geometry asa guide, an automated surface measurement methodology was applied to extract the finegeometric details and achieve accurate point cloud reconstructions of the footprints. Thesurface measurement and DSM generation were achieved with the multi-image matchingprocess originally reported by Zhang and Gruen (2004) and Zhang (2005), adapted andextended to terrestrial convergent images (Remondino et al., 2008). This software, known asCLORAMA (from ‘‘close range matching’’), is now marketed by the ETH spin-off company4DiXplorer AG (2009). This multi-image approach uses a coarse-to-fine hierarchical solutionon image pyramids combining different image primitives (interest points, grid points, edges)and matching algorithms (cross-correlation, least squares and relational matching) togetherwith an automatic quality control of the derived 3D coordinates. Within the pyramid levels, thepoint and edge matching processes are performed with an extension of the standard‘‘geometrically constrained cross-correlation’’ (GC3) technique.
At the original image resolution level only, a multi-photo geometrically constrained leastsquares matching and ‘‘least squares B-spline snakes’’ process (Li, 1997) can be used as anoption to achieve potentially sub-pixel precision matches and derive accurate and dense pointclouds. During the point matching strategy, the patches are automatically adapted from 7 · 7up to 21 · 21 pixels to find the best matching location. Using the multi-image concept (Fig. 3)and matching a point simultaneously in all the images in which it is visible, CLORAMA is ableto obtain highly redundant results, remove ambiguities with the multiple epipolar lineintersections and avoid occlusion problems. The output of the matching algorithm is a cloud ofpoints representing the measured surface. The cloud is then regularised with an interpolationprocedure and a sample distance 2 to 3 times the average object pixel resolution of the imagesemployed.
Results and Discussions
The modelled dinosaur track sites are found in different outcrops, all located in theTrentino – Alto Adige region (Italy): Lavini di Marco (Lower Jurassic; Avanzini et al., 2006),San Gottardo Castle (Upper Triassic; D’Orazi Porchetti et al., 2008), Monte Finonchio (LowerJurassic; Avanzini et al., 2008) and Coste dell’Anglone (Lower Jurassic; Petti et al., 2008).Artificial replicas, on-site footprints and entire trackways were considered.
The documentation generally involved integrating georeferenced data, at differentgeometric resolutions, acquired with a Leica ScanStation 2 (TOF scanner) and two digital SLRcameras, previously calibrated in the lab: (i) Kodak DSC Pro SLR/n with 13Æ5megapixel (4500
The Photogrammetric Record
� 2010 The Authors
The Photogrammetric Record � 2010 The Remote Sensing and Photogrammetry Society and Blackwell Publishing Ltd 271

· 3000 pixels) CCD sensor (36mm · 24mm); and (ii) Nikon D3X with 24Æ5megapixel (6048· 4032 pixels) CMOS sensor (35Æ9mm · 24mm), both equipped with a 50mm Nikkor lens.
The TOF instrument is used for the surveying of long trackways containing up tohundreds of footprints or traces which are not easily accessible (as in Fig. 2(a)). High-resolution photogrammetry is instead applied (i) for the surface modelling of single traces ofparticular interest identified and selected by the ichnologists within a trackway; or (ii) for thedigitisation of rubber replicas already produced on site on previous expeditions. Generally, foreach footprint, a set of convergent images, acquired at different distances (to compensate forthe flat scene), is processed. For the surface reconstruction, a subset of at least three convergentimages is processed, to achieve a higher reliability of the 3D results and avoid occlusionsresulting from the discontinuities and complex shapes of the impressions. Stereopairs acquiredwith parallel camera axes, although the standard input for commercial photogrammetricmatching software, are not sufficient to derive the complete and small details of the footprints.The correct scale is achieved using a calibrated distance within the scenes. The typical imagescale is 1:10 to 1:50 in order to derive surface models with sub-millimetre geometric resolution(object pixel resolution around 0Æ1 to 0Æ2mm).
Fig. 3. Examples of simultaneous multi-image template matching with the least squares method. Given a templatepatch (left-hand window), the search patches are iteratively resampled until the convergence of the affine parametersis reached (lower images). Once the image location is computed with sub-pixel precision, the object coordinates are
directly calculated using the geometrical constraints.
Remondino et al. 3D Ichnology—recovering digital 3D models of dinosaur footprints
� 2010 The Authors
272 The Photogrammetric Record � 2010 The Remote Sensing and Photogrammetry Society and Blackwell Publishing Ltd

Fig. 5 shows the results of the survey of the entire trackway reported in Fig. 4. Thetrackway is on a monoclinal surface dipping about 30� SE. A low-resolution geometric survey(5mm) performed with the TOF sensor is integrated with the photogrammetric high-resolutionmodels (0Æ3mm geometric resolution). The surface models are registered to the laser scannerpoint cloud bymeans of an iterative closest point (ICP) algorithm using targets (see Fig. 1, right),in order to provide the ichnologists with a unique multi-resolution 3D model of the trackway.
Track cross sections and ichnological interpretations can also be derived from therecorded and processed digital data (Fig. 6). For this tridactyl footprint (CA2-17), the footlength (FL) and width (FW) measured in the field were 24Æ61 and 17Æ31 cm, respectively; theinterdigital angles were 14� between digits II and III, 24� between digits III and IV; the totaldivarication is 38�. The same measures taken on the 3D digital model reveal reasonableagreement, given the faintness of the traces themselves: FL 24Æ53 cm, FW 16Æ30 cm,interdigital angle II–III 8Æ5�, interdigital angle III–IV 23Æ6� and a total divarication of 32Æ1�.Although some subjectivity is still present in the measurements, this comparison between the
Fig. 4. A trackway in the Coste dell’Anglone site (approximately 30 footprints) (left) and closer views of threenumbered tracks in the section of trackway designated as CA2 (right).
The Photogrammetric Record
� 2010 The Authors
The Photogrammetric Record � 2010 The Remote Sensing and Photogrammetry Society and Blackwell Publishing Ltd 273

(a)
1 m
(b) (c)
5 cm
Fig. 5. The entire 12m long trackway (a) of the Coste dell’Anglone site (Lower Jurassic) was surveyed with aTOF scanner at low resolution (detail of section CA2 shown in (b)). The three individual footprints of CA2 weremodelled in high resolution with photogrammetric image matching and are shown in colour-coded mode (c).
Remondino et al. 3D Ichnology—recovering digital 3D models of dinosaur footprints
� 2010 The Authors
274 The Photogrammetric Record � 2010 The Remote Sensing and Photogrammetry Society and Blackwell Publishing Ltd
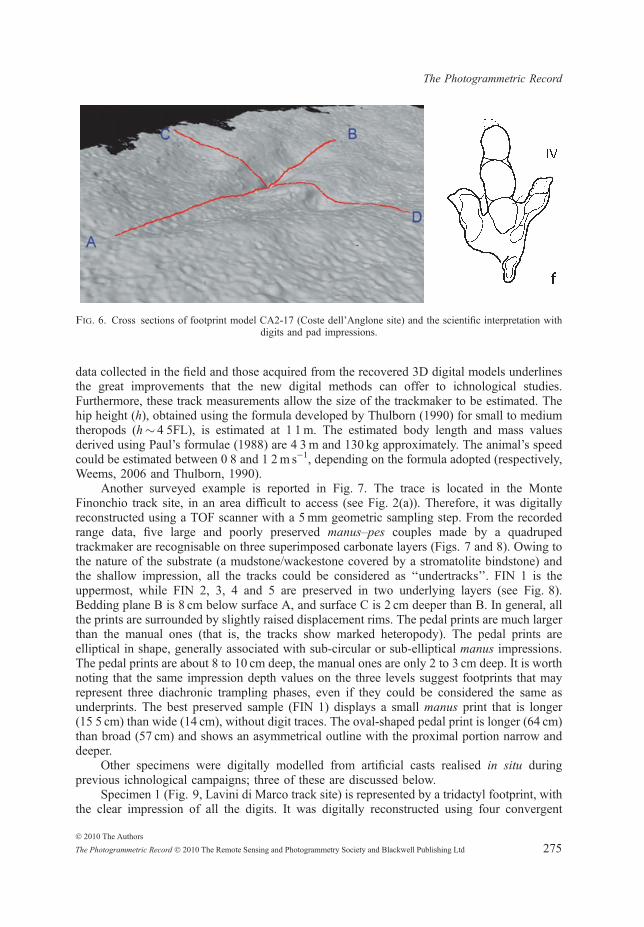
data collected in the field and those acquired from the recovered 3D digital models underlinesthe great improvements that the new digital methods can offer to ichnological studies.Furthermore, these track measurements allow the size of the trackmaker to be estimated. Thehip height (h), obtained using the formula developed by Thulborn (1990) for small to mediumtheropods (h� 4Æ5FL), is estimated at 1Æ1m. The estimated body length and mass valuesderived using Paul’s formulae (1988) are 4Æ3m and 130 kg approximately. The animal’s speedcould be estimated between 0Æ8 and 1Æ2m s)1, depending on the formula adopted (respectively,Weems, 2006 and Thulborn, 1990).
Another surveyed example is reported in Fig. 7. The trace is located in the MonteFinonchio track site, in an area difficult to access (see Fig. 2(a)). Therefore, it was digitallyreconstructed using a TOF scanner with a 5mm geometric sampling step. From the recordedrange data, five large and poorly preserved manus–pes couples made by a quadrupedtrackmaker are recognisable on three superimposed carbonate layers (Figs. 7 and 8). Owing tothe nature of the substrate (a mudstone/wackestone covered by a stromatolite bindstone) andthe shallow impression, all the tracks could be considered as ‘‘undertracks’’. FIN 1 is theuppermost, while FIN 2, 3, 4 and 5 are preserved in two underlying layers (see Fig. 8).Bedding plane B is 8 cm below surface A, and surface C is 2 cm deeper than B. In general, allthe prints are surrounded by slightly raised displacement rims. The pedal prints are much largerthan the manual ones (that is, the tracks show marked heteropody). The pedal prints areelliptical in shape, generally associated with sub-circular or sub-elliptical manus impressions.The pedal prints are about 8 to 10 cm deep, the manual ones are only 2 to 3 cm deep. It is worthnoting that the same impression depth values on the three levels suggest footprints that mayrepresent three diachronic trampling phases, even if they could be considered the same asunderprints. The best preserved sample (FIN 1) displays a small manus print that is longer(15Æ5 cm) than wide (14 cm), without digit traces. The oval-shaped pedal print is longer (64 cm)than broad (57 cm) and shows an asymmetrical outline with the proximal portion narrow anddeeper.
Other specimens were digitally modelled from artificial casts realised in situ duringprevious ichnological campaigns; three of these are discussed below.
Specimen 1 (Fig. 9, Lavini di Marco track site) is represented by a tridactyl footprint, withthe clear impression of all the digits. It was digitally reconstructed using four convergent
Fig. 6. Cross sections of footprint model CA2-17 (Coste dell’Anglone site) and the scientific interpretation withdigits and pad impressions.
The Photogrammetric Record
� 2010 The Authors
The Photogrammetric Record � 2010 The Remote Sensing and Photogrammetry Society and Blackwell Publishing Ltd 275

images (Nikon D3X, object pixel resolution 0Æ1mm) to derive a regular point cloud of 760 000points with 0Æ3mm sampling step. The results were post-processed to derive a surface model(mesh) and contours useful for the ichnological interpretation. Two clear sub-circular digitalpad impressions and an inward directed claw mark are evident on digit II. On digit III only themetatarsal–phalangeal pad are well preserved; this digit narrows in its central part, probably asa consequence of the mud flow, while in its distal portion another sub-circular pad and a clawmark occur. The proximal portion of digit IV lies slightly behind with respect to the digit II thatpreserves two clear sub-circular pads, divided by an internal ridge; it tips distally with roundedclaw marks and is outward rotated. The material could be assigned to Kayentapus isp. andattributed to a medium-sized theropod trackmaker. (In palaeontology, isp. is an abbreviation for‘‘ichnospecies’’. It is often used when the ichnogenus is known, but the species is not. Forexample, Kayentapus isp. means a Kayentapus fossil track of an undetermined ichnospecies. Itis not known whether it is Kayentapus minor, Kayentapus soltykovensis, Kayentapus hopii or anew Kayentapus ichnospecies.)
Specimen 2 (Fig. 10, San Gottardo Castle track site) is a tridactyl track, modelled usingsix images. The footprint has the posterior end of digit IV pulled back in comparison to digit II.Consequently the posterior margin of the track is asymmetrical. Digit III is dominant withrespect to digits II and IV and its middle and distal portions are the deepest. Two clear digitalpad impressions, evidenced by a notch in the inner side of the digit, and a drop-like claw mark
(a) (b)
Fig. 7. Monte Finonchio site: the small trackway digitally modelled with a TOF scanner (a) and the contourssuperimposed onto the shaded model (b).
Remondino et al. 3D Ichnology—recovering digital 3D models of dinosaur footprints
� 2010 The Authors
276 The Photogrammetric Record � 2010 The Remote Sensing and Photogrammetry Society and Blackwell Publishing Ltd

occur on digit II. Three pads and pointed claw marks are evident on digit III. On digit IV onlytwo pads and a faint claw trace are preserved. This set of diagnostic characteristics suggests anassignment to Grallator isp. and an attribution to a small theropod trackmaker.
C
B
A
Fig. 8. Monte Finonchio: 3D contour map model and interpretative drawing of the trampled surface. A, B, Cindicate the three superimposed layers.
The Photogrammetric Record
� 2010 The Authors
The Photogrammetric Record � 2010 The Remote Sensing and Photogrammetry Society and Blackwell Publishing Ltd 277

Specimen 3 (Fig. 11, Coste dell’Anglone track site) is represented by a tridactyl footprint,V-shaped in its proximal portion where it is difficult to distinguish lateral digits. However, twosub-elliptical pads and a small rounded claw mark are recognisable on digit II. Digit IIInarrows in its medial part and its proximal margin is impressed the deepest. Digit IV tipsdistally, is outward rotated and preserves at least three digital pad impressions. The specimencould be assigned to cf. Kayentapus and attributed to a medium-sized theropod trackmaker. (Inpalaeontology the common abbreviation cf. (for confer = compare) again has a precisetaxonomic connotation as above.)
Analysis of the Performance of the Photogrammetric Survey
The 3D models of the rubber casts were used to verify the performance and accuracypotential of the photogrammetric surface measurement method used here. Geometriccomparisons were performed between the image-based models and the range data acquiredwith a triangulation-based laser scanner (ShapeGrabber SG102 scan head, c.100 lm featureaccuracy (ShapeGrabber, 2003)).
The surface models were aligned and the shortest separations between the two modelswere computed to assess the metric discrepancies. Table II reports the results of the geometric
Fig. 9. Specimen 1. A tridactyl footprint cast (c.27 cm · 23 cm, Lavini di Marco site, Lower Jurassic) digitallyreconstructed using four convergent images to derive a dense surface model of approximately 760 000 points,shown here in colour-coded mode. The maximum depth of the impression, derived from the contours and profiles, is
approximately 3 cm.
Fig. 10. Specimen 2: a tridactyl footprint cast (c.25 cm · 18 cm, San Gottardo Castle site, Upper Triassic)modelled using six convergent images. The derived dense point cloud (shown in colour-coded mode) contains
approximately 450 000 points. The greatest depth of the footprint is approximately 1Æ9 cm.
Remondino et al. 3D Ichnology—recovering digital 3D models of dinosaur footprints
� 2010 The Authors
278 The Photogrammetric Record � 2010 The Remote Sensing and Photogrammetry Society and Blackwell Publishing Ltd
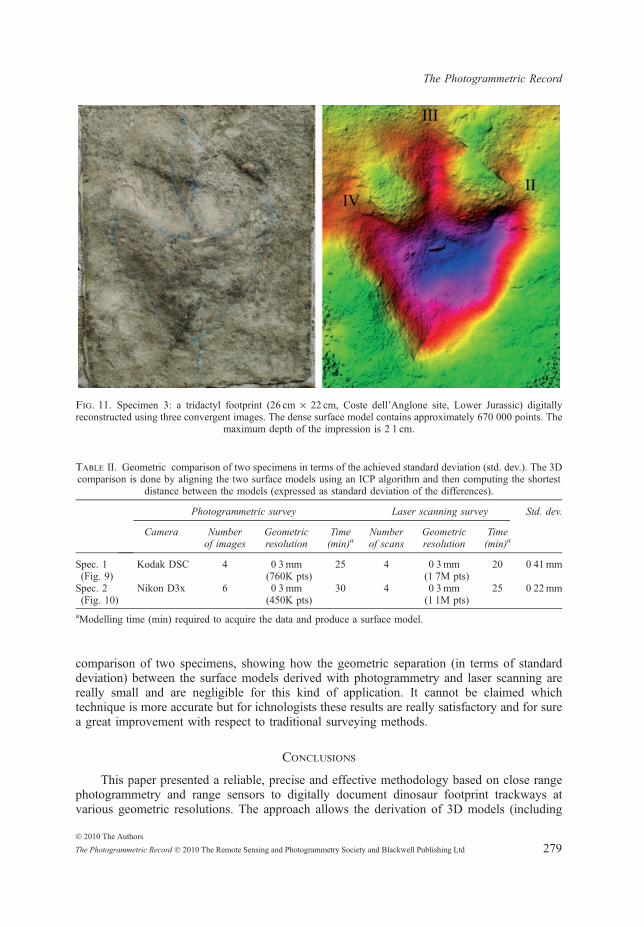
comparison of two specimens, showing how the geometric separation (in terms of standarddeviation) between the surface models derived with photogrammetry and laser scanning arereally small and are negligible for this kind of application. It cannot be claimed whichtechnique is more accurate but for ichnologists these results are really satisfactory and for surea great improvement with respect to traditional surveying methods.
Conclusions
This paper presented a reliable, precise and effective methodology based on close rangephotogrammetry and range sensors to digitally document dinosaur footprint trackways atvarious geometric resolutions. The approach allows the derivation of 3D models (including
Fig. 11. Specimen 3: a tridactyl footprint (26 cm · 22 cm, Coste dell’Anglone site, Lower Jurassic) digitallyreconstructed using three convergent images. The dense surface model contains approximately 670 000 points. The
maximum depth of the impression is 2Æ1 cm.
Table II. Geometric comparison of two specimens in terms of the achieved standard deviation (std. dev.). The 3Dcomparison is done by aligning the two surface models using an ICP algorithm and then computing the shortest
distance between the models (expressed as standard deviation of the differences).
Photogrammetric survey Laser scanning survey Std. dev.
Camera Numberof images
Geometricresolution
Time(min)a
Numberof scans
Geometricresolution
Time(min)a
Spec. 1(Fig. 9)
Kodak DSC 4 0Æ3mm(760K pts)
25 4 0Æ3mm(1Æ7M pts)
20 0Æ41mm
Spec. 2(Fig. 10)
Nikon D3x 6 0Æ3mm(450K pts)
30 4 0Æ3mm(1Æ1M pts)
25 0Æ22mm
aModelling time (min) required to acquire the data and produce a surface model.
The Photogrammetric Record
� 2010 The Authors
The Photogrammetric Record � 2010 The Remote Sensing and Photogrammetry Society and Blackwell Publishing Ltd 279

colour-coded images, contours and profiles) which can be thoroughly analysed from anyperspective both for morphological and morphometrical analyses, even on very shallow tracks(even at millimetre scale). Compared to other approaches, the methodology presented uses andcombines active and passive sensors, each one where most suited in order to achieve, wherepossible, multi-resolution 3D trackways and footprints. The 3D digital models are objectiveand consequently more informative and accurate in comparison with the manual drawings orartificial casts obtained with the traditional methods. The ichnologists can therefore performmore accurate ichnotaxonomical assignment and more confident attribution to potentialtrackmakers. Furthermore, the derived 3D models allow reconstruction of the weightdistribution on the foot in order to understand the walking dynamics of dinosaurs; generationof physical replicas starting from accurate digital data; advances on previous techniques in theattempt to attribute tracks to a trackmaker; preservation of virtual tracks (thereby overcomingthe effects of future weathering); creation of website and museum exhibitions; sharing ofdigital data among researchers, thus allowing experiments to be repeated; comparisons withoutthe need to observe specimens or type materials directly either in situ or through replicas; anddevelopment of a virtual 3D database of the type specimens or virtual track sites.
The TOF laser scanning technique allows the analysis of very large outcrops or thosecharacterised by exposures that do not permit on-site analysis and measurement (such as near-vertical cliffs). On the other hand, photogrammetry and image matching allow the derivation ofvery dense and detailed surface models with very cheap sensors and fast processing methods.Evaluating the cost/time ratio, it is evident that laser scanners, although fast and easy to use onsite, are still costly, bulky and time-consuming overall while digital photogrammetry generallysaves both time and costs. Nevertheless the two techniques are really complementary forichnological 3D surveying, and their integration has led to very satisfactory results.Furthermore, the performance evaluation reported here shows the very small and negligiblediscrepancies between the derived image- and range-based surface models.
The comparison between the traditional data-sets collected directly in situ and thosederived from the digital 3D models highlights the enormous improvements that a digital surveycan offer. The most interesting aspect is the opportunity to achieve a larger volume ofmorphological and numerical data, some of which is difficult to capture on site. Nevertheless,even if the use of three-dimensional digital modelling in dinosaur track analysis represents anexciting and important advance, future studies should not neglect data obtained usingtraditional methods.
references
4DiXplorer, AG, 2009. http://www.4dixplorer.com [Accessed: 15th March 2010].Adams, T. L., Strganac, C., Polcyn, M. J. and Jacobs, L. L., 2009. Three-dimensional laser-scanning:
implications for digital archiving and preservation of the type specimen of Eubrontes (?) glenrosensis Shuler,1935 from the Lower Cretaceous of Texas. Paper presented at the 2009 Annual Meeting of the GeologicalSociety of America, Paper No. 217-14.
Avanzini, M., Piubelli, D., Mietto, P., Romano, R., Roghi, G. and Masetti, D., 2006. Lower Jurassic(Hettangian–Sinemurian) dinosaur megatrack site, southern Alps, Northern Italy. The Triassic–JurassicTerrestrial Transition. (Eds. J. D. Harris, S. G. Lucas, J. A. Spielmann,M. G. Lockley, A. R. C. Milner &J. I. Kirkland). New Mexico Museum of Natural History and Science Bulletin, 37: 207–216.
Avanzini, M., Franceschi, M., Petti, F. M., Girardi, S., Ferretti, P. and Tomasoni, R., 2008. New EarlyJurassic (Hettangian–Sinemurian) sauropodomorph tracks from the Trento carbonate Platform (Southern Alps,Northern Italy). Studi Trentini di Scienze Naturali, Acta Geologica, 83: 317–322.
Bates, K. T., Manning, P. L. and Hodgetts, D., 2006. 3D models of dinosaur tracks using light detection andrange (LIDAR) imaging. Poster presentation at the 50th Palaeontological Association meeting, Sheffield, UK.
Bates, K. T., Manning, P. L., Hodgetts, D. and Villa, B., 2008a. Three-dimensional modelling of dinosaurtracks. Palaeontology, 51(4): 999–1010.
Remondino et al. 3D Ichnology—recovering digital 3D models of dinosaur footprints
� 2010 The Authors
280 The Photogrammetric Record � 2010 The Remote Sensing and Photogrammetry Society and Blackwell Publishing Ltd

Bates, K. T., Rarity, F., Manning, P. L., Hodgetts, D., Vila, B., Oms, O., Galobart, A`
. and Gawthorpe,R. L., 2008b. High-resolution LIDAR and photogrammetric survey of the Fumanya dinosaur tracksites(Catalonia): implications for the conservation and interpretation of geological heritage sites. Journal of theGeological Society, 165(1): 115–127.
Blais, F., 2004. Review of 20 years of range sensor development. Journal of Electronic Imaging, 13(1): 231–243.Breithaupt, B. H., Matthews, N. A. and Noble, T. A., 2004. An integrated approach to three-dimensional data
collection at dinosaur tracksites in the Rocky Mountain West. Ichnos, 11(1–2): 11–26.D’Orazi Porchetti, S., Nicosia, U., Mietto, P., Petti, F. M. and Avanzini, M., 2008. Atreipus-like footprints
and their co-occurrence with Evazoum from the upper Carnian (Tuvalian) of Trentino – Alto Adige. StudiTrentini di Scienze Naturali, Acta Geologica, 83: 277–287.
El-Hakim, S. F., Beraldin, A.-J., Picard, M. and Godin, G., 2004. Detailed 3D reconstruction of large-scaleheritage sites with integrated techniques. IEEE Computer Graphics and Applications, 24(3): 21–29.
GeoPark, 2010. European Geoparks Network. http://www.europeangeoparks.org/ [Accessed: 15th March 2010].Guidi, G., Remondino, F., Russo, M., Menna, F., Rizzi, A. and Ercoli, S., 2009. A multi-resolution
methodology for the 3D modeling of large and complex archeological areas. International Journal ofArchitectural Computing, 7(1): 39–55.
Li, H., 1997. Semi-automatic road extraction from satellite and aerial images. Ph.D. thesis, Institute of Geodesyand Photogrammetry, ETH Zurich, Switzerland. 161 pages.
Matthews, N. A. and Breithaupt, B. H., 2001. Close-range photogrammetric experiments at Dinosaur Ridge.The Mountain Geologist, 38(3): 147–153.
Matthews, N. A., Noble, T. and Breithaupt, B. H., 2006. The application of photogrammetry, remote sensingand geographic information systems (GIS) to fossil resource management. Fossils from Federal Lands (Eds.S. G. Lucas, J. A. Spielmann, P. M. Hester, J. P. Kenworthy & V. L. Santucci). New Mexico Museum ofNatural History and Science Bulletin, 34: 119–131.
Milner, A. R. C., Harris, J. D., Lockley, M. G., Kirkland, J. I. and Matthews, N. A., 2009. Bird-likeanatomy, posture, and behavior revealed by an Early Jurassic theropod dinosaur resting trace. PLoS ONE, 4(3):e4591.
Paul, G. S., 1988. Predatory Dinosaurs of the World: A Complete Illustrated Guide. Simon and Schuster, NewYork. 464 pages.
Petti, F. M., Avanzini, M., Belvedere, M., De Gasperi, M., Ferretti, P., Girardi, S., Remondino, F. andTomasoni, R., 2008. Digital 3D modelling of dinosaur footprints by photogrammetry and laser scanningtechniques: integrated approach at the Coste dell’Anglone track site (Lower Jurassic, Southern Alps, NorthernItaly). Studi Trentini di Scienze Naturali, Acta Geologica, 83: 303–315.
ProGEO, 2010. European Association for the Conservation of the Geological Heritage. http://www.sgu.se/hotell/progeo/ [Accessed: 15th March 2010].
Remondino, F. and El-Hakim, S., 2006. Image-based 3D modelling: a review. Photogrammetric Record,21(115): 269–291.
Remondino, F., El-Hakim, S. F., Gruen, A. and Zhang, L., 2008. Turning images into 3-Dmodels—development and performance analysis of image matching for detailed surface reconstruction ofheritage objects. IEEE Signal Processing Magazine, 25(4): 55–65.
Remondino, F., El-Hakim, S. F., Girardi, S., Rizzi, A., Benedetti, S. and Gonzo, L., 2009a. 3D virtualreconstruction and visualization of complex architectures—the ‘‘3D-ARCH’’ project. International Archives ofthe Photogrammetry, Remote Sensing and Spatial Information Sciences, 38(5/W1), 9 pages (on CD-ROM).
Remondino, F., Petti, F. M., Rizzi, A., Avanzini, M. and Girardi, S., 2009b. Photogrammetry for ich-nology—recovering detailed digital surface models of dinosaur footprints using advanced image matchingalgorithms. RSPSoc 2009 Annual Conference, Remote Sensing and Photogrammetry Society, Nottingham.776 pages: 190–196 (on DVD).
Ronnholm, P., Honkavaara, E., Litkey, P., Hyyppa, H. and Hyyppa, J., 2007. Integration of laser scanningand photogrammetry. International Archives of Photogrammetry, Remote Sensing and Spatial InformationSciences, 36(3/W52): 355–362.
Schader, R., Chapman, R., Petersen, C. and Clement, N., 2006. Archiving three-dimensional models ofspecimens with high resolution photographic images—texture-mapping the real on the virtual. Society ofVertebrate Paleontology Symposium, Ottawa. Abstracts: 121 A.
ShapeGrabber, 2003. http://www.shapegrabber.com/sol-products-3d-scan-heads-specs-metric.shtml [Accessed:1st June 2010].
Stamos, I., Liu, L., Chen, C., Wolberg, G., Yu, G. and Zokai, S., 2008. Integrating automated rangeregistration with multiview geometry for photorealistic modeling of large-scale scenes. International Journalof Computer Vision, 78(2–3): 237–260.
Thulborn, R. A., 1990. Dinosaur Tracks. Chapman and Hall, London. 410 pages.
The Photogrammetric Record
� 2010 The Authors
The Photogrammetric Record � 2010 The Remote Sensing and Photogrammetry Society and Blackwell Publishing Ltd 281

Weems, R. E., 2006. Locomotor speeds and patterns of running behavior in non-maniraptoriform theropoddinosaurs. The Triassic–Jurassic Terrestrial Transition (Eds. J. D. Harris, S. G. Lucas, J. A. Spielmann,M. G. Lockley, A. R. C. Milner & J. I. Kirkland). New Mexico Museum of Natural History and ScienceBulletin, 37: 379–389.
Wilson, J. A., Marsicano, C. A. and Smith, R. M. H., 2009. Dynamic locomotor capabilities revealed by earlydinosaur trackmakers from Southern Africa. PLoS ONE, 4(10): e7331.
Zhang, L., 2005. Automatic Digital Surface Model (DSM) generation from linear array images. Ph.D. thesis No.16078, Institute of Geodesy and Photogrammetry, ETH Zurich, Switzerland. 199 pages.
Zhang, L. and Gruen, A., 2004. Automatic DSM generation from linear array imagery data. InternationalArchives of Photogrammetry and Remote Sensing, 35(3): 128–133.
Resume
L’ichnologie etudie les traces d’organismes prehistoriques et en particulier lesempreintes de dinosaures. Cet article presente une methodologie fiable et precisedeveloppee pour integrer la photogrammetrie terrestre a haute resolution et latelemetrie pour les leves 3D d’empreintes de dinosaures. Les modeles 3D d’em-preintes et de traces ainsi reconstruits constituent d’importantes informationsmorphologiques et morphometriques, fournissant aux paleoichnologues un moyensimple et bon marche de decrire des traces fossiles et l’opportunite de formuler denouvelles hypotheses sur la dynamique de la locomotion des dinosaures.
Zusammenfassung
Die Ichnologie beschaftigt sich mit den Spuren prahistorischer Organismen unddabei auch mit Fußabdrucken und Spuren von Dinosauriern. Dieser Beitrag berichtetvon einer zuverlassigen und genauen Methode zur Integration von hochauflosenderNahbereichsphotogrammetrie und Entfernungssensoren zur 3D Vermessung vonFußabdrucken von Dinosauriern. Die erfassten dreidimensionalen Fußabdruckeund die Spurmodelle ergeben eine genaue morphologische und morphometrischeInformation, die von Palaoichnologen als einfachere und kostengunstigere Methodegenutzt werden kann, um fossile Spuren zu dokumentieren und neue Hypothesen zurDynamik der Fortbewegung von Dinosauriern zu erstellen.
Resumen
La icnologıa se ocupa de las senales dejadas por los organismos prehistoricos y,por lo tanto, del estudio de las huellas y rastros de dinosaurios. Este artıculodescribe una metodologıa fiable y precisa que se ha desarrollado para integrar lafotogrametrıa de objeto cercano de alta precision con sensores de distancia parael analisis tridimensional de huellas de dinosaurio. Los modelos tridimensionalesde huellas y rastros aportan una gran cantidad de informacion morfologica ymorfometrica, proporcionando a los paleoicnologos un modo mas simple y baratode documentar los rastros fosiles y la oportunidad de formular nuevas hipotesissobre la dinamica del movimiento de los dinosaurios.
Remondino et al. 3D Ichnology—recovering digital 3D models of dinosaur footprints
� 2010 The Authors
282 The Photogrammetric Record � 2010 The Remote Sensing and Photogrammetry Society and Blackwell Publishing Ltd