3D Fourier Analysis - Irida Ibérica
6
FFT-based tools for analyzing surface-process interactions and for advanced filtering Visualize Analyze Report 3D Fourier Analysis Mountains® 6 Optional Module Power spectrum density (surfaces & profiles) FFT Plot Editor for advanced filtering (surfaces & profiles) Texture isotropy, directionality & periodicity (surfaces) Autocorrelation and intercorrelation plots (surfaces and profiles) Frequency spectrum (surfaces & profiles)
Transcript of 3D Fourier Analysis - Irida Ibérica

FFT-based tools for analyzing surface-process interactions and for advanced filtering
Vis
uali
ze A
naly
ze R
ep
ort
3D Fourier Analysis
Mountains® 6 Optional Module
Power spectrum density (surfaces & profiles)
FFT Plot Editor for advanced filtering(surfaces & profiles)
Texture isotropy, directionality & periodicity (surfaces)
Autocorrelation and intercorrelationplots (surfaces and profiles)
Frequency spectrum (surfaces & profiles)

The Frequency Spectrum study displays an interactive plot
obtained by the Fast Fourier Transform (FFT). The following
parameters are calculated for any XY point on a surface:
Wavelength.
Angle.
Magnitude (amplitude) of the radius in decibels (log scale)
or length units (linear scale).
Phase.
Frequency Spectrum
See the wavelength, magnitude, phase and angle of each point on a surface in an interactive frequency spectrum plot
The study also displays an interactive plot of the wavelengths
that make up a profile and calculates the following
parameters:
Wavelength (key).
Magnitude (amplitude).
Phase.
Insignificant spectral lines can be filtered using a Hanning
window function.
Plot generated by the Graphical Study of Volume Parameters study
3D Fourier Analysis Mountains 6 Optional Module
2
Motor cylinder surface with honing marks. The Frequency Spectrum study provides an interactive plot with a logarithmic scale
(left) or a linear scale (right). It calculates parameters for each point on the surface.
Microlens array. The Frequency Spectrum study also provides an interactive plot . It
calculates parameters for each wavelength tn the microlens array
surface.

Power spectrum density
See the intensity of each wavelength in an interactive PSD plot
The Power Spectrum Density study displays an interactive
plot with wavelength on the x axis and intensity (square of the
amplitude) on the y axis. The amplitude is shown for each
selected wavelength.
Glass surface before (left) and after (right) an acid attack (courtesy LNE)
3
PSD plot (using the all directions method) of the glass surface before the acid attack.
PSD plot (using the all directions method) of the glass surface after the acid attack.
3D Fourier Analysis Mountains 6 Optional Module

The Texture Direction study analyzes the surface using the
Fourier transform and shows dominant surface directions on
a polar or Cartesian plot. It calculates the following
parameters:
Isotropy (%). This is equal to the ISO 25178 Str parameter.
It is calculated with smoothing and with minimum and
maximum frequency thresholds of 5% and 80% respectively.
These thresholds can be changed by the user. The higher the
isotropy percentage value the more the surface resembles
itself in every direction.
The three most dominant lay directions of a surface (in
degree units).
Isotropy, directionality and periodicity
View dominant surface directions and calculate isotropy and other parameters
4
Nanoscopic wires
The Texture Isotropy study displays the 2D autocorrelation
plot after form removal and calculates the following
parameters with respect to a user-defined threshold (default
0.2):
Isotropy (%)
Periodicity (%).
Period (length).
Direction of the period (degrees).
Texture Direction study:
isotropy and dominant directionsAutocorrelation plot
Roughness reference standardTexture Isotropy study
isotropy and periodicityAutocorrelation plot
The Autocorrelation operator displays a 3D autocorrelation
plot. The plot helps to distinguish between isotropic surfaces
(with a circular central node) and anisotropic surfaces (with a
central node extended along one direction).
The Intercorrelation operator displays an intercorrelation
plot. .
3D Fourier Analysis Mountains 6 Optional Module
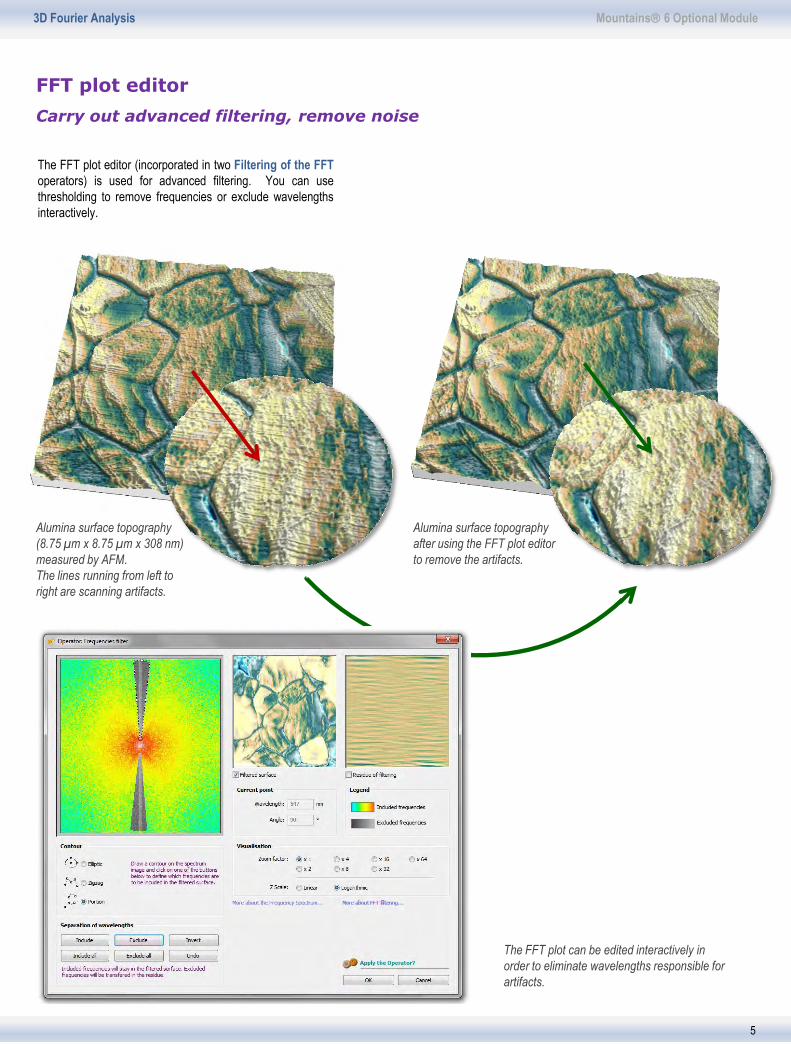
FFT plot editor
Carry out advanced filtering, remove noise
The FFT plot editor (incorporated in two Filtering of the FFT
operators) is used for advanced filtering. You can use
thresholding to remove frequencies or exclude wavelengths
interactively.
5
The FFT plot can be edited interactively in
order to eliminate wavelengths responsible for
artifacts.
Alumina surface topography
after using the FFT plot editor
to remove the artifacts.
Alumina surface topography
(8.75 µm x 8.75 µm x 308 nm)
measured by AFM.
The lines running from left to
right are scanning artifacts.
3D Fourier Analysis Mountains 6 Optional Module

Selected features
Mountains® 6 3D Fourier Optional Module
Frequency spectrum • Display interactive frequency spectrum plot.
• Display wavelength, angle, amplitude and phase of a selected XY point on a surface.
• Display amplitude and phase of a selected wavelength on a profile.
• Apply Hanning window function to eliminate insignificant spectral lines.
Power spectrum density (PSD) • Calculate the PSD using the horizontal or all directions method.
• Display interactive PSD plot with wavelength on the x axis and intensity (square of the amplitude) on the
y axis.
• Display the amplitude of a selected wavelength.
• Apply Hanning window function.
Isotropy, directionality and periodicity • Calculate isotropy (%) with default minimum and maximum thresholds (in which case it is equivalent to
the Str parameter) or user-defined thresholds.
• Display dominant surface directions on a direction rose.
• Calculate periodicity (%), period (length), and direction of the period (degrees).
Autocorrelation and intercorrelation • 3D autocorrelation plot.
• 3D intercorrelation plot.
FFT plot editor • Remove frequencies using thresholding or exclude wavelengths interactively.
Digital Surf Head Office and R&D Center
Digital Surf SARL, 16 rue Lavoisier, 25000 Besançon, France
Tel +33 3 81 50 48 00 Fax +33 3 81 50 92 24
[email protected] www.digitalsurf.com
© 1996-2011 Digital Surf SARL. All rights reserved.
Specifications subject to change without prior notice
Mountains 6 - 3D Fourier Analysis Optional Module3D Fourier Analysis Mountains 6 Optional Module