3D Analysis of Rock Textures - Department of Geological ... jerram/Jerram... · process is repeated...
7
INTRODUCTION Although the patterns and structures of rocks have been observed and recorded since the Classical age of Greece, it was in the nineteenth century that the development of the polarising microscope enabled a vast increase in the num- ber and detail of petrological studies (see review by Merriam 2004). At that time petrographic observations, such as esti- mates of average grain size, grain relationships, grain boundary shapes and orientation fabrics, were mostly qual- itative. While qualitative data have their uses, they cannot constrain physical models of processes like quantitative data can, and the seminal work by Chayes (1956) on petro- graphic modal analysis paved the way for a more robust sta- tistical approach to quantitative petrology. With the increasing power of imaging technologies, plus improved computer processing and modelling, a new petrological approach to two-dimensional (2D) and more recently three- dimensional (3D) textural analysis of rocks is emerging (FIG. 1; Jerram and Kent 2006). This approach is the topic of this contribution. The texture 3 of rocks and other crystalline materials can be quantified by measuring such parameters as size, shape, ori- entation and position of common components, e.g. crystals, pores and fractures (e.g. Jerram et al. 1996; Brandon and Kaplan 1999; Higgins 2006). These parameters are derived from 3D structures within the rock, and hence it is desirable that rocks should be examined using 3D analytical methods. Such methods are based on the attenuation of beams that pene- trate the sample (e.g. X-ray tomog- raphy) or on the reconstruction of the sample from a series of parallel sections (e.g. serial sectioning, con- focal scanning laser microscopy). 3D methods are not always appli- cable: samples and grains may be too large or small; the method may be so expensive that sufficient crys- tals and samples cannot be analysed; and many 3D methods (e.g. beam techniques) cannot distinguish touching grains of the same min- eral, clearly separate different min- erals with very similar properties, or determine the orientation of the crystal lattice. Hence, it may be necessary to study 2D sections through a rock and extrapolate these data to obtain three-dimensional textural parameters using stereological methods (Underwood 1970; Exner 2004). This has been the more common approach in the past and forms the foundation from which many 3D textural studies can be interpreted (Higgins 2006 and refer- ences therein). In the following sections we introduce the various techniques available for reconstructing 3D rock tex- tures, with particular attention to serial section and X-ray tomographic methods, and we review how they can be applied to the quantification of 3D rock textures. DIRECT 3D ANALYTICAL METHODS Serial Sectioning The texture of a rock sample can be established from serial sectioning (Bryon et al. 1995) or serial grinding (e.g. Marschallinger 1998; Mock and Jerram 2005), followed by computer reconstruction. Initially, a surface is cut and imaged with a camera or scanner. The surface may also be stained to emphasise a particular mineral – for instance the well-known sodium cobaltinitrite treatment for K-feldspar. In serial grinding, the surface is then ground away and a new surface made, parallel to the original section, and the process is repeated to provide a number of serial section images through the sample (FIG. 2); the material between sections is destroyed with only the image of the section remaining. By using an annular or diamond wire saw, it is also possible to prepare a series of parallel thin sections through the rock. This has the advantage that the sample is not completely destroyed, enabling geochemical analysis of the resultant sections in the context of the 3D texture. In principle the datasets can be made with very high reso- lution and precision. The resolution of the method is limited by the spacing of the sections (which can be set using jigs E LEMENTS ,V OL . 3, PP . 239–245 AUGUST 2007 Dougal A. Jerram 1 and Michael D. Higgins 2 1 Dept. of Earth Sciences, Durham University South Rd, Durham DH1 3LE, UK E-mail: [email protected] 2 Université du Québec à Chicoutimi, 555 blvd de l’Université Chicoutimi, Québec G7H 2B1, Canada E-mail: [email protected] 3 Materials scientists and some geologists prefer the terms microstructure or fabric to texture. Similarly materials scientists use the term polycrystalline for a material containing more than one crystal. 3D Analysis of Rock Textures: Quantifying Igneous Microstructures 239 A n important goal of petrographers is to analyse rock textures (microstructures) and compositions in three dimensions, and thus fully quantify rock properties (porosity and permeability, geochemistry, crystal abundance, etc.). With the advent of serial sectioning techniques, X-ray tomography analysis and advanced image analysis, it is becoming increasingly easy to reconstruct rock textures in three dimensions. An exciting consequence is the potential to reconstruct crystal populations in three dimensions and relate their distribution to the chemical budget of a rock. Here we review the current state of the art in textural analysis techniques and consider the possibilities of virtual three-dimensional models of rock textures. KEYWORDS: 3D textures, microstructure, X-ray tomography, petrography, serial sectioning 3D false-colour image of the texture in a lava flow from Teide volcano, Tenerife. Orange: feldspar crystals; blue: vesicle bubbles. The crystals are up to 2 cm long.
Transcript of 3D Analysis of Rock Textures - Department of Geological ... jerram/Jerram... · process is repeated...

INTRODUCTIONAlthough the patterns and structures of rocks have beenobserved and recorded since the Classical age of Greece, itwas in the nineteenth century that the development of thepolarising microscope enabled a vast increase in the num-ber and detail of petrological studies (see review by Merriam2004). At that time petrographic observations, such as esti-mates of average grain size, grain relationships, grainboundary shapes and orientation fabrics, were mostly qual-itative. While qualitative data have their uses, they cannotconstrain physical models of processes like quantitativedata can, and the seminal work by Chayes (1956) on petro-graphic modal analysis paved the way for a more robust sta-tistical approach to quantitative petrology. With theincreasing power of imaging technologies, plus improvedcomputer processing and modelling, a new petrologicalapproach to two-dimensional (2D) and more recently three-dimensional (3D) textural analysis of rocks is emerging(FIG. 1; Jerram and Kent 2006). This approach is the topic ofthis contribution.
The texture3 of rocks and other crystalline materials can bequantified by measuring such parameters as size, shape, ori-entation and position of common components, e.g. crystals,pores and fractures (e.g. Jerram et al. 1996; Brandon andKaplan 1999; Higgins 2006). These parameters are derivedfrom 3D structures within the rock, and hence it is desirablethat rocks should be examined using 3D analytical methods.
Such methods are based on theattenuation of beams that pene-trate the sample (e.g. X-ray tomog-raphy) or on the reconstruction ofthe sample from a series of parallelsections (e.g. serial sectioning, con-focal scanning laser microscopy).
3D methods are not always appli-cable: samples and grains may betoo large or small; the method maybe so expensive that sufficient crys-tals and samples cannot be analysed;and many 3D methods (e.g. beamtechniques) cannot distinguishtouching grains of the same min-eral, clearly separate different min-erals with very similar properties,
or determine the orientation of the crystal lattice. Hence, itmay be necessary to study 2D sections through a rock andextrapolate these data to obtain three-dimensional texturalparameters using stereological methods (Underwood 1970;Exner 2004). This has been the more common approach inthe past and forms the foundation from which many 3Dtextural studies can be interpreted (Higgins 2006 and refer-ences therein). In the following sections we introduce thevarious techniques available for reconstructing 3D rock tex-tures, with particular attention to serial section and X-raytomographic methods, and we review how they can beapplied to the quantification of 3D rock textures.
DIRECT 3D ANALYTICAL METHODS
Serial SectioningThe texture of a rock sample can be established from serialsectioning (Bryon et al. 1995) or serial grinding (e.g.Marschallinger 1998; Mock and Jerram 2005), followed bycomputer reconstruction. Initially, a surface is cut andimaged with a camera or scanner. The surface may also bestained to emphasise a particular mineral – for instance thewell-known sodium cobaltinitrite treatment for K-feldspar.In serial grinding, the surface is then ground away and anew surface made, parallel to the original section, and theprocess is repeated to provide a number of serial sectionimages through the sample (FIG. 2); the material betweensections is destroyed with only the image of the sectionremaining. By using an annular or diamond wire saw, it isalso possible to prepare a series of parallel thin sectionsthrough the rock. This has the advantage that the sample isnot completely destroyed, enabling geochemical analysis ofthe resultant sections in the context of the 3D texture.
In principle the datasets can be made with very high reso-lution and precision. The resolution of the method is limitedby the spacing of the sections (which can be set using jigs
E L E M E N T S , V O L . 3 , P P . 2 3 9 – 2 4 5 AUGUST 2007
Dougal A. Jerram1 and Michael D. Higgins2
1 Dept. of Earth Sciences, Durham University South Rd, Durham DH1 3LE, UK E-mail: [email protected]
2 Université du Québec à Chicoutimi, 555 blvd de l’UniversitéChicoutimi, Québec G7H 2B1, CanadaE-mail: [email protected]
3 Materials scientists and some geologists prefer the terms microstructureor fabric to texture. Similarly materials scientists use the termpolycrystalline for a material containing more than one crystal.
3D Analysis of Rock Textures:Quantifying Igneous Microstructures
239
An important goal of petrographers is to analyse rock textures(microstructures) and compositions in three dimensions, and thusfully quantify rock properties (porosity and permeability, geochemistry,
crystal abundance, etc.). With the advent of serial sectioning techniques, X-raytomography analysis and advanced image analysis, it is becoming increasinglyeasy to reconstruct rock textures in three dimensions. An exciting consequenceis the potential to reconstruct crystal populations in three dimensions andrelate their distribution to the chemical budget of a rock. Here we reviewthe current state of the art in textural analysis techniques and consider thepossibilities of virtual three-dimensional models of rock textures.
KEYWORDS: 3D textures, microstructure, X-ray tomography,
petrography, serial sectioning
3D false-colour image ofthe texture in a lava flow
from Teide volcano,Tenerife. Orange: feldspar
crystals; blue: vesiclebubbles. The crystals are
up to 2 cm long.
for serial lapping giving a possible spacing of a few microns;FIG. 2). If one wishes to reconstruct a rock volume in whichthe voxels (3D pixels) have the same resolution in all direc-tions, the sections would be ground at the spacing of theresolution of each image (Marschallinger 1998). This tech-nique allows the study of a full 3D volume of the rock (dis-cussed below under X-ray tomography). If the objects to beanalysed are relatively coarse grained, less resolution in thegrinding direction can be used to increase the volume ofmaterial sampled and reduce the size of the dataset (e.g.Mock and Jerram 2005). Although the process of serialgrinding and lapping is very time consuming, it can giveexcellent results, especially for small numbers of irregularlyshaped objects. Resolutions as small as 40 µm have beenachieved in such studies (e.g. Marschallinger 1998), whichis comparable to the resolution of some of the low-resolu-tion X-ray tomographic datasets (see later sections). In thecase of serial thin sections, a much larger spacing of theslices is needed – typically >0.5 mm. However, it is mucheasier to distinguish separate crystals in thin section thanon a rock surface.
Another significant advance is the recent use of fully auto-mated (robotic) systems to reduce sectioning times andimprove resolution. The automated serial sectioning deviceRobo-Met.3D (U.S. Patent Pending) has been developed(Spowart 2006) with the capability of removing sections of
metallic alloys and composites with repeat-able section depths from less than 0.2 µmup to 10 µm. Although this device has yetto be used for petrography, the flexibilityof the adopted serial lapping/polishingapproach, coupled with digital optical colourmicroscopy, has the potential to achievevery high resolution section images overmany cubic millimetres of material, at ratesup to 20 sections per hour.
The series of sectional images must beprocessed to separate out the differentminerals or structures of interest (FIG. 2). Alarge number of methods can be used toachieve this, but the most commonapproach is to classify each pixel on thebasis of its colour (Higgins 2006). However,there have been considerable advances inimage-recognition algorithms, and we canexpect more advances (Sharon et al. 2006).Of course, if thin sections are used then amuch larger range of traditional opticalmethods is possible. The classified sec-tional images can then be constructed into3D, either as a data volume (voxel image)or as reconstructed surfaces aroundsequential sections through individualcrystals (e.g. FIG. 2). In either case theresultant 3D image can be used to establishthe complete shape of each crystal.
TomographyRemote 3D imaging using X-ray tomogra-phy was pioneered in the Earth sciences inthe 1990s in Bill Carlson’s lab in Texas. Itis now a growing area of research, with thedevelopment of instruments capable ofvery high resolution analysis. Tomography(CT – computed axial tomography) is the
reconstruction of a section (slice) from many separate pro-jections around an object (FIG. 3). A series of closely spacedslices are then assembled into a 3D image. The method iscommonly applied using a relatively standard X-ray source(e.g. Ketcham and Carlson 2001), but it can also be usedwith other sources, such as synchrotron radiation (e.g. Ikedaet al. 2004), gamma rays, electrons and even light. FIGURE 3shows the stages from image capture through to processingand finally to a reconstructed 3D virtual texture ready forquantification; these stages are explained in detail below.
Minerals and pores are distinguished in X-ray tomographyon the basis of their linear attenuation coefficient, µ. Thisparameter depends on the electron density of the mineral,the effective atomic number of the mineral, and the energyof the incoming X-ray beam. In some situations the samplecan be examined using X-rays of two different energies (fre-quencies) and the images combined to increase phase dis-crimination. In general, this method cannot separatetouching crystals of the same mineral because µ does notdepend on direction, even in anisotropic minerals. Thiscontrasts with the optical anisotropy of most common min-erals and the electronic anisotropy of all crystalline materials.
Sample size is limited by the attenuation of X-rays and thephysical dimensions of the sample chamber. Some indus-trial instruments can handle samples up to 40 cm longwhereas medical scanners can accommodate much largersamples. Spatial resolution is a function of sample size andthe number of pixels in the image (typically 500 to 2000pixels on a side). The modern micro X-ray tomography
240240E L E M E N T S AUGUST 2007
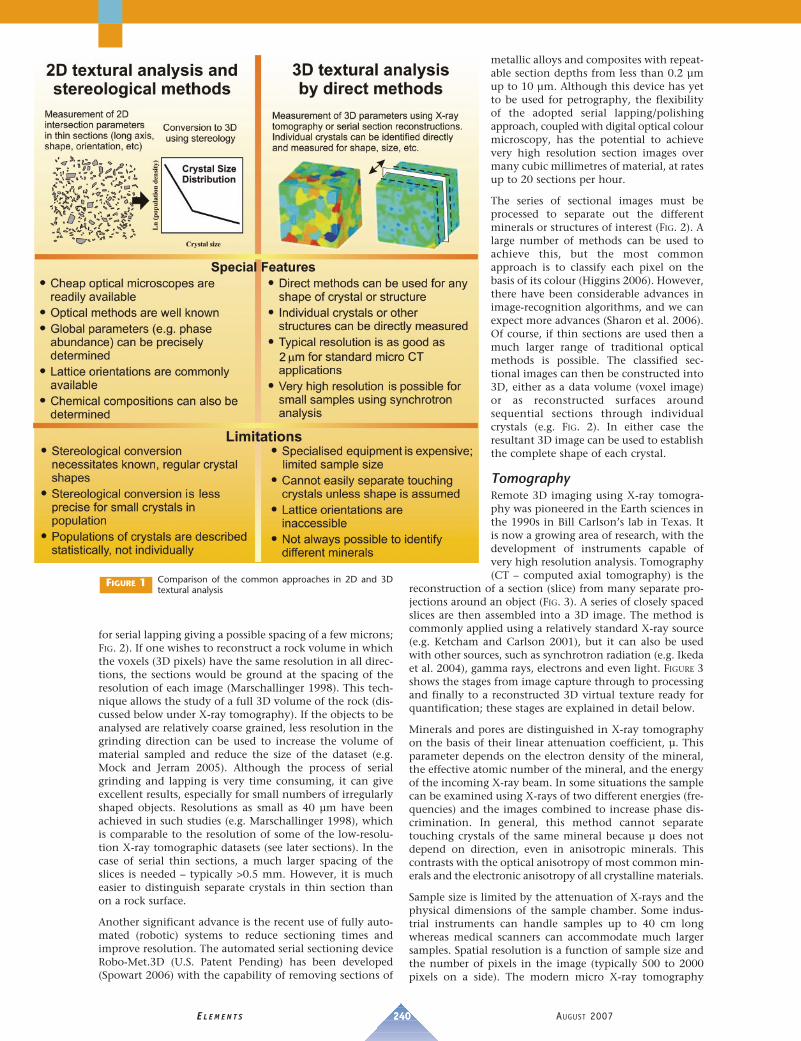
Comparison of the common approaches in 2D and 3Dtextural analysis
FIGURE 1

instruments have quoted resolutions in the range of6–30 µm with core or block sample sizes of 7 cm by 3 cmdiameter, and most recent lab systems routinely achieveresolution as low as 5 µm. New nanotomography systemsare also arriving on the scene, and these may achieve reso-lutions as low as 300 nm voxel size. With much largerscans, resolutions are commonly 0.1–0.2 mm for decimetresize samples. Larger samples have a lower resolution, lim-
ited by the number of pixels. For example, Godel et al.(2006) used a medical scanner to image sulphides in layeredintrusions and achieved voxel sizes of 0.125 mm × 0.125 mm× 0.5 mm, for a 10 cm long core.
Synchrotron radiation has some advantages over normal X-rays. For example, synchrotron radiation is very intenseand can be focussed in a small volume. Gualda and Rivers(2006) achieved resolutions of 8–17 µm using the synchro-tron source at Argonne National Laboratory, for samplecylinders 5–10 mm in diameter. Synchrotron radiation hasalso been combined with X-ray fluorescence computedtomography to give a 3D compositional map (e.g. Lemelleet al. 2004). Although precision is currently low, thismethod shows promise for some materials. The highest-res-olution electron tomography uses a transmitted electronmicroscope and can image at the sub-micron to nanometrescale (e.g. Friedrich et al. 2005).
241E L E M E N T S
Reconstruction of a 3D texture using serial sectioning–grinding. Sequential sections are made at known spac-
ings through the sample using a jig that can be set to grind down toknown intervals. Images are taken from each section as high-resolutionscans, and each of the key minerals is identified with a different colour.
Simplified digital serial sections are then used to identify cuts throughthe same crystal in different sections. In the example shown (adaptedfrom Mock and Jerram 2005), each crystal is reconstructed with an iso-surface, which provides an outline of the crystal volume and shape.
FIGURE 2
AUGUST 2007
Measuring 3D textures using X-ray CT techniques. X-raysare passed through the sample to produce a series of 2D
images that are spaced close to each other (typically at resolutions of7–30 µm). Sequential images are captured by rotating the sample orsource. The resultant images are a series of spatially constrained,stacked, greyscale tiff files, in which the grey values are related to thelinear attenuation coefficient (density) of the material (mineral) at thatposition in the sample. Images are rendered to pick out key phases foranalysis. Using software such as Blob3D (see text), the individual ele-ments of the texture, such as crystals, can be sampled and quantified.
FIGURE 3

242E L E M E N T S AUGUST 2007
Less Commonly Used 3D MethodsOptical scanning can be used to determine the texture ofsmall proportions of crystals in transparent materials. Thesection is examined with an optical microscope at highmagnification with a large aperture. In this situation thedepth of field is small and a narrow range of depths in thesection are focussed. A photograph is taken and the sampleto objective distance increased. The process is repeated tobuild up a complete 3D reconstruction of the section. Thematrix of the crystals must be sufficiently transparent, andthe crystal number density must be sufficiently low that thewhole crystal can be observed; hence the method can beapplied only in special circumstances, for instance in thestudy of microlites in a glassy volcanic rock (Castro et al.2003). It is not always necessary to reconstruct the whole3D structure: the length and other shape parameters can bedetermined from the vertical and horizontal position of theends of the crystal.
A scanning laser confocal microscope is designed specifi-cally for this application (e.g. Petford et al. 2001; Bozhilovet al. 2003). Instead of shining a light on the whole section,only a part of the sample is scanned with a laser beam. Theimage is then reconstructed sequentially, allowing a verticalstack of images (z-series) to be rapidly compiled. This tech-nique is non-destructive, and scattering of light from adja-cent crystals and matrix into the volume of interest is muchreduced. A confocal study of the porosity distribution in asandstone from the North Sea is presented in FIGURE 4(Petford et al. 2001).
Magnetic resonance imaging is used extensively in medicalapplications but has only recently been applied to texturalstudies of rocks. Magnetic resonance generates images thatlargely reflect the hydrogen content of materials. So far thismethod has only been used to visualize distributions ofwater-filled pores in carbonate rocks (Gingras et al. 2002),but it may be useful in other studies, especially if the reso-lution of the method can be improved.
EXTRACTION OF TEXTURAL PARAMETERSFROM DATA VOLUMESThe analytical methods described above produce as finaloutput a 3D image commonly referred to as a data volume,or data brick. It is comprised of voxels, the volumetricequivalent of pixels in images. Extraction of textural infor-mation from data volumes comprises three steps: classifica-tion of voxels into minerals, separation of touching crystals,and measurement of crystals (Ketcham 2005). Initiallyresearchers used industrial or medical software designed forimaging and qualitative studies of a limited number of complexstructures. However, as petrologists we commonly want to
measure the parameters of many individual rock structures(crystals, fractures, etc.) and study the distribution of thetextural parameters (size, orientation, etc.). Recently, dedi-cated geological software has been developed for this pur-pose (e.g. Ketcham 2005).
Turning Voxels into PhasesThe classification process is commonly the most complex.Data volumes from X-ray tomography are greyscale images(see FIG. 3), with only one value for each voxel. Such imagescan be segmented by considering a window of acceptablevalues. Voxels in the interior of ideal crystals will have anarrow range of values of µ (e.g. TABLE 1). Voxels on the edgewill have µ values intermediate between those of the min-eral and the host. However, most crystals are not ideal: theymay have exsolution lamellae, fractures, alteration, inclu-sions and zoning. These effects are compounded by analytical‘noise’ and lead to a much wider range in µ for a mineral(FIG. 5). Ketcham (2005) proposed a number of approacheswhere the neighbouring voxels are also used to help theclassification. For instance, the ‘seeded threshold’ filter ini-tially accepts voxels within a range of greyscale values. Eachobject is then expanded by the addition of connected vox-els that have a wider range of greyscale values. If the mineralgrain is assumed to be spherical, then irregular groups ofvoxels may be simplified by substituting spheres with volumesequal to that of the original crystal (Carlson et al. 1995).
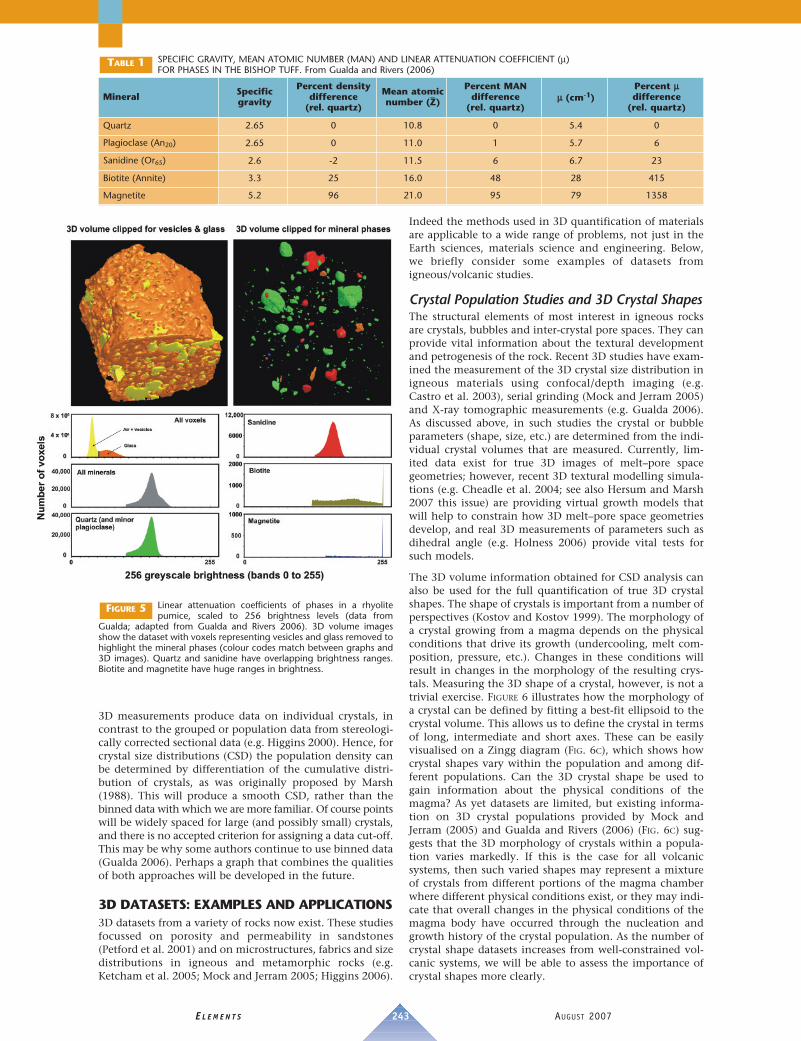
Once the different phases have been identified, it is possi-ble to colour code them differently to aid with their visual-isation/quantification, in effect to give false colour to thegreyscales. FIGURE 5 shows different phases (glass, vesiclesand minerals) identified from a pumice clast sample in theBishop Tuff deposit, USA, and graphs of their range inattenuation (Gualda and Rivers 2006). Data volumesderived from serial sectioning potentially have the advan-tage that the true colour information is also available foreach image. This is most helpful to distinguish mineralsthat would have very similar attenuations in normal X-raytomography datasets, such as sanidine and plagioclase.When texture colour information from each slice isincluded in the 3D volume, there are at least three colourvalues for each voxel, and more complex numerical meth-ods can be applied for classifying minerals (Higgins 2006).
SeparationTouching crystals or grains are not separated by most 3Danalytical methods; hence separation must be done duringdata reduction. Voxel groups can be examined individuallyand cut apart manually (Ketcham 2005). In an automaticprocess suggested by Proussevitch and Sahagian (2001),interconnected voxel clusters are ‘peeled’ or eroded untilthe individual objects are separated, and finally the crystalcentres are defined. The crystals are then rebuilt using anassumed shape, such as a sphere or an equidimensionalpolyhedron. Another approach is to use the ‘watershed’algorithm. The acceptable range of voxels in a group isreduced until the group separates into distinct objects. Thevoxel group is then rebuilt from these centres (Ketcham2005). Once individual grains within a sample have beenidentified, they can also be false coloured to highlight eachdifferent mineral (e.g. FIG. 3) for analysis.
MeasurementMeasurement of the dimensions of separated groups of vox-els is conceptually simple but has not been facilitated bycurrent software, which is designed for industrial and med-ical applications. An exception is the program Blob3D(Ketcham 2005). 3D image of porosity (orange) and grains (blue) from a
North Sea sandstone, generated using a scanning laserconfocal microscope (Petford et al. 2001)
FIGURE 4
3D measurements produce data on individual crystals, incontrast to the grouped or population data from stereologi-cally corrected sectional data (e.g. Higgins 2000). Hence, forcrystal size distributions (CSD) the population density canbe determined by differentiation of the cumulative distri-bution of crystals, as was originally proposed by Marsh(1988). This will produce a smooth CSD, rather than thebinned data with which we are more familiar. Of course pointswill be widely spaced for large (and possibly small) crystals,and there is no accepted criterion for assigning a data cut-off.This may be why some authors continue to use binned data(Gualda 2006). Perhaps a graph that combines the qualitiesof both approaches will be developed in the future.
3D DATASETS: EXAMPLES AND APPLICATIONS3D datasets from a variety of rocks now exist. These studiesfocussed on porosity and permeability in sandstones(Petford et al. 2001) and on microstructures, fabrics and sizedistributions in igneous and metamorphic rocks (e.g.Ketcham et al. 2005; Mock and Jerram 2005; Higgins 2006).
Indeed the methods used in 3D quantification of materialsare applicable to a wide range of problems, not just in theEarth sciences, materials science and engineering. Below,we briefly consider some examples of datasets fromigneous/volcanic studies.
Crystal Population Studies and 3D Crystal ShapesThe structural elements of most interest in igneous rocksare crystals, bubbles and inter-crystal pore spaces. They canprovide vital information about the textural developmentand petrogenesis of the rock. Recent 3D studies have exam-ined the measurement of the 3D crystal size distribution inigneous materials using confocal/depth imaging (e.g.Castro et al. 2003), serial grinding (Mock and Jerram 2005)and X-ray tomographic measurements (e.g. Gualda 2006).As discussed above, in such studies the crystal or bubbleparameters (shape, size, etc.) are determined from the indi-vidual crystal volumes that are measured. Currently, lim-ited data exist for true 3D images of melt–pore spacegeometries; however, recent 3D textural modelling simula-tions (e.g. Cheadle et al. 2004; see also Hersum and Marsh2007 this issue) are providing virtual growth models thatwill help to constrain how 3D melt–pore space geometriesdevelop, and real 3D measurements of parameters such asdihedral angle (e.g. Holness 2006) provide vital tests forsuch models.
The 3D volume information obtained for CSD analysis canalso be used for the full quantification of true 3D crystalshapes. The shape of crystals is important from a number ofperspectives (Kostov and Kostov 1999). The morphology ofa crystal growing from a magma depends on the physicalconditions that drive its growth (undercooling, melt com-position, pressure, etc.). Changes in these conditions willresult in changes in the morphology of the resulting crys-tals. Measuring the 3D shape of a crystal, however, is not atrivial exercise. FIGURE 6 illustrates how the morphology ofa crystal can be defined by fitting a best-fit ellipsoid to thecrystal volume. This allows us to define the crystal in termsof long, intermediate and short axes. These can be easilyvisualised on a Zingg diagram (FIG. 6C), which shows howcrystal shapes vary within the population and among dif-ferent populations. Can the 3D crystal shape be used togain information about the physical conditions of themagma? As yet datasets are limited, but existing informa-tion on 3D crystal populations provided by Mock andJerram (2005) and Gualda and Rivers (2006) (FIG. 6C) sug-gests that the 3D morphology of crystals within a popula-tion varies markedly. If this is the case for all volcanicsystems, then such varied shapes may represent a mixtureof crystals from different portions of the magma chamberwhere different physical conditions exist, or they may indi-cate that overall changes in the physical conditions of themagma body have occurred through the nucleation andgrowth history of the crystal population. As the number ofcrystal shape datasets increases from well-constrained vol-canic systems, we will be able to assess the importance ofcrystal shapes more clearly.
243E L E M E N T S AUGUST 2007
Linear attenuation coefficients of phases in a rhyolitepumice, scaled to 256 brightness levels (data from
Gualda; adapted from Gualda and Rivers 2006). 3D volume imagesshow the dataset with voxels representing vesicles and glass removed tohighlight the mineral phases (colour codes match between graphs and3D images). Quartz and sanidine have overlapping brightness ranges.Biotite and magnetite have huge ranges in brightness.
FIGURE 5
SPECIFIC GRAVITY, MEAN ATOMIC NUMBER (MAN) AND LINEAR ATTENUATION COEFFICIENT (µ)FOR PHASES IN THE BISHOP TUFF. From Gualda and Rivers (2006)
TABLE 1
Mineral Specificgravity
Percent densitydifference
(rel. quartz)
Mean atomicnumber (
_Z)
Percent MANdifference
(rel. quartz)µµ (cm-1)
Percent µµdifference
(rel. quartz)
Quartz 2.65 0 10.8 0 5.4 0
Plagioclase (An20) 2.65 0 11.0 1 5.7 6
Sanidine (Or65) 2.6 -2 11.5 6 6.7 23
Biotite (Annite) 3.3 25 16.0 48 28 415
Magnetite 5.2 96 21.0 95 79 1358
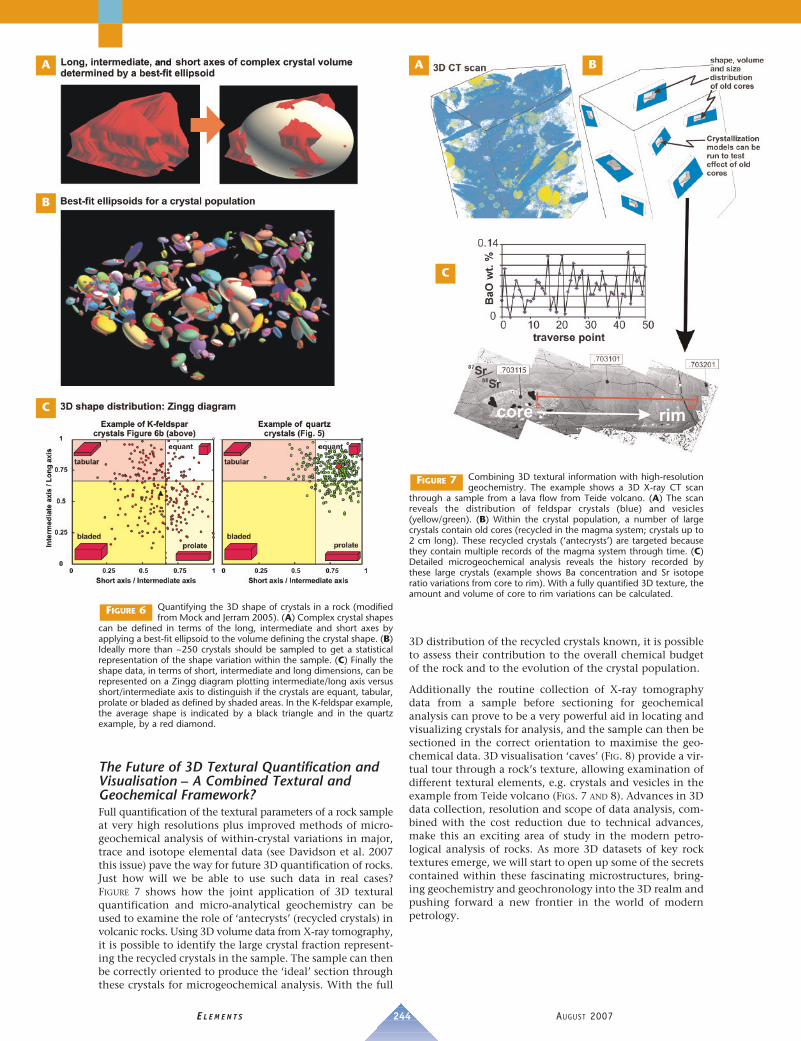
The Future of 3D Textural Quantification andVisualisation – A Combined Textural andGeochemical Framework?Full quantification of the textural parameters of a rock sampleat very high resolutions plus improved methods of micro-geochemical analysis of within-crystal variations in major,trace and isotope elemental data (see Davidson et al. 2007this issue) pave the way for future 3D quantification of rocks.Just how will we be able to use such data in real cases?FIGURE 7 shows how the joint application of 3D texturalquantification and micro-analytical geochemistry can beused to examine the role of ‘antecrysts’ (recycled crystals) involcanic rocks. Using 3D volume data from X-ray tomography,it is possible to identify the large crystal fraction represent-ing the recycled crystals in the sample. The sample can thenbe correctly oriented to produce the ‘ideal’ section throughthese crystals for microgeochemical analysis. With the full
3D distribution of the recycled crystals known, it is possibleto assess their contribution to the overall chemical budgetof the rock and to the evolution of the crystal population.
Additionally the routine collection of X-ray tomographydata from a sample before sectioning for geochemicalanalysis can prove to be a very powerful aid in locating andvisualizing crystals for analysis, and the sample can then besectioned in the correct orientation to maximise the geo-chemical data. 3D visualisation ‘caves’ (FIG. 8) provide a vir-tual tour through a rock’s texture, allowing examination ofdifferent textural elements, e.g. crystals and vesicles in theexample from Teide volcano (FIGS. 7 AND 8). Advances in 3Ddata collection, resolution and scope of data analysis, com-bined with the cost reduction due to technical advances,make this an exciting area of study in the modern petro-logical analysis of rocks. As more 3D datasets of key rocktextures emerge, we will start to open up some of the secretscontained within these fascinating microstructures, bring-ing geochemistry and geochronology into the 3D realm andpushing forward a new frontier in the world of modernpetrology.
244E L E M E N T S AUGUST 2007
Quantifying the 3D shape of crystals in a rock (modifiedfrom Mock and Jerram 2005). (A) Complex crystal shapes
can be defined in terms of the long, intermediate and short axes byapplying a best-fit ellipsoid to the volume defining the crystal shape. (B)Ideally more than ~250 crystals should be sampled to get a statisticalrepresentation of the shape variation within the sample. (C) Finally theshape data, in terms of short, intermediate and long dimensions, can berepresented on a Zingg diagram plotting intermediate/long axis versusshort/intermediate axis to distinguish if the crystals are equant, tabular,prolate or bladed as defined by shaded areas. In the K-feldspar example,the average shape is indicated by a black triangle and in the quartzexample, by a red diamond.
FIGURE 6
Combining 3D textural information with high-resolutiongeochemistry. The example shows a 3D X-ray CT scan
through a sample from a lava flow from Teide volcano. (A) The scanreveals the distribution of feldspar crystals (blue) and vesicles(yellow/green). (B) Within the crystal population, a number of largecrystals contain old cores (recycled in the magma system; crystals up to2 cm long). These recycled crystals (‘antecrysts’) are targeted becausethey contain multiple records of the magma system through time. (C)Detailed microgeochemical analysis reveals the history recorded bythese large crystals (example shows Ba concentration and Sr isotoperatio variations from core to rim). With a fully quantified 3D texture, theamount and volume of core to rim variations can be calculated.
FIGURE 7
A
B
C
A B
C

ACKNOWLEDGMENTSWe would like to thank Guilherme Gualda and Nick Petfordfor constructive comments on the initial draft of this con-tribution. DAJ would specifically like to thank Alex Mock,Dan Morgan and Darren Chertkoff for assistance on variousaspects of the data and examples presented here, GrahamDavis (MicroCT lab, Queen Mary, University of London) for3D data acquisition and Nick Holliman (E-Science visualisa-tion centre, Durham) for help with 3D visualisation. DAJwould like to acknowledge the support of NERC, EU 5thFramework and DeBeers in his textural research. .
245E L E M E N T S AUGUST 2007
X-ray CT 3D rock texture being explored using a state-of-the-art 3D visualisation system at Durham University. The
rock is a lava from Teide volcano. Feldspar crystals are shown in yellowand vesicles in blue.
FIGURE 8
REFERENCESBozhilov KN, Green HW II, Dobrzhinetskaya
LF (2003) Quantitative 3D measurementof ilmenite abundance in Alpe Aramiolivine by confocal microscopy:Confirmation of high-pressure origin.American Mineralogist 88: 596-603
Brandon D, Kaplan WD (1999)Microstructural Characterization ofMaterials. John Wiley & Sons Ltd.,Chichester, England, 424 pp
Bryon DN, Atherton MP, Hunter RH (1995)The interpretation of granitic texturesfrom serial thin sectioning, image analysisand three-dimensional reconstruction.Mineralogical Magazine 59: 203-211
Carlson WD, Denison C, Ketcham RA(1995) Controls on the nucleation andgrowth of porphyroblasts: Kinetics fromnatural textures and numerical models.Geological Journal 30: 207-225
Castro JM, Cashman KV, Manga M (2003)A technique for measuring 3D crystal-sizedistributions of prismatic microlites inobsidian. American Mineralogist 88:1230-1240
Chayes F (1956) Petrographic Modal Analysis.Chapman and Hall, London, 113 pp
Cheadle MJ, Elliott MT, McKenzie D (2004)Percolation threshold and permeability ofcrystallizing igneous rocks: The importanceof textural equilibrium. Geology 32: 757-760
Davidson JP, Morgan DJ, Charlier BLA(2007) Isotopic microsampling ofmagmatic rocks. Elements 3: 253-259
Exner HE (2004) Stereology and 3Dmicroscopy: Useful alternatives orcompetitors in the quantitative analysisof microstructures? Image Analysis andStereology 23: 73-82
Friedrich H, McCartney MR, Buseck PR(2005) Comparison of intensitydistributions in tomograms from BF TEM,ADF STEM, HAADF STEM, and calculatedtilt series. Ultramicroscopy 106: 18-27
Gingras MK, MacMillan B, Balcom BJ(2002) Visualizing the internal physicalcharacteristics of carbonate sedimentswith magnetic resonance imaging andpetrography. Bulletin of CanadianPetroleum Geology 50: 363-369
Godel B, Barnes S-J, Maier WD (2006) 3-ddistribution of sulphide minerals in theMerensky Reef (Bushveld Complex, South
Africa) and the J-M Reef (StillwaterComplex, USA) and their relationship tomicrostructures using X-ray computedtomography. Journal of Petrology 47:1853-1872
Gualda GAR (2006) Crystal size distributionsderived from 3D datasets: Sample sizeversus uncertainties. Journal of Petrology47: 1245-1254
Gualda GAR, Rivers M (2006) Quantitative3D petrography using X-ray tomography:Application to Bishop Tuff pumice clasts.Journal of Volcanology and GeothermalResearch 154: 48-62
Hersum TG, Marsh BD (2007) IgneousTextures: On the kinetics behind thewords. Elements 3: 247-252
Higgins MD (2000) Measurement of crystalsize distributions. American Mineralogist85: 1105-1116
Higgins MD (2006) Quantitative TexturalMeasurements in Igneous andMetamorphic Petrology. CambridgeUniversity Press, Cambridge, UK, 276 pp
Holness MB (2006) Melt–solid dihedralangles of common minerals in naturalrocks. Journal of Petrology 47: 791-800
Ikeda S, Nakano T, Tsuchiyama A, UesugiK, Suzuki Y, Nakamura K, Nakashima Y,Yoshida H (2004) Nondestructive three-dimensional element-concentrationmapping of a Cs-doped partially moltengranite by X-ray computed tomographyusing synchrotron radiation. AmericanMineralogist 89: 1304-1313
Jerram DA, Kent AJR (2006) An overview ofmodern trends in petrography: Texturaland microanalysis of igneous rocks.Journal of Volcanology and GeothermalResearch 154; vii-ix
Jerram DA, Cheadle MJ, Hunter RH, ElliottMT (1996) The spatial distribution ofgrains and crystals in rocks.Contributions to Mineralogy andPetrology 125: 60-74
Ketcham RA (2005) Computationalmethods for quantitative analysis ofthree-dimensional features in geologicalspecimens. Geosphere 1: 32-41
Ketcham RA, Carlson WD (2001)Acquisition, optimization and interpreta-tion of X-ray computed tomographicimagery: applications to the geosciences.Computers & Geoscience 27: 381-400
Ketcham RA, Meth C, Hirsch DM, CarlsonWD (2005) Improved methods forquantitative analysis of three-dimensionalporphyroblastic textures. Geosphere 1: 42-59
Kostov I, Kostov RI (1999) Crystal Habits ofMinerals. Bulgarian Academic Monograph1, Prof. Marin Drinov Academic PublishingHouse; Pensoft Publishers, Sofia, 415 pp
Lemelle L, Simionovici A, Truche R, Rau C,Chukalina M, Gillet P (2004) A newnondestructive X-ray method for thedetermination of the 3D mineralogy atthe micrometer scale. AmericanMineralogist 89: 547-553
Marschallinger R (1998) Correction ofgeometric errors associated with the 3-Dreconstruction of geological materials byprecision serial lapping. MineralogicalMagazine 62: 783-792
Marsh BD (1988) Crystal size distribution(CSD) in rocks and the kinetics anddynamics of crystallization I. Theory.Contributions to Mineralogy andPetrology 99: 277-291
Merriam DF (2004) The quantificationof geology: from abacus to Pentium: Achronicle of people, places, and phenom-ena. Earth-Science Reviews 67: 55-89
Mock A, Jerram DA (2005) Crystal sizedistributions (CSD) in three dimensions:Insights from the 3D reconstruction of ahighly porphyritic rhyolite. Journal ofPetrology 46: 1525-1541
Petford N, Davidson G, Miller JA (2001)Investigation of the petrophysicalproperties of a porous sandstone sampleusing confocal scanning laser microscopy.Petroleum Geoscience 7: 99-105
Proussevitch AA, Sahagian DL (2001)Recognition and separation of discreteobjects within complex 3D voxelizedstructures. Computer & Geosciences 27:441-454
Sharon E, Galun M, Sharon D, Basri R, BrandtA (2006) Hierarchy and adaptivity insegmenting visual scenes. Nature 442:810-813
Spowart JE (2006) Automated serialsectioning techniques for 3-D analysis ofmicrostructures. Scripta Materialia 55: 5-10
Underwood EE (1970) Quantitativestereology. Addison-Wesley PublishingCo., Reading, USA, 274 pp .