37th Annual Meeting International Institute of Ammonia ... · Calculated CV Pressure Drop (psi)...
30
Technical Papers 37th Annual Meeting International Institute of Ammonia Refrigeration March 22–25, 2015 2015 Industrial Refrigeration Conference & Exhibition San Diego, California
Transcript of 37th Annual Meeting International Institute of Ammonia ... · Calculated CV Pressure Drop (psi)...
Technical Papers37th Annual Meeting
International Institute of Ammonia Refrigeration
March 22–25, 2015
2015 Industrial Refrigeration Conference & ExhibitionSan Diego, California
ACKNOWLEDGEMENT
The success of the 37th Annual Meeting of the International Institute of Ammonia
Refrigeration is due to the quality of the technical papers in this volume and the labor of its
authors. IIAR expresses its deep appreciation to the authors, reviewers and editors for their
contributions to the ammonia refrigeration industry.
ABOUT THIS VOLUME
IIAR Technical Papers are subjected to rigorous technical peer review.
The views expressed in the papers in this volume are those of the authors, not the
International Institute of Ammonia Refrigeration. They are not official positions of the
Institute and are not officially endorsed.
International Institute of Ammonia Refrigeration
1001 North Fairfax Street
Suite 503
Alexandria, VA 22314
+ 1-703-312-4200 (voice)
+ 1-703-312-0065 (fax)
www.iiar.org
2015 Industrial Refrigeration Conference & Exhibition
San Diego, California

© IIAR 2015 1
Abstract
Calculation of pressure drop in vapor flows through valves has made substantial advancements in the past half-century. Currently-used methods for determining pressure drop through valves with vapor flows (assumed to be either saturated or superheated refrigerant vapor states) were identified and evaluated. Attempts at providing a standard means for industrial ammonia system engineers to calculate vapor valve pressure drops have been undertaken in the past, notably by the IIAR. At present, the IIAR makes available an explicit set of equations, based on CV , and provided in the Ammonia Refrigeration Piping Handbook (2004).
It is often the case that in HVAC&R, valves are sized based on capacity in Tons of Refrigeration. This does not allow for accurate sizing for types of valves not rated in those terms and will often not predict the correct valve for a specific application. This study recommends the use of widely-standardized methods for calculating vapor flow valve pressure drops be adopted in the industrial refrigeration industry on the part of engineers and contractors.
Tech Paper #6
Industrial Refrigeration Vapor Valve Sizing –
An Updated Approach
Robert SterlingPresident
Sterling Andrews Engineering, PLLC


Technical Paper #6 © IIAR 2015 3
Industrial Refrigeration Vapor Valve Sizing – An Updated Approach
Introduction
A commonly applied metric or performance characteristic available for almost every
type and size of valve is its “flow coefficient” or Cv. Cv (unless specifically called
out as being otherwise) is universally understood to represent the volume flow rate
flow coefficient of water at standard conditions (60°F)through a valve for a 1 psig
pressure drop (gpm/psi). While arguments can be made for and against a liquid Cv
as the characteristic on which to rate a valve intended for compressible flow, it is
nevertheless the most-easily obtained characteristic for any valve intended for use.
Specific characteristic valve data other than the Cv are not widely-published for
industrial refrigeration valves.
This paper will review past efforts undertaken in the literature and standards to
determine suitable methods for quantifying the compressible flow pressure drop in
valves and attempt to compare them while providing a base rationale for which, if
any, are appropriate methods for determining pressure drop.
In all cases, areas of interest will be limited to vapor flows characterized by
pressure drop, ΔP ≤ 0.5 P (inlet pressure), or non-choked, pure vapor flow [2,3,6].
Flows where pressure drop is sufficient to cause condensing (at pressures above
approximately 400 psig for ammonia) are not considered as this would not constitute
pure vapor flow. In addition, the methods considered are for turbulent flow through
a valve, and assumed valid above Re = 10,000 [3]. The assumption of turbulent flow
at low pressure drops in common refrigerant service valves can be readily accepted
and is not a blanket statement or poor assumption. It can be easily demonstrated
with any valve for which the connection size is known, as is shown below.
It should be noted before proceeding that the standard, ANSI/ISA 75.01.01 uses the
smallest throat diameter in the valve as the characteristic dimension for the Reynolds
number referred to above. This information is not typically available in regular
catalog literature for refrigerant valves. However, if the connection size of the valve is

4 © IIAR 2015 Technical Paper #6
2015 IIAR Industrial Refrigeration Conference & Exhibition, San Diego, CA
known, it can be substituted as the characteristic dimension and will be conservative
(in other words, if the port is smaller than the connection size, Reynolds number
will be underestimated by using the connection size). Reynolds numbers calculated
for low pressure drops in refrigerant valves using the connection size rather than
the smallest internal diameter are typically orders of magnitude higher than the
minimum threshold of 10,000 given above.
A 4-inch gas-powered suction valve with a Cv value of 276 with saturated ammonia
vapor at 40°F is considered. A pressure drop of 0.25 psig is assumed to demonstrate
a reasonably low pressure drop at high inlet pressure. Note that the mass flow to
generate a 0.25 psig pressure drop has been determined using the ANSI/ISA 75.01.01
equation for vapor flow pressure drops through valves, which is discussed in detail
in subsequent sections. The mass flow, 4,351 lb/hr, corresponds to a heat removal of
175.5 TR at 40°F with the liquid supply at 86°F.
The diameter is assumed as the nominal size, 4 inches. The definition of the
Reynolds number is:
where:
ρ is the fluid density
V is the fluid velocity
d is the characteristic dimension, in this case the nominal diameter of the valve
μ is the dynamic viscosity
To determine the Reynolds number using the available information from above, the
equation is rearranged, substituting velocity in terms of the mass flow.

Technical Paper #6 © IIAR 2015 5
Industrial Refrigeration Vapor Valve Sizing – An Updated Approach
4
4
Substituting values and correcting units (the dynamic viscosity of saturated ammonia
at 40°F is 6.177*10-6 lb/ft-s, from NIST’s REFRPROP 9.1)
The result is Re = 747,100. This is well above the threshold for Re = 10,000
mentioned above, and is based on the largest cross sectional internal area of the
valve, which is larger than the actual minimum diameter. Therefore, the assumption
of turbulent flow in typical design cases for refrigerant vapor flow will be considered
accurate within the scope of this analysis.
In addition, although various resources provide means of accounting for fittings
attached directly to a valve, for simplicity, the focus of this paper will be valves
installed at line size without attached fittings. Most catalog ratings for refrigeration
valves assume no attached reducers.
To clarify the content of the work that follows, two points are made here:
1. Although R-22 as a refrigerant for new system design is not very relevant, it
is included, along with ammonia, in the comparisons made between the ISA
method and the IIAR method because manufacturers’ ratings for valves on R-22
are readily available, whereas other refrigerant ratings are not.

6 © IIAR 2015 Technical Paper #6
2015 IIAR Industrial Refrigeration Conference & Exhibition, San Diego, CA
2. ISA has published a 2012 version of the 75.01.01 standard, which was not
directly observed for the writing of this paper. However, a summary of changes
was obtained and it was found that the equations used here did not change in
the update of the standard. The 2007 update, from which the equations were
taken, has been cited.
Incompressible Flow Equation
The basis of compressible flow equations is the incompressible flow equation, which
relates the valve characteristic to the pressure drop as follows [1,2]:
(1)
Where:
Cv is the valve characteristic flow coefficient
Q is the flow in US gallons per minute
SG is the specific gravity as compared to water at 60°F
ΔP is the pressure drop through the valve, P1 – P2 in psi
Equation (1) provides universally-accepted results for calculated pressure drop when
liquid is sufficiently subcooled to prevent flashing and flow is not choked, as it is
the definition of Cv. For compressible flows, this formula is not considered suitable
because it does not account for changing density with changing pressure.

Technical Paper #6 © IIAR 2015 7
Industrial Refrigeration Vapor Valve Sizing – An Updated Approach
Model for Compressible Flow Pressure Drop
The concept of using Cv, the incompressible flow coefficient, to model flow for vapor
through valves, has been fairly standard for many decades [2]. Equations for this
have taken various forms, including but not limited to the following:
(2)
(3)
(4)
Where:
Cv is the valve characteristic flow coefficient
Q is the flow rate in SCFH
P1 is the inlet pressure in psia
P2 is the outlet pressure in psia
T1 is the absolute inlet temperature in R (°F + 460R)
ΔP is the pressure drop through the valve, P1 – P2, in psi
SGair is the inlet specific gravity with respect to air at standard conditions
(14.7 psia and 60°F)

8 © IIAR 2015 Technical Paper #6
2015 IIAR Industrial Refrigeration Conference & Exhibition, San Diego, CA
Equations (2), (3), and (4) may produce widely-varying results [2]. As an interesting
note, a flow of 1,000,000 SCFM at various pressure drops was used to compare the
results of these equations for CV. The results have been calculated and plotted in
Figure 1.
80
130
180
230
280
330
0 20 40 60 80 100 120 140 160
Calc
ulat
ed C
V
Pressure Drop (psi)
Calculated CV Using Equations 2 - 4
Calculated CV (2)
Calculated CV (3)
Calculated CV (4)
Figure 1. Calculated CV using Equations 2 – 4.
The form of equations (2), (3), and (4) (either CV or Q, the volumetric flow, is almost
universally alone on one side or the other) is indicative of the fact that interest in
performing accurate calculations has been toward determining the required valve
CV from an incompressible flow under conditions where pressure drop is known
(in the case of Figure 1 at 50, 100, and 150 psi in Turnquist [2]). This is certainly
due in part to the fact that a valve manufacturer can control the aforementioned
conditions during testing and is interested in determining the CV of a particular
valve (these equations come from valve manufacturers). In many non-refrigeration
cases, where flow is commonly expressed in terms of mass flow rather than heat
flow (lb/hr instead of TR or BTU/hr), this can easily be compared to a previously-

Technical Paper #6 © IIAR 2015 9
Industrial Refrigeration Vapor Valve Sizing – An Updated Approach
calculated required CV in order to determine the suitability of a particular valve for
service. However, such a design approach is inconvenient for engineers designing and
diagnosing refrigeration systems because in most cases where refrigeration valves are
being sized, pressure drop (and consequently valve outlet pressure) is unknown.
For industrial refrigeration engineers, while considering an initial acceptable pressure
drop through a valve (say, 2 psi) is often convenient as a starting point, as is more
often the case, the engineer must consider the actual pressure drop in individual
valves and overall pressure drop in an entire valve train. In doing so, trade-offs can
be made depending on the performance of the chosen valves. This necessitates an
ability to accurately predict the pressure drop in each valve and total pressure drop in
the overall valve assembly.
The obstacle presented to the design engineer is that all formulas considered accurate
for the vapor flow pressure drop are implicit for ΔP, and so iteration of one form or
another is required [2,4,6]. This is clearly accepted by the IIAR as an organization,
since the equations in the Ammonia Piping Handbook are also implicit for ΔP, but is
an off-putting concept to many industrial refrigeration engineers who would prefer to
use an explicit equation. The down side to this preference is that, at times, making
these equations explicit requires simplifying assumptions that compromise the
accuracy of the resulting equation and so are difficult to defend given the availability
of current standards and knowledge.
To illustrate this point in the case of sizing valves for vapor flow, a simple
comparison can be made of the results of some of the available formulas for
calculating pressure drop. The following flow condition will be used for an Ammonia
vapor stream at 20°F:

10 © IIAR 2015 Technical Paper #6
2015 IIAR Industrial Refrigeration Conference & Exhibition, San Diego, CA
One of the available explicit equations is listed in [1]. With the inlet information
above, the pressure drop is calculated as:
90,52848.21
The above vapor flow above represents a 246 TR ammonia load at 86°F liquid
inlet temperature and saturated 20°F vapor coming into the valve. The valve
flow coefficient represents one manufacturer’s valve, for which the manufacturer
publishes a 2 psi pressure drop at these conditions, more than twice the calculated
pressure drop from the above explicit expression. The manufacturer’s rating is known
to be based on an implicit equation in Turnquist [2]. The simplifying assumption in
this equation appears to be that the flow through a valve is not significantly affected
by the expansion factor (discussed later), but it would appear that this is not a trivial
simplification and in fact destroys the validity of the equation.
It is therefore asserted that, in the case of vapor flow pressure drops, an implicit
equation for ΔP will provide superior results to those simplified explicit equations
available. Turnquist [2], the basis for the IIAR equations, gives the following:
(5)

Technical Paper #6 © IIAR 2015 11
Industrial Refrigeration Vapor Valve Sizing – An Updated Approach
Where:
Cv the valve characteristic flow coefficient
Q is the flow rate in SCFH
P1 is the inlet pressure in psia
P2 is the outlet pressure in psia
T1 is the absolute inlet temperature in R (°F + 460R)
ΔP is the pressure drop through the valve, P1 – P2, in psi
Gg is the inlet specific gravity with respect to air at standard conditions
(14.7 psia and 60°F)
The middle term is an early version of what has come to be known as the expansion
factor Y. It has been determined partially by derivation and partially by empirical
analysis. Although Equation (5) is similar in form to later equations in ISA 75.01 and
other publications, there are some key differences, most-notably that P1 appears in
the numerator under the radical. In addition, the Y term does not consider some of
the properties that have since been determined to affect the expansion factor.
It is clear that, since the time of the work done by Turnquist, those associated with
the ISA, Fisher (now Emerson), and Crane have taken a leading role in furthering
work in this area. ANSI/ISA 75.01.01-2007 is widely accepted as the current standard
for performing control valve flow calculations. While vapor flow formulas listed in
the standard are similar to Turnquist [2] for predicting pressure drop in valves for
compressible flow, the formulas in the ISA standard are more complex, inasmuch
as they also consider the compressibility factor Z as well as the specific heat ratio of

12 © IIAR 2015 Technical Paper #6
2015 IIAR Industrial Refrigeration Conference & Exhibition, San Diego, CA
the fluid and an additional valve characteristic, xT. In addition, while Turnquist [2]
develops an expression based on averaging a family of lines generated by calculating
Y (the adiabatic expansion factor) at various ratios of pressure drop to inlet pressure,
Buresh, et al. [5] takes a more direct approach by plotting flow over critical flow
against an abscissa that is the square root of the pressure drop ratio divided by the
critical pressure drop ratio:
This plot of essentially raw data is then directly curve-fitted as a sine function, with
no averaging of empirically-derived results. Turnquist in [2] appears to be a dead-
end branch in the tree of development of gas sizing equations, and is referenced
by Buresh, et al. [5] only for comparison to other contemporary equations. As
mentioned previously, substantial work has been contributed to the field since
Turnquist [2], and much is referenced in the ISA standard. The form of the equations
in that standard are now discussed.
In similar units to Turnquist [2] (ft3/hr) ANSI/ISA 75.01.01-2007 [3] provides the
following:
(6)

Technical Paper #6 © IIAR 2015 13
Industrial Refrigeration Vapor Valve Sizing – An Updated Approach
Where:
Fγ is specific heat ratio factor of the vapor, Cp/CV/1.4. Although not explicitly stated,
it is assumed that this is the specific heat ratio at standards conditions (14.7 psia,
60°F). An inspection of values in Annex C of the ANSI/ISA standard shows that
this is the case. Note that, in reality, specific heat ratios may vary significantly over
various temperature ranges for real gasses.
Gg is the ratio of the density of the gas at standard conditions to that of dry air at
standard conditions
P1 is the inlet pressure in psia
Q is the flow in SCFH
T1 is the absolute inlet temperature in R (°F + 460R)
x is the ratio ΔP/P1
xT is the pressure differential ratio, defined as the limit of x where choked flow
begins, where
Typical values based on various control valve types are listed in ANSI/ISA 75.01.01-
2007 [3]. For globe-style valves, 0.65 to 0.75 is a common range of values for xT
according to Table 1 of that standard.
Y is the expansion factor, which is given by
(7)
14 © IIAR 2015 Technical Paper #6
2015 IIAR Industrial Refrigeration Conference & Exhibition, San Diego, CA
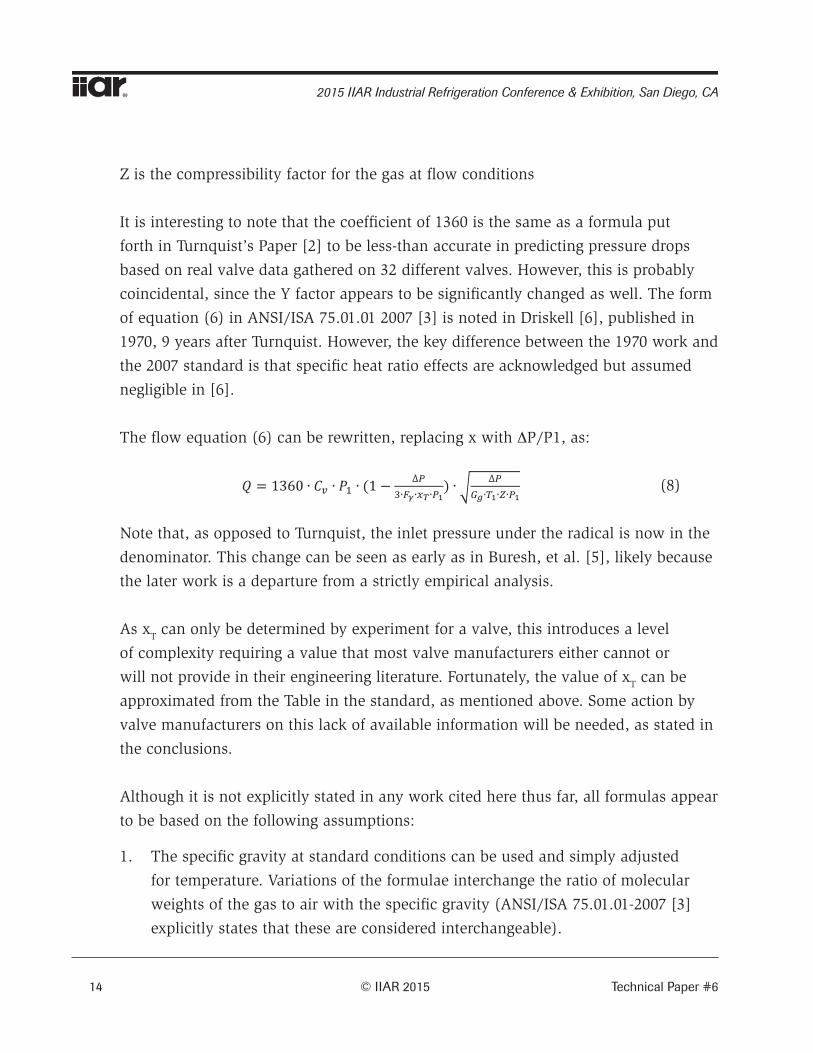
Z is the compressibility factor for the gas at flow conditions
It is interesting to note that the coefficient of 1360 is the same as a formula put
forth in Turnquist’s Paper [2] to be less-than accurate in predicting pressure drops
based on real valve data gathered on 32 different valves. However, this is probably
coincidental, since the Y factor appears to be significantly changed as well. The form
of equation (6) in ANSI/ISA 75.01.01 2007 [3] is noted in Driskell [6], published in
1970, 9 years after Turnquist. However, the key difference between the 1970 work and
the 2007 standard is that specific heat ratio effects are acknowledged but assumed
negligible in [6].
The flow equation (6) can be rewritten, replacing x with ΔP/P1, as:
(8)
Note that, as opposed to Turnquist, the inlet pressure under the radical is now in the
denominator. This change can be seen as early as in Buresh, et al. [5], likely because
the later work is a departure from a strictly empirical analysis.
As xT can only be determined by experiment for a valve, this introduces a level
of complexity requiring a value that most valve manufacturers either cannot or
will not provide in their engineering literature. Fortunately, the value of xT can be
approximated from the Table in the standard, as mentioned above. Some action by
valve manufacturers on this lack of available information will be needed, as stated in
the conclusions.
Although it is not explicitly stated in any work cited here thus far, all formulas appear
to be based on the following assumptions:
1. The specific gravity at standard conditions can be used and simply adjusted
for temperature. Variations of the formulae interchange the ratio of molecular
weights of the gas to air with the specific gravity (ANSI/ISA 75.01.01-2007 [3]
explicitly states that these are considered interchangeable).

Technical Paper #6 © IIAR 2015 15
Industrial Refrigeration Vapor Valve Sizing – An Updated Approach
2. The specific heat ratio remains constant
3. The ideal gas equation of state is applicable (Pv = nRT)
Comparison of the IIAR Method
The IIAR Piping Handbook presents the following as the means for calculating
pressure drops through vapor valves:
(9)
Cv is the valve characteristic flow coefficient
M is the molecular weight of the fluid (called out in the Handbook as 17.031 for
ammonia
ΔP is the pressure drop through the valve, P1 – P2, in psi
P is the (entering) pressure in psia
Qm is the actual rate in actual CFM at the flow temperature and pressure
T1 is the absolute entering temperature in R (°F + 460R)
The IIAR Piping Handbook cites Turnquist [2] as the derivation for the above. It is
curious to note that, while the Y term is identical to Turnquist, the inlet pressure
under the radical is now in the denominator and the inlet temperature is in the
numerator. The coefficient has also changed significantly. In addition, the specific
gravity at standard conditions has been replaced by the molecular weight ratio to air,
and (presumably, upon initial inspection) the molecular weight of air has been pulled
from beneath the radical and incorporated into the coefficient.
16 © IIAR 2015 Technical Paper #6
2015 IIAR Industrial Refrigeration Conference & Exhibition, San Diego, CA
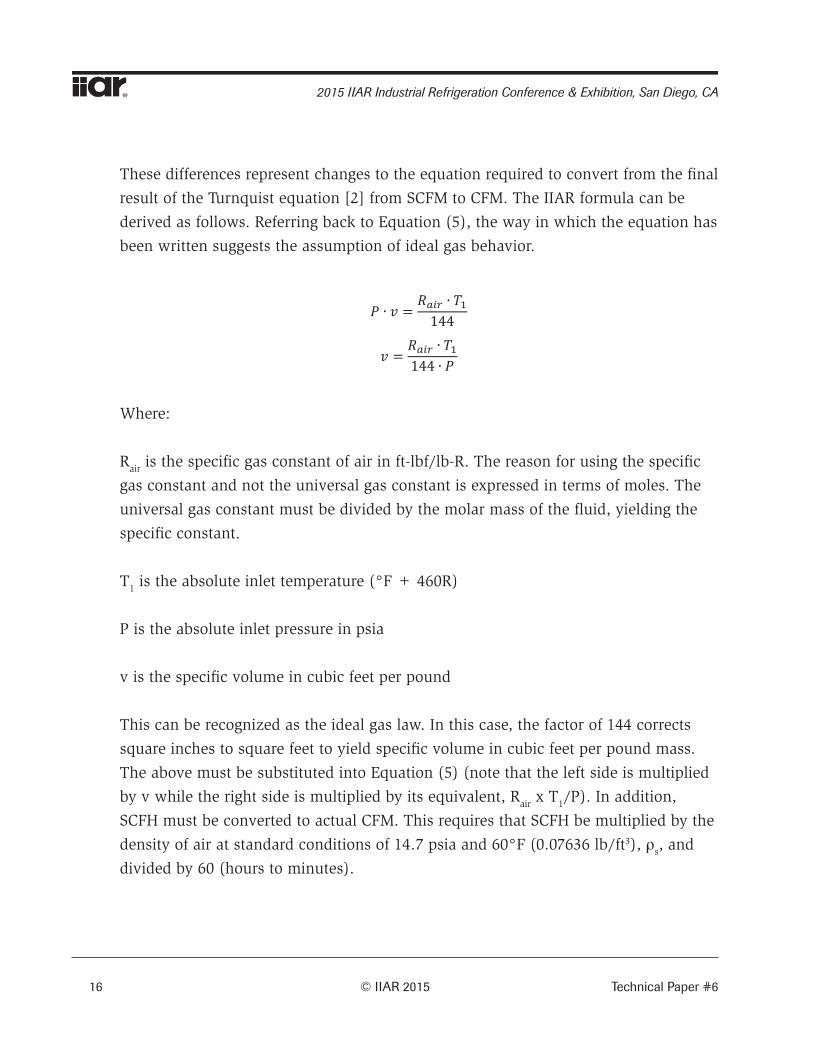
These differences represent changes to the equation required to convert from the final
result of the Turnquist equation [2] from SCFM to CFM. The IIAR formula can be
derived as follows. Referring back to Equation (5), the way in which the equation has
been written suggests the assumption of ideal gas behavior.
144
Where:
Rair is the specific gas constant of air in ft-lbf/lb-R. The reason for using the specific
gas constant and not the universal gas constant is expressed in terms of moles. The
universal gas constant must be divided by the molar mass of the fluid, yielding the
specific constant.
T1 is the absolute inlet temperature (°F + 460R)
P is the absolute inlet pressure in psia
v is the specific volume in cubic feet per pound
This can be recognized as the ideal gas law. In this case, the factor of 144 corrects
square inches to square feet to yield specific volume in cubic feet per pound mass.
The above must be substituted into Equation (5) (note that the left side is multiplied
by v while the right side is multiplied by its equivalent, Rair x T1/P). In addition,
SCFH must be converted to actual CFM. This requires that SCFH be multiplied by the
density of air at standard conditions of 14.7 psia and 60°F (0.07636 lb/ft3), ρs, and
divided by 60 (hours to minutes).
Technical Paper #6 © IIAR 2015 17
Industrial Refrigeration Vapor Valve Sizing – An Updated Approach
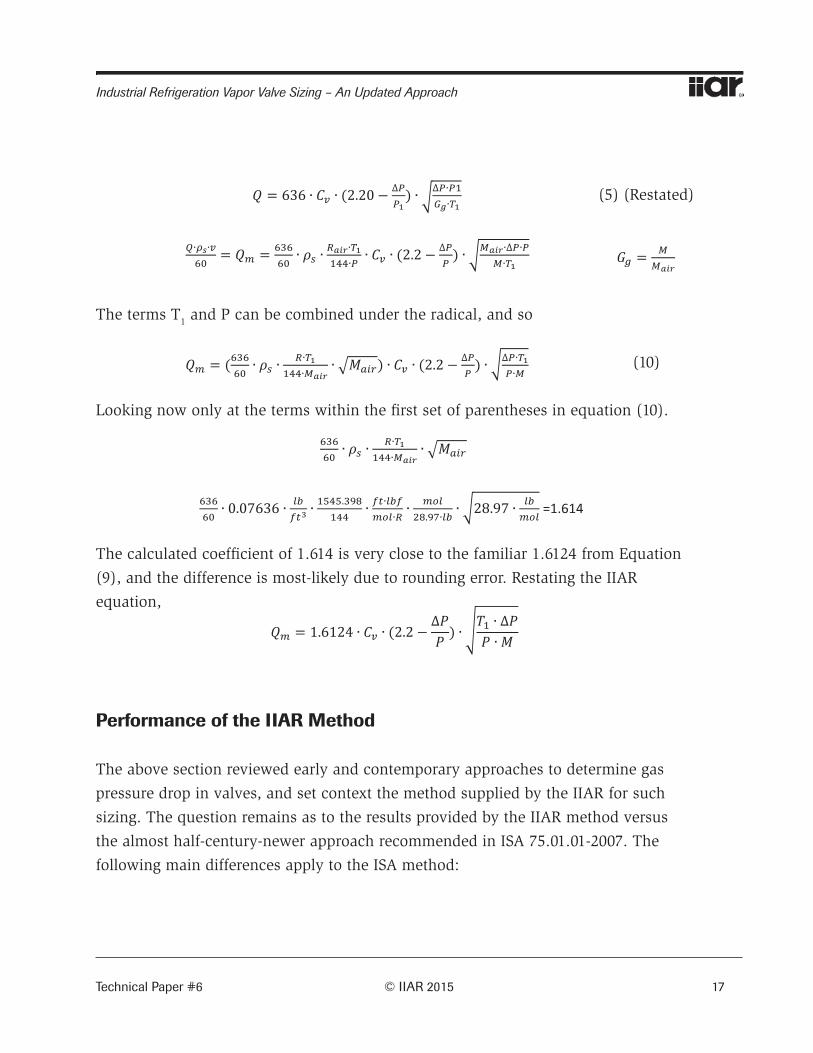
(5) (Restated)
The terms T1 and P can be combined under the radical, and so
(10)
Looking now only at the terms within the first set of parentheses in equation (10).
=1.614
The calculated coefficient of 1.614 is very close to the familiar 1.6124 from Equation
(9), and the difference is most-likely due to rounding error. Restating the IIAR
equation,
Performance of the IIAR Method
The above section reviewed early and contemporary approaches to determine gas
pressure drop in valves, and set context the method supplied by the IIAR for such
sizing. The question remains as to the results provided by the IIAR method versus
the almost half-century-newer approach recommended in ISA 75.01.01-2007. The
following main differences apply to the ISA method:

18 © IIAR 2015 Technical Paper #6
2015 IIAR Industrial Refrigeration Conference & Exhibition, San Diego, CA
1. The form of the equation differs slightly from Turnquist [2] (which is in fact
what the IIAR method is).
2. The ISA method considers specific heat ratio and xT, the pressure differential
ratio, as they affect the expansion factor, Y.
3. The ISA method considers the compressibility factor, Z (though not in the Y
term).
An evaluation of the accuracy of the ISA method has been undertaken by Riveland
[4] and an alternate form of the expansion factor Y recommended by Riveland under
certain circumstances. This alternative form of the equation is beyond the scope of
this paper, but information in [4] is useful for validating the use of the ISA method
for ammonia. While the assumptions underlying the ISA method, those of ideal gas
behavior with Y uncorrected for real gas behavior (even though Z is represented in
the equation under the radical) are not always correct, Riveland [4] asserts that the
ISA equations (assuming ideal gas behavior and correcting with Z) give results within
3% of predicted real fluid behavior (comparison is made using equations for real
gases listed in Appendix B of [4]) within the limits of their validity, chiefly where
the specific heat ratio, γ, remains as 1.08 < γ < 1.65 (which is certainly valid for
ammonia up to well above 300 psig saturated vapor and many other refrigerants in
various pressure ranges), and additionally, where the “isentropic exponent” remains
near 1.4, which for ammonia is the case over the saturated temperature range of
-50°F through 120°F, where this exponent ranges from 1.47 to 1.58.
In contrast to ISA, the method from the IIAR piping handbook does not consider any
real gas effects, nor the effects of the specific heat ratio on Y, the expansion factor, as
this was not well understood at the time Turnquist [2] was published.
A comparison of the results of each method can be made by the use of simple
spreadsheets. In this analysis, NIST’s REFPROP version 9.1 has been used to

Technical Paper #6 © IIAR 2015 19
Industrial Refrigeration Vapor Valve Sizing – An Updated Approach
determine refrigerant properties under various conditions. The results are provided in
the Tables listed. Valves from two different manufacturers were analyzed.
Note that for all valves analyzed below, the value of xT has been assumed at 0.75.
This assumption may not be completely valid, but is consistently applied. The value
is not published by either manufacturer considered.
Table 1 lists the results of the analysis for Manufacturer 1. Two sizes of valve
are listed, 1" and 4", with the corresponding Cv. For Table 1, which lists suction
capacities and pressure drops, the conditions for the flow are 86°F liquid feed
with saturated vapor at the valve inlet at the given pressure (inlet temperature is a
saturated temperature). Where the suction temperature is listed at -20°F, the liquid
feed is assumed to be at +10°F (the literature specifies two-stage operation for
this suction temperature, but does not list the intermediate pressure or saturation
temperature).
On the right side of Table 1, calculated pressure drop results of the IIAR formula and
ISA formula are compared. The table lists the manufacturer’s published capacity and
its corresponding results, and immediately following, the calculated capacity that
corresponds to the IIAR formula producing a pressure drop corresponding to the
published nominal value (2 psi or 5 psi).
In general, compared to the capacity listed in the manufacturer’s literature, the IIAR
equation tended to under predict pressure drop by between 2% and 13%. This would
mean that the valves are actually conservatively rated according to the IIAR equation
(meaning that the valves will flow more than the listed TR at the given pressure
drop), possibly due to the addition of some safety factor by the manufacturer.
However, when these values are compared to the results from the ISA equation, the
capacities listed predict higher-than-catalog pressure drops in many cases (though
not all). When compared to the calculated pressure drop from the IIAR equation, the
ISA equation calculates results for pressure drop between 8% and 12% higher. These
20 © IIAR 2015 Technical Paper #6
2015 IIAR Industrial Refrigeration Conference & Exhibition, San Diego, CA
results represent a significant difference in calculated pressure drop. This of course
assumes that the formula in ISA 75.01.01 is not over predicting the pressure drop,
but the specific heat ratio factor for the refrigerants used is well-within the limits for
accurate calculation and represents almost half a century of work in this area since
the time that the basis for the IIAR equation was developed.
Table 2 lists the results in a similar manner as Table 1, with the exact same
conditions, but with R22 as the refrigerant, again for Manufacturer 1. The results
show that the manufacturer’s listed capacities are conservative based on the IIAR
equation, similar to the ammonia capacities for the same valves. Results showed
differences in the results versus the catalog baseline similar to the ammonia results.
However, with respect to how the methods compared to each other, the ISA method
predicted pressure drops that were between 11% and 16% higher than the IIAR
method, over 30% higher than for ammonia.
The results in Tables 2 and 3 indicate a significant difference in calculated results
between the IIAR equation and a nationally-recognized standard for valve sizing,
which increases as a refrigerant’s specific heat ratio differs further from air and its
compressibility factor differs further from Table 1. These properties are known to be
of significance with respect to pressure drop through a vapor flow valve. Although
10-15% may not make a difference in valve size in many applications, it should be
recognized that this is based on saturated vapor only, which is seldom the case in dry
suction lines. The differences begin to become even more significant when superheat
is introduced (see Table 3).
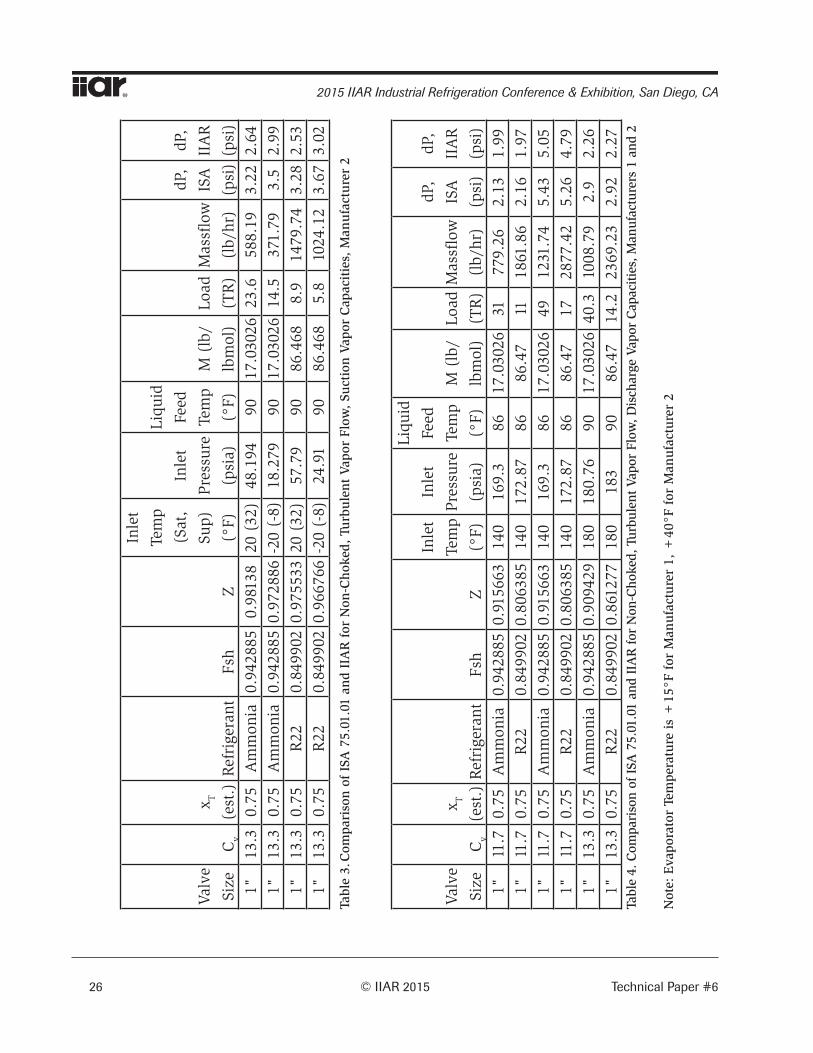
Table 3 lists a smaller sampling of calculated pressure drops than Tables 1 and 2,
and considers valves from Manufacturer 2. The refrigerant conditions are a liquid
temperature of 90°F, an evaporator saturated pressure as indicated, and 12°F of
superheat. The saturated temperature is shown in Table 3, with the superheated
temperature listed in parentheses.

Technical Paper #6 © IIAR 2015 21
Industrial Refrigeration Vapor Valve Sizing – An Updated Approach
Again, it is clear that the IIAR equation tends to under predict the pressure drop
through each valve as compared to the catalog rating (indicating some conservatism
in the rating). The ISA equation tends to predict higher pressure drops at the catalog
rating than what is indicated in the catalog, and in the case of the conditions
analyzed, provides pressure drops that are between 17% and 30% higher than the
IIAR-predicted value. This is significant and can make a substantial difference in
design versus actual pressure drops where superheated vapor is returned to the
compressors.
In an effort to compare the equation results at higher pressures and temperatures,
valves from both manufacturers were analyzed in Table 4. Table 4 is based on catalog
ratings for discharge gas capacities. The first four rows of Table 4 are ratings for a
1" valve from Manufacturer 1. It is clear again that the capacities listed are either
consistent or slightly conservative with regard to the catalog capacities. However, the
pressure drops predicted by the ISA equation are between 7% and 30% higher than
the IIAR values. Interestingly, the valves from Manufacturer 2 list catalog capacities
for which the ISA equation predicts within 4% the catalog pressure drop. This is
shown in the last two rows of Table 4. The reason for this difference could not be
determined for the writing of this paper.
The question may arise within the engineering or contracting communities as to the
significance of these findings, considering that valves may or may not be selected
with a granularity approaching that which would make a 20% difference significant.
The answer to this question is that such results are significant in at least (2) inter-
related ways:
1. It is typical in many refrigeration engineering circles to select a valve based on a
catalog rating, but these ratings are specific to a single condition, as is mentioned
in all refrigeration valve manufacturers’ catalogs. This demands a reasonable
method of determining a more accurate predicted pressure drop. This alone may
not be enough to sway some into believing that this will affect the outcome of
valve selection. However, in addition to this, the consideration must be made

22 © IIAR 2015 Technical Paper #6
2015 IIAR Industrial Refrigeration Conference & Exhibition, San Diego, CA
that valves are almost never placed into service by themselves, but are typically
installed as part of valve trains. These valves must also be properly sized, and
a miscalculation of pressure drop in the design phase can at times lead to large
energy penalties incurred by the end user in lowering “house” suction to the
point where a single room, designed to operate close to the nominal suction
temperature, will meet the required design temperatures. There are many cases
in which a marginal valve as part of a valve train is the correct choice, but
judicious selection of the other components is necessary, requiring accuracy
greater than within 20%.
2. At high suction pressures, an additional 0.5 psi drop through a valve train will
only incur an approximately 0.3°F temperature penalty at 40°F for example.
However, at -20°F, this penalty more than triples to over 1°F.
Conclusions
The above analysis compares equations from two main sources, the IIAR Piping
Handbook and ANSI/ISA 75.01.01, for determining flow or pressure drop through a
given valve. Assumptions were made about the characteristic xT of the valves from
two manufacturers and their catalog ratings compared in tables.
It should be noted that both manufacturers were contacted and both indicated that
the only experimentally-determined valves for their valves are Cv on water. All other
performance characteristics are calculated, not measured. Manufacturer 1 indicated
that the IIAR equation was used to calculate their ratings, though it appears that
some, possibly arbitrary, safety factor may have been added to dry suction vapor
capacities. Note that all valves analyzed were inlet pressure regulators. Manufacturer
2 did not indicate a method of calculation for their capacity ratings.
The ISA equation tended to consistently calculate higher pressure drops than the
IIAR equation for the same valve. ISA considers compressibility and specific heat
Technical Paper #6 © IIAR 2015 23
Industrial Refrigeration Vapor Valve Sizing – An Updated Approach
ratio effects that the IIAR equation does not. The results were at least 14% higher for
pressure drops in suction vapor valves with the ISA equation versus the IIAR, with
values ranging much higher and diverging more for R22 than for ammonia.
These conclusions indicate that some consideration should be made for changes to
the IIAR Piping Handbook and the IIAR’s chosen method of calculating pressure drop
in a valve for a given flow. There is a stark lack of experimental data for comparison,
and a standardization of valve rating method should be considered for industrial
refrigeration valve manufacturers. The IIAR should consider adopting the ANSI/ISA
method of calculating valve pressure drop performance.
In addition, manufacturers of valves for industrial refrigeration applications should
consider publishing data on the value of xT for each valve they produce to enhance
the accuracy of pressure drop calculations. This will lead to increased understanding
of how valve performance compares between manufacturers, and an increased ability
of the design engineer to provide refrigeration controls that operate more efficiently
and predictably. Performance testing on various refrigerants for a select group of
valves may also provide an indication of the accuracy of the ISA equations for
pressure drops of vapor flows.
Refrigeration engineers designing industrial systems should continue to aid the IIAR
in determining, as is possible, the applicability and usefulness of the published
equations.
Although simple sizing of valves based on catalog ratings for specific conditions
has often been adequate in the past to provide working systems, both the design of
refrigeration systems by table and the rating of valves by older methods should be
updated to include modern understanding of valve/fluid interaction. Innovation in
the industrial refrigeration industry depends on the commitment of manufacturers,
industry organizations, engineers, and contractors to avoid stagnation in design
techniques.

24 © IIAR 2015 Technical Paper #6
2015 IIAR Industrial Refrigeration Conference & Exhibition, San Diego, CA
Valv
e
Size
Cv
x T
(est
.)R
efri
gera
ntFs
hZ
Inle
t
Tem
p
(°F)
Inle
t
Pres
sure
(psi
a)
Liqu
id
Feed
Tem
p
(°F)
M (
lb/
lbm
ol)
Load
(TR
)
Mas
sflow
(lb/
hr)
dP,
ISA
(psi
)
dP,
IIA
R
(psi
)1"
11.7
0.75
Am
mon
ia0.
9428
850.
9417
8920
48.1
9486
17.0
3026
1742
6.06
1.99
1.8
1"11
.70.
75A
mm
onia
0.94
2885
0.94
1789
2048
.194
8617
.030
2617
.844
6.11
2.19
1.99
1"11
.70.
75A
mm
onia
0.94
2885
0.94
1789
2048
.194
8617
.030
2627
676.
685.
384.
841"
11.7
0.75
Am
mon
ia0.
9428
850.
9417
8920
48.1
9486
17.0
3026
27.4
686.
75.
575
1"11
.70.
75A
mm
onia
0.94
2885
0.96
873
-20
18.2
7910
17.0
3026
1226
1.27
1.99
1.84
1"11
.70.
75A
mm
onia
0.94
2885
0.96
873
-20
18.2
7910
17.0
3026
12.4
269.
982.
151.
981"
11.7
0.75
Am
mon
ia0.
9428
850.
9687
3-2
018
.279
1017
.030
2618
391.
915.
474.
91"
11.7
0.75
Am
mon
ia0.
9428
850.
9687
3-2
018
.279
1017
.030
2618
.12
394.
525.
574.
994"
166
0.75
Am
mon
ia0.
9428
850.
9417
8920
48.1
9486
17.0
3026
246
6165
.29
2.08
1.88
4"16
60.
75A
mm
onia
0.94
2885
0.94
1789
2048
.194
8617
.030
2625
463
65.7
92.
222.
014"
166
0.75
Am
mon
ia0.
9428
850.
9417
8920
48.1
9486
17.0
3026
382
9573
.75
5.35
4.81
4"16
60.
75A
mm
onia
0.94
2885
0.94
1789
2048
.194
1017
.030
2638
997
49.1
85.
575
4"16
60.
75A
mm
onia
0.94
2885
0.96
873
-20
18.2
7910
17.0
3026
166
3614
.29
1.88
1.74
4"16
60.
75A
mm
onia
0.94
2885
0.96
873
-20
18.2
7910
17.0
3026
176.
538
42.9
12.
162
4"16
60.
75A
mm
onia
0.94
2885
0.96
873
-20
18.2
7910
17.0
3026
251
5464
.99
5.19
4.67
4"16
60.
75A
mm
onia
0.94
2885
0.96
873
-20
18.2
7910
17.0
3026
257.
255
99.9
85.
585
Tabl
e 1.
Com
pari
son
of I
SA 7
5.01
.01
and
IIA
R fo
r N
on-C
hoke
d, T
urbu
lent
Vap
or F
low
, Am
mon
ia S
uctio
n Va
por
Cap
aciti
es, M
anuf
actu
rer
1

Technical Paper #6 © IIAR 2015 25
Industrial Refrigeration Vapor Valve Sizing – An Updated Approach
Valv
e
Size
Cv
x T
(est
.)R
efri
gera
ntFs
hZ
Inle
t
Tem
p
(°F)
Inle
t
Pres
sure
(psi
a)
Liqu
id
Feed
Tem
p
(°F)
M (
lb/
lbm
ol)
Load
(TR
)
Mas
sflow
(lb/
hr)
dP,
ISA
(psi
)
dP,
IIA
R
(psi
)1"
11.7
0.75
R22
0.84
9902
0.90
8116
2057
.795
8686
.468
6.5
1092
.92
2.05
1.81
1"11
.70.
75R
220.
8499
020.
9081
1620
57.7
9586
86.4
686.
8411
50.0
92.
282.
011"
11.7
0.75
R22
0.84
9902
0.90
8116
2057
.795
8686
.468
1016
81.4
25.
154.
461"
11.7
0.75
R22
0.84
9902
0.90
8116
2057
.795
8686
.468
10.5
417
72.2
25.
795
1"11
.70.
75R
220.
8499
020.
9483
57-2
024
.91
1086
.468
5.2
699.
61.
961.
781"
11.7
0.75
R22
0.84
9902
0.94
8357
-20
24.9
110
86.4
685.
4973
8.61
2.21
21"
11.7
0.75
R22
0.84
9902
0.94
8357
-20
24.9
110
86.4
687.
910
62.8
55.
254.
581"
11.7
0.75
R22
0.84
9902
0.94
8357
-20
24.9
110
86.4
688.
1811
00.5
25.
775
4"16
60.
75R
220.
8499
020.
9081
1620
57.7
9586
86.4
6892
1546
9.08
2.04
1.8
4"16
60.
75R
220.
8499
020.
9081
1620
57.7
9586
86.4
6897
1630
9.79
2.28
24"
166
0.75
R22
0.84
9902
0.90
8116
2057
.795
8686
.468
144
2421
2.47
5.33
4.6
4"16
60.
75R
220.
8499
020.
9081
1620
57.7
9510
86.4
6814
9.5
2513
7.25
5.79
54"
166
0.75
R22
0.84
9902
0.94
8357
-20
24.9
110
86.4
6873
9821
.26
1.92
1.74
4"16
60.
75R
220.
8499
020.
9483
57-2
024
.91
1086
.468
7810
493.
952.
222.
014"
166
0.75
R22
0.84
9902
0.94
8357
-20
24.9
110
86.4
6811
215
068.
245.
244.
584"
166
0.75
R22
0.84
9902
0.94
8357
-20
24.9
110
86.4
6811
615
606.
395.
764.
99
Tabl
e 2.
Com
pari
son
of I
SA 7
5.01
.01
and
IIA
R f
or N
on-C
hoke
d, T
urbu
lent
Vap
or F
low
, R22
Suc
tion
Vap
or C
apac
itie
s, M
anuf
actu
rer
1
26 © IIAR 2015 Technical Paper #6
2015 IIAR Industrial Refrigeration Conference & Exhibition, San Diego, CA
Valv
e
Size
Cv
x T
(est
.)R
efri
gera
ntFs
hZ
Inle
t
Tem
p
(Sat
,
Sup)
(°F)
Inle
t
Pres
sure
(psi
a)
Liqu
id
Feed
Tem
p
(°F)
M (
lb/
lbm
ol)
Load
(TR
)
Mas
sflow
(lb/
hr)
dP,
ISA
(psi
)
dP,
IIA
R
(psi
)1"
13.3
0.75
Am
mon
ia0.
9428
850.
9813
820
(32
)48
.194
9017
.030
2623
.658
8.19
3.22
2.64
1"13
.30.
75A
mm
onia
0.94
2885
0.97
2886
-20
(-8)
18.2
7990
17.0
3026
14.5
371.
793.
52.
991"
13.3
0.75
R22
0.84
9902
0.97
5533
20 (
32)
57.7
990
86.4
688.
914
79.7
43.
282.
531"
13.3
0.75
R22
0.84
9902
0.96
6766
-20
(-8)
24.9
190
86.4
685.
810
24.1
23.
673.
02
Tabl
e 3.
Com
pari
son
of I
SA 7
5.01
.01
and
IIA
R f
or N
on-C
hoke
d, T
urbu
lent
Vap
or F
low
, Suc
tion
Vap
or C
apac
itie
s, M
anuf
actu
rer
2
Valv
e
Size
Cv
x T
(est
.)R
efri
gera
ntFs
hZ
Inle
t
Tem
p
(°F)
Inle
t
Pres
sure
(psi
a)
Liqu
id
Feed
Tem
p
(°F)
M (
lb/
lbm
ol)
Load
(TR
)
Mas
sflow
(lb/
hr)
dP,
ISA
(psi
)
dP,
IIA
R
(psi
)1"
11.7
0.75
Am
mon
ia0.
9428
850.
9156
6314
016
9.3
8617
.030
2631
779.
262.
131.
991"
11.7
0.75
R22
0.84
9902
0.80
6385
140
172.
8786
86.4
711
1861
.86
2.16
1.97
1"11
.70.
75A
mm
onia
0.94
2885
0.91
5663
140
169.
386
17.0
3026
4912
31.7
45.
435.
051"
11.7
0.75
R22
0.84
9902
0.80
6385
140
172.
8786
86.4
717
2877
.42
5.26
4.79
1"13
.30.
75A
mm
onia
0.94
2885
0.90
9429
180
180.
7690
17.0
3026
40.3
1008
.79
2.9
2.26
1"13
.30.
75R
220.
8499
020.
8612
7718
018
390
86.4
714
.223
69.2
32.
922.
27Ta
ble
4. C
ompa
riso
n of
ISA
75.
01.0
1 an
d II
AR
for
Non
-Cho
ked,
Tur
bule
nt V
apor
Flo
w, D
isch
arge
Vap
or C
apac
ities
, Man
ufac
ture
rs 1
and
2
Not
e: E
vapo
rato
r Te
mpe
ratu
re is
+15
°F f
or M
anuf
actu
rer
1, +
40°F
for
Man
ufac
ture
r 2

Technical Paper #6 © IIAR 2015 27
Industrial Refrigeration Vapor Valve Sizing – An Updated Approach
References
[1] http://www.engineeringtoolbox.com/flow-coefficients-d_277.html, “Flow
Coefficient – Cv – Formulas for Liquids, Steam, and Gases – Online
Calculators, Author unavailable
[2] Turnquist, Ralph. “Comparison of Gas Flow Formulas for Control Valve
Sizing.” Instrument Society of America Preprint 17 SL61 (1961): 1-7
[3] ISA, ANSI/ISA 75.01.01-2007, Flow Equations for Sizing Control Valves, pp.11-
17
[4] Riveland, Marc L. The Use of Control Valve Sizing Equations with Simulation
Based Process Data. Presented at ISA automation week, 2012.
[5] Buresh, JF and Schuder, CB. “Development of a universal gas sizing equation
for control valves.” ISA Transactions, Vol. 3, 1964, pp. 322-328
[6] Driskell, L.R. “Sizing Valves for Gas Flow.” ISA Transactions, Volume 9, 1970,
pp. 325-331
[7] Lemmon, E.W., Huber, M.L., McLinden, M.O. NIST Standard Reference
Database 23: Reference Fluid Thermodynamic and Transport Properties-
REFPROP, Version 9.11, National Institute of Standards and Technology,
Standard Reference Data Program, Gaithersburg, 2013.
Valv
e
Size
Cv
x T
(est
.)R
efri
gera
ntFs
hZ
Inle
t
Tem
p
(Sat
,
Sup)
(°F)
Inle
t
Pres
sure
(psi
a)
Liqu
id
Feed
Tem
p
(°F)
M (
lb/
lbm
ol)
Load
(TR
)
Mas
sflow
(lb/
hr)
dP,
ISA
(psi
)
dP,
IIA
R
(psi
)1"
13.3
0.75
Am
mon
ia0.
9428
850.
9813
820
(32
)48
.194
9017
.030
2623
.658
8.19
3.22
2.64
1"13
.30.
75A
mm
onia
0.94
2885
0.97
2886
-20
(-8)
18.2
7990
17.0
3026
14.5
371.
793.
52.
991"
13.3
0.75
R22
0.84
9902
0.97
5533
20 (
32)
57.7
990
86.4
688.
914
79.7
43.
282.
531"
13.3
0.75
R22
0.84
9902
0.96
6766
-20
(-8)
24.9
190
86.4
685.
810
24.1
23.
673.
02
Tabl
e 3.
Com
pari
son
of I
SA 7
5.01
.01
and
IIA
R f
or N
on-C
hoke
d, T
urbu
lent
Vap
or F
low
, Suc
tion
Vap
or C
apac
itie
s, M
anuf
actu
rer
2
Valv
e
Size
Cv
x T
(est
.)R
efri
gera
ntFs
hZ
Inle
t
Tem
p
(°F)
Inle
t
Pres
sure
(psi
a)
Liqu
id
Feed
Tem
p
(°F)
M (
lb/
lbm
ol)
Load
(TR
)
Mas
sflow
(lb/
hr)
dP,
ISA
(psi
)
dP,
IIA
R
(psi
)1"
11.7
0.75
Am
mon
ia0.
9428
850.
9156
6314
016
9.3
8617
.030
2631
779.
262.
131.
991"
11.7
0.75
R22
0.84
9902
0.80
6385
140
172.
8786
86.4
711
1861
.86
2.16
1.97
1"11
.70.
75A
mm
onia
0.94
2885
0.91
5663
140
169.
386
17.0
3026
4912
31.7
45.
435.
051"
11.7
0.75
R22
0.84
9902
0.80
6385
140
172.
8786
86.4
717
2877
.42
5.26
4.79
1"13
.30.
75A
mm
onia
0.94
2885
0.90
9429
180
180.
7690
17.0
3026
40.3
1008
.79
2.9
2.26
1"13
.30.
75R
220.
8499
020.
8612
7718
018
390
86.4
714
.223
69.2
32.
922.
27Ta
ble
4. C
ompa
riso
n of
ISA
75.
01.0
1 an
d II
AR
for
Non
-Cho
ked,
Tur
bule
nt V
apor
Flo
w, D
isch
arge
Vap
or C
apac
ities
, Man
ufac
ture
rs 1
and
2
Not
e: E
vapo
rato
r Te
mpe
ratu
re is
+15
°F f
or M
anuf
actu
rer
1, +
40°F
for
Man
ufac
ture
r 2

Notes:
28 © IIAR 2015 Technical Paper #6
2015 IIAR Industrial Refrigeration Conference & Exhibition, San Diego, CA