373 MARK n ENDCAP ELECTROMAGNETIC CALORIMETERS·
32
373 MARK n ENDCAP ELECTROMAGNETIC CALORIMETERS· G. Abrams, A. Baden, R. Birge, J. Boyer, F. Butler, G. Gidal, G. Goldhaber, J. Haggerty, D. Herrup, R. Jared, I. Juricic, J. Kadyk, F. Kirsten, K. Lee, K. Mirk, M. Moebus, S. Olson, W. Pope, W. Schmidke, C. Sojourner, G. Trilling and D. Wood Presented by J. Kadyk ABSTRACT A set of two electromagnetic calorimeters have been built and installed on the end- caps of the Mark II detector at SLAC. One of these calorimeters was tested in a posi- tron beam and in a pion beam to determine the optimal operating conditions and the performance characteristics. Each endcap consists of 36 layers of aluminum proportional tubes, interleaved with 0.5 X o lead sheets, arranged to lie along four coordinate direc- tions. The mechanical and electrical designs are described, and results given for the per- formance in the positron beam. The energy resolution obtained was o(E)/E !:::' I. Introduction The Mark II detector has undergone a major upgrade in the past 1-1/2 years to prepare for the demanding operation at the SLC collider at SLAC, due to begin opera.- tion near the beginning of 1987. 1 AB part of this upgrade program, electromagnetic calorimeters were designed and built at LBL for the endcap region of the Mark II, where only two-layer shower detectors had previously existed. These endcap calorimeters (ECC's) cover the angular region between about 15 0 and 45 0 from the beam axis, and together with the existing liquid argon calorimeters (LAC's),2 provide electromagnetic 'Thill work was in p... by U.S. D.p... or Enorgy und.. DE-AC03-78SFlJOOG8 and DE-AC03-78SFOOSIS.
Transcript of 373 MARK n ENDCAP ELECTROMAGNETIC CALORIMETERS·

373
MARK n ENDCAP ELECTROMAGNETIC CALORIMETERS·
G. Abrams, A. Baden, R. Birge, J. Boyer, F. Butler, G. Gidal, G. Goldhaber, J. Haggerty, D. Herrup, R. Jared, I. Juricic,
J. Kadyk, F. Kirsten, K. Lee, K. Mirk, M. Moebus, S. Olson, W. Pope, W. Schmidke, C. Sojourner, G. Trilling and D. Wood
Presented by J. Kadyk
ABSTRACT
A set of two electromagnetic calorimeters have been built and installed on the end-
caps of the Mark II detector at SLAC. One of these calorimeters was tested in a posi
tron beam and in a pion beam to determine the optimal operating conditions and the
performance characteristics. Each endcap consists of 36 layers of aluminum proportional
tubes, interleaved with 0.5 Xo lead sheets, arranged to lie along four coordinate direc
tions. The mechanical and electrical designs are described, and results given for the per
formance in the positron beam. The energy resolution obtained was
o(E)/E !:::' 18%/~.
I. Introduction
The Mark II detector has undergone a major upgrade in the past 1-1/2 years to
prepare for the demanding operation at the SLC collider at SLAC, due to begin opera.
tion near the beginning of 1987.1 AB part of this upgrade program, electromagnetic
calorimeters were designed and built at LBL for the endcap region of the Mark II, where
only two-layer shower detectors had previously existed. These endcap calorimeters
(ECC's) cover the angular region between about 15 0 and 45 0 from the beam axis, and
together with the existing liquid argon calorimeters (LAC's),2 provide electromagnetic
'Thill work was .uppor~.d in p...~ by ~h. U.S. D.p...tm.n~ or Enorgy und.. eon~raota DE-AC03-78SFlJOOG8 and DE-AC03-78SFOOSIS.

374
calorimetry over 9S% of the total solid angle.3 Although only an additional Illf 25% of
solid angle coverage is added, this ill expected to be of great importtace in the s~udy of
'lfJ decays. This is partly becaulle or the fact tht.t hermeticity haa been shown to be an
important factor in the interpretation of events, and partly because some of the more
interesting physics arises from events which concentrate in the email-angle re~on.
The principal design philO8Ophy for the EOO's were: (1) to extend EM calorimetry
beyond that of the LJ\.O's down to the smallest angle having tracking coverase with the
central drift chamber; (2) to match cloeely the energy and spatial resolutioJl of the LAC's
(IS%/~, and A9 - 4-8 mr); (3) to minimize the coet and the risks of delay,
leading naturally to a design that emphasizes known techniques.
II. Mechanical Design
A. Overall Geometry
Figure 1 is an isometric view of the Mark II detector, with some components with
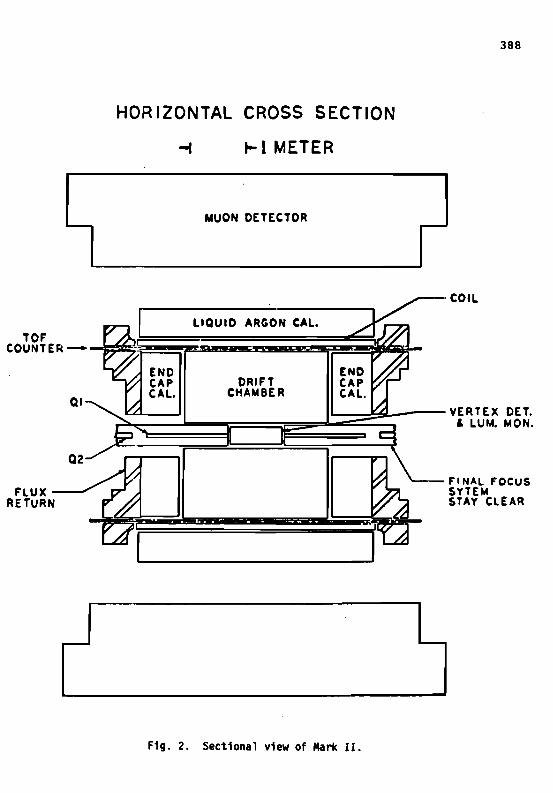
drawn or cut away for clarity. Figure 2 shows a sectional view alon~ the beam axis.
The ECC's are annular in shape, having ..pproximately .. 3 m outside diameter, 11.0.7 m
inside diameter, and an active depth of about O.S m. The design waa based upon gas
sampling calorimetry because this measurement technique ia capable of providin~ fine
resolution, projective geometry, and also the compactness needed to minimize the
amount of dead space between the LAO and ECC systems. Figure 3 exhibits the vari..
tion in radiation lengths vs. COfltt. showing that a minimum or 10 Xo is reached at an
angle of about 44· to the bean:' axis. The readout geometry was chosen to be from p~
jectively ganged sense wires of the aluminum tubes, i.e... "strip" geometry rather than
towers. This choice was made partly from the expectation of somewhat hisher costs and
375
more development for a tower geometry, and partly because a Monte Carlo study indi
cated that the strip geometry, with four coordinate directions, performed quite ade
quately.
B. Tube Size
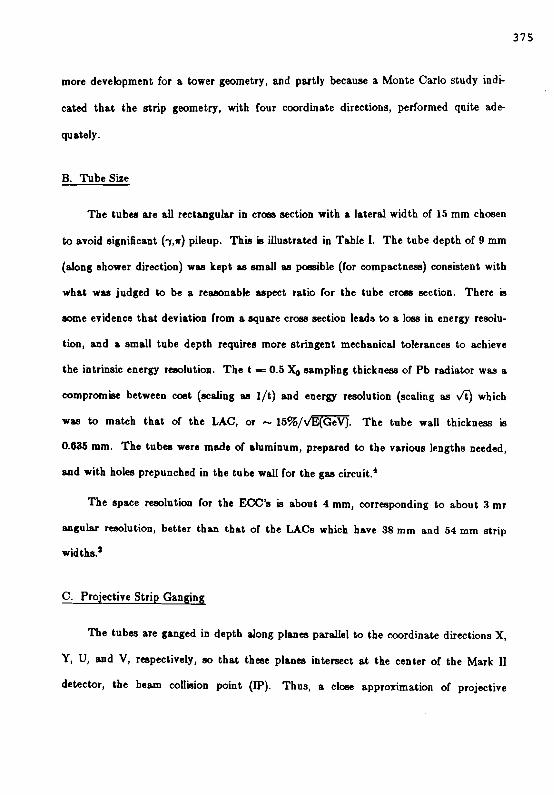
The tubes are all rectangular in cr088 section with a lateral width of 15 mm chosen
to avoid significant b,ll") pileup. This is illustrated in Table I. The tube depth of 9 mm
(along shower direction) W8l!l kept 8l!I small 8l!I pOllllible (for compactness) consistent with
what was judged to be a reasonable aspect ratio for the tube crOllll section. There is
lIOme evidence that deviation from a square cross section leads to a loss in energy resolu
tion, and a small tube depth requires more stringent mechanical tolerances to achieve
the intrinsic energy resolution. The t = 0.5 Xo sampling thickness of Pb radiator was a
compromise between cost (scaling 8l!I lit) and energy resolution (scaling &8 vi) which
W8l!l to match that of the LAC, or - l5%/~. The tube wall thickness is
0.635 mm. The tubee were made of aluminum, prepared to the various lengths needed,
and with holes prepunched in the tube wall for the g8l!l circuit.·
The space resolution for the ECC's is about 4 mm, corresponding to about 3 mr
angular resolution, better than that of the LACs which have 38 mm and 54 mm strip
widths.2
C. Projective Strip Ganging
The tubes are ganged in depth along planes parallel to the coordinate directions X,
Y, V, and V, respectively, 1IO that these planes intersect at the center of the Mark II
detector, the beam collision point (IP). Thus, a close approximation of projective

376
geometry is achieved without tower geometry.
D. Ga.nging
The ca.lorimeter readout is bllSed upon three distinct ganging segments in depth.
Proceeding from the IP outwards, the first two segments, which combine to form one
physical module of 20 layers, have X, Y, and V, V (at 4S' with respect to X, Y) coordi
nates with tube directions oriented in this order in successive layers to measure these
directions. Thus, tubes of the same coordinate direction are ganged together, and are
interleaved in depth with the others, there being 2 Xo between layers in the same ganged
channel. The third segment is another physical module of 16 layers, and has only coor
dinates X and Y. This scheme is summarized in Table II, which also indicates the extent
of longitudinal and lateral ganging.
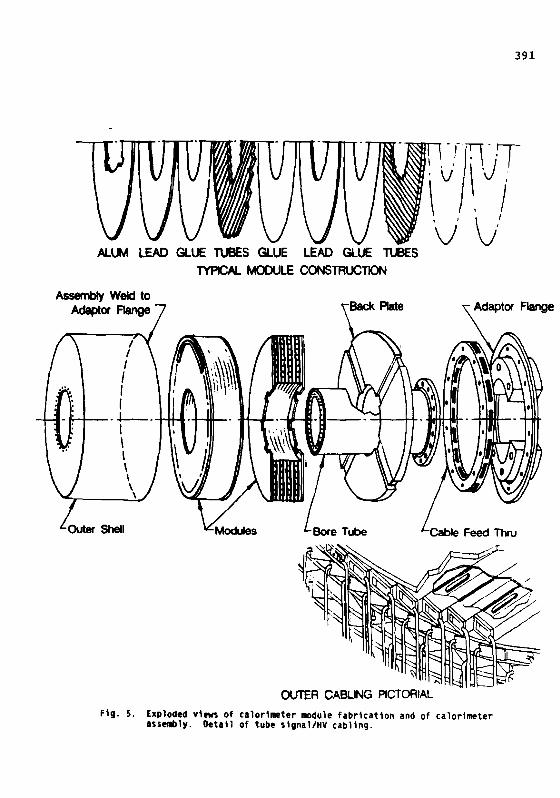
E. Layer Fabrication and Module Assembly
Each of the 36 tube layers is formed from two "D"-shaped sections (69 tubes each)
and two "C"-shaped sections (53 tubes each), as shown in Fig. 4. These sections are
made from individual tubes glued together by strips of thermal curing epoxy& cured at
about 250' F for one hour in a vacuum press built for this purpose. The tubes were
then wired with 50 #lm-diameter Stablohm 800 wire, and the wire crimped under 150g
tension in a 0.8 mm stainless steel capillary tubes (200 JIm-diameter hole) molded into
fiberglllSS-loaded epoxy feedthrough insulators.6 The individual "C" and "0" sections
were checked for gain uniformity using Cd HID sources, and then these sections were fitted
together to form complete layers of tubes. Alternating layers of tubes and lead sheet
were bonded together using epoxy curing at room temperature. This is illustrated in
Fig. 5. This WllS accomplished by saturating 0.008" thick fiberglass cloth with the

377
epoxy, and using this to form the finite glue-line thickness between each lead and tube
layer. Without this, the bond would have very little strength. It was necessary to pre
pump the epoxy to remove dissolved gases. Using this technique, about 1-1/2 layers of
the (lead plus tube) sandwich were bonded per day and allowed to cure overnight under
partial vacuum (about 10 psia). The wire centering tolerance requirement for gain uni
formity required that all tube layers be flat to about 0.025" and this was accomplished
by measuring the layers after each gluing operation, then shimming with additional
pieces or fiberglass cloth where needed to keep the next layer within the flatness toler
ance. The outer two covering layers of each module consisted of 1/4" aluminum plates
bonded in the same manner as described above, and these support the entire weight of
each module on the bore tube. The weight causes a shear force loading on each epoxy
interrace of about one psi, which gives a very high safety factor (l":::l 100) for rupture, and
the creep in the lead (antimony-loaded) is predicted to be negligible. Finally, the com
pleted modules weighing almost six tons each were lifted with specially-built vacuum
pickup and transport fixtures.
F. Gas Circuit
The gas Bow path is through slots cut into the 9-mm walls at alternate ends or the
tubes (see Figs. 4 and 5). The gas inlet is on the inner radius and the outlet at the outer
radius, the gas circulating through one "C" and one "D" section in each circuit giving
two circuits per layer. The gas is fed through the back plate into the bore tube, which
acts as a manifold communicating with 72 inlets. It exits at the outer radius of each
layer and is contained by the 1/16" stainless steel gas-tight shell enclosing the entire
calorimeter, and finally exhausts through the back plate. All potential external leak
problems are a.voided with this design, and an equalized gas flow through the gas paths
378
was insured by Bow and pre88ure drop measurements as each tube layer was glued into
place. Measures were taken to prevent parallel leak paths between the bore tube and
outer shell, which would short-circuit the intended gll8 path, and tests on the completed
modules showed these leaks to be negligible.
G. Mechanical Tolerances
In order to achieve the expected ~ 18%/v'E(GeV) energy resolution at the highest
energies p088ible at SLC, it is nece88ary to limit random gain variations to about ±5%,
which will contribute an rms error of about 1% to 17(E)/E. This WIl8 done by control
and monitoring of three mechanical parameters to insure the following tolerances:
(I) Tube inner narrow dimension: ±O.OO4"
(2) Sense wire diameter: ±I%(0.002")
(3) Wire centering in tube: ±0.025".
These mechanica.l tolerances were both mell8ured and calcula.ted, with consistent results.
The fabrica.tion was held to these tolera.nces by: (1) measuring the tube size with a.
strain-gauge feeler device pulled through the tube (sampling every 10th tube); (2)
measuring the wire resistance over a - 3 foot span; (3) measuring the Jlataeu of each
glued layer, and shimming when necessary (as discu88ed ea.rlier).
The "C" and "D" sections were individually checked for gain uniformity using
Cd 1lKl sources. Figure 611. shows a typical puise height distribution for Od10ll, and Fig. 6b
shows the response of a tube in which an Fe&& gain monitoring source has been
implanted. Gain determinations with Od10ll were precise to better than 1%. Figure 7
shows the distribution of gains for 30 "0" sections, found by fitting the Od10ll peaks.

379
III. Monitoring and Control of Gain
In addition to the mechanical control of gain variations just discuB5ed, temperature
and barometric pre55ure must be controlled and monitored. Gain varies with p, the gas
density, due to temperature and pre55ure changes:
AG = _ Ct Ap ~ _ 5 Ap . G P P P
The ECC's are both surrounded by heat shields kept at constant temperature. Thermis
tors are encapsulated within the modules as a means of monitoring changes of temper..
ture (to - 0.1 0 C) and temperature gradient within each ECC. There are also sensitive
pressure transducers across each ECC and a precision barometer as part of the inform..
tion readout. Finally, there are 14 Fe66 button sources (0.3 pC) glued into various tube
walls of each ECC, and these specific channels will be monitored to use the Fe" peak for
a direct observation of gas gain (for example, see Fig. 6b).
IV. Electronics7
Figure 8 illustrates the components of each signal channel. The signal cables are
typically 3 m long and are brought out through a gas seal in the back plate (see Figs. 4
and 5). These 0.1" diameter coaxial cables carry both HV and signal to the electronics
crates mounted on the endcap doors. There are a total of 1276 electronic chIJ-nnels for
each endcap. Each channel consists of several tubes ganged together, laterally and in
depth (see Table II). The number of tubes varies from 2 to 24 per gang. Different chan
nels will sample different fractions of the total shower energy, depending both on the
number of ganged tubes and the location of those tubes. This requires amplifiers of two
different gains and llubsequent equalization of the channel gains when the total energy is

380
summed. The ganged channels feed into charge-sensitive preamplifiers driving shaper
amplifiers. The output travels via about 25 m of twisted pair to SHAMS (sample-and
hold modules) read out by BADC's (l2-bit ADC's which can digitize and process up to
608 analog channels) via CAMAC.8 The preamplifiers and shaping amplifiers are cali
brated by injecting charge into the front end under CAMAC control. A fast sum signal
is taken from the shaping amplifiers to form an independent trigger based on an analog
sum of the total ECC energy in the first two sections. The gain of the preamplifiers and
shaping amplifiers is determined by the gas avalanche gain and the need to measure the
energy of 50-GeV electrons without saturation. The maximum charge which can be
mell8ured by the two gain types are 200 and 400 pC. However, saturation within the
calorimeter already requires the gas gain be low enough 80 that these limits are not
exceeded. The 12 bit capacity of the BADC's is just enough to accommodate the
dynamic range between a muon signal and a 5O-GeV shower in the amplifier with the
largest dynamic range. For example, this places the muon signal in channel 4, well above
noise, and the maximum shower pulse at about channel 2000, with another factor of two
for possible shifts in operating point.
V. Performance
A. Beam Tests
One ECC was tested in beams at SLAC: first in an e+ beam of 3, 5, 10, and IS
GeV, and later in a 1r- beam at energies of 2, 4, and 8 GeV. Results are presently avail
able only for the e+ data. The ECC was oriented to simulate particles produced at the
IP traveling in a straight line at an angle e with respect to the beam line and. striking
the ECC. The results presented here are based upon an analysis of the e+ test-beam

381
data.o
The positron beam at SLAC ("beam 19") is essentially pure e+, and has a very
small emittance (- 1 mm spot size) and momentum spread (~ - ±t%l The beam
intensity could be increased to obtain several e+ per beam-pulee, with a very short pume
« 30 liS rms). Hence beam pulees with several e+ could be used to simulate energy
deposits in exceee of the beam energy. Figure 9 shows an example of the ECC total
energy spectrum obtained. By fitting these peaks to find the mean value and width, and
subtracting the pedestal value, tbe energy resolution and linearity of reeponse to energy
deposit wae determined. This wae done for five gae mixtures, and the beet voltage and
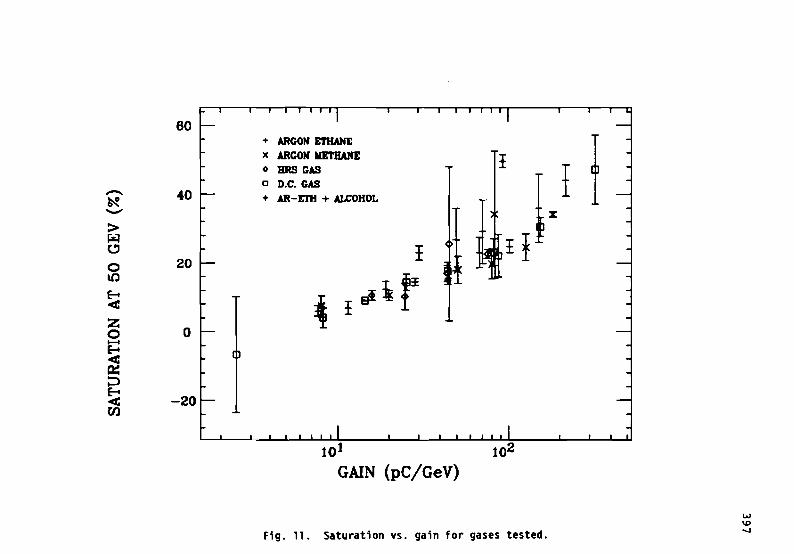
resolution found for each. The degree of saturation was found to depend only on the
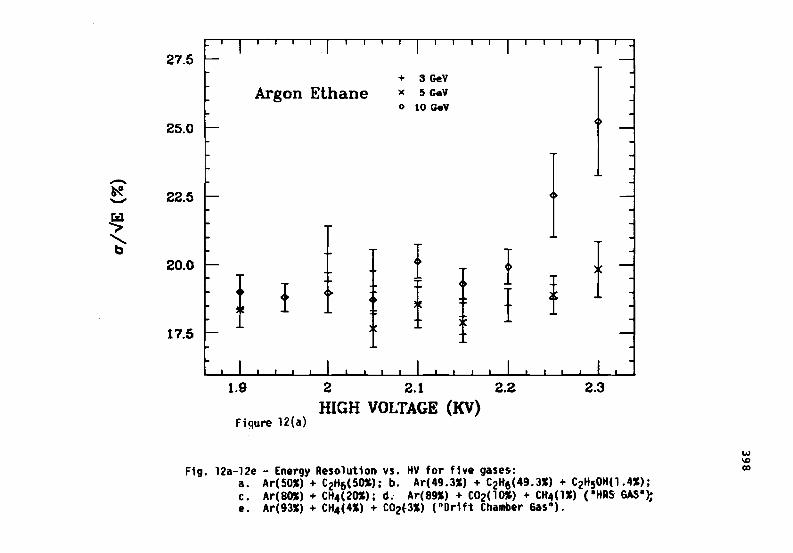
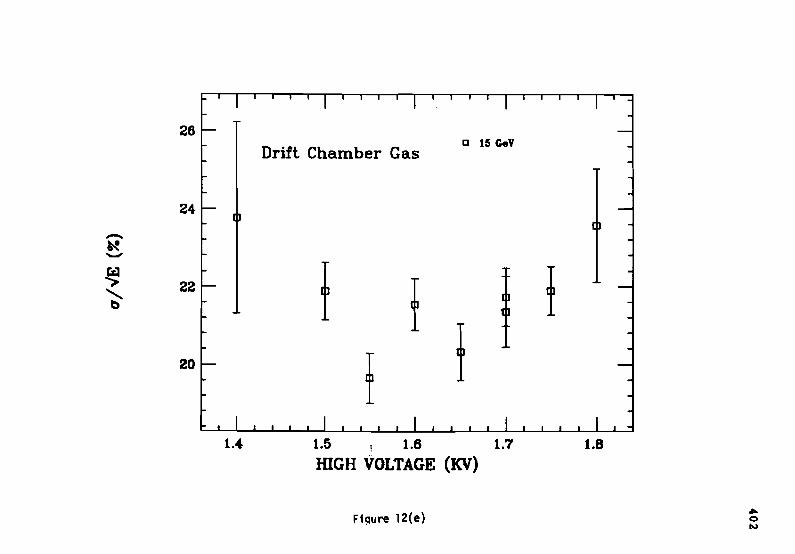
gain and not upon the gas. The resolution, corrected for saturation, generally described
a shallow minimum with respect to HV, and was nearly the same at the minimum for all
gases, C7(E)/~ t:::::1 18%, except one (93% A:r + 4% CRt + 3% CO2), which gave
C7(E)/~ t:::::1 20%. Saturation was about a factor of two worse than expected: at a
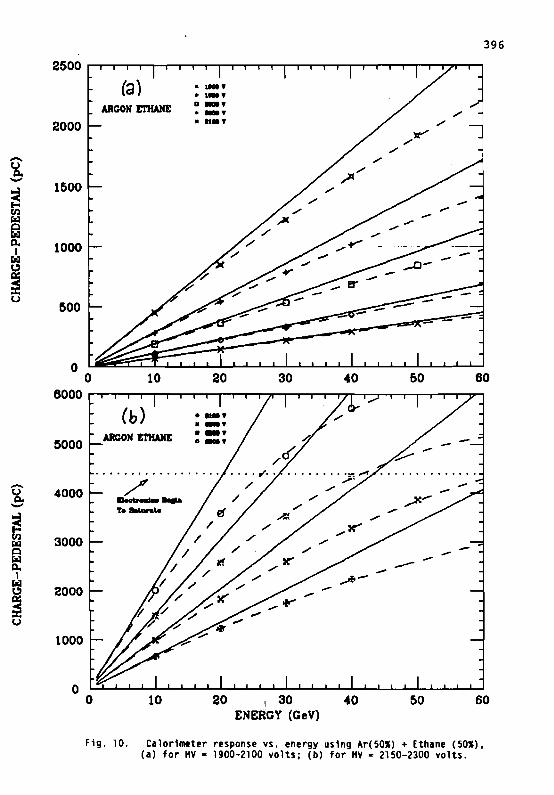
gas gain of about 25,000, the deviation from linearity is about 10% at 50 GeV. An illus
tration of how the linearity changes witb voltage for Ar(5O%) + C2Hs(5O%) is seen in
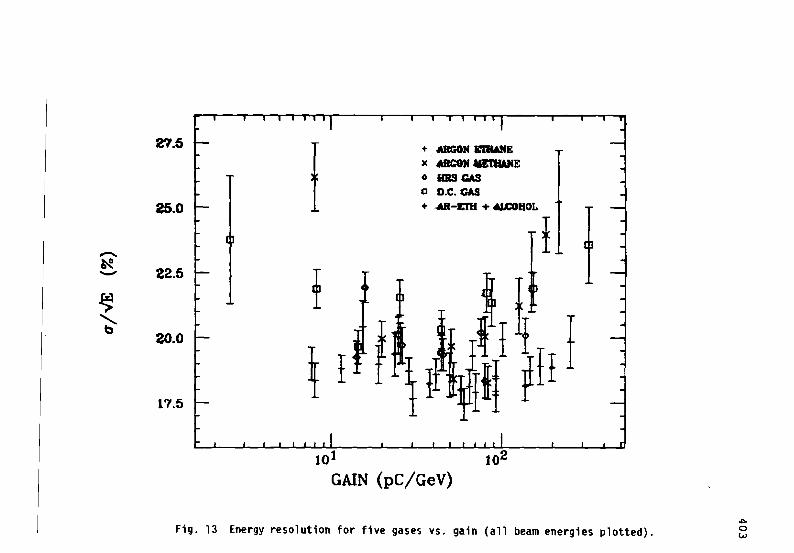
Fig. 10, and a plot of saturation for all g88es is shown in Fig. 11. The variation of reso
lution with voltage for the five gases can be seen in Figs. 12a through 12e, and a similar
plot vs. gain can be seen in Fig. 13. Within errors, the response and energy resolution
both appear to be constant with respect to the angle of incidence for e+ from the IP hav
ing e = 20 0 40 ° where the shower is fully contained. _
As a result of these beam tests, the gas Ar(89%) + COi10%) + CH4(1 %) W88
cbosen, since it appears to give as good resolution as any other gas, is non-flammable,
and bas a higher gain than most gases, allowing a lower operating voltage. A1eo, it can

382
be obtained at much higher prell5ure than, for example, Ar(50%) + C2H6(50%), allowing
a running period about three times longer than for the latter gas.
The results from the lI'- beam test are not yet analyzed.
B. Performance in the Mark II Detector
There have been BOme data collected from colliding beams at PEP, as well as
cosmic ray eventa. A tracking algorithm is used which searches for local maxima in
pulse height in each coordinate of the /rOfll section, and then (X,Y) and (U,V) intersec
tions are found corresponding to these maxima. If these intel'8ection points lie within ±1
tube width, then this determines .. point on a "class AU track. Lower class tracks
fulfilling leBB stringent requirements are also determined. Other intersections are located
in the middle and back sections along the line connecting the IP and front section inter
sections. These points taken together form tracks. Tracks are also formed by following
drift chamber tracks correlating with intersections found independently in the ECC's.
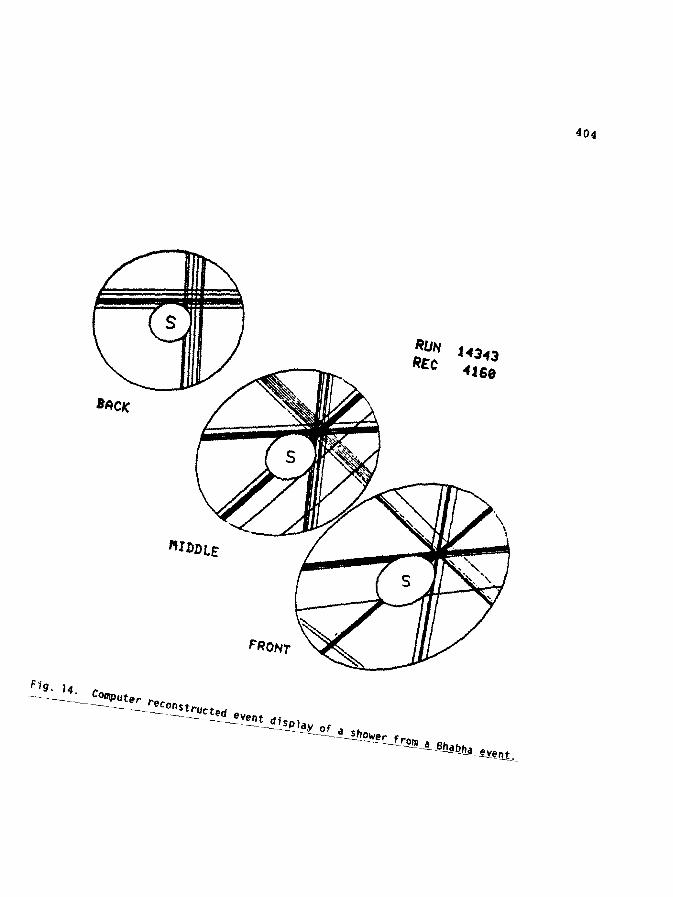
Both minimum ionizing cosmic ray tracks and energetic showers from Bhabha events are
found with these techniques. A reconstructed Bhabha event is illustrated in Fig. 14.
VI. Summary
A set of two endcap electromagnetic calorimeters has been designed, built, tested
and installed at the Mark II detector at SLAC in preparation for the first SLC experi
ment. Each calorimeter consists of 36 layers each of 0.5 Xo lead sheet and aluminum
proportional tubes 15 mmX9 mm in crOBB section. There is a total of 8784 tubes per
calorimeter. Four coordinates are used, with tubes ganged projectively toward the
interaction point, for a total of 1276 channels per calorimeter. The energy resolution

383
achieved is O'(E)~!::! 18%.
Acknowledgements
We wish to give our thanks to Otto Draeger and his IItaR' in the LBL Allllembly
Shop for their very IIkillf'ul and professional elort in fabricating the endcap calorimeters.
We aIIIo wish to thank Roger Gearhart for his help with the poIlitron beam test, and Ber
nie Denton and Sean Dyer for their _istance in setting up, moving, and mounting the
calorimeters in the Mark II detector.
References
1. Mark D/SLC Propollal, April 1983, CALT 68-1015.
2. G.S. Abrams, et.aI., IEEE Tranll. Nucl. Sci. MS::2i. No.1, 309(1978).
3. The solid angle coverage for EM IIhowers will extend down to 50 mr from beam axis
upon the addition or a amall-ehower counter at SLC.
4. The manufacturer of the tubes is A.T. Wall, Warwick, R.I.
&. American Cyanimide product FMI23-5.
6. The technique or crimping Stablohm 800 wire (California Fine Wire Co.) in IItain
less llteel capillary tubes W8ll learned from the U.C. Santa Cruz group who ueed it
very successfully in building the Mark In calorimeters: D. Bernstein, et.aI., NIM vol.
au. 198.,301-318.
7. R.C. Jared, et. ai, "Mark II End Cap Calorimeter Electronics," 1985, IEEE Sympo
Ilium on Nuclear Science.

384
8.
9.
E.L. Cienel'Oll, et.al., IEEE Trans. Nuel. Sci., ~ No.1, 413(1977)..
Darien Wood, et.al., Mark ll/SLe Note *99, "Resulta or End Cap Positron Beam
Test."

385
Table I
Ml8lcleDtl8catloD Due to Particle Overlap
Pileup or r* and q ill same tube channel which can result ill r* miaidentiBcation u e:l:, from 1fJ deeay .imula&ed eventl. Tube width - 15 mm. P - ,..:t momentum, PT = traD8Yene momentum or ,..:t relative to thrlllt axil.
Misidentification P(OeV/c) PrtGeV/ c) Probability (%)
1-3 <D.6 3.2
3-11 <0.5 1.3
1-11 0.5-1.0 0.2
>11 all
Qt 0.2
aU >1
TableD
TubeQ-a....
Section
LakraJ CanlPnl (tubes)
Lonlitudillal Gulinl (tubea)
Depth illXo Layers Channell/EC
Front (X,Y,U,V) 1 2 4 8 784
Middle (X,Y,U,V) 2 3 8 12 384
Back (X,Y) 3 8 8 18 128
Totu. 18 38 1278

386
Fic·I.
Fic·2.
Fic·3.
Fic·4.
Fic. 5.
Fia. 6.
Fia·7.
Fia·8.
Fic. i.
Fla. 10.
Fis·n.
FIGURES
Isometric view or Mark U.
Sectional view or Mark II.
Radiation lenltbs, IIlUDpling layers vs. cos9.
"D" and "C" sections in a layer.
Exploded views or calorimeter module rabrication and or calorimeter 888embly. Detail of tube signal/HV cabling.
(a) A pulse heisht distribution from one tube or a layer section tested with Cd l •• (b) A similar spectrum for a tube having a 0.3 pC Fe" gain monitoring source installed.
The distribution or relative gains for 30 "c" sections found by fitting the Cd l • peaks (as in Fia. 6a.).
Block diaaram of the electronics for an individual signal channel.
Pulse heicht distribution from the ECC in the e+ test beam tuned to 10 GeV.
Calorimeter respoDM vs. enerl1 uain, Ar(5O%) + Ethue (50%), (a) for HV - l1JOO.2100 yol&8; (b) for HV - 2150-2300 volta.
Saturation vs. gain for IaseB tested.
Fise. 12a-12e. Enel'81 Reeolution ft. HV for five pees: L Ar(&O%) + CtH.(&O%); b. Ar(49.3%) + CtHe(49.3%) + C~60H(1.4%); c. Ar(8O%) + CH..(2O%); d. Ar(8e%) + COs(IO%) + 00.(1%) ("HRS OAS"); e. Ar(i3%) + CH..(4%) + COs(3%) ("Drift Chamber Gas").
Fig. 13. Energy reeolution for be gllBe8 vs. gain (all beam energies plotted).
Fig. 14. Computer reconstructed event display 01 a Shower from a Bhabha event.

MUON DETECTOR
FLUX RETURN
SCINTILLATION CTRS.
DRIFT CHAMBER
FINAL FOCUS SYSTEM
END CAP CAL. LIQUIDARGON- CAL.
FLUXAETURN
w co
Fig. 1. Isometric view of Hark II. -.I
388
HOR IZONTAL CROSS SECTION
t-l METER
MUON DETECTOR -
FLUX RETURN
COIL
LIQUID ARGON CAL.
END CAP DRIFT CAL. CHAMBER
1~~~~~3~~~~~~~~~f--VERTEX DET.;' & LUM. MON.
FINAL FOCUS SYTEM STAY CLEAR
-
Fig. 2. Sectional view of Mark II.

en == 240' c Q)-5 20
"0
Total calorimeter thickness and samples vs. cos 8, LA and EC calorimeters
\~\C~t\1
:2 1"0 101 T~(!L'l!Irn.R.~ .... ________,
o 16 LA -------- I~ ------ I
~ Vr-------,
I I
• I • , I .. I , ~ 12 I : .- 1 U I ,~
~ 8 ~- .'.Q)
E
2 ~
4 o
U
00
-en ~ Q) >.2-en Q,)
40 0. E 0 en Q)30 ~
-~
en0 ~
20 0 ~
Q) .Q
E10 :::3 C
-0-~0.1 0.2 0.3 0.4 0.5 0.6 0.7 0.8 0.9 1.0
Cos 8 w Q)
\D
XBL lI33-122 Fig. 3. Radiation lengths, sampling layers Ys. cos 9.

390
Tube Section Fabrication Technique
,," . "
J!' {FM 123-5\= B-Stage Epoxy Strips """~~4--I- ~
Gas Supply Port (2 PLCS/layer)
"C" Section
Fig. 4. "D" and "C" sections in a layer.
"0" Sectio"
Gas Out (2 PLCS/layer
I Outer Gas II (1/1611' 5.5.)
391
\~'rrT 'V' \/
ALUM LEAD GLUE TUBES GLLIE LEAD GLUE n..eeS TYPICAL MODULE CONSTRUCTION
Adaptor Flange
OUTER CABLING PICTORIAL
Fig. 5. Exploded yl~s of calorimeter module fabrication and of calorimeter assembly. Detail of tube slgnal/HV cabling.

392
(a)
80.
(b)'01
604
SOl
401
:sOU
204~
104
\.. -_ ...... 1 0.20.40.6 0.8 1 1.2 J.4 1.6 1.1.' 2.10 3
Fig. 6. (I) A pulse hei8ht distribution from one tube of I llyer section tested with Cdl 9. (b) A s1m1llr spectrum for I tube hiving I O.3~C Fe55 gl1n monitoring source instilled.

393
.-' .
J.l1.9 CEES, MEA", RI8HT SID!
Fig. 7. The distribution of relative gains for 30 "c" sections found byfitting the Cd l09 peaks (as in Fig. 6a.).

-TEST Pl.LSES
IN ON DlIICH' ...~~-------- -----------. CQ.NTING
HOUS£
IIVWV\l 1/32 SH'tIIr-----....IooI MIle
15
i .....
CFtf'lC== !!l
J~
TEST Pl.L.5E
COfTRClL
)(II.. 1511-461'
w Fig. 8. Block diagram of the electronics for an individual signal channel. ..'"

'150
U 100Pt N· '-.. U) E-t Z ::J o o
50
to GeV Positrons Argon ,Ethane
1900 Volls
141 I ", 'L' , "" t .1.,· I ct. I AtI I ....... urn ? IS I I
100 200 300
TOTAL CHARGE (pC)
0' I, , I
o 400 IN ID
Fig. 9. Pulse height distribution from the ECC in the e+ test beam tuned to 10 GeV.
VI
I
396
2500
2000
--tt 1500 ~ en r:a::l Cl r&I 0. 1000I r&I
~ u
500
0
(a) ARCONEnIANE ,-
,-,-
r,-,-
0 10 20 30 40 50 60 6000
~ooo
-u 0.- 4000
~ en r:a::l 3000 ~ 0. I
i 2000
u
1000
0
ARGON ETHANE
/'m_.... T.-.a-..
-----
0 10 20 I 30 40 50 60 EME~GY (GeV)
Fig. 10. Calorimeter response vs. energy using Ar(501) + Ethane (501), (a) for HV = 1900-2100 volts; (b) for HV = 2150-2300 volts.
60
-.. 40 ~-> ~ t.'
20o ltJ
E-t < Z o o-Eo
~ ~ E-t < -20
+ ARGON ETHAN"E )( ARGON METHANE o BRS GAS
o D.C. GAS
+ AR-E'I1:I + ALCOHOL
I
4 I.,Ii<r
!
i ±I
101 102
GAIN (pC/GeV)
IN \D
Fig. 11. Saturation ys. gain for gases tested. -.J
CI.l
27.5
25.0
.- ~ 22.5-~ ~
20.0
Argon Ethane
!I17.5
+ 3 GeV )( 5 GeV
o 10 GeV
! f
I I! f !
1.9
Fiqure 12(a)
2 2.1
HIGH VOLTAGE (KV) 2.2 2.3
IN ID
Fig. 12a-12e - Energy Resolution vs. HV for five gases: CD
a. Ar(50S) + CZH6(5OS); b. Ar(49.3S) + C2Ha(49.3S) + C2HSOH(1.4S); c. Ar(8OS) + CH4(2OS); d. Ar(89S) + C02(lOS) + CH4(lS) (aHAS 6ASa~ e. Ar(93S) + CH4(4S) + C02f3S) (nDrift Chamber Gasn).

399
)(
x
-0.c: O (J
< + Q)
r:= CO
..c= +' ~
r:= 0
~ ~
)(
c»...
)(
1)(
cD....
)(
*
~...
.N~N~ ~
~ ~ 0 > ::c ~-:= ....
N
~
..c ~
N
CIJ I~ c:n .~
I.L.

28 L.
281 I Argon Methane )(
c 5 GeV
15 GeV
- 24~ ~ ~ "-J
~ ~
22~
20 t
181
t t
f I
I I
1.7 I I I I I I I I I I
1.8 1.9
HIGH VOLTAGE (KV)
I I I I l 2
...Figure 12(c) 0 0

401
)( ~-It)
8 )( r-:... --~ !! tzJ
0"'~ I I IJ' r-: -0 ...... N)( a ~~
...::I
> <II0 ~
.-::I C)
u::c: 0rn
«I I 8 I It:l ~ -::c:t!J * -en
c:: ::t:
)(8 ~-N ... ce~
C\I '" C\I C\I 2 ... ...
26
Drift Chamber Gas o 15 GeV
24
-~-~ 't;
22
f ! I! 20 ! I
1.4 1.5 ! 1.6 1.7 1.8
HIGH VOLTAGE (KV)
F1~ure 12(e) .... o IV
27.5
I25.0
-~22.5 - !~
~ 20.0
~ I 17.5
i" .aGOM E'l1IAJtE )( dCOM~
o HIlS GAS o D.C. GAS
f1~1 Irijij 101 102
GAIN (pC/GeV)
oFig. 13 Energy resolution for five gases vs. gain (all beam energies plotted). ~
w
404