Climate cyclicity in late Holocene anoxic marine sediments from the ...

Berger, W.H., Kroenke, L.W., Mayer, L.A., et al., 1993Proceedings of the Ocean Drilling Program, Scientific Results, Vol. 130
37. CLIMATIC CYCLICITY AT SITE 806: THE GRAPE RECORD1
Larry A. Mayer,2 Eystein Jansen,3 Jan Backman,4 and Toshiaki Takayama5
ABSTRACT
We used the continuous saturated bulk density records collected by the gamma-ray attenuation porosity evaluator (GRAPE)at Ocean Drilling Program Site 806 on the top of the Ontong Java Plateau to evaluate the continuity of the recovered cores andto splice together a complete section from the multiple holes drilled at the site (for the upper 165 m, this is equivalent toapproximately 0-5 Ma). The lack of offset in core breaks (between the 9.5-m-long, successive cores) from hole to hole madesplicing difficult, and the results are not unambiguous. The composite section was converted to a time series by usingbiostratigraphy and supplementing this with oxygen-isotope datums for the interval between 2 and 5 Ma. Evolutionary spectragenerated from the composite section clearly indicate the presence of Milankovitch frequencies throughout the record. We chosea final age model that was most consistent with a Milankovitch model but have not, as yet, spectrally tuned the data.
The GRAPE (saturated bulk density) changes at Site 806 are the result of changes in grain size, with density decreasing asgrain size increases. We attribute this to the removal of fine particles by winnowing, leaving a greater percentage of large hollowforaminifers behind—"the winnowing effect." This is in contrast to the "dissolution effect," which breaks up large hollowforaminifers into fragments but merely transfers intraparticle porosity to interparticle porosity and thus shows significant changesin grain size without significant changes in density. A 300-k.y. piston core record reveals that during this time interval increasedwinnowing has been associated with glacials and 100-k.y. cyclicity. For the time interval from 5 to 2 Ma, enhanced winnowingcontinues to be associated with isotopically heavy intervals dominated by 41-k.y. (obliquity) variance. In this band, the winnowingrecord is highly correlated with the ice-volume record, particularly since the onset of Northern Hemisphere glaciations. Beforethat time, the grain-size record continues to show variance in the obliquity band whereas the oxygen isotope record shows a shiftto the dominance of precessional frequencies. We suggest that the winnowing signal is a response to increased thermohalinecirculation and benthic storm activity associated with enhanced north-south thermal gradients during times of climatic degradation.
INTRODUCTION AND BACKGROUND
The Ontong Java Plateau is a massive volcanic edifice in thewestern equatorial Pacific that has collected an almost 1-km thicksequence of nearly pure pelagic carbonates over the past 100 m.y.This thick, relatively well-preserved accumulation of pelagic car-bonate contains a detailed record of the history of the ocean andclimate (much of the plateau has remained above the calcite com-pensation depth for most of its history). Because of the uniquetopographic and geographic characteristics of the plateau, it has beenthe focus of numerous paleoceanographic studies, the most recentof which is Ocean Drilling Program (ODP) Leg 130 (Berger et al.,in press). The goal of these studies has been to reconstruct, throughthe use of a number of paleoceanographic proxies, a detailed historyof the changes in ocean circulation, ocean chemistry, and climate inthe region and to use these reconstructions to draw inferences aboutglobal conditions.
To construct a detailed time series of the primary paleoclimaticproxies (e.g., abundances and isotopic composition of microfossiltests, carbonate content, and grain size), closely spaced, discretesamples as well as expensive and time-consuming preparation andanalyses are required. The constraints of time and money and thephysical limits of sample size have resulted in a trade-off betweensample density (paleoclimatic resolution) and the time interval overwhich the study is conducted (i.e., extremely high-resolution studieshave been limited to relatively short intervals of high sedimentation
1 Berger, W.H., Kroenke, L.W., Mayer, L.A., et al., 1993. Proc. ODP, Sci. Results,130: College Station, TX (Ocean Drilling Program).
Ocean Mapping Group, Department of Surveying Engineering, University of NewBrunswick, P.O. Box 4400, Fredericton, New Brunswick E3B 5A3, Canada.
3 Section B, Department of Geology, University of Bergen, Allegaten 41, N-5007Bergen, Norway.
4 Department of Geology, University of Stockholm, S-106 91 Stockholm, Sweden.5 Department of Geology, College of Liberal Arts, Kanazawa University, 1-1
Marunouchi, Kanazawa 920, Japan.
rate). Recently, however, we have seen that the near-continuous,gamma-ray attenuation data (GRAPE) collected from cores on boardthe JOIDES Resolution can be used to produce extremely high-reso-lution paleoclimatic time series very rapidly and over long sectionsof the geologic record (Mayer, 1991). In this paper we take a detailedlook at the GRAPE record of Site 806 (0°19.11'N, 159°21.69'E,2520-m water depth) on the Ontong Java Plateau and explore itspotential as a paleoceanographic tool.
The gamma-ray attenuation porosity evaluator (GRAPE) was origi-nally developed by scientists at the Marathon Oil Company (Evans,1965) and has been used on board the JOIDES Resolution during theOcean Drilling Program and on its predecessor, the GLOMAR Chal-lenger, since the earliest legs of the Deep Sea Drilling Project (DSDP)(Evans and Cotterell, 1970). Basically, the system consists of a com-puter-controlled, motor-driven track that moves a whole core betweena focused gamma-ray source (137Cs) and a scintillation counter. As thecore moves between the source and the scintillation counter, a near-continuous measure of the attenuation of gamma rays is recorded as afunction of depth in the core. The spacing of these measurements is afunction of the speed of the track and the length of the count; typicallyreadings are taken every 0.5 to 2 cm. The attenuation of gamma raysthrough the core can be directly related to the saturated bulk density ofthe sediment (wet weight per unit volume) if a constant mineralogicalattenuation coefficient is assumed (quartz is used for the ODP system).For details of the theory of gamma-ray attenuation, the reader isreferred to Evans (1965), Harms and Choquette (1965), Preiss (1968),and Brier et al. (1969); for details of the DSDP/ODP system, see Boyce(1973). The GRAPE system presently installed on the JOIDES Reso-lution is incorporated into a multisensor track (Schultheiss andMcPhail, 1989) that also collects near-continuous magnetic suscepti-bility and compressional wave velocity data.
Despite the fact that the GRAPE can produce nearly continuousprofiles of saturated bulk density, data from the DSDP/ODP systemhave rarely been used in paleoceanographic studies. In part, this mayhave been as a result of the intimidating volume of data produced bythe system, but most probably it is because the GRAPE system was
623
L.A. MAYER, E. JANSEN, J. BACKMAN, T. TAKAYAMA
Carbonate (%)
20 40 60 80 100
Q.OQ
Figure 1. Example of prediction of carbonate content from GRAPE data, Site574. Solid line is the predicted carbonate data, and dashed line connectsdiscrete samples measured with carbonate bomb. GRAPE prediction has tentimes the resolution of discrete samples. See Mayer (1991) for details.
in the domain of the "physical properties specialists" and not viewedas a paleoceanographic tool. In an examination of GRAPE data fromDSDP Leg 85 in the central equatorial Pacific, however, Mayer(1991) demonstrated that in this environment, the GRAPE data canbe accurately transformed to percentage calcium carbonate andthus used to generate long (4-5 m.y.), ultra-high-resolution (500-1000 yr sample interval) time series of carbonate content, an impor-tant paleoceanographic parameter (Fig. 1). It was also shown thatthese long, high-resolution time series could be used to examine thetime-varying response of the ocean system to orbital (Milankovitch)forcing over a time interval and at a resolution not achievable before(Fig. 2). The applicability of the GRAPE/carbonate relationship hasbeen refined and extended to the equatorial and north Atlantic andthe continuous, detailed records produced have, in turn been usedto "tune" the stratigraphy (Herbert, in press; Herbert and Mayer,in press).
GRAPE data can also play another extremely important role inpaleoceanographic studies by providing a means to evaluate thecontinuity of the recovered section. A primary goal of any paleo-ceanographic drilling program is to recover the most complete andundisturbed section possible. Unfortunately, it has been shown that,even with the advanced hydraulic piston corer (APC), inevitable gapsoccur between the successive 9.5-m cores (Heath et al., 1985; Rud-diman et al., 1987). To insure 100% recovery, each site is typicallydrilled two or more times, with the core breaks offset. The near-con-tinuous nature and large-amplitude fluctuations characteristic of theGRAPE records in the central Atlantic and Pacific make these records
an ideal tool for evaluating core gaps and for constructing morecomplete "composite" sections.
In this paper we will (1) examine the use of the GRAPE record forevaluating the completeness of core recovery and for constructing a"composite" section and optimum time scale; (2) look at the sourceof the saturated bulk-density variations that create the GRAPE signalin Ontong Java Plateau sediments; and (3) explore the paleoceano-graphic significance of the cyclicity in the Site 806 GRAPE record.
METHODS AND APPROACH
Initial Data Capture and Processing
On Leg 130, the multisensor track speed was such that multiple(2-10 depending on the other sensors activated at the time) attenu-ation (directly converted to saturated bulk density) readings weremade at approximately a 1-cm sample interval. These data werelogged onto a personal computer, section by section, and transferredto the shipboard VAX computer at the completion of each hole.Processing on the VAX included the concatenation of each sectioninto a complete profile as a function of depth in hole, the removal ofobvious outliers (out of the range of 1.2-3.0 g/cm3), the averaging ofall readings at the same depth, and finally the application of a 10-pointmoving average to apply some smoothing to the data. In the courseof this processing, the uppermost section of each 9.5-m core wasflagged as experience has shown us that these upper sections areparticularly susceptible to core disturbance. Smoothed data were thentransferred back to Macintosh format for further display and manipu-lation. Thus, the primary working data file is a 1-cm sample interval,10-point smoothed data set of saturated bulk density vs. depth values,with the uppermost part of each 9.5-m section flagged.
Construction of Composite Section
In an attempt to assure complete core recovery, three parallel APCholes were drilled at Site 806 (Holes 806A, 806B, and 806C).Unfortunately, as will be shown below, the core breaks were not welloffset, and it is difficult to guarantee complete recovery of thesection. In part, this was a result of the inability to monitor, in realtime, the output of the continuous core scanners of the multisensortrack. For a subsequent ODP paleoceanographic cruise (Leg 138),specialized software and work stations were developed to monitor,in near real time, the output of the laboratory core scanners. Usingthis approach, Leg 138 scientists were able to guide the drillersactively and to assure complete recovery of the section. The readeris referred to Hagelberg et al. (in press) for a complete discussion ofthe approach used on Leg 138.
The construction of a composite section begins with the identifi-cation of a number of "events" on the GRAPE record. Figure 3 showsan example of this process from the interval between 20 and 30 mbelow seafloor (mbsf) in Holes 806A, 806B, and 806C. Events arematched from hole to hole based on visual correlation; in makingthese correlations, we try to match both the shape and the absoluteamplitude of the curves. Experience has shown us that material isoften missing (from centimeters to meters; see Hagelberg et al., inpress) in the gap between cores, and that the sediment recovered inthe upper part of each 9.5-m core (Section 1) is often disturbed. Thisdisturbance is particularly evident in the plot of Hole 806B in Figure3. Core disturbance typically results in decreased saturated bulkdensity, and thus we tend to be more suspicious of low-density valuesthan we are of high-density values. In matching parallel holes, wemaintain the integrity of the 9.5-m core length but allow the positionof the core breaks to float. We shift one core against the next and tryto maximize fit. At this stage we do not stretch or shrink the curvewithin a 9.5-m core length, though clearly differential stretching andcompaction of core material occurs. Figure 3B shows Holes 806A,806B, and 806C shifted for maximum fit. Although some peakmatches are unambiguous, others are clearly problematical. The
624

CLIMATIC CYCLICITY AT SITE 806
zsm
0270
O090
l k 40kPeriod (years)
2Qk
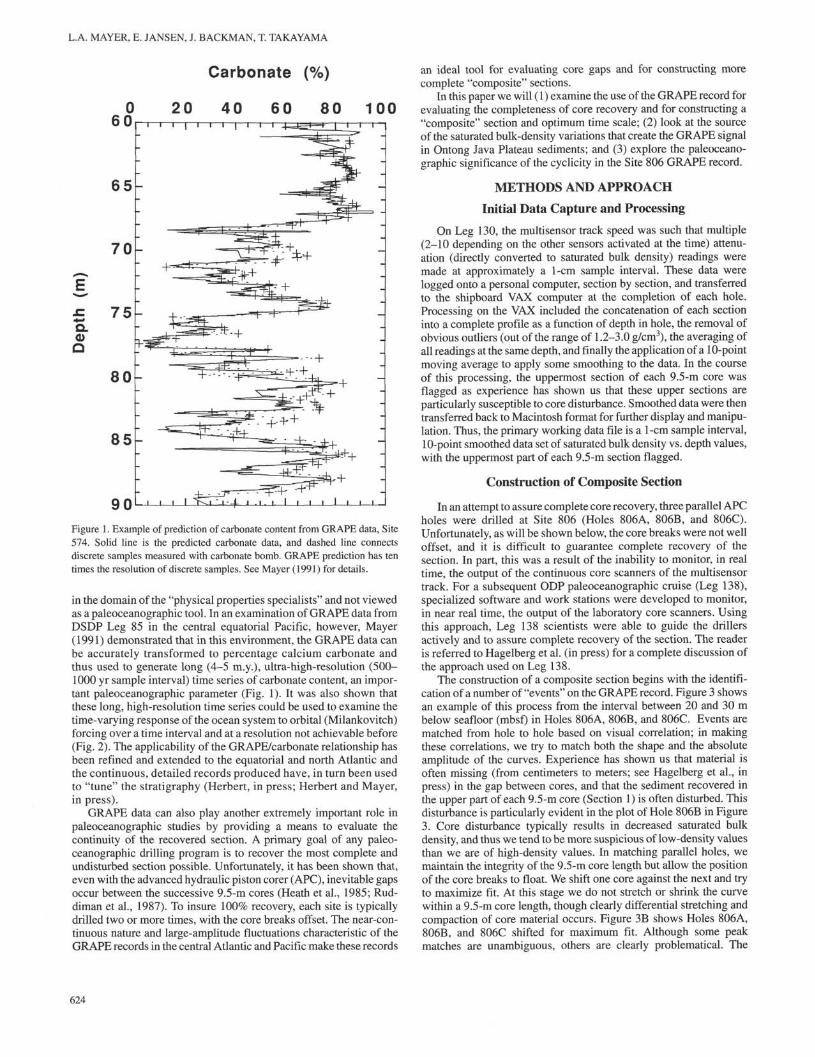
Figure 2. Example of evolutionary spectra based on GRAPE data (convertedto percent carbonate) from DSDP Site 573. The first spectrum (bottom offigure) represents the time interval from 90,000 to 900,000 Ma. Each succes-sive spectrum represents an offset of 90,000 yr (90%) and a 900,000-yrwindow. The age axis is keyed to the beginning of each window. The spectraare variance conserving.
problems are most serious in the region of the core breaks (see Fig.3A), but unfortunately at Site 806 almost all of the core breaks inHoles 806A, 806B, and 806C overlapped (rather than the ideal, whichis a 3-4 m offset). Thus, the multiple holes cannot resolve thisambiguity and guarantee continuous core recovery. Accepting thiscorrelation between holes, we see that about 1 m of material is missingbetween Cores 13O-8O6B-3H and -4H, 2 m of material is missingbetween Cores 130-806C-3H and -4H, and about 0.7 m is missingbetween Cores 130-806A-3H and -4H.
In the upper 150 m of Site 806, approximately 70 events wereidentified and, through the process described above, a compositesection was constructed. In constructing the composite, the philoso-phy was to avoid core breaks (in the few intervals where the coreswere properly offset) and to maintain a continuity of amplitude aswell as wave form. Where possible, we used Hole 806B because mostdetailed isotopic studies were conducted on this hole. The depths ofthe major events identified in their respective holes is presented inTable 1; the construction of the composite section is described in Table2. It is important to note that when the composite is constructed, anew depth scale is generated. Following the lead of the Leg 138scientists (Hagelberg et al., 1992), we will refer to this depth scale asmeters composite depth (mcd). Figure 4 illustrates the depth of eventsin Hole 806B vs. their depth in the composite section.
20.0 22.0Depth (m)
1.60
1.55
20.0 22.0 24.0 26.0
Depth (mbsf)
28.0 30.0
Figure 3. A. Plot of GRAPE density vs. shipboard depth for 10-m intervals inHoles 806A, 806B, and 806C. Matched events are marked by numbers. Flagbars indicate the position of uppermost section of each core (position of breakbetween two successive APC cores). B. Construction of composite sectionthrough splicing, Site 806. Curves have been broken at core breaks and allowedto shift so as to achieve best fit (by eye) of events. Once correlations are made,the section was spliced together to achieve continuous record.
Conversion to Time Series
If we are to explore the paleoceanographic significance of the Site806 GRAPE data, we must place the data in a stratigraphic frame-work. Our approach to placing the data within a time frame has beento begin with the best stratigraphy possible on the individual holesand then map these stratigraphic picks onto the spliced depth scale.Unfortunately, the severe reduction of magnetite, producing dissolvedand reduced iron at Site 806 results in no measurable magnetostratig-raphy below about 10 mbsf (Kroenke, Berger, Janecek, et al., 1991).Therefore, we are limited to biostratigraphic picks for our initialestimates of age. Our initial time scale was based on the few nanno-fossil datums determined in detail in Hole 806B (Table 3). The agepicks for the nannofossil datums were taken from Backman andShackleton (1983) with calibration to the time scale of Berggren etal. (1985). The age of the last occurrence (LO) of Discoaster pentara-diatus (2.39 Ma) is from Raymo et al. (1989).
These biostratigraphic picks were mapped onto the new spliceddepth scale (mcd) for Site 806, thereby constructing a new age/depthtable (Table 3). Based on this initial time scale, we converted the datafrom the depth domain (mcd) into the time domain by linear interpo-lation between age control points and calculated the spectral compo-
625

L.A. MAYER, E. JANSEN, J. BACKMAN, T. TAKAYAMA
Table 1. List of events used to correlate Holes 806A,806B, and 806C.
Event
0.515R61.01.11.31.51.61.8
202.1
262728303234.2T
3639
4.141.541.641.84445464850525357585960
6.16264
6.6687071737576777880818284858789909294959799
101104105106107108109112
Hole806A(mbsf)
3.5411.3013.2217.4020.2121.3322.2823.3226.2527.4328.7831.1932.1234.9536.3136.7437.5438.3341.8943.2548.0948.9949.5550.5050.9051.5653.6054.5554.8755.6156.6757.7058.2861.2861.9962.6465.7166.5566.9567.5467.9769.5269.8071.0371.3172.2373.4273.6073.8574.7575.0976.5576.98
Hole806B
(mbsf)
4.0611.9213.9116.8020.1721.3222.2823.1325.4027.3628.5831.3432.1234.8335.5436.1336.9737.9040.9342.1046.7047.5748.0949.0049.5051.3053.11
54.5655.5256.4458.5659.2062.2162.8363.3566.4567.0767.7368.1968.6670.0670.5071.5071.7472.6474.0174.2274.5975.3476.4577.4877.9180.0080.5982.1183.3583.6984.1885.0085.3486.5587.2095.5696.8098.4798.6699.1299.43
102.29
Hole806C
(mbsf)
3.8511.6113.57
20.2521.50
23.1925.2526.1127.2629.9530.9533.7135.4436.0736.8037.5840.7142.2047.1347.8548.4749.58
50.2552.2754.3654.6655.3756.4957.7358.3060.8761.5262.2065.7166.6467.0467.5468.0469.5270.10
73.5773.8274.3175.1275.3177.42
80.5881.1482.6383.6684.1284.5285.4685.9087.3287.8294.5695.7797.5497.7698.3898.63
102.61
Splice(mcd)
3.8411.6113.5317.7121.0922.2423.2024.0526.3327.1428.2930.9831.9834.7436.4737.1037.8338.6141.7443.2347.8448.7149.2350.1450.6751.3353.3754.3254.6155.5956.5158.6359.2762.2862.9063.4266.5267.1467.8068.2668.7370.1370.5771.5771.8172.7173.9174.0974.3475.176.2177.24
80.4281.0182.5383.7784.1184.685.4285.7686.9787.6295.9897.2298.8999.0899.5499.85
102.71
Notes: Events (in first column) are given either in numbersor letters. The depth of these events (in mbsf) are listedin the next three columns. The final position of the eventin the spliced section (in mcd) is given in the last column.
nents of the time series using the standard analytical proceduresadopted by the SPECMAP project (Jenkins and Watts, 1968; Imbrieet al., 1984). Unlike many previous studies, however, the continuous,high-resolution nature of the time series permits us to view the datain the form of an "evolutionary spectrum" (e.g., Fig. 2) that can beused to evaluate the relative merits of the stratigraphy as well asprovide insight into the response, through time, of the ocean toexternal forcing.
Earlier studies have shown that GRAPE records in the central equa-torial Pacific are accurate representations of downcore changes in car-bonate content, which are, in turn, a reflection of orbitally driven (in part)changes in ocean chemistry (Mayer, 1991). This relationship has beenelegantly demonstrated in the eastern equatorial Pacific where GRAPErecords have been shown to be correlative over large distances andcapable of providing a stratigraphic framework (Shackleton et al., 1992).Based on these experiences and a preliminary shipboard study of the Leg130 GRAPE records (Jansen et al., 1991), we view the evolutionaryspectra with the assumption that we should see Milankovitch frequenciesin the record and that small deviations from Milankovitch periodsprobably represent inadequacies in the time scale.
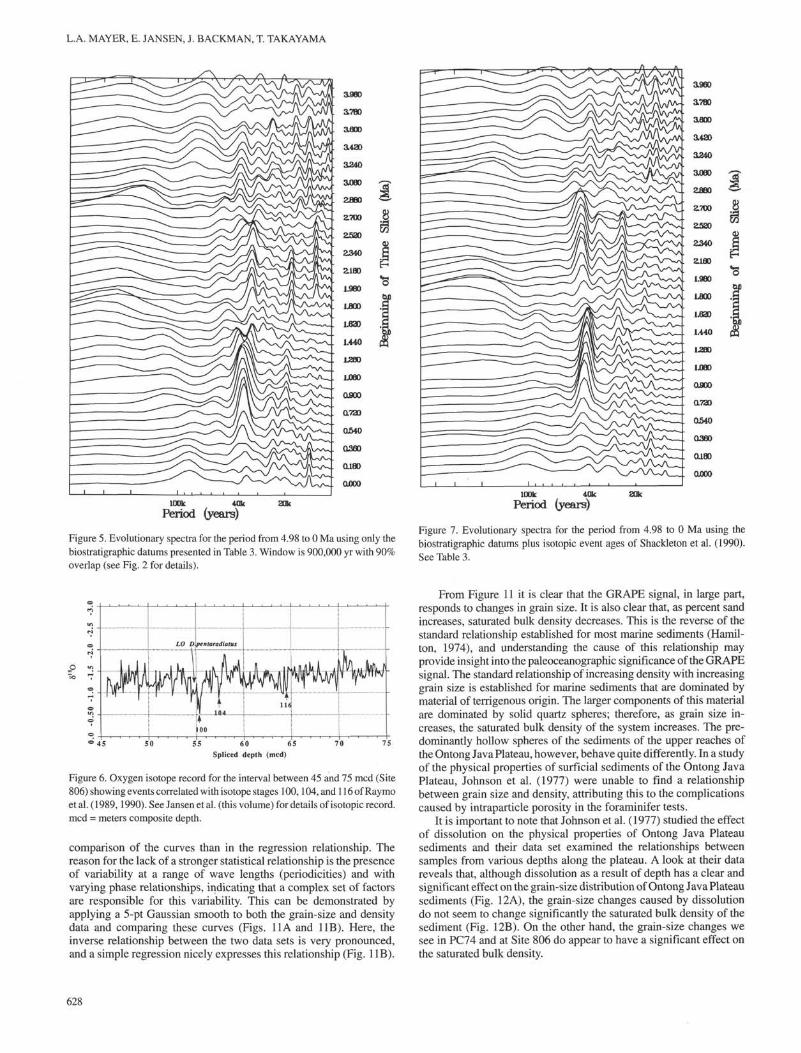
Figure 5 shows the evolutionary spectrum using just the biostrat-igraphic datums. For this and all of the evolutionary spectra displayedhere, each spectrum represents a 900,000-yr window beginning at thetime equivalent to the intersection of the spectrum and the y-axis (0in Fig. 5). Each successive spectrum represents an offset of 90,000 yr(90% overlap) and a 900,000-yr window. The presence of significantenergy in the Milankovitch bands is clearly evident in this figure; itis also clear that the time scale needs some improvement, particularlyin the 1.8 to 3 Ma interval.
To improve the stratigraphy in this interval, we add supplementalinformation provided by the oxygen isotope record measured at Hole806B (Jansen et al., this volume). Based on the detailed oxygenisotope records of Sites 607 and 677, Raymo et al. (1989, 1990)produced a complete isotope stratigraphy and defined isotope stagesthrough the entire Quaternary and major portions of the late Pliocene.They defined Stage 100, which is a very pronounced glacial episodewith a large positive δ 1 8 θ excursion, just above the Gauss/Matuyamamagnetic reversal, conventionally dated to 2.47 Ma. Similarly, a verystrong glacial is recorded in Hole 806B at 55.33 mbsf. As is also truefor Stage 100 in the record of Raymo et al. (1989), the Hole 806Bevent is located immediately beneath the LO of D. pentaradiatus,which is at 54.68 mbsf in Hole 806B. This close correspondence withStage 100 (as defined in Sites 607 and 677) and the LO of theD. pentaradiatus datum makes us conclude that the strong glacial at55.33 mbsf in Hole 806B is Stage 100. We then examined the oxygenisotope record further downcore and were able to identify Stages 104and 116 (the first main glacial isotope enrichment in the late Pliocene;Raymo et al., 1989). The isotope stage determinations are docu-mented in Figure 6.
Shackleton et al. (1990) recently proposed a revision of the mag-netic time scale based on tuning the isotope record from ODP Site 677to both 41- and 23-k.y. periodicities. This approach led the authors toconclude that the radiometrically determined ages for the Pleistocenemagnetic reversals may be 5%-7% too low and to postulate that thismay be caused by inaccuracies in the radiometric dating of the mag-netic reversals. To see the effects of this time scale on our records, werecalculated the time scale by using the new ages proposed by Shack-leton et al. (1990) and by adding 5% to the ages used for the previoustime scale for events older than 2.6 Ma (the age limit in the study ofShackleton et al., 1990). The results of this procedure are presented inFigure 7. As can be seen in this figure, the spectral behavior of the timeseries, particularly in the interval from 3.0 to 1.5 Ma, is improved usingthis time scale. A comparison of the age-depth relationships derivedfrom the shipboard biostratigraphy and that derived from the Shack-leton et al. (1990) time scale is presented in Figure 8.
Though improved over the shipboard biostratigraphy, the age-depth relationship revealed in the evolutionary spectra of the Site
626

CLIMATIC CYCLICITY AT SITE 806
Table 2. Makeup of composite section.
Event
0-0.50.5-R
R-15
15-TT^1.6
41.6-4646-7575-7878-8282-8585-end
Originaldepth (mbsf)
0-3.843.54-17.40
16.80-25.4125.31^2.2042.10-49.5050.90-54.8654.56-72.6572.23-73.8574.59-77.4977.41-80.5980.00-164.00
Originalthickness (mbsf)
3.814.08.6
17.07.44.0
18.01.62.93.2
84.0
Originalhole
806C806A806B806C806B806A806B806A806B806C806B
Spliceddepth (mcd)
0-3.843.86-17.71
17.72-26.3226.33^3.2343.24-50.6450.67-54.6154.63-72.7272.73-74.3474.35-77.2477.26-80.4280.43-164.42
Change tooriginal depth (m)
00.30.91.01.1
-0.20.10.5
-0.2-0.2
0.4
Notes: The events column specifies the interval used for constructing the spliced section. The next two columnsindicate the original depth and the thickness of this interval in the hole that it came from (i.e., the originalhole). The spliced depth indicates the new depth of this interval in the composite section.
Depth in Hole 806B (mbsf) Table 3. Stratigraphy used for Site 806 analyses.
20 40 60 80 100 120
T3
ε
α
f
20 -
40
60 -
8 0 -
100-
1 1 1
\
\
\
\
Λ
\
i i ,
C 1
120 J
Figure 4. Comparison of depth of events identified in Table 1 in Hole 806Bwith their final position in the spliced section, mcd = meters composite depth.
806 GRAPE record using the age model based on Shackleton et al.(1990) (Fig. 7) indicates that there are still problems with the Site 806stratigraphy. Further effort, particularly the improvement of the stra-tigraphy through tuning, will be necessary to make final adjustmentsto the Site 806 time scale presented here and in the accompanyingpaper by Jansen et al. (this volume).
DISCUSSION
Origin of the GRAPE Signal
The clear presence of Milankovitch frequencies in the GRAPErecord implies that paleoceanographic information is contained in thisrecord. Given the high resolution of the GRAPE data, it is well worthexploring the origin of this signal. In the central and eastern equatorialPacific, where the sediments are dominated by two components(biogenous silica and biogenous carbonate), the paleoceanographic
Event
Depth inHole 806B
(m)
Spliceddepth(m)
Paleomagneticage
(Ma)
Shackletonage
(Ma)
LO P. lacunosaLO D. macintyrieLO D. brouweriOA D. triradiatus acmeLO D. pentaradiatusStage 100Stage 104Stage 116LO R. pseuoumbilicaLO C. acutusLO D. quinqueramus
9.0134.4043.5145.6554.6855.3357.3164.4194.75
148.00162.50
8.7634.3344.6546.7954.7555.3757.4064.5095.17
148.72162.93
0.461.451.892.072.39
3.564.605.00
0.4601.6031.9502.2112.5212.5352.6002.8703.7404.8305.250
Notes: Ages <2.6 Ma are from Shackleton et al. (1990) and Shackleton (pers. comm., 1991).Ages for datums older than 2.6 Ma were obtained by adding 5% to paleomagnetic ages.LO = last occurrence and OA = optimum abundance.
significance of the GRAPE signal has been well established. In thisenvironment the saturated bulk density variations recorded in theGRAPE record are a direct result of changes in the calcium carbonatecontent (Fig. 9A). As the carbonate content varies in response tochanges in dissolution or productivity, the contrast in grain densityand packing mode between biogenous carbonate and biogenous silicacreates large differences in saturated bulk density (Mayer, 1979).
If we look at the carbonate-density data pairs in the vicinity ofSite 806, however, we do not find a significant relationship (Fig 9B).To explore the origin of the density variations on the Ontong JavaPlateau, we use a piston core (PC74) collected on the site surveycruise (Mayer et al., this volume), close to the depth of Site 806(2547 m) and for which we have multiple physical properties meas-urements on the same sample. This removes the need for interpola-tion in comparing physical property relationships and allows us toevaluate the interrelationships statistically.
In contrast to the eastern and central equatorial Pacific, the sedi-ments of the upper reaches of the Ontong Java Plateau are almostentirely biogenous carbonate. In this environment, even pervasivedissolution does not change the percentage carbonate significantly(e.g., Johnson et al., 1977), and very little variability is present in thecarbonate content of the sediments at Site 806 (Berger et al., in press).Therefore, not enough range in the variability of the carbonate contentexists to create the packing and grain-density changes necessary togenerate correlatable saturated bulk-density contrasts.
A stronger relationship can be found, however, if we comparesaturated bulk density with changes in grain size (expressed as percentsand; Figs. 10A and 10B). Examination of the two curves shows aclear antithetical relationship, one that is more clearly expressed in a
627
L.A. MAYER, E. JANSEN, J. BACKMAN, T. TAKAYAMA
100k 40k
Period (years)2Qk
Figure 5. Evolutionary spectra for the period from 4.98 to 0 Ma using only thebiostratigraphic datums presented in Table 3. Window is 900,000 yr with 90%overlap (see Fig. 2 for details).
SS 60 65 70 75Spliced depth (mcd)
Figure 6. Oxygen isotope record for the interval between 45 and 75 mcd (Site806) showing events correlated with isotope stages 100,104, and 116 of Raymoet al. (1989,1990). See Jansen et al. (this volume) for details of isotopic record,mcd = meters composite depth.
comparison of the curves than in the regression relationship. Thereason for the lack of a stronger statistical relationship is the presenceof variability at a range of wave lengths (periodicities) and withvarying phase relationships, indicating that a complex set of factorsare responsible for this variability. This can be demonstrated byapplying a 5-pt Gaussian smooth to both the grain-size and densitydata and comparing these curves (Figs. 11A and 11B). Here, theinverse relationship between the two data sets is very pronounced,and a simple regression nicely expresses this relationship (Fig. 11B).
100k 40k 20k
Period (years)
Figure 7. Evolutionary spectra for the period from 4.98 to 0 Ma using thebiostratigraphic datums plus isotopic event ages of Shackleton et al. (1990).See Table 3.
From Figure 11 it is clear that the GRAPE signal, in large part,responds to changes in grain size. It is also clear that, as percent sandincreases, saturated bulk density decreases. This is the reverse of thestandard relationship established for most marine sediments (Hamil-ton, 1974), and understanding the cause of this relationship mayprovide insight into the paleoceanographic significance of the GRAPEsignal. The standard relationship of increasing density with increasinggrain size is established for marine sediments that are dominated bymaterial of terrigenous origin. The larger components of this materialare dominated by solid quartz spheres; therefore, as grain size in-creases, the saturated bulk density of the system increases. The pre-dominantly hollow spheres of the sediments of the upper reaches ofthe Ontong Java Plateau, however, behave quite differently. In a studyof the physical properties of surficial sediments of the Ontong JavaPlateau, Johnson et al. (1977) were unable to find a relationshipbetween grain size and density, attributing this to the complicationscaused by intraparticle porosity in the foraminifer tests.
It is important to note that Johnson et al. (1977) studied the effectof dissolution on the physical properties of Ontong Java Plateausediments and their data set examined the relationships betweensamples from various depths along the plateau. A look at their datareveals that, although dissolution as a result of depth has a clear andsignificant effect on the grain-size distribution of Ontong Java Plateausediments (Fig. 12A), the grain-size changes caused by dissolutiondo not seem to change significantly the saturated bulk density of thesediment (Fig. 12B). On the other hand, the grain-size changes wesee in PC74 and at Site 806 do appear to have a significant effect onthe saturated bulk density.
628

CLIMATIC CYCLICITY AT SITE 806
Age (Ma)
2 3
Carbonate (%)
30 40 50 60 70 80 90 100
"8 50E
o.•σ
lo
Si
150-
Biostratigraphicage model
Shackleton et al.age model
Figure 8. Plot of the differences in the age-depth relationships for the variousage models evaluated, mcd = meters composite depth.
The mechanism proposed for the change in grain size with disso-lution is the breakdown of large, whole foraminifer tests into frag-ments and thus the transfer of intraparticle porosity to interparticleporosity. Although the breakdown of particles (and thus the decreasein grain size) seems quite efficient (e.g., Fig. 12A), the fragmentsmaintain an open structure that does not change the saturated bulkdensity of the system significantly. At PC74 and Site 806, well abovethe local lysocline (Wu and Berger, 1991), dissolution should not playa major role. We contend that the changes in grain size at Site 806 arethe result of current winnowing that removes the fines and leaves agreater percentage of the hollow, unbroken, and largely unfilledforaminifers. This mechanism would show an inverse relationshipbetween grain size and saturated bulk density. Thus, we have identi-fied a "dissolution signal" in which grain size varies without signifi-cant effect on saturated bulk density and a "winnowing signal" inwhich grain-size changes do effect the saturated bulk density. Thesediments from the upper part of the Ontong Java Plateau clearly showthe "winnowing signal."
We must be careful to acknowledge that we cannot dismiss thepotential role of productivity in creating changes in grain size (e.g.,the foraminifer/nannofossil ratio). Although conclusions about therole of productivity will have to await detailed analyses of carbonisotopes and other sediment characteristics, spectral evidence (dis-cussed below) leads us to hypothesize that the grain-size (and thusGRAPE) record at Site 806 is caused, in large part, by changesin winnowing. This is consistent with the findings of Wu andBerger (1991), who examined a series of piston and box coresfrom the Ontong Java Plateau, found no evidence of significantfragmentation in those samples taken above the lysocline, and con-cluded that the grain-size signal on the shallow part of the plateau isa winnowing signal.
Further insight into the origin of the grain size signal can be gainedfrom Figure 11. The smoothed grain-size and saturated bulk-density
g/c
>>
sit
c
1.60
1.55
1.50
1.45
1.40
1.35
1.30
1.25
1.20
--,
\t,,,:•
1 1 1 1 1 1 1 1
+
++± 7^&
1 1 1 1 . 1 1
.+
+
+ M
//+
/,+ +I
R=O
+
+ /
/f +++
96
i . . .
•
-
-
-
-
-
1 1 1 I _ I _ L
Carbonate (%)
78 80 82 84 86 88 901.70
1.68
1.66
•I 1.64
1.62
1.60R=0.42
1 . 5 8 1 " " 'Figure 9. A. Percent carbonate-saturated bulk-density relationship from SIOCore PLDS 133 at 4500-m water depth in the central equatorial Pacific. Lineis second-order fit. B. Percent carbonate-saturated bulk-density relationshipfrom SIO Core RNDB 74 at 2540 m on the Ontong Java Plateau. Line issecond-order fit.
629

L.A. MAYER, E. JANSEN, J. BACKMAN, T. TAKAYAMA
ASBD %sand
1.50 100 200 300 400 500 600 700 800
Depth (cm)
Sand (%)
10 15 20 25 30 35 40 45 501.72
1.70
1.68
1.66
| 1.64
1.62
1.60
+
R=0.76
1.58 •Figure 10. A. Comparison of saturated bulk density (SBD, measured by
constant volume method on discrete samples) with the percent sand data on
the same sample from SIO Core RNDB 74 on Ontong Java Plateau. B.
Regression of saturated bulk density and percent sand data from SIO Core
RNDB 74. Line is second-order fit.
curves show several large-amplitude cycles that have the dominantantithetical relationship. A preliminary stratigraphy for this core (L.Tauxe, pers. comm., 1992) reveals that these cycles are 100-k.y.eccentricity cycles and thus for at least the last 250-300 k.y. the"winnowing effect" is dominated by a 100-k.y. periodicity withincreased grain size correlating with glacial times (typically with a lagof 10-15 k.y.) and implying that the grain-size signal is responding toclimatic forcing in a way similar to global ice volume. The associationof increased grain size (winnowing) with glaciations is also consistent
• + • sbd.smth %sand.smth
1.95
1.55
5 pt moving avg
0 100 200 300 400 500 600 700 800
Depth (cm)
Sand (%)
15 20 25 30 35 40 45 501.70
1.68 -
1.66 -
β 1.64 -
1.62 -
1.60Figure 11. A. Comparison of smoothed (with 5-pt moving average) saturated
bulk density and smoothed (with 5-pt moving average) percent sand data from
SIO Core RNDB 74. B. Regression of smoothed saturated bulk density and
smoothed percent sand data from SIO Core RNDB 74. Line is second-order fit.
with the conclusions of Wu and Berger (1991). We will explore thisin more detail when we compare the grain-size and oxygen isotoperecord in the deeper part of the section.
The Frequency Domain
Extending the conclusions drawn from the piston core to the long,high-resolution time series achievable with GRAPE analyses ofODP cores, we see that the basic trends established for the upper fewthousand years continue (with some modifications). In the follow-ing, we will restrict our discussion to the time interval between 2 and5 Ma, the interval over which we also have oxygen isotope data andan important transitional period in the evolution of global climate(see the companion paper, Jansen et al., this volume). Figure 13shows a comparison of GRAPE density and grain size (expressed aspercent sand) for the interval 2-5 Ma at Site 806. The inverserelationship between grain size and percent sand is clear, though it
630

CLIMATIC CYCLICITY AT SITE 806
0.03-
? 0.025-
1 ° 02~
cI 0.015-c
1 °0 1-
0.005-
0-
i i i i 1 I • i i
: R=
\
).98
I I I I
V .
\
I I I I
\
\
Φ
I I I I I I I I I I I I
•
1000 1500 2000 2500 3000 3500 4000 4500 5000
Depth (m)
1.52
1.48--
1.46--
1.44--
1 - 4 2 | i • i i | i i i • | • i i • | • , • i | , • • i | • , i , | i , i • 1 i , i i
1000 1500 2000 2500 3000 3500 4000 4500 5000
Depth (m)
Figure 12. A. Relationship between mean grain size and depth from surficial
samples of Ontong Java Plateau box cores (from Johnson et al., 1977). Line is
second-order regression. B. Relationship between saturated bulk density and
depth for same samples as in Figure 12A. Line is second-order regression.
is also apparent that the frequency of modulation of these changes isdifferent from the dominant 100-k.y. cyclicity found in the upper200-300 k.y. of PC74. In the older interval, the dominant cyclicityappears to be approximately 40 k.y. (the Milankovitch tilt period),consistent with the well-documented increase in 100-k.y. climaticresponse after about 900 k.y. b.p. (e.g., Pisias and Moore, 1981;Ruddiman et al., 1986) and apparent in the evolutionary spectrumof the GRAPE record (Fig. 7).
Given our understanding that in the upper portions of the OntongJava Plateau the GRAPE signal is produced by grain-size changes,we can use the oxygen isotope record (measured on Globigerinoidessacculifer; Jansen et al., this volume) to explore the paleoceano-graphic significance of this signal. A comparison of the grain-sizecurve with the δ 1 8 θ record reveals a much more complex picture thanthat for PC74 (Fig. 14). Although a visual comparison of these twodata sets seems to imply a generally inverse relationship, the relation-ship is quite complex and difficult to discern. To attempt to extractthe nature of this relationship, we will look at the spectral componentsof these records.
A basic assumption of the spectral techniques used to evaluate thefrequency content of paleoclimatic records is stationarity. This hasbeen fairly well established for the time interval from 0 to 400 ka, butthere is growing evidence (including that presented here) that majorchanges have been taken place in the response of the climate system
at several times during the last 5 m.y. Given the nonstationarity of thelong-term paleoclimatic records we have, as a first pass, divided the3-m.y. records that we are analyzing into 1-m.y. partitions and ana-lyzed each of these separately. This is a division of convenience; giventhe uncertainties remaining in the time scale (see discussion above),we use spectral techniques here as an exploratory tool rather than asa detailed analytical tool. Once a time scale is finalized, these explora-tory efforts can provide a guide to dividing the time series intocarefully selected, stationary intervals and the spectral approach usedfor detailed examinations of coherency and phase between the variouscomponents of the system.
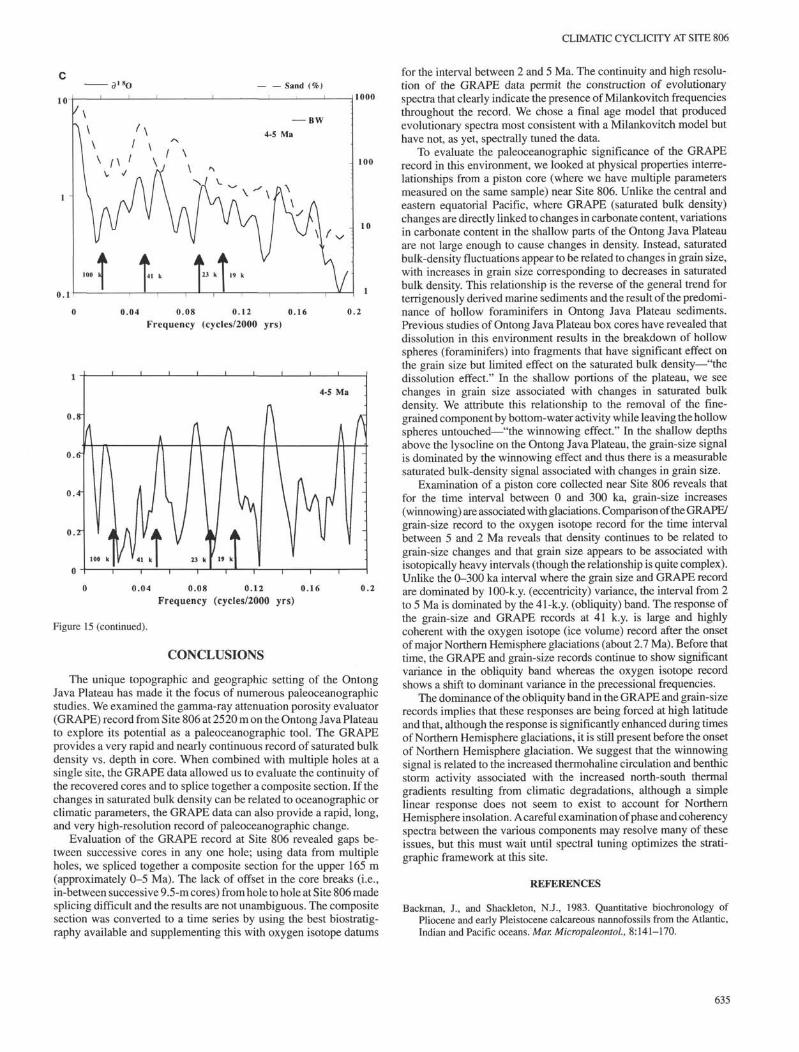
Cross-spectra between the grain-size record and the oxygen iso-tope record indicate that in the interval 2-3 Ma significant coherenceexists in each of the Milankovitch bands (as well as at approximately60 and 30 k.y.; Fig 15); in the intervals 3^1 and 4-5 Ma, less coherenceis present in the obliquity band. The reason for this is evident in anexamination of the evolutionary spectra for grain size and oxygenisotopes (Figs. 16A and 16B). It can be seen that variance in theobliquity band is well developed in both records in the interval from2 to about 2.8 Ma. Before about 2.8 Ma, however, the obliquity signalis greatly reduced (almost absent) in the oxygen isotope record,although it remains reasonably strong throughout the grain-size re-cord. Before 3 Ma, a clear shift to higher frequencies is present in theisotope record (Fig 16; see discussion in Jansen et al., this volume);although an increase in variance in the high frequencies in thegrain-size record is present, it is nowhere near as strong as that in theoxygen isotope record. It is important to note that these two data setswere measured on the same samples, and thus these differences inresponse are real and not an artifact of sampling. The evolutionaryspectrum of the GRAPE record (which is not based on the samesamples and thus subject to sampling artifacts) is much closer inappearance to the grain-size record, consistent with our conclusion ofa straightforward relationship between grain size and density.
We can view this phenomenon in another way and gain insightinto the relative response of grain size and the isotopic record bylooking at these values filtered at the obliquity frequency (Fig. 17). Itis clear from this figure that in the obliquity band there is, for the mostpart, the previously established inverse relationship between grainsize and isotopes. In addition, comparison of the amplitude of theindividual peaks (the envelope of the curves) reveals high coherencefrom 2 until about 3 Ma; from 3 to 5 Ma the grain-size curve continuesto display large-amplitude 41-k.y. fluctuations whereas the isotopicrecord does not.
Thus, we continue to see a "winnowing" signal associated (for themost part) with isotopically heavy intervals. In the youngest part ofthe record (PC74: 0-300 k.y.), these fluctuations have dominant100-k.y. (eccentricity) periodicity. In the interval from 2 to approxi-mately 3 Ma, the oxygen isotope and grain-size signals are coherentand dominated by 41-k.y. (obliquity) periodicities. Before this time,however, the grain-size (and GRAPE) signal continues to be domi-nated by the obliquity band whereas the isotope record displays a shiftto precession-related frequencies.
The dominance of obliquity-related frequencies in the GRAPEand grain-size record is significant in that it implies that whatever isdriving these responses is a high-latitude phenomenon (Short et al.,1990). Given the evidence suggesting that the GRAPE and grain-sizerecords are representative of winnowing, we conclude that thesesignals are a response to changes in deep-water formation at highlatitude. This response appears to be enhanced during times of greaterglobal ice volume and particularly with the onset of Northern Hemi-sphere glaciation, although it was established well before the onset ofmajor Northern Hemisphere glaciation (Figs. 15 and 17). Wu andBerger (1991) discuss several possible mechanisms for enhancingwinnowing during glaciations: (1) enhanced thermohaline circula-tion; (2) increased benthic storm activity because of enhanced north-south thermal gradients; (3) increased magnitude of tidal motionbecause of less energy dissipation on the shelves; and (4) increased
631

L.A. MAYER, E. JANSEN, J. BACKMAN, T. TAKAYAMA
Den sand
Mcc
1 .80
1 .75"
1 .70-
1.65"
1.6O-
1 .552.OO 2.2O 2.4O 2.6O 2.8O 3.OO
1 .80-
1 .75-
1 .70-
1 .65-
1 . 6 O—•
1 .55-
/tyl J l j f ft/f 'MÀIΛ 1r
i
fr1 r ]yi |j
7O
6O
5O
4O
3O
2O
1 O
O . O3.OO 3.2O 3.4O 3.6O 3.8O 4.OO
o
1 .80
1 .75 -
1 .70 -
1 .65 ~
1 .60 -
1 .55
4.8O 5.OO
Figure 13. Time series of GRAPE density (dashed line) and percent sand (solid line) for interval between 4.8 and 2 Ma.
632

CLIMATIC CYCLICITY AT SITE 806
-2.O
-1.5-
- 1 .O
-O.5O-
2 . O
δ 1 8 o
2 . 2
grain size
2 . 4 2 . 6 2 . 8
7 O
lo.o3 . O
7 O
•Pto
-0.5O3 . O 3 . 2 3 . 4
CO
o.o3 . 6 3 . 8 4 . O
-2.0
-1.5
7 0
t o
-1.0
-0.50 0 . 04 . 0 4 . 2 4 . 8 5 . 0
Age (Ma)
Figure 14. Time series of δ 1 8 θ (solid line) and percent sand (dashed line) for the interval between 4.8 and 2 Ma.
633

L.A. MAYER, E. JANSEN, J. BACKMAN, T. TAKAYAMA
a• o — — Sand (%) — — Sand (%)
10
/M/T '/ V '
t100 kl
J
\
ΛΛ
t14] k
v\V
r
\ 1W/
k 11 k
2-3 Ma
A Λ
IAΛ
BW
t ~r
nJf\
1000
100
10
10
0 0.04 0.08 0.12 0.16 0.2
Frequency (cycles/2000 yrs)
BW
3-4 Ma
1000
100
10
0.04 0.08 0.12 0.16 0.2
Frequency (cycles/2000 yrs)
0.04 0.08 0.12 0.16Frequency (cycles/2000 yrs)
0.2
I t t100 k 41 k 23 k j 19 k
0.04 0.08 0.12 0.16Frequency (cycles/2000 yrs)
0.2
Figure 15. Coherency (bottom plot) and variance spectra calculated from 518O (solid line) and grain size (dashed line) for intervals 2-3 (A), 3^4 (B), and 4-5 (C)Ma. Variance is plotted on an arbitrary log scale; note that the % sand axis is 2 orders of magnitude larger than δ 1 8 θ . Coherency is plotted on a hyperbolic arc-tangentscale with the horizontal line indicating a 95% significance level. Frequency axis is in cycles per sample interval. Sample interval is 2000 yr. Major Milankovitchperiods are indicated by arrows.
energy of earthquake-generated tsunamis, again caused by less dissi-pation on the shelves. If our suggestion that the winnowing-isotoperelationship was established well before the onset of major NorthernHemisphere glaciation is correct, it implies that the mechanism isrelated (at least in part) to thermohaline circulation or thermalgradients as opposed to major changes in shelf area.
The dominance of the obliquity period in the GRAPE andgrain-size records also supports our suggestion that the signal isthe result of winnowing rather than productivity. Although changesin productivity may result in increases in the foraminifer-to-coc-colith ratio and thus have a grain-size and density effect similar tothat of winnowing, we would expect that productivity changes maybe related to more local, surface-water (wind-driven) phenomenaand thus be more closely associated with the precessional frequen-cies. It is possible that equatorial productivity can be modulated byhigh-latitude forcing through variations in the nutrient content ofupwelling waters. Boyle (1988) has shown that intermediate-waternutrients were reduced during the last glacial maximum. Strippingintermediate waters of nutrients may reduce productivity in areas
where intermediate waters upwell and thus provide an obliquitymodulated equatorial productivity signal. It is unlikely, however, thatthis mechanism would apply to the western equatorial Pacific wherea deep, stable thermocline would tend to limit the mixing of interme-diate waters into the photic zone.
The fact the GRAPE record may be recording an oceanwidedeep-water phenomenon is also supported by comparison of theevolutionary spectrum of the GRAPE record from Site 806 to thatof DSDP Site 573, 6500 km to the east in the central equatorialPacific (Figs. 18A and 18B). The GRAPE record in the deep, centralequatorial Pacific (about 4500 m) is dominantly the result of preser-vation cycles (Mayer, 1991) and thus records changes in deep-waterbehavior. Striking similarities exist between the two records, par-ticularly the noticeable increase in 41-k.y. variance at about 1.4 Ma.We expect that the similarities between these records will be evengreater when a final time scale is developed for Site 806. Thesimilarities in the behavior of the 41-k.y. signal between these twosites implies that both sites are responding to basinwide (at least)changes in deep water.
634
CLIMATIC CYCLICITY AT SITE 806
o.l
f t t tkl L , k 23 k I
1000
100
10
0.04 0.08 0.12 0.16 0.2Frequency (cycles/2000 yrs)
0.04
Figure 15 (continued).
0.08 0.12 0.16Frequency (cycles/2000 yrs)
CONCLUSIONS
0.2
The unique topographic and geographic setting of the OntongJava Plateau has made it the focus of numerous paleoceanographicstudies. We examined the gamma-ray attenuation porosity evaluator(GRAPE) record from Site 806 at 2520 m on the Ontong Java Plateauto explore its potential as a paleoceanographic tool. The GRAPEprovides a very rapid and nearly continuous record of saturated bulkdensity vs. depth in core. When combined with multiple holes at asingle site, the GRAPE data allowed us to evaluate the continuity ofthe recovered cores and to splice together a composite section. If thechanges in saturated bulk density can be related to oceanographic orclimatic parameters, the GRAPE data can also provide a rapid, long,and very high-resolution record of paleoceanographic change.
Evaluation of the GRAPE record at Site 806 revealed gaps be-tween successive cores in any one hole; using data from multipleholes, we spliced together a composite section for the upper 165 m(approximately 0—5 Ma). The lack of offset in the core breaks (i.e.,in-between successive 9.5-m cores) from hole to hole at Site 806 madesplicing difficult and the results are not unambiguous. The compositesection was converted to a time series by using the best biostratig-raphy available and supplementing this with oxygen isotope datums
for the interval between 2 and 5 Ma. The continuity and high resolu-tion of the GRAPE data permit the construction of evolutionaryspectra that clearly indicate the presence of Milankovitch frequenciesthroughout the record. We chose a final age model that producedevolutionary spectra most consistent with a Milankovitch model buthave not, as yet, spectrally tuned the data.
To evaluate the paleoceanographic significance of the GRAPErecord in this environment, we looked at physical properties interre-lationships from a piston core (where we have multiple parametersmeasured on the same sample) near Site 806. Unlike the central andeastern equatorial Pacific, where GRAPE (saturated bulk density)changes are directly linked to changes in carbonate content, variationsin carbonate content in the shallow parts of the Ontong Java Plateauare not large enough to cause changes in density. Instead, saturatedbulk-density fluctuations appear to be related to changes in grain size,with increases in grain size corresponding to decreases in saturatedbulk density. This relationship is the reverse of the general trend forterrigenously derived marine sediments and the result of the predomi-nance of hollow foraminifers in Ontong Java Plateau sediments.Previous studies of Ontong Java Plateau box cores have revealed thatdissolution in this environment results in the breakdown of hollowspheres (foraminifers) into fragments that have significant effect onthe grain size but limited effect on the saturated bulk density—"thedissolution effect." In the shallow portions of the plateau, we seechanges in grain size associated with changes in saturated bulkdensity. We attribute this relationship to the removal of the fine-grained component by bottom-water activity while leaving the hollowspheres untouched—"the winnowing effect." In the shallow depthsabove the lysocline on the Ontong Java Plateau, the grain-size signalis dominated by the winnowing effect and thus there is a measurablesaturated bulk-density signal associated with changes in grain size.
Examination of a piston core collected near Site 806 reveals thatfor the time interval between 0 and 300 ka, grain-size increases(winnowing) are associated with glaciations. Comparison of the GRAPE/grain-size record to the oxygen isotope record for the time intervalbetween 5 and 2 Ma reveals that density continues to be related tograin-size changes and that grain size appears to be associated withisotopically heavy intervals (though the relationship is quite complex).Unlike the 0-300 ka interval where the grain size and GRAPE recordare dominated by 100-k.y. (eccentricity) variance, the interval from 2to 5 Ma is dominated by the 41-k.y. (obliquity) band. The response ofthe grain-size and GRAPE records at 41 k.y. is large and highlycoherent with the oxygen isotope (ice volume) record after the onsetof major Northern Hemisphere glaciations (about 2.7 Ma). Before thattime, the GRAPE and grain-size records continue to show significantvariance in the obliquity band whereas the oxygen isotope recordshows a shift to dominant variance in the precessional frequencies.
The dominance of the obliquity band in the GRAPE and grain-sizerecords implies that these responses are being forced at high latitudeand that, although the response is significantly enhanced during timesof Northern Hemisphere glaciations, it is still present before the onsetof Northern Hemisphere glaciation. We suggest that the winnowingsignal is related to the increased thermohaline circulation and benthicstorm activity associated with the increased north-south thermalgradients resulting from climatic degradations, although a simplelinear response does not seem to exist to account for NorthernHemisphere insolation. A careful examination of phase and coherencyspectra between the various components may resolve many of theseissues, but this must wait until spectral tuning optimizes the strati-graphic framework at this site.
REFERENCES
Backman, J., and Shackleton, N.J., 1983. Quantitative biochronology ofPliocene and early Pleistocene calcareous nannofossils from the Atlantic,Indian and Pacific oceans. Mar. Micropaleontol, 8:141-170.
635

L.A. MAYER, E. JANSEN, J. BACKMAN, T. TAKAYAMA
Berger, W.H., Kroenke, L.W., Mayer, L.A., Backman, J., Janecek, T., Krissek,L., Leckie, M., and Lyle, M., in press. The record of Ontong Java Plateau:main results of ODP Leg 130. Geol. Soc. Am. Bull.
Berggren, W.A., Kent, D., and van Couvering, J.A., 1985. The Neogene.Part 2: Neogene chronology and chronostratigraphy. In Snelling, N.J.(Ed.), The Chronology of the Geological Record. Geol. Soc. LondonMem., 10:211-260.
Boyce, R.E., 1973. Appendix I. Physical property methods. In Edgar, N.T.,Saunders, J.B., et al., Ink. Repts. DSDP, 15: Washington (U.S. Govt.Printing Office), 1115-1128.
Boyle, E.A., 1988. The role of vertical chemical fractionation in controlling lateQuaternary atmospheric carbon dioxide. J. Geophys. Res., 93:15,701-15,714.
Brier, C, Bennin, R., and Rona, P.A., 1969. Preliminary evaluation of a corescintillation counter for bulk density measurement in marine sedimentcores. J. Sediment. Petrol., 39:1509-1519.
Evans, H.B., 1965. GRAPE—a Device for continuous determination of materialdensity and porosity. Trans. 6th Ann. SPWLA Logging Symp., 2:B1-B25.
Evans, H.B., and Cotterell, C.H., 1970. Gamma-ray attenuation density scan-ner. In Peterson, M.N.A., Edgar, N.T., et al., Init. Repts. DSDP, 2: Wash-ington (U.S. Govt. Printing Office), 442^54.
Hagelberg, T, Shackleton, N., Pisias, N., and Shipboard Scientific Party, 1992.Development of composite depth sections for Sites 844 through 854. InMayer, L., Pisias, N., Janecek, T., et al., Proc. ODP, Init. Repts., 138, Pt. 1:College Station, TX (Ocean Drilling Program), 79-85.
Hamilton, E.L., 1974. Prediction of deep-sea sediment properties: state-of-the-art. In Interbitzen, A.L. (Ed.), Deep-Sea Sediments, Physical and Me-chanical Properties: New York (Plenum), 1-43.
Harms, J.C., and Choquette, P.W., 1965. Geologic evaluation of a gamma-rayporosity device. Trans. 6th Ann. SPWLA Logging Symp., C1-C37.
Heath, G.R., Kovar, R.B., Lopez, C, and Campi, G.L., 1985. Elementalcomposition of Cenozoic pelagic clays from Deep Sea Drilling ProjectSites 576 and 578, western north Pacific. In Heath, G.R., Burckle, L.H., etal., Init. Repts. DSDP, 86: Washington (U.S. Govt. Printing Office).
Herbert, T.D., in press. Deterministic distortions of orbital cyclicity by sedi-mentation: models and examples. In Orbital Forcing and Cyclic Se-quences. Spec. Publ. Int. Assoc. Sedimentol.
Herbert, T.D., and Mayer, L.A., in press. Long climatic time series fromsediment physical property measurements. J. Sediment. Petrol.
Imbrie, J., Hays, J.D., Martinson, D.G., Mclntyre, A., Mix, A.C., Morley, J.J.,Pisias, N.G., Prell, W.L., and Shackleton, N.J., 1984. The orbital theory ofPleistocene climate: support from a revised chronology of the marine δ 1 8 θrecord. In Berger, A., Imbrie, J., Hays, J., Kukla, G., and Saltzman, B.(Eds.), Milankovitch and Climate (Pt. 1): Dordrecht (D. Reidel), 269-305.
Jansen, E., Mayer, L., and Shipboard Scientific Party, 1991. GRAPE densityrecords and density cyclicity. In Kroenke, L.W., Berger, W.H., Janecek,T.R., et al., Proc. ODP, Init. Repts., 130: College Station, TX (OceanDrilling Program), 553-556.
Jenkins, G.M., and Watts, D.G., 1968. Spectral Analysis and Its Applications:San Francisco (Holden Day).
Johnson, T.C., Hamilton, E.L., and Berger, W.H., 1977. Physical properties ofcalcareous ooze: control by dissolution at depth. Mar. Geol, 24:259-277.
Kroenke, L.W., Berger, W.H., Janecek, T.R., et al., 1991. Proc. ODP, Init.Repts., 130: College Station, TX (Ocean Drilling Program).
Mayer, L.A., 1979. Deep sea carbonates: acoustic, physical and stratigraphicproperties. J. Sediment. Petrol, 49:819-836.
, 1991. Extraction of high-resolution carbonate data for paleoclimatereconstruction. Nature, 352:148-150.
Mayer, L.A., Shipley, T.H., Winterer, E.L., Mosher, D., and Hagen, R.A., 1991.SeaBeam and seismic reflection surveys on the Ontong Java Plateau. InKroenke, L.W., Berger, W.H., Janecek, T.R., et al., Proc. ODP, Init. Repts.,130: College Station, TX (Ocean Drilling Program), 45-76.
Pisias, N.G., and Moore, T.C., Jr., 1981. The evolution of Pleistocene climate:a time series approach. Earth Planet. Sci. Lett., 52:450-458.
Preiss, K., 1968. Nondestructive laboratory measurement of marine sedimentdensity in a core barrel using gamma radiation. Deep-Sea Res., Pt. A,15:401-407.
Raymo, M.A., Ruddiman, W.F., Backman, J., Clement, B.M., and Martinson,D.G., 1989. Late Pliocene variations in Northern Hemisphere ice sheetsand North Atlantic deep water circulation. Paleoceanography, 4:413^146.
Raymo, M.A., Ruddiman, W.F., Shackleton, N.J., and Oppo, D.W, 1990.Evolution of global ice volume and Atlantic-Pacific δ C gradients overthe last 2.5 m.y. Earth Planet Sci. Lett., 97:353-368.
Ruddiman, W.F., Cameron, D., and Clement, B.M., 1987. Sediment distur-bance and correlation of offset holes drilled with the hydraulic piston corer:Leg 94. In Ruddiman, WE, Kidd, R.B., Thomas, E., et al., Init. Repts.DSDP, 94, Pt. 2: Washington (U.S. Govt. Printing Office), 615-634.
Ruddiman, WE, Raymo, M.E., and Mclntyre, A., 1986. Matuyama 41,000-year cycles: North Atlantic Ocean and Northern Hemisphere ice sheets.Earth Planet. Sci. Lett., 80:117-129.
Schultheiss, P.J., and McPhail, S.D., 1989. An automated P-wave logger forreconstructing fine-scale compressional wave velocity structures in sedi-ments. In Ruddiman, W., Sarnthein, M., et al., Proc. ODP, Sci. Results,108: College Station, TX (Ocean Drilling Program), 407-413.
Shackleton, N.J., Berger, A., and Peltier, W.R., 1990. An alternative astro-nomical calibration of the lower Pleistocene time scale based on ODP Site677. Trans. R. Soc. Edinburgh, Earth Sci., 81:251-261.
Shackleton, N.J., and Shipboard Scientific Party, 1992. Sedimentation rates:toward a GRAPE density stratigraphy for Leg 138 carbonate sections. InMayer, L., Pisias, N., Janecek, T., et al., Proc. ODP, Init. Repts., 138, Pt. 1:College Station, TX (Ocean Drilling Program), 87-91.
Short, D.A., Nengel, J.G., Crowley, T.J., Hyde, W.T., and North, G.R., 1990.Filtering of Milankovitch cycles by Earth's geography. Quat. Res.
Wu, G., and Berger, W.H., 1991. Pleistocene δ^O records from Ontong JavaPlateau: effects of winnowing and dissolution. Mar. Geol, 96:193-209.
Date of initial receipt: 4 December 1991Date of acceptance: 12 May 1992Ms 130B-046
636

aaro
CLIMATIC CYCLICITY AT SITE 806
&67D
aδio
O330
aiso
zsm o
2790
2430
2250
zsm
100k 40k 20k
Period (years)
O510
asao
aiso
2970 O
2790
2010
2430
2250
2070
100k 40k 2Qk
Period (years)
Figure 16. A. Evolutionary spectra for Site 806 grain-size data from 5 to 2 Ma. Window and offset same as in Figure 2. B. Evolutionary spectra for Site 806 δ 1 8 θ
data from 5 to 2 Ma. Window and offset same as in Figure 2.
637

L.A. MAYER, E. JANSEN, J. BACKMAN, T. TAKAYAMA
δ l β θ Grsin size
Light
Heavy
Coarse
CT>
Fine
2.OO 2.25 2. SO 2.75 3.OO
Light
Heavy
- Coarse
cr>
- Fine
3.OO 3.25 3.5O 3.75 4.OO
Light - Coarse
Heavy
4.OO 4.5OAge (M
Figure 17. Comparison of grain-size (dash) and δ 1 8 θ (solid) records, both filtered with bandpass filter centered on 41,000 yr. Time
interval is 5-2 Ma. Filter goes to zero at 32,000 and 60,000 yr.
638

CLIMATIC CYCLICITY AT SITE 806
100k 40k
Period (years)aαk 1001c 40k
Period (years)
Figure 18. A. Evolutionary spectra from DSDP Site 573 GRAPE-derived carbonate record in the central equatorial Pacific, 4500-m water depth, 5-2 Ma. Windows
and offset as in Figure 2. B. Evolutionary spectra from Site 806 GRAPE record, 5-2 Ma. Windows and offset as in Figure 2.
639