
356S
256
INTERNATIONAL TRADE CHALLENGES AND OPPORTUNITIES FOR PAKISTAN COTTON-TEXTILE AND APPAREL SECTOR By Raana Ahsan PhD. Thesis NATIONAL UNIVERSITY OF MODERN LANGUAGES ISLAMABAD June 2008
-
Upload
mian-usman -
Category
Documents
-
view
73 -
download
2
Transcript of 356S

INTERNATIONAL TRADE CHALLENGES AND OPPORTUNITIES FOR
PAKISTAN COTTON-TEXTILE AND APPAREL SECTOR
By Raana Ahsan
PhD. Thesis
NATIONAL UNIVERSITY OF MODERN LANGUAGES ISLAMABAD
June 2008

International Trade: Challenges and Opportunities for Pakistan Cotton - Textile and Apparel Sector
By
Raana Ahsan Msc Quaid-e-Azam University
A THESIS SUBMITTED TO THE
NATIONAL UNIVERSITY OF MODERN LANGUAGES ISLAMABAD
DOCTOR OF PHILOSOPHY
In Management Sciences
To
FACULTY OF ADVANCED INTEGRATED STUDIES AND RESEARCH
(MS/HRD)
NATIONAL UNIVERSITY OF MODERN LANGUAGES ISLAMABAD
JUNE 2008
© Raana Ahsan, 2008

ii
DISSERTATION AND DEFENSE APPROVAL FORM The undersigned certify that they have read the following dissertation,
examined the defense, are satisfied with the overall exam performance, and recommend the thesis to the Faculty of Advanced Integrated Studies & Research for acceptance:
Dissertation Title: International Trade: Challenges and Opportunities for Pakistan Cotton -
Textile and Apparel Sector ___
Submitted By: Raana Ahsan Registration #:130-PhD/HRD/2003
Doctor of Philosophy Management Sciences
Dr. Zafar Altaf Name of Research Supervisor Signature of Research Supervisor Prof. Dr. Shazra Munnawar Name of Dean (FAIS&R) Signature of Dean (FAIS&R) Prof. Dr. Aziz Ahmad Khan Name of Rector Signature of Rector
____June 2008 ___
Date
NATIONAL UNIVERSITY OF MODERN LANGUAGES FACULTY OF ADVANCED INTEGRATED STUDIES & RESEARCH

iii
CANDIDATE DECLARATION FORM I RAANA AHSAN
D/o: MR. ZIA MALIK
Registration No: 130-PhD/HRD/2003 Discipline: Management Sciences
Candidate of Doctor of Philosophy at the National University of
Modern Languages do hereby declare that the dissertation: International Trade: Challenges
and Opportunities for Pakistan Cotton -Textile and Apparel Sector
submitted by me in partial fulfillment of PhD degree in discipline/department Faculty of
Advanced Integrated Studies & Research is my original work, and has not been submitted or
published earlier. I also solemnly declare that it shall not, in future, be submitted by me for
obtaining any other degree from this or any other university or institution.
I also understand that if evidence of plagiarism is found in my dissertation at any stage, even
after the award of a degree, the work may be cancelled and the degree revoked.
June 2008 Signature
Date
Raana Ahsan Name

iv
ABSTRACT The purpose of this research was to provide a comprehensive analysis of international trade
in order to evaluate and determine the challenges it poses, and opportunities, it offers to Pakistan’s Cotton, Textile and Apparel Sector. The research is based on secondary data sources. World Bank, WTO, UNCTAD, and a lot of other valuable and authentic reports from the authors of repute have been consulted to understand the increasingly complex international trade relations in a globalizing world. Volumes of government reports, position papers, handouts and books have been searched to appreciate the dynamics of Pakistan Cotton, Textile and Apparel Sector.
The research thesis endeavors to capture where the challenge is. What is at stake? Who are
the players? What are the opportunities in the international market place? How these challenges can be translated in to opportunities? Brief account of recent trade development and the relationship between global and domestic trading arrangements have been discussed. Role of politics in shaping decisions and managing power both at domestic and global level, significance of international commitments, and influence of historical, cultural back grounds, shared ideas and beliefs, and individual mind set in competing interests in the domestic economy have also been dilated upon.
Analytical findings reveal that Pakistan has comparative edge on the basis of comparative
advantage, reveal comparative advantage, relative trade advantage, and trade complementarities. The estimated value of revealed comparative advantage of cotton in Pakistan is 18 which is very high than unity which implies that Pakistan has great opportunities in the export of cotton and cotton manufacturing. Moreover, the estimated values of balasa and Lafay index for all cotton and cotton products are very high which reveal that Pakistan has trade competitiveness in the cotton and cotton manufacturing. The estimated value of relative trade index for primary products, cotton seed, cake of cotton seed and cotton linter, are positive which imply that these products are highly competitive, while oil of cotton seed and cake of cotton seed are uncompetitive. Furthermore, the value of trade complementarities variable for USA, EU, Japan and Canada (trading countries) are greater than unity except SAARC countries. This means that trading with SAARC countries in cotton and cotton products is less profitable as compared to other countries where cotton trading is highly profitable. Still domestic resource cost analysis (DRC) proves that Pakistan has greater opportunities in cotton production. The values of reveal comparative advantage and relative trade advantage further suggest that Pakistan has greater opportunities and prospects for exporting cotton and cotton manufacturing. Similarly trade complementarities show and suggest that Pakistan should focus on Middle East market with highest trade complementarities, followed by Canada, USA, EU, SAARC countries and then Japan. Bt transgenic cotton is widely grown in the cotton growing areas of Sindh and Punjab.
Bt cotton can play a significant role to enhance agricultural productivity as the productivity
of cotton in Pakistan is 0.5 ton/ha as compared productivity of Bt cotton in China is 9 ton/ha which implies a huge cotton productivity gap. This gap can be narrowed down by the adoption of Bt cotton in Pakistan which will have major impact on food security efforts in the country. Urgent efforts are required to focus on cost efficiency, higher productivity with quality of cotton, export diversification of cotton products, export oriented policy and market perspective to become more competitive in the global cotton market. There is also a need to strengthen the cotton - textile value chain with back ward and forward linkages. Unique products have to be developed, and a shift from comparative advantage to competitive advantage is the way forward.

v
TABLE OF CONTENTS
Chapter Page
DISSERTATION AND DEFENSE APPROVAL FORM ii
CANDIDATE DECLARATION FORM iii
ABSTRACT ……………………………………………………….. iv
TABLE OF CONTENTS ………………………………………….. v-ix
LIST OF TABLES …………………………………………………. x
LIST OF FIGURES ………………………………………………… xi
LIST OF CHARTS …………………………………………………. xii
LIST OF APPENDICES …………………………………………… xiii
LIST OF ABBREVIATIONS ……………………………………… xiv-xvii
DEDECATION ……………………………………………………… xviii
ACKNOWLEDGEMENT …………………………………………... xix
POLITICAL ECONOMY …………………………………………... xx
RESEARCH HYPOTHESIS ………………………………………... xxi
1. INTRODUCTION
1.1. Background of Study …………………………………………… 1
1.2. Economy of Pakistan …………………………………………… 2
1.2.1. Historical Perspective …………………………………….. 2
1.2.2. Recent Economic History …………………………………. 3
1.2.3. The Economy Today ………………………………………. 4
1.3. International Trade ………………………………………………. 20
1.4. Aid, Debt, Trade ………………………………………………. 22
1.4.1. Aid …………………………………………………………. 22
1.4.2. Debit …………………………………………………………. 23
1.5 Trade Not Aid ………………………………………….................... 24
1.6 Rationale of the Study ………………………………………….... 26
1.7. Limitations ………………………………………………….......... 26

vi
2. LITERATURE REVIEW
2.1 Origin of Trade …………………………………………………… 30
2.2 Evolution of Trade and Trade Theories ……………………..…… 30
2.3 Trade and Development ………………………………………….. 37
2.3.1 Why Trade ..………………………………………………… 37
2.3.2. The Benefits of Trade ………………………………………. 38
2.4 Globalization: A World without Borders…………………………. 41
2.4.1 WTO and the Agreement on Textiles and Clothing ………... 43
2.5 Regional Trading Arrangement …………………………………... 44
2.6 The Trade Policy Instruments ………………………………….. 46
2.7 Some other Important Concepts. ……………………………… 47
3. RESEARCH METHODOLOGY
3.1 Introduction ……………………………………………………… 60
3.2 Methodology and Research Design ……………………………… 61
3.2.1 Revealed Comparative Advantage ………………………… 61
3.2.2 Relative Comparative Advantage ………………………… 62
3.2.3 Opportunities for Supply Chain Integration……………… 63
3.2.4 Trade Complementarities …………..…………………… 63
3.3 Research Objectives…………… ……………………………… 64
3.4 Statement of Hypothesis………… ……………………………… 64
4. INTERNATIONAL POLITICAL ECONOMY
4.1 International Political Economy ………………………………... 67
4.2 Role of National Governments in International Political Economy…. 68
4.3 Political Economy of International Trade ………………………. 68
4.3.1 Trade Policy before World War I, 1860-1914 ……………. 68
4.3.2 International Trade from 1918 to 1939 …………………… 71
4.4 International Financial System ………………………………….. 76
4.4.1 International Monetary Fund (IMF)………………………… 77
4.4.2 Pakistan and IMF………………….………………………… 80

vii
4.4.3 The World Bank (WB)……………………………………… 80
4.5 World Trade Organization (WTO)………………………………. 82
4.5.1 Principles of Trading System ……………………………… 82
4.5.2 WTO Agreements ………………………………………… 84
4.5.3 Chronology of Key Events ………………………………... 85
4.5.4 Institutional Structure ……………………………………... 89
4.6 New Economic World Order ……………………………………. 91
4.6.1. Foreign Direct Investment (FDI)…………………………… 92
4.6.2 Multinational Corporations (MNCs)……………………… 94
4.7 Globalization …………………………………………………….. 96
4.8 Politics of Trade, Power and Money …………………………….. 99
4.8.1. Richest People in World …………………………………… 101
4.9 Political Economy of information ……………………………… 101
5. PAKISTAN COTTON-TEXTILE AND APPAREL SECTOR
5.1. International Trade of Cotton-Textile and Apparels ……………. 107
5.1.1. Trends in Clothing and Textile International Trade ………. 108
5.2. Pakistan Trade of Textile and Clothing …………………………. 110
5.3. Global Cotton Market …………………………………………… 111
5.4. Analyzing Opportunities for Pakistan Cotton-Textile and
Apparel Sector ………………………………………………..… 113
5.4.1 Revealed Comparative Advantage……………………….. 113
5.4.2 Itemized Trade Performance of Cotton and Cotton
Manufacturing ………………………………………….. 114
5.4.3 Relative Comparative Advantage………………………... 114
5.4.4 Trade Complementarities……………………………….. 115
5.5 Pakistan Cotton-Textile and Apparel Sector- The Value Chain…. 116
5.5.1 Pakistan Cotton Situation ………………………………….. 116
5.5.2 Ginning Sector …………………………………………….. 119
5.5.3 Spinning Sector ……………………………………………. 120
5.5.4 The Textile Sector …………………………………………. 122

viii
5.5.5 Issues in Yarn Production …………………………………. 123
5.5.6 Production of Cloth and Fabric ……………………………. 123
5.5.7 Textile Made-ups ………………………………………….. 125
5.5.8 Towels and Cleaning Cloths ………………………………. 126
5.5.9 Bed Wear and Linen ………………………………………. 127
5.5.10 Apparels ………………………………………………….. 129
5.6 Cotton Vision 2015 ……………………………………………… 131
5.6.1 Textile Vision 2005 ………………………………………… 131
5.7 Significance of Agriculture Sector for Pakistan …………………. 133
5.8 Opinion around the World ………………………………………. 134
5.9 Challenges in the Pakistan Cotton Yarn, Textile & Apparel Sectors 137
5.10 Concessions ……………………………………………………. 139
5.11 Politics of Concessions and Rebates ……………………………. 140
5.12 Opportunities and Future ……………………………………….. 141
6. TRADE AND INDUSTRIAL REGIME OF PAKISTAN
6.1. Institutional Framework for Trade ……………………………….. 146
6.1.2. Trade Regime ………………………………………………. 148
6.1.3 Trade Policy of Pakistan …………………………………… 150
6.1.4 Trade Policy Reforms ……………………………………… 150
6.1.5 Trade Policy 2006-07 ……………………………………… 152
6.1.6 Trade Policy 2007-08: Speech by the Commerce Minister ... 153
6.2 International Trading System and Pakistan ……………………… 156
6.3 WTO and Pakistan ……………………………………………….. 158
6.3.1 Trade Policy Review ……………………………………….. 158
6.3.2 WTO Notifications …………………………………………. 162
6.4 Industrial Sector of Pakistan ……………………………………… 162
6.4.1 Ancillary Textile Industry …………………………………. 163
6.5 Small and Medium Enterprises ………………………………..….. 165
6.6 Investment Policy ………………………………………………… 166
6.7 Industrial Policy ………………………………………………….. 166

ix
6.8 Textile Policy …………………………………………………….. 168
6.9 Private Sector Stake holders ……………………………………... 168
6.10 International Trade and Developing Countries ………………… 169
6.11 Economic Structure and Economy of Income ………………….. 170
6.12 Aim of Trade …………………………………………………… 171
6.13 Trade has worked for Pakistan …………………………………. 171
7. DEVELOPMENT OF BT COTTON IN PAKISTAN
7.1 Introduction ……………………..………………………………… 174
7.2 Background of Bt Cotton in the World……….. ………………… 175
7.3 Is there a Need to Grow Bt Cotton in Pakistan?………………….. 176
7.4 Development of Bt Cotton in Pakistan…………………………….. 177
7.5 Global Adoption of Bt Cotton …………………………………... 178
7.6 Adoption of Bt Cotton in Pakistan……………. ………………… 180
7.7 Impact of Bt Cotton in the World…………… ………………….. 180
7.8 Performance of Bt Cotton in Pakistan…………………………… 184
7.9 Conclusions and Suggestions… …………………………………. 187
8. CONCLUSIONS AND RECOMMENDATIONS…………………... 192
8.1. Recommendations ………………………………………………….. 194
8.1. Future Research ………………………………………………….. 196
BIBLIOGRAPHY ……………………………………………… 198

x
LIST OF TABLES Table Page 1. Sectoral Share in Gross Domestic Product (GDP)---------------------------------- 5 2. Sectoral Contribution to the GDG growth (% Points)------------------------------ 6 3. Composition of GDP growth (Point Contribution) --------------------------------- 6 4. Structure of Exports 2007-08 --------------------------------------------------------- 8 5. Export of Textile Manufactures ------------------------------------------------------ 9 6. Major Export Markets ------------------------------------------------------------------ 10 7. Structure of Imports -------------------------------------------------------------------- 11 8. Pakistan’s Major Imports -------------------------------------------------------------- 12 9. Unit Value Indices and Term of Trade (Base year 1990-91=100)---------------- 13 10. External Debt and Foreign Exchange Liabilities ($ Billion) ---------------------- 15 11. Applied tariff rates of major traders in 1925 ---------------------------------------- 73 12. GATT and WTO Trade Rounds------------------------------------------------------- 87 13. Distribution of World GDP, 1989 ---------------------------------------------------- 99 14. Top Companies sorted by Market Value--------------------------------------------- 100 15. Imports of Textile and Clothing in to Major Markets by Origin (2006) --------- 109 16. Pakistan Export of Textile Products -------------------------------------------------- 111 17. Itemized Trade Performance of Cotton & Cotton Manufacturing (2006)-------- 114 18. Competitive advantage of Cotton Products Based on the RTA Index-------------115 19. Trade Complementarities -------------------------------------------------------------- 115 20. Number of Ginning Factories and Machines ---------------------------------------- 119 21. Industry Losses due to Cotton Contamination, 2004-05 --------------------------- 120 22. Installed and Working capacity in the Spinning Sector , All Pakistan Installed Capacity (000) Working Capacity (000) Capacity Utilization (%)---- 121 23. Quality of Cloth Production, Mill Sector (% distribution)------------------------- 124 24. Exports of Textile Made-ups ---------------------------------------------------------- 126 25. Major Exports of Towels and Cleaning Cloth--------------------------------------- 127 26. Composition of Pakistan’s Exports of Bed Wear ----------------------------------- 128 27. Major Country Destination of Exports of Bed Wear from Pakistan-------------- 128 28. Export of Clothing ---------------------------------------------------------------------- 130 29. Loans to Textile Sector----------------------------------------------------------------- 141 30. Main Ministries and Agencies Responsible for Trade-Related Issues ----------- 147 31. Pakistan’s Tariff Structure: 2001-02 and 2004-08---------------------------------- 160 32. Preferential Rules of Origin and Tariffs in Trade Agreements, 2007 ------------ 161 33. WTO Notifications, 2001 to end-September 2007---------------------------------- 162 34. Profile of Textile Industry ------------------------------------------------------------- 164 35. Investment Policy Matrix -------------------------------------------------------------- 167 36. The Economic structures of Low-Middle-and High-Income Countries --------- 170
xi
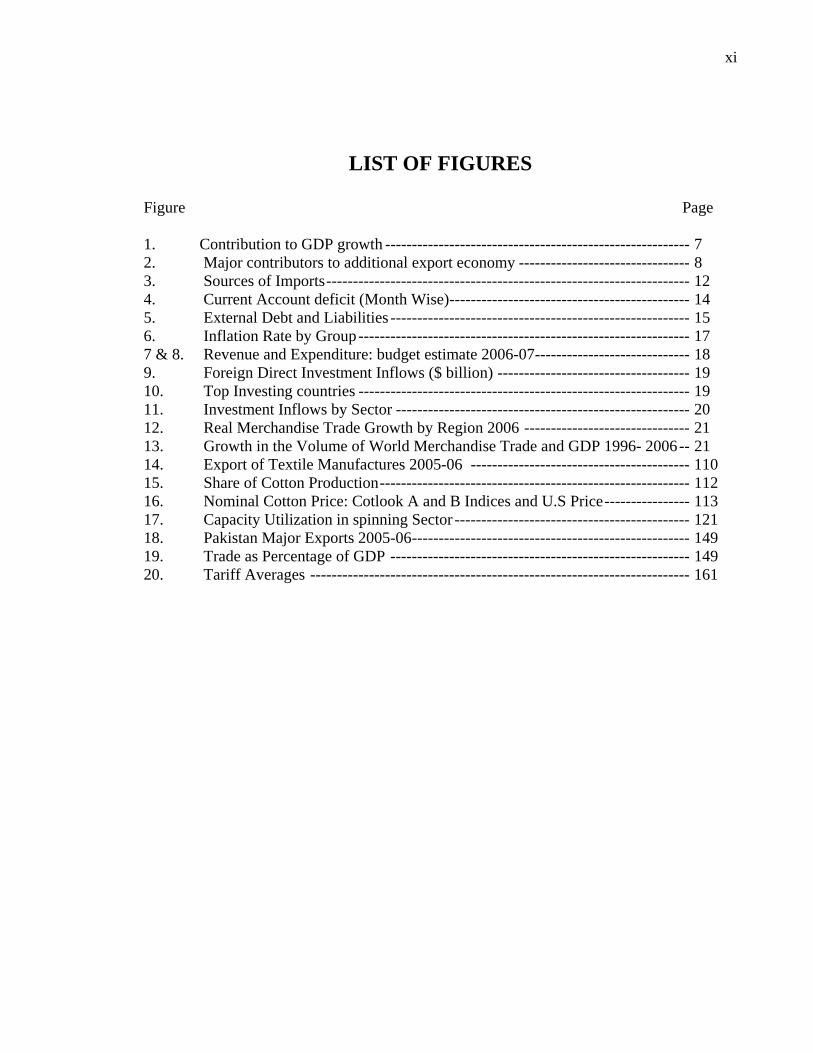
LIST OF FIGURES Figure Page 1. Contribution to GDP growth --------------------------------------------------------- 7 2. Major contributors to additional export economy -------------------------------- 8 3. Sources of Imports-------------------------------------------------------------------- 12 4. Current Account deficit (Month Wise)--------------------------------------------- 14 5. External Debt and Liabilities -------------------------------------------------------- 15 6. Inflation Rate by Group-------------------------------------------------------------- 17 7 & 8. Revenue and Expenditure: budget estimate 2006-07----------------------------- 18 9. Foreign Direct Investment Inflows ($ billion) ------------------------------------ 19 10. Top Investing countries -------------------------------------------------------------- 19 11. Investment Inflows by Sector ------------------------------------------------------- 20 12. Real Merchandise Trade Growth by Region 2006 ------------------------------- 21 13. Growth in the Volume of World Merchandise Trade and GDP 1996- 2006-- 21 14. Export of Textile Manufactures 2005-06 ----------------------------------------- 110 15. Share of Cotton Production---------------------------------------------------------- 112 16. Nominal Cotton Price: Cotlook A and B Indices and U.S Price---------------- 113 17. Capacity Utilization in spinning Sector -------------------------------------------- 121 18. Pakistan Major Exports 2005-06---------------------------------------------------- 149 19. Trade as Percentage of GDP -------------------------------------------------------- 149 20. Tariff Averages ----------------------------------------------------------------------- 161

xii
LIST OF CHARTS
Chart Page 1. World Merchandise Export, 1900-1950 ------------------------------------------- 74 2. World Merchandise Export Prices, 1900-1950 ----------------------------------- 75 3. Volume Growth of World Merchandise Export, 1900-1950 ------------------- 75

xiii
LIST OF APPENDICES
Appendices Page
A. Installed Capacity in the Textile Sector (For month of Dec 2007) ----------- xxii B. Dewan Salman Fiber Ltd----------------------------------------------------------- xxxv C. Nishat (Chunian) Limited---------------------------------------------------------- xxxvi D. Ibrahim Fibers (IBFL)-------------------------------------------------------------- xxxvii E. The Crescent Textile Mills Limited ---------------------------------------------- xxxviii

xiv
ABBREVIATIONS ADB : Asian Development Bank
AMIC : Agri - Marketing Integrated Centers
AOA : Agreement on Agriculture
APEC : Asia Pacific Economic Cooperation Group
APTMA : All Pakistan Textile Mills Associations
ASEAN : Association of South East Asian Nations
Association
ATC : Agreement on Textiles and Clothing
BMR : Balancing Modernization Replacement Program
CAFTA : Central American Free Trade Area
CARs : Central Asian Republics
CEC : Cotton Export Corporation, Government of Pakistan
CETP : Combined Efferent Treatment Plants
CIF : Cost Insurance and Freight
CKD : Complete Knock Down
CPI : Consumer Price Index
CPI : Consumer Price Index
DDA : Doha Development Agenda
DSU : Dispute Settlement
DTTs : Double Taxations Treaties
ECC : Economic Coordination Committee
ECO : Economic Co-operation Organization
EDL : External Debt Liabilities
EOU : Export Oriented Units
ESCAP : Economic and Social Commission for Asia and Pacific
Region
EU : European Union
FBR : Federal Board of Revenue
FDI : Foreign Direct Investment

xv
FI : Foreign Investment
FPCCI : Federation of Pakistan Chamber of Commerce and Industry
FTA : Free Trade Area/Free Trade Agreement
GATS : General Agreement on/Trade in Services
GATT : General Agreement on Tariffs and Trade
GCC : Gulf Cooperation Council
GDP : Gross Domestic Product
GNP : Gross National Product
GOP : Government of Pakistan
GSP : Generalized System of Preference
GWP : Gross World Product
IDA : International Development Association
IDBR : International Bank for Reconstruction and Development
IIAs : International Investment Agreements
ILO : International Labor Organization
IMF : International Monetary Fund
ITA : Information Technology Agreement
ITO : International Trade Organization
LCV : Light Carrier Vehicle
LDCs : Least Developed Countries
LTF-EOP : Long Term Financing of Expert Oriented Projects
M&As : Mergers and Acquisitions
MFA : Multi-Fiber Arrangement
MFN : Most Favored Nation
MMF : Man-made Fiber
MNC : Multinational Corporation
MOU : Memorandum of Understanding
MTN : Multilateral Trade Negotiations
NAFTA : North America Free Trade Agreement
NTC : National Tariff Commission
NTTFC : National Trade & Transport Facilitation Committee

xvi
NWFP : North West Frontier Province
OIC : Organization of Islamic Countries
PCFAMEA : Pakistan Cotton Fashion Apparel Manufactures and
Exporters
PHDEB : Pakistan Horticulture Development & Expert Board
PTA : Preferential Trade Agreement
QIZs : Qualified Industrial Zone
R & D : Research and Development
ROZs : Reconstruction Opportunity Zones
RTA : Registered Trade Agreements
SAARC : South Asia Association of Regional Co-operation
SAPTA : South Asian Preferential Tariff Arrangement
SME : Small & Medium Enterprise
SMEDA : Small & Medium Enterprise Development Authority
SPI : Sensitive Price Index
SPS : Sanitary and Phyto-sanity Measures
SRO : Statutory Regulatory Order
TBT : Agreement on Technical Barriers to Trade
TDAA : Trade Development Authority Pakistan
TDPA : Trade Development Pakistan Authority
TMB : Textile Monitoring Body
TNC : Trade Negotiating Committee
TNCs : Transnational Corporations
TPRB : Trade Policy Review Body
TPRM : Trade Policy Review Mechanism
TQMD : Textile Quota Management Directorate
TRB : Trade Review Body (WTO)
TRIPs : Agreements on Trade Related Aspects of Intellectual
Property Rights
TSB : Textile Surveillance Body
TTFP : Trade & Transparent Facilitation Project
xvii
UK : United Kingdom
UN : United Nations
UNCTAD : United National Conference on Trade and Development
UNICEF : United National Children’s Fund
USA : United States of America
USDA : United States Agricultural Department
WEF : World Economic Forum
WPI : Whole Sale Price Index
WTO : World Trade Organization

xviii
DEDICATION
To
DR. ZAFAR ALTAF
My Research Supervisor
His one sentence,
“Raania, prove it to yourself”
changed my mindset.

xix
ACKNOWLEDGEMENT
“All glory goes to Allah”
Thank you Ammi Jan, what ever I am today, I owe it to you. You taught me how to
face the challenges with smile and keep on struggling. Years ago you left us but your love
and care still warm my heart. I love you Ma!
Thank you Daddy for making me a better human being with faith, values and
principles!
I deeply appreciate my siblings for their affection, encouragement and practical help
in my efforts to produce something worth while.
My friends …. “Every time when I was down, they always come around and put my
feet back on the ground.” Thank you friends!
I am indebted to my colleagues and co – workers for their cooperation and support.
They made things easier for me.
Very humbly, I present tributes to all those economists and scholars whose vision
and knowledge; I deeply benefited from in my research endeavors.
Writing this thesis was a test of my commitment, patience and professionalism, and I
am extremely obliged to all those who directly and indirectly helped me in achieving the
target.

xx
POLITICAL ECONOMY
Of course, as in the instances of alchemy, astrology, witch- craft, and
other such popular creeds, political economy has a plausible idea at the root
of it. “The social affection,” says the economist, “are accidental and
disturbing elements in human nature; but avarice and the desire of progress
are constant elements. Let us eliminate the constants, and, considering the
human being merely as a covetous machine, examine by what laws of labor,
purchase, and sale, the greatest accumulative result in wealth is obtainable.
Those laws once determined, it will be for each individual afterwards to
introduce as much of the disturbing affectionate element as he chooses, and
to determine for himself the result on the new conditions supposed.”
JOHN RUSKIN
The Genius of John Ruskin
Editor: J. D. Reseuberg
Houston, Mifflin Company Boston, 1963

xxi
RESEARCH HYPOTHESIS
Pakistan is facing a new structure in international trade and the country should be;
• Able to work its strengths
• Develop itself from a low income country to a middle level country through its trade
in Textiles
1
CHAPTER 1
INTRODUCTION
1.1 Background of the Study The Indus Valley civilization, one of the oldest in the world and dating back at least
5,000 years, spread over much of what is presently called Pakistan (The World Fact Book,
2007). In the 21st century, Pakistan is a rapidly developing nation, strategically located, has
plenty of natural resources, and with a growing market of 160 million people.
Pakistan has a very narrow export base. The Cotton-Textile and Apparel Sector
accounts for more than 60 percent of Pakistan’s export earnings. According to Altaf (2007),
what happens to the economy of Pakistan is very much dependent on the cotton- yarn-
textile-apparel complex.
After the elimination of MFA and related quota regime, the international market
place has become aggressively competitive with challenges at one hand and on the other lots
of opportunities for smart players. The international trade of cotton-textile and apparel poses
huge challenges to this important sector of Pakistan’s economy.
This thesis aspires to establish that a vibrant and profound trade regime can give a
boast to the economy of Pakistan. The cotton-textile –apparel sector as the central pillar of
the trade regime can contribute significantly towards welfare and prosperity of the country.
It argues that macroeconomic (over all policy) and microeconomic (firm level) frameworks
have complementarities that reinforce each other for desired economic outcomes. It further
suggests that business friendly not businessmen friendly domestic trade policies can create a
business and entrepreneur’s culture that can address the supply side constrain, and can act as
a trouble shooter. It also deliberates the role of state and institutions in the international and
domestic economies, and how international political dynamics and commitments affect this
role and policies. It has also been argued that economic activities are determined by
historical norms, culture, and the political systems. Advancement of technology,
2
information, knowledge and other dimensions of globalization have deeply affected the way
of doing business.
This thesis, while giving the recount of the challenges for cotton-textile and apparel
sector of Pakistan in international trade arena, dilates upon the silver lining therein, and
suggests the way forward for positioning itself with in the global markets. “The canvass is
big and the brush should be big enough to match the canvass”.
1.2 Economy of Pakistan 1.2.1 Historical Perspective
Pakistan was a poor, resource less and predominantly agricultural economy at its
creation in 1947 (Wikipedia, 2007), after division of the sub-continent. The creation of
Pakistan, in economic terms was the break –up of a customs union that had lasted for nearly
three hundreds years, (Altaf 1983). Agriculturally, the area was the granary for the
undivided India and provided cotton and jute for the industrialized part of the sub-continent,
(Altaf, 1983). While calling Pakistan an “economic monstrosity”, he further mentions that
Pakistan inherited industrial assets worth only Rs. 580 million.
During 1950-60, this policy paid dividends but at the cost of the agriculture sector
and growth was sluggish. Attempts were made to correct the situation by an increased
inflow of aid. Further, the support price for agricultural products was increased, though still
below market prices.
The decade of 1970s witnessed the withdrawal of these economic incentives either
partially or completely. The private sector started taking capital out of the country to invest
in other third world countries, and the foreign loan commitments in the public sector swelled
up. The small entrepreneurs were burdened with the liability of repayments of these extra
loans, Altaf maintains. However, growth rates indicate, “Development was emphasized”
during this period.
Nationalization of private enterprises during late 1970s was a blow to private sector
participation in economic activities. However, in early 1980s, government began a policy of

3
greater reliance on private enterprise to achieve economic goals. This policy continued
throughout the late 1980s and early 1990s. The GDP growth rate was 6.5 percent in
the1980s, and the trade gap was $ 2.5 billion.
The government of Nawaz Sharif (1990-93) introduced a program of economic
reforms aimed at privatization, deregulation, and liberalization. Priority was given to
denationalizing. Abolishing government’s monopoly in the financial sector, and selling
utilities to private interests were the hall mark of this period. Though government made
progress in liberalizing the economy, however, it failed to control a growing budget deficit.
The government of Benazir Bhutto (1994) continued the policies of both
deregulation and liberalization, and the tighter fiscal policies. The government devoted
significant resources to health, education, and especially for women.
1.2.2 Recent Economic History
In 90s, Pakistan experienced severe fiscal imbalances, and its debt grew rapidly. The nuclear
tests of May 1998 and imposition of economic sanctions by the G-7 triggered the situation.
In early 1999 Pakistan narrowly escaped defaulting on its debt. Although the country had
been receiving IMF assistance, the government faced difficulty in meeting the
conditionalities. The IMF program was suspended in July 1999, and resumed later during
Musharraf’s government. In 2004, government announced that IMF assistance was no
longer required. Thus program ended in that year, (Daily Times, 2004). Musharraf's
economic revival agenda continued to include measures to widen the tax net, formation of
private sector assets, governance reforms, privatization, and deregulation.
Pakistan's nominal gross domestic product (GDP) in 1997 was US$ 75.3 billion.
However, in 2002, it came down to US$ 71.5 billion. During this period, the real GDP grew
by 3.0 per cent on an average. Government debt was 82 per cent of its GDP in 2002. Over
one-third of the government's revenue was being used up in servicing of the debt and
liabilities.
4
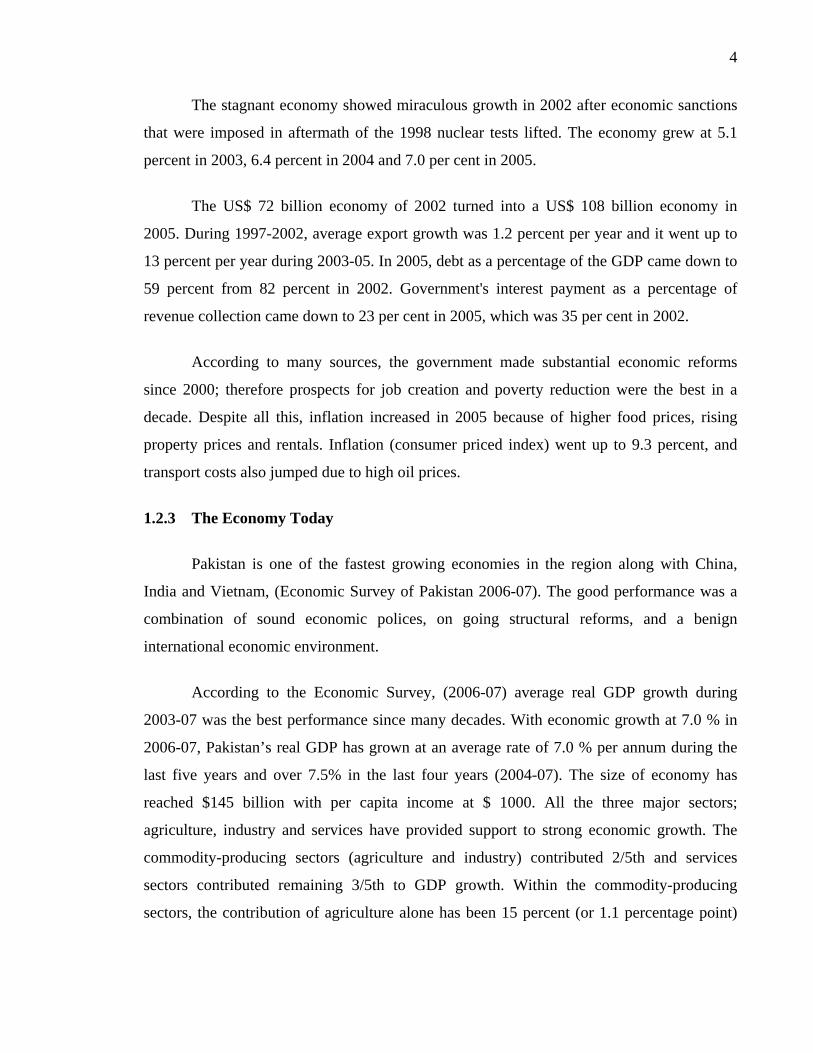
The stagnant economy showed miraculous growth in 2002 after economic sanctions
that were imposed in aftermath of the 1998 nuclear tests lifted. The economy grew at 5.1
percent in 2003, 6.4 percent in 2004 and 7.0 per cent in 2005.
The US$ 72 billion economy of 2002 turned into a US$ 108 billion economy in
2005. During 1997-2002, average export growth was 1.2 percent per year and it went up to
13 percent per year during 2003-05. In 2005, debt as a percentage of the GDP came down to
59 percent from 82 percent in 2002. Government's interest payment as a percentage of
revenue collection came down to 23 per cent in 2005, which was 35 per cent in 2002.
According to many sources, the government made substantial economic reforms
since 2000; therefore prospects for job creation and poverty reduction were the best in a
decade. Despite all this, inflation increased in 2005 because of higher food prices, rising
property prices and rentals. Inflation (consumer priced index) went up to 9.3 percent, and
transport costs also jumped due to high oil prices.
1.2.3 The Economy Today
Pakistan is one of the fastest growing economies in the region along with China,
India and Vietnam, (Economic Survey of Pakistan 2006-07). The good performance was a
combination of sound economic polices, on going structural reforms, and a benign
international economic environment.
According to the Economic Survey, (2006-07) average real GDP growth during
2003-07 was the best performance since many decades. With economic growth at 7.0 % in
2006-07, Pakistan’s real GDP has grown at an average rate of 7.0 % per annum during the
last five years and over 7.5% in the last four years (2004-07). The size of economy has
reached $145 billion with per capita income at $ 1000. All the three major sectors;
agriculture, industry and services have provided support to strong economic growth. The
commodity-producing sectors (agriculture and industry) contributed 2/5th and services
sectors contributed remaining 3/5th to GDP growth. Within the commodity-producing
sectors, the contribution of agriculture alone has been 15 percent (or 1.1 percentage point)

5
while 25 percent (or 1.8 percentage point) contribution came from industry. Services sectors
contributed almost 60 percent (or 4.2 percentage points).
Table 1: Sectoral Share in Gross Domestic Product (GDP)
Structure of Economy
The Economic Survey (2006-07) further maintains that all three sectors; agriculture,
services and industrial/ manufacture contributed to GDP. Agriculture remains the single
largest sector of the national economy, and main source of foreign exchange earnings. It
accounts for 20.9 percent of GDP, employs major share of the total work force, and supplies
raw materials to industry as well as a market for industrial products. However, the internal
composition of the agriculture sector has changed gradually.
The share of crops sub-sector in agriculture has gradually declined from 65.1% in
1990-91 to 47.9% in 2006-07, and the share of livestock in agriculture has increased from
29.8% to 49.6% in the same period. The contributions of fishing and forestry have been
insignificant with only 0.3% and 0.2% respectively.
Share of manufacturing in the GDP has increased from 14.7 percent in 1999-2000 to
19.1% in 2006-07. Large-scale manufacturing accounting for 69.9% of overall

6
manufacturing, registered a growth of 8.8% in 2006-07. The services sector accounts for
53.3 percent in the GDP, and consists of wholesale and retail trade; transport, storage and
communications, financial and insurance services. The services sector grew by 8.5% in
2004-05, by 9.6% in 2005-06 and by 8.0% in 2006-07. Finance and insurance sectors have
been the major drivers of the growth, and showed growth of 30.8%, 33.0% and 18.2%,
respectively in these three years. The following Table will further illustrate the sectoral
contribution of these sectors to GPD.
Table 2: Sectoral Contribution to the GDP Growth (% Points)
SECTOR 2002-03 2003-04 2004-05 2005-06 2006-07 Agriculture 1.0 0.6 1.5 0.4 1.1 Industry 1.0 3.8 3.1 1.3 1.8 Manufacturing 1.1 2.3 2.7 1.8 1.6 Services 2.7 3.1 4.4 4.9 4.2 Real GDP (Fc) 4.7 7.5 9.0 6.6 7.0 Source: Economic Survey 2006-07 Consumption, investment and exports contributed to economic growth. Following illustrates
composition and contribution to GDP growth.
Table 3: Composition of GDP Growth (Point Contribution)
FLOWS 2000 2001
2001 2002 20022003 20032004 2004
2005 2005 2006
2006 2007
Avg 2003 2007
Private Consumption Public Consumption Total Consumption [C] Gross Fixed Investment Change in Stocks Total Investment [I] Exports (Goods & Serve.) [X] Imports (Goods & Serve.)[M] Net Exports [X-M] Aggregate Demand (C+I+X) Domestic Demand (C+I)
0.4 -0.5 -0.1 0.7 0.0 0.7 1.6
0.3
1.3 2.3
0.7
1.0 1.2 2.2 -0.1 0.0 0.0 1.5
0.4
1.0 3.7
2.2
0.3 0.6 0.39 0.6 0.4 1.1 4.5
1.6
2.8 6.5
2.0
7.1 0.1 7.2 -1.0 0.1 -0.9 -0.3
-1.3
1.0 6.0
6.3
8.7 0.1 8.8 1.8 0.7 2.5 1.7
5.4
-3.7 13.0
11.3
2.4 3.9 6.4 2.5 -0.5 2.0 1.8 3.2 -1.5
10.2 8.4
3.0 0.2 3.2 3.3 0.1 3.4 0.1 0.2 -0.2
6.6 6.5
5.3 1.1 6.4 1.7 0.1 1.8 0.8 1.9 -1.1
9.0 8.1
GDP MP 2.0 3.2 4.8 7.4 7.7 6.9 6.4 7.1 Source: Economic Survey 2006-07

7
Figure 1: Contribution to GDP growth
Exports
Pakistan is dependent on agriculture–based exports. Pakistan’s export is based on
commodities and not on products. Commodities tend to be more volatile in price while
products have to compete with other countries, the only exception being a unique product,
(Salicornia, Seabuckthorn). In 2005-06 exports were $ 13.46 billion, whereas in 2006-07,
export target was $ 18.6 billion, (12.9 percent higher than last year). During the first ten
months (July-April), export went up by 3.4 percent: a modest rise from $ 13.46 billion to $
13.9 billion in the same period last year. Export of textile manufacture grew by 6.2 percent:
Knitwear (13.9%) ready made garments (6.8 %) made up articles (8.9%), cotton yarn (4.6
%), towels (2.6%) and other textile material (17.2 %). However, export of raw cotton, cotton
cloth and bed wear declined. Export of food group also declined by 3.5 percent due to
decline in export of rice and fruits. Like wise, exports of petroleum products declined by 2.7
%. Engineering goods showed a growth of 6.7 % and over all exports went up by $ 452.1 in
the first ten months of 2006-07 and the textile sector contributed $ 516.1 in this increase.

8
Figure 2: Major contributors to additional export earnings (Jul-Apr 06-07)
Others, 64.8
Food Group, 13.1
Other Manufacturer,
65.6
Textile Manufacturer,
114.1
TextileManufacturer
OtherManufacturer
Others
Food Group
Source: Economic Survey (2006-07
Table 4: Structure of Exports 2007-08

9
Pakistan has a very narrow export base and exports are highly concentrated in a few
items cotton, textile manufactures, leather, rice, synthetic textiles and sports goods are the
main export commodities, and accounted for 77.2 percent of total exports during the first
nine months of 2006-07. Cotton manufacturers contributed 61.5 percent, followed by leather
(4.5%), rice (6.6%), synthetic textiles (3.0%) and sports goods (1.6%).
Table 5: Export of Textile Manufactures
ITEM 99-00 00-01 01-02 02-03 03-045 04-05 05-06 06-07* Cotton Yarn 19.2 18.7 16.1 12.9 14.0 12.7 13.7 13.3 Cotton Cloth 19.6 17.9 19.6 18.6 21.3 23.3 21.6 18.5 Knitwear 15.9 15.8 14.6 15.9 18.1 18.9 17.6 18.3 Bed war 12.7 12.9 15.9 18.4 17.2 16.4 20.8 18.1 Towels 3.5 4.2 4.6 5.2 5.0 5.9 5.8 5.5
Tents, Canvas & Tarpaulin
0.9 0.9 0.9 1.0 0.9 0.8 0.3 0.7
Readymade Garments 13.8 14.4 15.1 15.1 12.4 12.9 13.9 13.1
Synthetic Textiles Total
8.2 9.5 7.1 7.9 5.9 3.5 2.0 4.7
Made up Articles 5.5 5.7 6.1 5.0 5.2 5.5 4.3 4.1 Others 0.7 - - - - 0.1 0.1 2.9 100.0 100.0 100.0 100.0 100.0 100.0 100.0 100.0
*July-March (Provisional) Source: FBS & Finance Division
The structure/ composition of export have gone through changes with time. The
share of exports of primary good has declined and exports of semi- manufactured and
manufactured goods have gone up gradually.
Pakistan’s exports directions are highly concentrated in few countries. The US, UK,
Germany, Japan, Hong Kong, Dubai and Saudi Arabia are the traditional export
destinations. These countries account for one-half of Pakistan’s exports. The US alone
accounts for 28 percent of Pakistan exports.

10
Table 6: Major Export Markets
Imports
Since 2003 imports were on the rise, but in 2006-07 the import growth declined. In
2005-06 imports were $28.6 billion. In 2006-07, imports were targeted to decline by 2.1
percent. Growth in import decelerated to 8.9 percent during the first ten months (July-April)
of 2006-07 as against the increase of 40.4 percent in the same period last year. The decline
was due to pursuance of tight monetary policy, softening of international oil prices, decline
in the imports of fertilizer, and iron & steel products. Pakistan's imports are highly
concentrated in few items: machinery, petroleum & petroleum products, chemicals, transport
equipments, edible oil, iron & steel, fertilizer and tea. The eight categories accounted for
75.5 percent of total imports during 2006-07. Among these, machinery, petroleum &
petroleum products and chemicals accounted for 57.7 percent of total imports. Pakistan’s
imports sources limited, and over 40 percent of the imports come from the USA, Japan,
Kuwait, Saudi Arabia, Germany, the UK and Malaysia.

11
Table 7: Structure of Imports

12
Figure 3: Sources of import
USA, 8.1Japan, 5.7
Kuw ait, 5.4
Saudi Arabia, 11.5
Germany, 4.1U.K, 2.3
Malaysia, 3
Others, 59.9
USA
Japan
Kuw ait
Saudi Arabia
Germany
U.K
Malaysia
Others
Source: Economic Survey 2006-07 Table 8: Pakistan’s Major Imports
Trade Balance
Despite decline trend in imports, the merchandise trade deficit widen due to fall in
exports. The merchandise trade deficit widen to $11.1 billion in the first ten months (July-

13
April) of 2006-07 as against $9.5 billion in the same period last year. However, trade deficit,
as percentage of GDP is likely to be narrow down to 9.0 percent in 2006-07 as against 9.5
percent last year.
Term of Trade
With base year 1990-91 (equal to 100) the term of trade aggregated to 64.4 during
2006-07. It was 66.4 in 2005-06, thus registered a decrease of 3.4 %. The increase in unit
prices of petroleum and machinery caused this decline.
Table 9: Unit Value Indices and Term of Trade (Base Year 1990-91=100)
Current Account Balance
The current account deficit widened to $ 6.2 billion (4.3% of GDP) in the first nine
months (July-March) of the 2006-07 from $ 4.6 billion (3.6% of GDP) in the same period
last year. Despite the decline in the import growth (10.2 percent), the current account deficit
has widened due to “not satisfactory” performance of exports, and deficit in services sector.

14
Figure 4: Current account deficit (month wise)
Source: Pakistan Economic Survey 2006-07
Workers’ Remittances
Workers’ remittances are the third largest source of foreign exchange inflows after
exports and foreign investment. The inflows maintained the rising trend. Workers’
remittances totaled $ 4.45 billion in the first ten months (July-April) of the fiscal year as
against $ 3.6 billion in the same period last year, depicting an increase of 22.6 percent.
Debt and Liabilities
This includes all Government debt and liabilities denominated in foreign currency.
Pakistan’s total stock of external debt grew at an average rate of 7.4 percent per annum
during 1990-99, rising from $ 20.5 billion to $ 38.9 billion in 1999. However, there was a
slight decline in 1999-2000 ($37.9 billion.) It grew again by 1 percent in 2005, 2.9 percent
in 2006 and 4.4 percent in 2007, making the total external debt liabilities (EDLs) $ 38.86
billion at the end of March 2007.

15
Figure 5: External debt and liabilities
Source: Pakistan Economic Survey 2006-07
However, EDLs as a percentage of GDP have declined from 51 percent in 2002 to
29.4 percent in 2006 and 27.1 percent in 2007. EDLs are medium and long term borrowing
from multilateral and bilateral lenders.
Table 10: External Debt and Foreign Exchange Liabilities ($ Billion)

16
Debt Servicing
The averaged debt servicing during 1999- 2000 to 2003-04 was above $ 5 billion per
annum. This came down to $ 3 billion in 2005 - 06. Whereas an amount of 2.2 billion were
paid in 2006-07 (July- March) and the rolled over amount declined from $ 4.1 billion in
1999- 2000 to $ 1.1 billion in 2006-07.
Pakistan and International Capital Markets
Pakistan participates in the global capital markets by issuance of bonds both
conventional and Islamic. In 2006 Euro bond of $ 500 million (10 year) and $ 30 million (30
year) were issued. In 2005 Islamic Bond (Sukuk) worth $ 600 million was issued, and was
successful in the Middle East markets. Euro bonds worth $ 750 million at a fixed rate of
6.875 percent were issued in 2007; the issue was “oversubscribed by 7 times”. The
international magazine “Business Week” has declared Pakistan’s KSE 100 Index the best-
performing stock market index in the world in the past few years. In 2005, the stock market
capitalization of listed companies was valued at $45,937 million by the World Bank.
Inflation
The Consumer Price Index (CPI) based inflation was 7.9%, and Sensitive Price
Index (SPI) inflation was 11.1% in 2006-07 (July–April). The food group was largest
component of the CPI and it showed an increase of 10%. The non-food prices grew at a
slower rate and showed average inflation of 6.2 %. The increase in Wholesale Price Index
(WPI) in 2006-07 was lower than of the last year.

17
Figure 6: Inflation rate by group
Foreign Exchange Reserves
At the end of April 2007, the total liquid foreign exchange reserves were $ 13.3738
billion. They were sufficient to meet over 6 months of imports. Last year’s reserves were $
13.137 billion.
Exchange Rate
Exchange rate remained quite stable during 2007. Though, rupee depreciated slightly
(0.7%) from Rs.60.2138 per dollars as at end June 2006 to Rs.60.6684 as of end April 2007.
Fiscal Budget
Fiscal year starts from 1 July and ends at 30 June.

18
Figure 7 & 8: Revenue and expenditure: budget estimate 2006-07
Total Revenues, 1163
Total Expenditure, 1536.6
Total Revenues
Total Expenditure
FBR Revenue, 835
Provincial Tax Revenues, 44.8
Others, 5.9
Non Tax Revenues, 277.3
Current Expenditure (Federal &
Provincial), 1106.5
Development Expenditure ^Net Lending, 312.3
FBR Revenue
Provincial Tax Revenues
Others
Non Tax Revenues
Current Expenditure (Federal &Provincial)Development Expenditure ^NetLending
Source: Ministry of Finance (Budget Wing)
Foreign Direct Investment (FDI)
According to different reports, Pakistan is now the most investment-friendly nation
in South Asia. The World Bank (2006) has ranked Pakistan at 74th position in the world on
ease of doing business that is much ahead of China and India, which are at 93rd and 134th
respectively. The Foreign Investment (FI) flows were US $ 8.4 billion in 2006-07. Foreign
Direct Investment (FDI) was $5.125 billion in 2006-07, with an increase of 46%.
Privatization proceeds in 2006-07 were $266.4 million. Private portfolio investment was

19
$1,820 billion in 2006-07. The USA was the largest investor in 2006-07 followed by the
UK.
Figure 9: Foreign direct investment inflows ($ billion)
1,524
3,521
5,125
237 335 306 354 442
1,102682 601 472 470 322 485
0
1,000
2,000
3,000
4,000
5,000
6,000
90/91
91/92
92/93
93/94
94/95
95/96
96/97
97/98
98/99
99/00
00/01
01/02
02/03
03/04
04/05
05/06
06/07
Source: Board of Investment
Figure 10: Top investing countries
Source: Board of Investment
0200400600800
1000120014001600
USAUAE UK
Netherl
ands
China
Switzer
land
Saudi
Arabia
2004-052005-062006-07
20
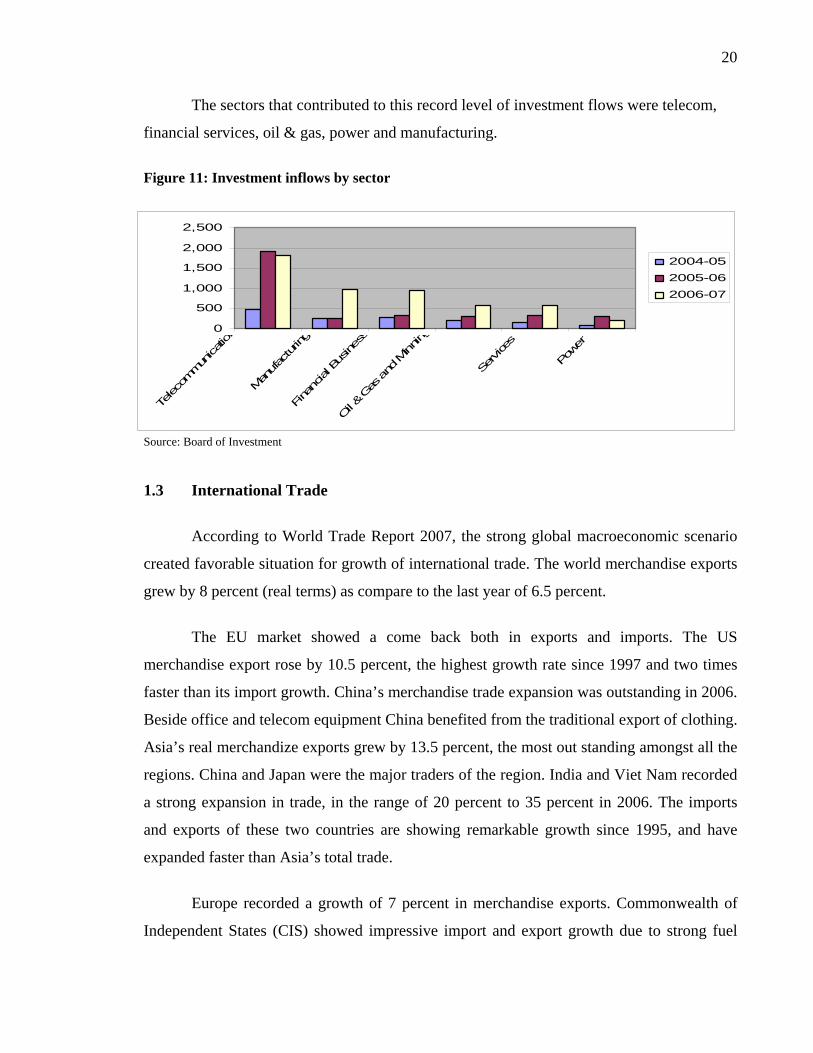
The sectors that contributed to this record level of investment flows were telecom,
financial services, oil & gas, power and manufacturing.
Figure 11: Investment inflows by sector
Source: Board of Investment
1.3 International Trade
According to World Trade Report 2007, the strong global macroeconomic scenario
created favorable situation for growth of international trade. The world merchandise exports
grew by 8 percent (real terms) as compare to the last year of 6.5 percent.
The EU market showed a come back both in exports and imports. The US
merchandise export rose by 10.5 percent, the highest growth rate since 1997 and two times
faster than its import growth. China’s merchandise trade expansion was outstanding in 2006.
Beside office and telecom equipment China benefited from the traditional export of clothing.
Asia’s real merchandize exports grew by 13.5 percent, the most out standing amongst all the
regions. China and Japan were the major traders of the region. India and Viet Nam recorded
a strong expansion in trade, in the range of 20 percent to 35 percent in 2006. The imports
and exports of these two countries are showing remarkable growth since 1995, and have
expanded faster than Asia’s total trade.
Europe recorded a growth of 7 percent in merchandise exports. Commonwealth of
Independent States (CIS) showed impressive import and export growth due to strong fuel
0
500
1,000
1,500
2,000
2,500
Telec
ommun
icatio
n
Man
ufac
turin
g
Fina
ncial Bus
iness
Oil &
Gas
and
Minn
ing
Service
s
Powe
r
2004-052005-062006-07

21
and metal prices in the world markets. Africa’s merchandise exports increased by 21
percent; faster than its imports. Middle East trade was affected by oil market development
and grew only by 19 percent. Over all exchange rate development had a moderate affect on
the dollar price level of trade goods. However, a weaker yen contributed to a weaker dollar
export prices of Japan, where as Euro and Pound balanced each other during 2005-06.
World merchandise exports in dollar terms were $11.76 trillion, and inflation factored in
about 40 percent of this value change. Commercial services exports rose by 11 percent ($
2.71trillion) in 2006.
Figure 12: Real merchandise trade growth by region 2006 (Annual Percentage Change)
Figure 13: Growth in the volume of world merchandise trade and GDP 1996-2006 (annual
percentage change)

22
Pakistan ranked 65 in global merchandize exports and 50 in imports during 2006. Its
share in global exports and imports is 0.14 and 0.24 percent in 2006, (UNCTAD, Trade
Profile 2007).
1.4 Aid, Debt, Trade
Equitable economic growth means employment and opportunity for all. It holds the
key to long-term development. However, in the prosperous world with an “up beat” growth,
poor countries face tremendous barriers to unleashing their economic potential for
development.
Burdensome debt payments, trade barriers, lack of money and balance of payments
problems are among the key obstacles to achieving sustainable development. Global poverty
will always be unresolved agenda without addressing the issues of aid, debt, and trade
according to NetAid, an initiative of Mercy Corps.
1.4.1 Aid
Bilateral aid is given by a single country and multilateral aid is funded jointly by the
developed nations and is co-coordinated by many different agencies. The UN co-operates
with the independent charities in relief operations and fieldwork. Charities vary considerably
in their approaches, some concentrate in providing money to relieve suffering during
emergencies; others prefer to invest in long- term projects. Aid can be distributed either by
government bodies, or by businesses and voluntary agencies. Mostly aid is given on certain
conditions. A common condition is that the money must be spent on products or services
from the donor country. Aid or Overseas Development Assistance (ODA) is a controversial
area because aid/ grants are largely considered politically motivated.
In the article “Trade not Aid”, Anthea Spitaliotis, mentions the Brandt Report (1980)
by the former German Chancellor, Willy Brandt, which argues for an increase in aid to the
third world, “it is a moral responsibility to solve the problems of the poor countries and
remove the injustices that have prevented their development in the past. Secondly, since the
two are dependent on each other economically, the future prosperity of the developed

23
countries relies on development in the third world… It could be made to work from a
practical point of view, the crucial question though is whether the political willingness exists
to achieve these goals”, the writer argues.
“Bilateral donors, in particular, provide aid for many reasons that includes political,
strategic, commercial and humanitarian. In 1988, 41 percent of external assistance went to
middle and high income countries, largely for political reasons.” (World Development
Report, 1990).
Similar apprehensions have been expressed by James Shikwati, Director of the Inter-
Region Economic Network, Nairobi… Handouts from the rich nations too often fill the
pockets of dictators rather than the bellies of the starving. He further says that…aid gives
untrustworthy leaders the resources with which to engage in violent and repressive acts.
Mengistu (Ethiopia), Pol Pot (Cambodia) and Idi Amin (Uganda) are among the more
infamous recipients of foreign aid. By 1982 Zaire (now Democratic Republic of Congo) had
accumulated a foreign debt of $5 billion. Its president, Mobutu Sese Seko, had accumulated
a personal fortune of $4 billion.
Mr. Shikwati maintains that…aid also undermines the democratic accountability of
government. By offering governments a non-tax source of revenue, it enables them to ignore
the wishes of citizens and reduces their incentive to deliver public services efficiently and
effectively. It also exacerbates cronyism. Why not award valuable contracts to your brother-
in laws more expensive (and less efficient) building company if you know the people can't
complain”?
1.4.2 Debt
Debt retards the economic development. Poor countries with enormous amounts of
debt are deprived economically, therefore, can not meet even the basic needs of their people.
The money flows out of the country for “debt servicing” instead of invested within. One
international aid group remarked that global poverty "of which debt repayments are a major
cause" kills as many people as the tsunami every week, NetAid quotes.

24
Jones, (1989) observes that it is not just that development has been stopped or
retarded in the third world; the hope of development of a better future has been lost. In
psychological terms, it is a greater loss than some of the human tragedies.
“The debt problem which was thought to be temporary has persisted with increasing
force and perversity. It has gone deeper into the social fabric of third world countries and
has become malignant”, (Schatan, 1987).
Richard Jolly of UNICEF at the Conference “Growing out of Debt” 1988 quoted
former President of Tanzania Julius Nyrere, “must we starve our children to pay our debts”.
Jolly observed: “that question has been answered in practice and the answer has been
‘Yes’…Hundreds of thousands of children in the developing world have given their lives to
pay their countries’ debts, and many millions more are still paying the interest with their
malnourished minds and bodies”.
According to Harry L, Freeman of American Express, “Developing countries debt
has become an economic millstone around the necks of both the debtor countries and the
creditor countries to trade with them”.
In Pakistan, the component of consultants in the World Bank funded projects is
between 80 to 90 percent of the total project funding, (Economic Affairs Division).
1.5 Trade Not Aid
The current argument and debate is whether donor loans do lead to development, or
do they shift focus. “But "aid" can not stimulate development. Only trade can do that. Since
the 1960s, over $500 billion has been given to the governments of African countries in the
form of grants and soft loans. Yet the results have been less than spectacular,” Mr. Shikwati
declares. He further maintains that, “the rich world can help - by opening its markets to
textiles, agricultural goods, and other products from the poor world. Trade will lead to
production that will lift the standards of living in poor countries. It could also remove its
agricultural subsidies, which reduce world market prices of these goods, reducing the
amount poor-world producers can obtain for their goods.”

25
The case for trade as the engine for economic development is indisputable. The need
for trade has caused wars, driven colonial domination and helped to create the current
international trade system. The economic expansion of India, Japan, Thailand, Singapore
and China testifies that trade stimulates growth. These countries have developed an
industrial capacity to export that has been instrumental in producing the accelerated growth
of their economies, (Goodafrican).
Reason Magazine in the article Trade, not Aid (Marian Tupy and Christopher Preble)
quotes Uganda's President, Yoweri Museveni stating during his meeting in 2003 with
President Bush, "I don't want aid; I want trade. Aid cannot transform society." The message
has been stressed by the development economists for years!
The “subsidies plus aid” forces taxpayers to pay twice - once to sustain the
inefficient subsidies, and then again to pay for aid programs. William R. Cline, senior fellow
at the Institute for International Economics and the Center for Global Development,
estimated that global trade liberalization would save the developed nations $141 billion a
year and deliver economic benefits worth $87 billion a year to developing countries.
(Reason Magazine)
While lamenting the damage aid has done to Africans: “the poison was aid and its
consequential economic distortion and dependency”, Simon Jenkins of The Times, London,
states that the one help Africa most needs is trade. It needs Western markets open to its
primary produce.
Mary Robinson, former President of Ireland and former United Nations High
Commissioner for Human Rights emphasises the importance of trade for development and
economic growth and says that if poor countries could increase their share of world exports
by just one percent, they could lift 128 million people out of poverty. She observes that,
“We need to bring home the fact that trade is not only a key engine of development; it is also
a crucial factor in economic justice. Trade policies can directly affect people's access to
fundamental rights – to an adequate standard of living, health, food, and education.”
26
In the Doha Round, known as Doha Development Agenda, (DDA) developed
countries were urged to lower agricultural and textile subsidies. But it was politically
difficult, since many domestic farmers and workers depend on these subsidies to make a
living. To sum up, developing countries do not need aid. They need fair access to global
markets where their products are competitive, and sustain economically.
1.6 Rationale of the Study
Previous researches on the challenges and opportunities generally highlight the role
of the government in enhancing the performance of the sector, thus suggest the policy tools
and incentives for making the sector competitive. Many reports have suggested economic
parameters to up lift the sector to face the challenges of the international trade at the cost of
the other sectors.
Hardly any report has touched the dynamics working with in the sector for the last 60
years retarding the growth and expansion of the sector. There was enough room for a
research that narrates this “untold story”, with objective analysis and deep examination
keeping in view the domestic and global dimensions of the issue. Moreover, also suggests
cost effective and practical measures to over come the road blocks for competitive
positioning of the sector in international markets.
1.7 Limitations
Finding relevant and reliable material and data was very difficult. The official data
on the same subject from different sources hardly coincide. Very few reports and books are
available on cotton-textile and apparel sector’s performance after post quota. Available
material mostly is focused on the policy side of the subject, and limited information is
available on the actual performance and “behavior” of the sector and the players that
dominate the sector. More over, material on international trade mostly gives the theories and
models thus limiting the scope of its use in a research thesis for a variety of audience. Lastly,
the researchers always run against the wind in terms of time and research facilities available.

27
References
A. Gledhill, Pakistan (Stevens, London, 1957), Altaf Zafar, Dr, (1983): Pakistani
Entrepreneurs; Their Development, Characteristics and Attitudes, Croom Helm Ltd,
Provident House, Burrell Row, Beckenham, Kent BR3 1AT, Australia
Altaf Zafar, Dr, (1983) : Pakistani Entrepreneurs; Their Development,
Characteristics and Attitudes, Croom Helm Ltd, Provident House, Burrell Row, Beckenham,
Kent BR3 1AT, Australia
Board of Investment, Ministry of Investment (BOI), Government of Pakistan:
http://www.pakboi.gov.pk
CIA: The World Fact Book - Pakistan: https://www.cia.gov/library/ publications/the-
world-factbook/rankorder/2003rank.html
Concluding remarks at the Pakistan Development Forum, 2006 by John Wall, World
Bank Country Director for Pakistan: http://www.worldbank.org/html
Daily Dawn Annual Budget, 2007; June 9, 2007: http://www.dawn.com
Doing Business in 2006: South Asian Countries Pick up Reform Pace says World
Bank Group; Pakistan Among Top 10 Reformers (September12, 2005), http://worldbank.org
Economy of Pakistan: Wikipedia:http://.enwikipedia.org/wiki/ economy_of_pakistan
Good Africa: http://www.goodafrica.net/index.asp. Retrieved on 2007-03-23
Government of Pakistan, Islamabad: http://www.pakistan.gov.pk
Government of Pakistan: Ministry of Commerce: http://www.commerce.gov.pk

28
Hertz, Noreena, (2004): The Debt Threat. Harper Collins Publishers, 2004 NY.
Ishrat Husnain - Economy of Pakistan. Article by the Governor of State Bank of
Pakistan; http://www.bis.org/review/r050217g.pdf
James Shikwati, (2002): http://www.smh.com.au
Jones, S. Griffith, (1988): “Debt Crisis Management in the Early 1980s: Can Lesson
be Learnt”? Development Policy review, Vol.6. 1988
Jones, S. Griffith, (1989): Growing out of Debt: A Conference organized by the
British All parliamentary Group on Overseas Development
Mary Robinson, former President of Ireland: Africa needs friar Trade, not Charity:
Yale Global Online: http://yaleglobal.yale.edu
Net Aid: http://www.mercycorps.org: retrieved on 22- 02-2007
Nicholas Louise, (2007): Comparative Prospects for Growth of Real GDP:2000-
2015:
World Economic Prospects 2007 http://www.euromonitor.com/: Retrieved in 2007
Pakistan – The Economy; Retrieved on 2008-04-12. http://www.mongabay.
com/reference/country_studies/pakistan/ECONOMY.html
Pakistan Economic Survey, (2006-07), Finance Division, Government of Pakistan,
Islamabad
Pakistan Economy Profile 2007: Retrieved on: 2007-12-20: http://www.
indexmundi.com/pakistan/economy_profile.html

29
Pakistan ends 15-year ties with IMF; Daily Times, 7 September 2004, Pakistani
Newspaper Article, 2004. http://www.daliytimes.com.pk
Reason Magazine: Trade, not Aid; http://www.reason.com Retrieved on 2008- 02-25
Richard Jolly, (1988); UNICEF: Growing out of Debt: A Conference organized by
the British All parliamentary Group on Overseas Development.
Schatan, J (1987), World Debt- Who is to pay? English edition, Zed books, London
Simon Jenkins: Do not patronize Africa: give Trade, not Aid:
http://www.thirdworldtraveler.com: Retrieved on 2007-01-28
Telegraph Daily; (newspaper): http://www.telegraph.co.uk: Retrieved on 2007-04-23
Trade not Aid: Time Magazine: http://www.time.com
Trade, not aid, is what Africa needs: the Financial Express; (newspaper): Retrieved
on 2007-12-28: http://www.financialexpress.com
USA History; Trade not aid, (Anthea Spitaliotis): http://www.usahistory.com
World Economy: Wikipedia, the free encyclopedia; http://wikipedia.org: Retrieved
on 2008-03-22
World Development Report, (1990): World Trade Organization, Switzerland, United
Nations Conference on Trade and Development, Publication. New York and Geneva,
World Trade Report, (2007): World Trade Organization, Switzerland, United
Nations Conference on Trade and Development, Publication. New York and Geneva,
WTO 2007: Trade Profiles, (2007): World Trade Organization, Switzerland

30
CHAPTER 2
LITERATURE REVIEW 2.1 Origin of Trade
“The study of international trade and finance is the oldest among the specialties of
economics, conceived in the sixteenth century, a child of Europe’s passion for Spanish gold,
and grew to maturity in the turbulent years that witnessed the emergence of modern nation
states”, (Kenen, 1994).
2.2 Evolution of Trade and Trade Theories
Trade started with the beginning of communication in prehistoric times. Trading was
common between prehistoric people, who bartered goods and services before the innovation
of the modern day currency. Watson, (2005) argues that the history of long-distance trade
and commerce started from circa 150,000 years ago.
It is believed that trade has taken place throughout the human history, and the
exchange of obsidian and flint during the Stone Age was common. Since 3000 BC materials
used for making jewelry were traded with Egypt. There are evidence of long-distance trade
routes in the 3rd millennium BC, which supports that Sumerians in Mesopotamia traded
with the Harappan of the Indus Valley. The Phoenicians were sea traders, and traveled
across the Mediterranean Sea, and as far north as Britain, and established trade colonies the
Greeks called emporia. In the 5th century, trade brought spice to Europe from the Far East,
including China. Trade strengthened the Roman Empire, and Romans established a stable
and secure transportation system that enabled the shipment of trade goods without fear of
piracy.

31
The fall of the Roman Empire brought instability to Western Europe and the trade
network almost collapsed. Some trade did occur. Radhanites and Jewish merchants traded
with the Christians in Europe and the Muslims of the Near East.
The caravan merchants of Central Asia dominated the East-West trade route known
as the Silk Road from the 4th century AD up to the 8th century AD. From the 8th to the
11th century, the trade was dominated by Vikings and Varangians as they sailed from and
to Scandinavia and Russia. Between the 13th and 17th centuries, the Hanseatic League an
alliance of trading cities maintained a trade monopoly over most of Northern Europe and the
Baltic.
In 1498, Vasco da Gama restarted the European spice trade. The spice trade with
Europe was controlled by Islamic powers especially Egypt, prior to his sailing around
Africa. Holland was the centre of free trade and free movement of goods in the 16th century.
Trade in the East Indies was dominated by Portugal in the 16th century. The 17th and 18th
century’s trade was dominated by the Netherlands and the British respectively. The Spanish
Empire established regular and organized trade links across the Atlantic and the Pacific
Oceans.
Around the 16th century trade became part of national policy. During this period,
European countries gained wealth and precious metals from their colonies and trading
partners. This system of international trade, called “mercantilism”, remained active from the
16th to the 18th centuries. Mercantilism was a sixteenth-century economic philosophy that
upheld that a country's wealth was measured by its assets of gold and silver, (Mahoney,
Trigg, Griffin, & Pustay, 1998).
The philosophy of mercantilist was that one country's gain through international
trade was another country's loss. Hence, mercantilist’s belief was that international
commerce and trade always had a loser. During this period the European empires tried to
increase and maintain the power by gathering gold and silver and simultaneously imposed a
number of trade restrictions and introduced protectionist policies to ensure that they export

32
more than they import to maintain a positive and favorable balance of trade. Mercantilism
was popular with manufactures and their workers. Export-oriented manufacturers favored
mercantilist trade policies, and grant of subsidies and tax rebates, because it stimulated their
sales to foreigners. In the same vein the domestic manufacturers threatened by imports
support mercantilist trade policies, such as imposing tariffs or quotas, because it protected
them from foreign competition, (Mahoney, Trigg, Griffin, & Pustay, 1998).
In the 17th and 18th centuries, the development of nation-states facilitated
international trade to evolve towards its present state. It was realized by the leaders that by
promoting and facilitating trade, they could not only increase their wealth and power, but
also strengthen the power and stability of their respective nations. During this period,
economists began formulating theories of international trade and conceiving of liberalized
trade policies.
Adam Smith (1723-1790) is considered as the founder of theoretical study of
international trade. Smith developed the theory of "absolute advantage” based on doctrines
of the French economist François Quesnay (1694-1774). He argued that with in their limited
natural resources, countries should produce only those products which can be manufactured
more cheaply and efficiently than their trading partners. In other words, the theory of
absolute advantage, suggests that a country should export only those goods and services for
which it is more productive and efficient than other countries, and import those goods and
services for which other countries are better than it is, (Mahoney, Trigg, Griffin, & Pustay,
1998).
Smith attacked the philosophy of mercantilism, and expressed that mercantilism
actually weakens a country. In An Inquiry into the Nature and Causes of the Wealth of
Nations, (1776), Smith argued that a country’s true wealth is measured by the wealth of its
citizens, not just that of its monarch, (Mahoney, Trigg, Griffin, & Pustay, 1998). Smith was
of the view point that a greater division of labor could bring more productivity to
international trade, and therefore, the workers should be allowed to specialize in production
of specific goods.

33
According to Gans, King, & Mankiw (1999), the term absolute advantage is used by
the economists to compare the productivity of one person, firm or nation with that of
another. It means that a producer who requires a smaller quantity of inputs to produce a
good has an absolute advantage in producing that good.
In 1815 English economists Robert Torrens (1780-1864) and David Ricardo (1772-
1823) suggested that countries import and export goods according to the principle of
"comparative advantage." According to this theory no trade would take place if one country
has an absolute advantage over both products. The difference between absolute and
comparative advantage theories is delicate. It suggests that “absolute advantage looks at
absolute productivity differences, comparative advantage looks at relative productivity
differences”, (Mahoney, Trigg, Griffin, & Pustay, 1998).
In 1817, David Ricardo, James Mill and Robert Torrens in the theroy of comparative
advantage demonstrated that free trade would benefit both weak as well as the strong
countries industrially. In Principles of Political Economy and Taxation, Ricardo pointed
out…When an inefficient producer sends the merchandise it produces best to a country able
to produce it more efficiently, both countries benefit. In other words, a country can still
produce and export a product even though it cannot produce the product as cheaply as some
other country, on the premise that this more expensively produced product can fetch more
revenues in a foreign market than in the domestic market.
In the mid 19th century the rise of free trade was essentially based on national
advantage. The rise of “national” economist was a key step in the development of
contemporary international trade. These economists proposed theories aimed at the interests
and benefits of their respective nations. These theories received further acceptance on the
ideas of American politician Alexander Hamilton (1755-1804) and others in the late 18th
and early 19th centuries. Hamilton in a way facilitated the concept of political economy to
develop, which implies active government involvement in economics including international
trade. Hamilton argued that to avoid reliance on importing essential goods, resources and

34
equipments, Congress should enact such policies that would make the United States self-
sufficient.
John Stuart Mill (1806-1873) suggested that in international market a country with
monopoly pricing power could influence the terms of trade through maintaining tariffs, and
getting reciprocity in trade policy. This theory was given by David Ricardo and others
earlier. It was believed that trade surplus would grow following reciprocal, rather than free
trade policies. This was against the philosophy of free trade. Within a few years the infant
industry scenario was presented by Mill. The theory promoted that government had the
"duty" to protect young industry, and to facilitate it to develop to full capacity. The policy
was attractive to many countries on the way to industrialization. Milton Freidman also
supported this thought, and demonstrated that under certain circumstances tariffs might be
beneficial to the host country but not for the world at large.
Keynesianism and Keynesian theory is based on the ideas of 20th century British
economist, John Maynard Keynes. According to this theory actions of individuals and firms
at micro level can affect aggregate macroeconomic out comes, and the economy operates
below its potential in output and growth. Many classical economists had supported Say’s
Law, that supply creates its own demand; however, Keynes maintained that aggregate
demand for goods might not be sufficient in recession, thus could lead to high
unemployment and loss of out put. He argued that government policies should aim at
increasing aggregate demand to enhance economic activity and reduce inflation and
unemployment. The neoclassical macroeconomists of 1960s-1970s had criticized Keynesian
theories.
In the 20th century, the Heckscher-Ohlin theory (H-O model) of international trade
was the most influential version of the comparative advantage theory. Heckscher and Bertil
Ohlin proposed that countries would export goods that they could produce efficiently given
their land, labor, natural resources, and production technology, and import goods they could
not produce efficiently had the same factors. Heckscher and Ohlin believed that countries
could achieve comparative advantage through a combination of factors such as financial

35
resources, natural resources, and production technology. This was in contrast to Ricardo's
version of comparative advantage based on labor productivity. Factor Endowment theory
analyzed the effects that international trade has on the earnings of factors of production in
the two trading nations (Salvatore, 1999). According to Ball McCulloch (1999), the
Heckscher-Ohlin theory suggested that international and interregional differences in
production costs could occur because of the differences in the supply of production factors.
Country similarity theory was formulated by a Swedish economist named Steffan Linder,
(Mahoney, Trig, Griffin, Pustay, 1998). The concept of intra industry trade is important in
country similarity theory. Intra industry trade refers to trade between two countries of goods
produced by the same industry, and it accounts for around 40 per cent of world trade,
(Mahoney, Trig, Griffin, Pustay, 1998). Linder argued that international trade of
manufactured goods between countries having the same stage of economic development and
sharing the similar consumer preferences and choices. The country similarity theory
presents that most trade in manufactured goods should take place between nations with
similar per capita incomes, and that intra industry trade in manufactured goods should be
common, (Mahoney, Trig, Griffin, Pustay, 1998). Staffan Linder's theory holds that if a
company launches a product in response to domestic market demands; it will seek out bound
markets with similar consumer demands and similar per capita income to trade. In other
words, countries import goods from other countries with similar consumer tastes and levels
of income.
The international product life cycle theory provides an instrument for analysis the
effects of product evolution on the global scale. The theory generally applies to established
companies in industrialized countries expanding their product range.
Some economists believe that the principle of comparative advantage has failed to
appreciate a variety of economic and trade phenomena, and also “encourages” lack of
competitiveness. Contemporary explanations of why countries engage in export and import
is based on concepts of competitive advantage, overlapping demand, economies of scale,
and economies of scope. According to the competitive advantage theory of Michael E.
Porter, a country can marvel in trading provided it has the right demand conditions,
competitive environment, production factors, supporting industries, adequate structures, and

36
strategies. In the absence of these conditions for a particular industry or a product, import of
these goods becomes inevitable.
The "new trade theory" assumes that the global economy can support only a limited
number of companies producing similar goods. Hence, the companies to produce certain
goods first will capture a significant share of the market, hold patent rights, lead in
development, therefore, certainly achieve economies of scale and scope. Economies of scale
give countries trade advantages, because companies can charge less for products after
increasing the size of their production facilities, because this increase will enable them to
produce more goods. Economies of scope apply to integration of supplier, manufacture, and
retail activities into a single company. This integration will allow the company to produce
and sell goods at a less cost than individual manufacturers and retailers. Once a company
achieves these advantages, other companies will find it hard to compete against it.
However, Porter argues that companies should be “participating in national markets
with the strongest rivals and most demanding customers, in order to build international
competitiveness”, (Yip, 1995). In the words of Porter (1980)… the pattern of rivalry at home
also has a profound role to play in the process of innovation and the ultimate prospects for
international success.
Finally, the growth of multinational corporations, especially in the 1980s and 1990s,
contributed to the importance and necessity of international trade. With production and
marketing operations in many countries, these corporations account for a significant amount
of the world's sales, assets, and human resources in both home and in host countries. Many
contemporary economists view multinational corporations as the facilitators of efficient
international trade. Multinational corporations also have access to the raw materials and
natural resources of a number of countries, and traditional comparative advantage theories
do not hold ground here. According to Mahoney, the Global Strategic Rivalry theory was
developed in the 1980s as a means to ‘examine the impact on trade flows arising from global
strategic rivalry between Multinational Corporations.’ (Mahoney, et al 1998)

37
2.3 Trade and Development
There is no major disagreement on the role of trade in development. Rather the
fundamental proposition is always supported that international trade and investment are
engines of growth for developing countries through many mechanisms: foreign exchange
earnings, learning, technology transfer, innovation, and productivity improvement.
International trade rules could have a positive effect for market development, for
transparency and for good governance. The perspective on the role of trade in development
reinforced after the Asian crisis of 1999, when the commitment of countries throughout the
world to open trade and investment policies did not reverse.
However, there is also a widespread consensus that an outwardly-oriented trade
policy regime is not sufficient, nor could it be a substitute for sound development policy
which entails a stable macro-economy; investment in education, infrastructure, and
institutions; social policies and environmental protection, with a sufficiently strong national
political consensus on these strategic orientations. This consensus on trade and development
rests on thorough recognizing the positive relationship between openness in trade, finance
and development, yet does not recognize it automatic or exclusive because the development
policy is something much more complex and varied. Indeed, development is a multifaceted
transformation of societies.
It would be wrong to blame trade liberalization or "globalization" for the failure to
achieve development goals (living standards, equity, education, nutrition, and housing) that
could not reasonably be expected from trade alone in the first place, or only with an
excessive optimism about its power for development. There is a need for more access to the
developed countries’ markets, and for more flexibility and for more technical assistance for
the developing countries, (José Manuel Salazar-Xirinachs, 1999).
2.3.1 Why Trade
In order to overcome local scarcity of goods people have traded with each other for
centuries. However, scarcity is not the only reason to engage in international trade. Trade is
also seen as a route through which ideology can be disseminated, for example the USA has

38
used trade as a foreign policy tool and encouraged trade to foster economic links, encourage
international security and promote their “way of life”. Trade is also used to generate
economic and political leverage. There are psychological, cultural and social reasons for
trade. For example, in some societies, trade may be a way of maintaining or reinforcing
social bonds.
Many economists, businesses, and politicians continue to rely on the principle of
comparative advantage and it still influences import theories and policies. Consequently,
countries continue to import products because they can obtain them less expensively abroad.
Moreover, while trade policies, regulations, and theories have undergone numerous changes
over the centuries, a basic motivation for countries to import goods from other countries
remains the same. When certain countries lack goods and resources, they either must import
them or make do without them.
In addition, given the technology, labor costs, government incentives, and subsidies
of different countries, one country may be able to produce goods more efficiently than other
countries. Hence, other countries will seek to import these goods because of price and
perhaps quality advantages. For example, other countries import aircraft from the United
States, while the United States imports clothing from other countries such as India and the
Philippines. Recently trade is viewed as a route to development. Many economists and
politicians have promoted trade as a mean to increase economic growth and wealth.
2.3.2 The Benefits of Trade
More over, there are a number of other benefits the citizens and firms of a country
may enjoy as a result of being able to trade freely with the citizens and firms of another
country such as:
• The benefits of specialization
• The benefits of competition
• The benefit of choice
These tangible benefits are economics of diminishing returns, (Altaf, 2007)

39
Financial benefits aside, there are important spin off in other aspects of the personal and
social life. These intangible benefits are:
• Quality of living
• Fair and just trade
• Equity and trust
There are increasing returns based on these intangibles, (Altaf, 2007)
Exporting
It is the act of producing goods or services in one country and then selling or trading
them abroad. Exporting is usually conducted by the company that manufactures the product
or provides the service, through either direct or indirect channels. Exporting is just one of
several methods that companies use to participate in economies outside of their home
country.
Exporting has played an important role in global trade throughout history. For
example, the United States has always been heavily dependent upon exports. Even before its
Declaration of Independence, the United States relied on exports of cotton, tobacco, and
other agricultural products. The U.S. merchants were penalized by duties and restrictions in
Europe. However, those impediments prompted new trade ties with overseas buyers in
Africa, India, and East Asia, laying the groundwork for a legacy of U.S. trading overseas.
The major goal of any export venture is usually to maximize profits by exploiting
opportunities in foreign markets that usually don't exist in the domestic market. Products
that become obsolete in the local markets can be marketed very successfully abroad. Like
wise, many producers are able to continue to achieve steady sales and profit gains through
cross-border sales though the domestic markets are saturated and mature. By increasing a
product's life span, a manufacturer is able to reduce new product development costs and
capitalize on learned efficiencies related to production, distribution, and marketing.
More over, as manufacturing volume grows, benefits related to economies of scale
may improve the exporter's competitiveness in both foreign and domestic markets. In

40
addition to the profit opportunities available in untapped markets, another major benefit of
exporting is market risk diversification. Through exports, a company can generally lessen its
vulnerability to cyclical economic downswings or regional disturbances by extending its
geographic reach. Geographic diversification also lessens risks affiliated with the seasonality
inherent in some products and increased competition in individual regions.
Importing
Importing is the purchasing side of trade and takes place when one region acquires
goods or services from another region. Seller of the goods or services is the exporter,
whereas the buyer of the goods or services is the importer. Importing is linked with
international trade and generally is distinguished from trade within a specific nation because
importing involves government regulation, whereas interstate importing does not. Countries
lacking in certain resources, or capacity to produce and manufacture, import them from
other sources. In addition, various economic factors facilitate producing goods or offering
services in one region or country, but not in another.
Raw materials such as aluminum, steel, glass and wood, as well as finished products
such as automobiles, appliances, furniture, and clothing are generally on the import lists of
many countries. Countries also import partially finished products, which they in turn finish
and sell domestically or export to other countries.
Country's imports in relation to its gross national product indicate the significance of
imported goods to its economy. Imports generally increase in tandem with exports as
countries become accustomed to international trade and trading with specific partners.
Importing allows countries to achieve higher standards of living by obtaining products and
resources that cannot be obtained domestically.

41
2.4 Globalization: A World Without Borders
Globalization has been defined as the process “by which markets and production in
different countries are becoming increasingly interdependent due to dynamics of trade of
goods and services and the flows of capital and technology,” (OECD,1993).
Globalization is often referred to as a major challenge of worldwide economic
integration based on:
• The international trade liberalization along with capital mobility
• Faster technological process and initiation of the information society
• Deregulation and withdrawal of the state interventions in certain areas of economic
activity
From business perspective, it is a process of worldwide economic integration,
however, from a broader perspective; it portrays the process of cultural diffusion throughout
the world. Where as a result of intermingling of people and various forces like trade,
commerce, travel, customs, spread of language; communication levels have increased
velocity (speed & direction).
In some cases, the term is often used without clear definition. For example, Ramesh
Diwan, Professor of economics at Renssalaer Polytechnic Institute, says, "Globalization has
become a buzz word." He continues, "Like other similar buzz words, such as sustainable
development, it is rarely defined but used to promote arguments favoring business interests."
The globalization factor involves government and international organizations such as
World Trade Organization (WTO) having world wide membership. At one hand, national
governments are changing their outlooks, and on the other hand, the supranational
organizations are coming up with new rules and law, and international bodies for
enforcement of these laws. These agreements and organizations are facilitating economic
integration on a regional and worldwide basis.
There are competing definitions of globalization, some favorable and others not so
approving. Somesh (2004), calls the rising ratio of world trade output as an indicator of

42
globalization. However, along with the rising ratio of trade output, increased foreign
investment, international joint ventures and mergers, inter firm agreements, diminishing
trade barriers, emergence of open international trading system, unilateral and regional trade
liberalization efforts, liberal trade policy instruments, information and communication
technology revolution are major contributors towards globalization. Globalization has
various effects; both positive and negative. It promotes cultural homogeneity. Common
demands, common consumer preferences, and large pools of common information can blend
the cultures and remove differences. It has also changed the role of government and
enhanced competition. The assumption is that increased competition will lift the poor
nations to a higher level of performance. The assumptions occasionally do not hold.
According to Claude Smadja, Managing Director of the World Economic Forum
(WEF), “it is forcing governments to redefine their role at the national level.” Governments
should formulate and implement policies that facilitate economic activity, prevent social and
political instability, and provide citizens with education and skills crucial to function in a
global economy. Smadja further asserts that governments must try to provide a
counterbalance to the negative forces of globalization like insecurity created by speed,
flexibility, and permanent change.
Increased industrialization resulting from economic globalization could lead to
environmental pollution. As world is getting more connected economic problems in one
region can be felt throughout the world, (such as Asian Financial Crisis of 1999). The most
alarming effect is that globalization increases the gap between the rich and the poor.
Globalization has imposed many opportunities and constraints. The challenge of
globalization is not to stop the expansion of global markets but to find prudent and judicious
rules and institutions for stronger and reasoned governance; local, national, regional and
global to preserve the advantages of global markets and competitions. The need is to provide
enough space for human, community and environment resources to ensure that globalization
works for people, (UNDP, 1999).

43
Business firms want to globalize in order to expand their markets, increase sales, and
profits. There is unlimited ability to expand especially if the firms are operating at high
technological and productivity levels. Free trade agreements facilitate these activities and
promote economic globalization. Such agreements vary in scope. Some are bilateral such as
the U.S. - Canada Free Trade Agreement, and others are multilateral and regional such as
North American Free Trade Agreement (NAFTA), the 18-member Asia Pacific Economic
Cooperation Group (APEC), and the European Union (EU).
2.4.1 WTO and the Agreement on Textiles and Clothing
Since 1 January 1995, international textiles and clothing trade has gone through a
fundamental change under the 10-year transitional program called Agreement on Textiles
and Clothing (ATC). WTO Members have committed themselves for the ultimate removal
of quotas to integrate the sector fully into GATT rules. Before this agreement a major
portion of textiles and clothing exports from the developing countries to the industrial
countries was through quotas under a special regime outside GATT rules.
Multi Fiber Arrangement (MFA) 1974 -1994
Up to the end of the Uruguay Round, textile and clothing quotas were negotiated
bilaterally and governed by the rules of the Multi Fiber Arrangement (MFA). Under the
MFA, selective quantitative restrictions were applicable. The Multi Fiber Arrangement was
a major departure from the basic GATT rules and the principle of non-discrimination.
WTO Agreements on Textiles and Clothing (ATC) 1995-2004
The ATC was a transitional instrument, and was built on the following key principles:
• product coverage: yarns, fabrics, made-up textile products and clothing
• progressive integration of textile and clothing products into GATT 1994 rules
• a liberalization process to progressively enhance existing quotas till their removal
by increasing annual growth rates at each stage

44
• a special safeguard mechanism to deal with new cases of “serious damage or
threat” to domestic producers during the transition period
• establishment of a Textiles Monitoring Body (TMB) to supervise the
implementation of the agreement
• some other provisions including rules on circumvention of the quotas, their
administration, treatment of non-MFA restrictions, and commitments undertaken
under the WTO's agreements and procedures
2.5 Regional Trading Arrangement (RTAs)
The rapid growth in the number of regional trade arrangements (RTAs) has led to
concern about the weakening of the multilateral trading system. Modern RTAs have a much
wider network of participants and involve a number of countries at different levels of
economic development. 0ver 190 RTAs are in force and another 60 are operational though
not notified. The total number of RTAs in force might approach 300 by 2005,
(Understanding the WTO, 2003).
Though seems contradictory and violating the WTO principle of equal treatment for
all trading partners (MFN), the RTAs can support the WTO’s multilateral trading system
while allowing the groups of countries to negotiate those rules and commitments which were
not possible multilaterally. Services, intellectual property, environment standards,
investment and competition policies are such issues, which were raised in regional
negotiations and eventually developed into agreements/ topic in the mainstream discussions
of WTO.
GATT’s article 24 allows setting up of the RTAs and says… if a free trade area or
customs union is created, duties and other trade barrier should be reduced or removed on all
sectors of trade in the group. Non members should not find trade with the group any more
restrictive then before the group was set. Article 5 of general agreement on trade in services
encourages the economic integration agreements in services in 1996, the WTO General
Council made a regional Trade Agreement Committee to examine and assess regional
groups and their conformity with WTO rules, (WTO website).

45
The Free Trade Area of the Americas and the European Union's agreements with
Central and Eastern Europe and the Mediterranean each have involvement of more than 500
million people. In mid-1998, 76 per cent of all WTO members were participating in one or
more notified regional trade agreements, (Jo-Ann Crawford and Sam Laird, 2000).
Jo-Ann Crawford and Sam Laird (2000) further states that the 1990s were also a
period of rapid growth of accessions to the GATT and the WTO. There was some 80 GATT
contracting parties in 1990, and there are 130 WTO members today. In the accession
process, new GATT/WTO members committed themselves to reduce protection and to
implementation of WTO rules and at the same they notify this to the RTAs, which they are a
party. Thus a considerable decline in the use of non-tariff measures as well as considerable
rationalization of tariff structures, tariff reductions to moderate average levels and a major
expansion in binding coverage has emerged. This trend can reduce the scope for trade
diversion, and as Baldwin (1997) points out "almost all empirical studies of European and
North American arrangements find positive impacts on member's living standards".
Baldwin (1997), Ethier (1998) and Lawrence, (1999) consider regionalism as a
complement to multilateralism “(building blocks rather than stumbling blocks)”. Baldwin
argues that “NAFTA triggered off pressures for such agreements as a kind of domino
effect”. Baldwin and Lawrence both are of the opinion that such liberalization strengthens
the exporters and “pro-trade forces”. Ethier (1998) emphasizes that "the new regionalism is
in good part a direct result of the success of multilateral liberalization, as well as being the
means by which new countries trying to enter the multilateral system (and small countries
already in it) competing among themselves for direct investment".
However, Bhagwati (1992) and Krueger (1995) express strong concerns about the
negative effects of growing regionalism and they show concern that RTAs divert attention
from the multilateral trading system. Bhagwati stresses the benefits of free trade and dose
not agree with the arguments that regionalism is a supplement to GATT, and accelerate the
GATT processes.

46
The economic advantages to participant in regional trade agreements could be even
more if the liberalization were carried out on a multilateral scale. Kemp and Wan (1976)
note ...there is a big incentive to form and enlarge a customs union until the world is one big
customs union, that is, until free trade prevails.
2.6 The Trade Policy Instruments
Governments use many trade policy instruments to raise revenue or influence the
terms of trade, and to limit imports or encourage exports, (Kenen, 1994)
Tariffs affect quantities by affecting prices. When tariffs are imposed on imported
goods, they are aimed at raising revenue rather than protecting a domestic industry. A
number of countries use export tariffs for this same revenue-raising purpose, and this is a
common practice in developing countries. Tariffs on exports are relatively easy to collect.
Subsidies are sometimes used to stimulate exports. The General Agreement on
Tariffs and Trade discourages export subsidies. Countries, sometimes, subsidize exports
indirectly by…offering export credits at low interest rates, treat export earnings
preferentially when taxing business profits, and subsidize production in their export
industries instead of directly subsidizing the exports.
A quota is an absolute limitation on the volume of an imported good. Imports quotas
affect quantities directly rather than affecting them indirectly through prices. Quotas
interfere with economic efficiency, and sometimes are hard to administer fairly. Though
quotas are also discouraged by the GATT, but there are important exceptions to the
prohibition.
Countries can have regulation for products and processes on the bases of health,
safety, and environmental quality. Another form of barrier to trade is when governments
grant advantages to domestic firms when buying goods and services for themselves, and
these may be the most important barriers to trade. Tariffs, subsidies, and quotas are fairly
transparent. Other forms of intervention are less transparent.

47
2.7 Some other Important Concepts
Free Trade
The history of international free trade is a history of international trade focusing on
the development of open markets and dismantling of barriers to movement of goods,
services and capital flows. Advocate of free trade believed that trade was the reason of
economic prosperity of certain civilizations. Adam Smith attributed the boom of
Mediterranean cultures (Egypt, Greece, and Rome), and flourishing of Bengal, East India
and China to increased trade.
Proponents of Free trade policies have clashed with mercantilist, protectionist,
isolationist, communist, and other policies over the centuries. All developed countries have
used protectionism at some time prior to the 19th century, and pursued mercantilism, but
usually reduced it as they gained more wealth. Free trade is often opposed by domestic
industries because it could reduce their profits and market share by lower prices for
imported goods. Free trade is opposed by many anti-globalization groups on the argument
that so-called Free trade agreements generally do not increase the economic freedom of the
poor, rather make them poorer.
Protectionism
Protectionism is the economic and political policy of a country to protect its
economy through the imposition of tariffs, quotas, restrictions, border security, and other
measures. Supporters of protectionism believe that it prevents domestic market distortions
such as wages, and price structure, foreign dumping, unfair trade, illegal immigration, and
other foreign interference. Alexander Hamilton's economic program advocates protectionism
to protect domestic economic system from foreign competition.
Principles of Trading System
To ensure fair and free trade the WTO works on the following principles: (WTO
website).

48
• Trade without discrimination is based on Most Favored Nations (MFN), which
means; countries can not discriminate between their trading partners.
• Free trade through negotiations gradual lowering down the trade barriers to
encourage trade. However, opening up markets needs adjustments to introduce
changes, and under the WTO it is done through negotiations to give all member
countries a “fair” chance to trade.
• Predictability through binding and transparency implies that governments should
make their business environment stable, predictable and transparent. For any
sudden change in policies that causes loss to trading partners needs to be
compensated.
• Promoting fair competition, the WTO encourages open, fair and undistorted
competition.
Monopolies
The term Monopoly is used by economists to describe a market situation where there
is a single seller of a product (good or service). In other words there are no close substitutes,
(Blinder, Alan S; William J Baumol and Colton L Gale, 2001). The word has its roots in the
Greek words monos (meaning one) and polein (meaning to sell). According to Friedman
(2002)… a monopoly exists when a specific individual or enterprise has sufficient control
over a particular product or service to determine the terms on which other individuals shall
have access to it.
Government polices towards monopolies either permitting, prohibiting or regulating
them can have major effects on specific businesses and industries but also on the economy
and society as a whole. Milton Friedman said that in the case of natural monopoly…there is
only a choice among three evils: private unregulated monopoly, private monopoly regulated
by the state, and government operation. According to him… the least of these evils is private
unregulated monopoly where this is tolerable.
The term is generally used in a relative sense rather than an absolute one, because
degrees of monopoly vary; and hardly a pure monopoly situation exists. Theoretically, there

49
can be two extreme situations: in a pure monopoly situation one company has complete
control over the supply or sales of a product with no substitutes, whereas in pure
competition or perfect competition, there can be many sellers of identical or virtually
identical products. Monopolies are classified in various ways according to the degree of
monopoly power, the cause of the monopoly, the structure of the monopoly and whether it is
for selling or buying.
A monopoly frequently consists of a group of companies that control prices and
quantities. An oligopoly is a situation in which sales of a product are dominated by a small
number of relatively large sellers who collectively hold control over the supply and prices. A
cartel is a type of oligopoly in which a centralized institution coordinates the actions of
several independent suppliers of a product.
Monopolies have existed throughout the human history. The natural human desire
for wealth and power could be one reason. However, monopolies can be immensely
profitable and gives the owners with tremendous financial, political and social power. In
political discourse, the term monopoly is often used in criticism of firms with large market
shares or lack of what is seen as "fair" competition.
Competition
The word has Latin roots: "to compete" is "competere", which means "to seek
together" or "to strive together", (Dictionary website). However, Kohn (1986) and
cooperatives argue that the traditional definition of competition is too broad and vague.
In business competition is defined as "the effort of two or more parties acting
independently to secure the business of a third party by offering better and favorable terms."
Competition is motivating, and stimulates innovation, encourages efficiency, and brings
prices down. According to microeconomic theory, no system of resource allocation is more
efficient than pure competition. However, sometimes competition may lead to waste and
duplication of efforts. In other words, competition can compel firms and businesses to
develop new products, better service deliveries, and technologies. This gives consumers

50
better selection and better products. Thus consumer pays lower prices for the products as
compare to the prices if there was no competition (monopoly) or little competition
(oligopoly). Competition does not necessarily have to be between companies. Internal
competition refers to competition within companies. In the 1920s, Alfred Sloan at General
Motors introduced this idea. Sloan created areas of overlap amongst divisions of the
company so that each division would be competing with the other divisions. Procter &
Gamble initiated a deliberate system of internal brand-versus-brand rivalry, (wikipedia).
Productivity of Bt Cotton
Huang et al. (2001) measured the effect of the impact that genetically modified
cotton varieties have had on the production efficiency of smallholders in farming
communities in China. They observed that the adoption of Bt cotton varieties leads to a
significant decrease in the use of pesticides. Hence, Bt cotton appears to be an agricultural
technology that improves both production efficiency and the environment. In terms of
policies, the findings suggest that the government should investigate whether or not they
should make additional investments to spread Bt to other cotton regions and to other crops.
Pemsl et al. (2003) analyzed Bt cotton productivity considerations from India and
China. The approval of commercial planting of Bt cotton in China and India was
implemented in 1997 and 2002 respectively. Upto 2003 Bt varieties have reached over 50
percent of the total cotton area in China. The study results revealed that the benefits derived
from Bt cotton significantly higher than non Bt cotton which are based on higher
productivity of Bt cotton in China.
Thirtle et al. (2003) assessed the impact of Bt cotton in Makhathini Flats, KwaZulu-
Natal, South Africa. Study result revealed that Bt cotton adopters in 1999–2000 benefited
according to all the measures used. Higher yields and lower chemical costs outweighed
higher seed costs, giving higher gross margins. These measures showed negative benefits in
1998–99, which conflicts with continued adoption, but stochastic efficiency frontier
estimation, which takes account of the labor saved, showed that adopters averaged 88

51
percent efficiency, as compared with 66 percent for the non-adopters. In 1999–2000, when
late rains lowered yields, the gap widened to 74 percent for adopters and 48 percent for non-
adopters.
Barwale (2004) studied the prospects for Bt cotton technology in India. The findings
of the study revealed that process of introduction of Bt cotton took six years of
experimentation, during which time agronomic, environmental, and biosafety data was
generated and reported. The trials conducted prior to commercialization clearly established
the superior performance of Bt cotton, as demonstrated by increased yields and reduction in
application of pesticides. Transgenic technology is suitable for the Indian farmer despite
small farm holdings. The area under Bt cotton is projected to increase rapidly in the coming
years.
Bt cotton can play a significant role to enhance agricultural productivity in Pakistan
as the current productivity of cotton in Pakistan is 0.71 ton/ha (Government of Pakistan,
2009) as compared productivity of Bt cotton in China is 9 ton/ha (Altaf, 2009) which
implies a huge cotton productivity gap. This gap can be narrowed down by the rapid
adoption of Bt cotton in Pakistan which will have major impact on food security efforts in
the country.
Entrepreneurship for Cotton Sector
Gilani (2008) during his address to launching ceremony of The Indus Entrepreneurs
(TiE) Islamabad Chapter emphasized on promotion of entrepreneurship in Pakistan.
According to him, the TiE needs to give equal attention to traditional sector such as textiles,
and the emerging ones, such as Information Technology (IT), Bio-Informatics or Organic
Farming. Pakistan have young people with exceptional talent, who are creating softwares
that are being used by the World's IT giants. These young people are fully capable of
creating marvels in other fields as well. He was glad that the TiE is endeavoring to develop
an Entrepreneurial Echo System in the country—a system that put all ingredients of
entrepreneurship in place. This system has been paying the nations across the world.

52
Although the country is late starter, but still it can catch up which requires implementation
of all these ingredients with sincerity of purpose. While giving due importance to mentoring
and networking on a sustainable basis, Pakistan needs to focus on education, training and
exposure of existing entrepreneurs.
In this connection, Gilani suggested that teams of qualified academicians from
Internationally reputed institutions like MIT, Harvard and others, should be engaged to
impart market based skills, especially to start ups. It is satisfying that the TiE intends to
involve universities and colleges in its programs; these institutions are, indeed, a proper
ground to hunt talent for entrepreneurship. However, involving the people already in
business would result in building up the relevant industry, as these enterprises are in a
position to accept and deliver business orders.
Gilani further stated that Angel Investment and Venture Capital are the most
important part of the Echo System; angel investment is not a new experience for us; this is
deeply rooted in Islamic polity; and is still in vogue among various Muslim communities.
This mode of investment provides an additional funding opportunity to new entrepreneurs.
Pakistan, therefore, must endeavor to harness this source of funding; focused efforts need to
be made on creating a pool of Angel Investors and establish Venture Capitalists within and
outside the country. He believes that TiE will accord special attention to this aspect of the
Entrepreneurial Echo System in Pakistan. Finally he proposed that mentoring, networking
and business plan competitions, if organized at the International level, will harness foreign
investment in the country.
Altaf (2008) presents an overview of the economics and political economy of the
entire cotton value chain, including growing raw cotton, ginning into lint, spinning into yarn,
weaving into fabric, producing cotton “made-ups,” such as towels and other nonapparel
goods, producing apparel, and marketing. These combined sectors contributed 11 percent to
Pakistan’s gross national product in 2004–2005, nearly 50 percent of manufacturing output,
and more than 60 percent of the country’s foreign exchange earnings. His analysis has an
optimistic theme. He addresses the successes of Pakistan’s industries in terms of its rapid

53
growth of yarn and textile production levels and highlights cases of highly competitive and
successful entrepreneurs. But, he is also critical of the industry overall for failing to have
sufficient entrepreneurial spirit, which he argues is necessary in the globalized fibers-to-
apparel economy that has emerged. He lays the roots of weakness in the protected market
environment in which Pakistan’s industry developed—not just the multilateral quotas of the
MFA but also its own protected market, including its historically captive market in
Bangladesh when that country was East Pakistan. His assessment recounts incidents of the
distortions this protected market created. He raises many challenges to the industry; chief
among these are the upgrade of the work force, the development of modern entrepreneurs,
and greater attention to product differentiation and value, which requires marketing
expertise and initiatives.

54
References
Zafar, A. (1983). Pakistani Entrepreneurs; Their Development, Characteristics and
Attitudes, Croom Helm Ltd, Provident House, Burrell Row, Beckenham, Kent BR3 1AT,
Australia Alexander Hamilton: http://en.wikipedia.org/wiki/Alexander_Hamilton
Zafar, A. (2008). Challenges in the Pakistan Cotton, Yarn, Textile, and Apparel
Sectors, Chapter-3 Discussion Paper entitled “Cotton-Textile-Apparel Sectors of Pakistan:
Situations and Challenges Faced edited by Cororaton, C.B. et al. 2008, Markets, Trade and
Institutions Division, IFPRI Discussion Paper 00800.
Zafar, A. (2009). Chairman, Pakistan Agricultural Research Council (PARC)
informed during one of his meeting with the scientists of PARC, Islamabad, Pakistan, June,
2009.
Baldwin, R.E. (1997), "The Causes of Regionalism”: The World Economy, 20, 7, 865-
888.
Barwale, R.B., Gadwal, V.R., Zehr, U and Zehr B. 2004. Prospect of Bt cotton
technology in India. AgBioForum, The Journal of Agrobiotechnology Management and
Economics 7(1&2).
Bhagwati, J. (1992), "Regionalism versus Multilateralism": The World Economy,
Retrieved on 2007-05-27
Blinder, Alan S; William J Baumol and Colton L Gale (2001). Monopoly: Microeconomics:
Principles and Policy. Thomson South-Western. pp. 212. ISBN 0-324-22115-0
Claude Smadja: WEF; http://www.abc.net.au/rn/talks/lm/stories/s146446.htm: and
http://www.weforum.org: Retrieved on 2008-05-27
Dominick Salvatore, Fordham University, New York: http://www.bepress.com

55
Dunn, John quoted in Vincent Cable, The Diminished Nation – State: A study in the
loss of economic power, 1995
Ethier, W. (1998), "The New Regionalism", the Economic Journal, 108, 1149-1161
Evolution of Trade Theories: http://referenceforbusiness.com/encyclopedia/gov-
inc/impoting.html
Francois Quesney (1694-1774) http://en.wikipedia.org/wiki/ Fran%C3% A7ois_
Quesnay
Free Trade Agreement: http://en.wikipedia.org/wiki/List of_free_trade_ agreements
Free Trade Arrangements: http://www.export.gov/fta
Free Trade: http://en.wikipedia.org/wiki/Free_trade Retrieved on 2008-04-23
Government of Pakistan (2009). Economic Survey of Pakistan, Economic Advisor’s
Wing, Finance Division, Government of Pakistan, Islamabad.
Gilani, S.Y.R., (2008). Address by the Prime Minister of Pakistan Syed Yousuf Raza
Gilani at The Launch of ‘The Indus Entrepreneurs’ (TiE) Islamabad Chapter Rawalpindi
June, 2008.
Gilpin Robert, (2001): Global Political Economy: Understanding the International
Economic Order, Princeton University Press, Princeton, New Jersey (USA)
Huang , J., Hu Ruifa, Rozelle, S. Qiao, F. and Pray C.E. 2001. Small holders,
transgenic varieties, and production efficiency: The case of cotton farmers in China.
California Agricultural Experiment Station, Giannini Foundation for Agricultural

56
Economics, Department of Agricultural and Resource Economics, University of California
Davis, USA.
Hettne, B (1995): Development Theory and the Third World: Towards an
International Political Economy of Development: Longman Development Studies, 2nd
edition
Innovation: http://www.hillaryclinton.com and http://en.wikipedia.org: Retrieved:
2008-03-27
International Trade Theories: free Essays, Cliff Notes and Term Paper Database:
http://www.essays.cc/free_essays/b5/1vt197.shtml: Mahoney, M Trigg, R Griffin, M Pustay,
(1998): Techniques for Analyzing Industries and Competitors: New York: Free Press.
George S. Yip, (1995), Total Global Strategy. Salvatore Dominic, (1999), International
Economics, McGraw-Hill. Ball, Mcculloch, (1999) International Strategic
Partnering Handbook: McGraw-Hill. Salvatore Dominic, (1995): Theory and
Problems of International Economics: McGraw-Hill. Mahoney, et al (1998)
Jo-Ann Crawford and Sam Laird: Regional Trade Agreements and the WTO Centre for
Research in Economic Development and International Trade, University of Nottingham
José Manuel Salazar-Xirinachs, Chief Trade Advisor of the Organization of
American States, March 1999, Trade and Development: Towards a New Consensus at the
ICTSD International Centre for Trade and Sustainable Development , Geneva
Kemp, M. C. and H. Wan, (1976), "An Elementary Proposition Concerning the Formation of
Customs Unions", Journal of International Economics, 6, 95-98
Kenen B. Peter, (1994): The International Economy, (3rd Edition), Press Syndicate
of the Cambridge University Press, USA

57
Kohn, Alfie (1986). No Contest – The Case Against Competition. Boston New York
London: Houghton Mifflin Co. ISBN 0-395-63125-4.
Knowledge Based Economy.www.oecd.org/document/14/0,3343.html: Retrieved on
2008-03-23
Milton Friedman (2002). “Monopoly and the Social Responsibility of Business and
Labor”. The University of Chicago Press. pp. 208. ISBN 0-226-26421-1
Monopolies: http://en.wikipedia.org/wiki/Monopoly. Retrieved on 2008-03-23
Monopolies: The Linux Information Project: (2005 – 2006). http://www.linfo.org
Retrieved on 2008-03-23
OECD Report, (1993): http://www.oecd.org: Retrieved on 2007-06024
Pemsl, D.E., Orphal, J. and Waibel, H. 2003. Bt-cotton productivity considerations
from India and China. A paper presented in a conference on International Agricultural
Research for Development, Gotingen, October 8-10, 2003.
Porter E. Michael, (1985). Competitive Advantage: Creating and Sustaining Superior
Performance, the Free Press, New York NY 10020
Robert Richard Torrens (1780-1864): http://en.wikipedia.org/wiki/ Robert_Torrens
Smith, Adam, 1937, The Wealth of Nations, N. Y. Random House, p. 643; first
published in 1776
Somesh K. Matura, (2004): Globalization and Development: Some Issues and
Empirical Facts; Lecture at the department of Economics, Jamia Millia Islamia, New Delhi
58
Suranovic M. Steven, (2004): The International Economy; International Trade
Theory and Policy, (Trade: Chapter 5): http://stevesuranovic.blogspot.com;
Thirtle, C., Beyers, L., Ismael, Y. and Piese, J. 2003. Can GM-technologies help the
poor? The impact of Bt cotton in Makhathini Flats, KwaZulu-Natal, South Africa. World
Development. Vol. 31, No.4, pp 717-731, 2003.
Trade: http://en.wikipedia.org/wiki/Trade
Trade Theories:
http://www.referenceforbusiness.com/encylopedia:
http://en.wikipedia.org/wiki/Kenynesian_economics
http://en.wikipedia.org/wiki/Classical_economics:
http://en.wikipedia.org/wiki/Trade
http://en.wikipedia.org/wiki/Adam_Smith
http://en.wikipedia.org/wiki/History_of_economic_thought
http://www.nytimes.com/2008/02/13/opinion/lweb13krugman.html
UNDP, (1999), Human Development Report, New York: Oxford University Press
Watson, Peter (2005). Ideas: A History of Thought and Invention from Fire to Freud.
Harper Collins; ISBN 0-06-621064-X
What is Development: Adam Szirmai: The Dynamics of Socio- Economic
Development: An Introduction. Cambridge University Press 0521817633
What is Productivity? Diane Galarneau and Cécile Dumas, (1993): About
Productivity Spring 1993 (Vol. 5, No. 1) Article No. 5. (IS 931 A5)
World Bank Report, (2000): The Quality of Growth: (2000): (V. Thomas, M.
Dailami): http://www.worldbank.org: Retrieved on 2006-12-23

59
What is the WTO?: World Trade Organization: http://www.wto.org
Yamada, Miwa (2008): Evolution in the Concept of Development: How Has The
World bank’s Legal Assistance Extended its Reach? Institute of Development Economics:
http://www.ide.go.jp
Yip, George (1999): (Dean, Rotterdam School of Management, Erasmus University)
http://en.wikipedia.org/wiki/George_Yip

60
CHAPTER 3
RESEARCH METHODOLOGY
3.1 Introduction
The theoretical framework is very important in a research work in two ways; firstly it
helps the researcher to put his data in one place to save it from being lost in the vast realm of
knowledge and secondly, the work may provide a better understanding to the unknown
audience who would probably like to use it as a reference for their academic studies
(Sultana, 2007). This study mainly depends upon secondary information and data; however
subject specialists and experts have also been consulted as trade analysis is a complex
terminology relatively. Different experts analyze it differently and according to need and
objectives. The reason to work on secondary information and data were:
• Cost and time saving in collection of data
• Specific needs of the research objectives were not in tandem with primary data
sources
• Some of the critical variables can not brought out in interviews and
questionnaires
• Primary data sources tend to be subjective
Publications and websites of the UNDP, UNCTAD, World Bank, WTO and other
international agencies on international trade, policies & procedures, rules & regulations, and
on textile and merchandize trade were consulted. Official hand outs, publications and
websites of the government ministries, especially the line ministries responsible for trade,
industry, agriculture, investment and textile were used to have reliable and credible data.
Website and publications of the State Bank of Pakistan, Federal Bureau of Statistics, and
Ministry of Finance were utilized.

61
3.2 Methodology and Research Design
In this study maximum dimensions have been covered using revealed comparative
advantage, relative comparative advantage, opportunities for supply chain integration and
trade complementarities techniques. Brief description of these techniques is discussed in the
following sub-section:
3.2.1 Revealed Comparative Advantage
The concepts of comparative advantage and competitiveness are two important
foundations for understanding the importance of international trade in agriculture and to
illuminate the underlying factors responsible for current trade patterns. Comparative
advantage refers to the ability of one nation to produce a commodity at a lower opportunity
cost of other products forgone than another nation, while competitive advantage indicates
whether a firm could successfully compete in the trade of the commodity in the international
market given existing policies and economic structure (Warr, 1994).
Revealed comparative advantage ratios, developed by Balassa (1965), have been
widely used to study profiles of revealed comparative advantage in various export products.
The ratio is defined as:
Where
R ih = Revealed comparative advantage ratio for country i in product h
X ih = Country i' s exports of product h
X it = Total exports of country i
Xwh = World exports of product h
X wt =Total World exports

62
It is evident from the above equation that revealed comparative advantage is simply a
ratio of the share of a given product in a country's exports to its share in world exports, and a
country is said to have a revealed comparative advantage (disadvantage) in product h if R ih
> (<) 1. It must, however, be cautioned here that the export shares that underlie the revealed
comparative advantage ratios are influenced by external and internal trade policy distortions
such as protectionist barriers in export markets and anti-export bias in domestic trade policy.
Therefore, to the extent that these distortions may be present, the pattern of "true"
comparative advantage may differ from the one suggested by the revealed comparative
advantage ratios. The revealed comparative advantage ratios can be computed at various
levels of commodity aggregation according to the Standard International Trade
Classification (SITC). The finer the disaggregation, the better the identification of the
products is, in which potential for exports exists. Accordingly, the three digit SITC
commodity classification on which we had the data is used for identification of products of
export interest to each country. Nevertheless, 1 and 2-digit SITC classifications may provide
a broad picture of the pattern of comparative advantage and have been used by researchers
as well.
3.2.2 Relative Comparative Advantage
An improved version of Balassa’s original version, namely the Relative Revealed
Comparative Trade Advantage (RTA) index, offered by Vollrath (1991) reflects both
imports and exports, and is formulated as:

63
The RTA considers both export and import activities and this seems to be an
advantage from the viewpoint of trade theory. Due to the increase in intra-industry trade,
this aspect, according to Frohberg & Hartmann (1997) is also becoming increasingly
important.
A problem with these types of indices is that observed trade patterns are likely to be
distorted by government policies and interventions, and may therefore misrepresent
underlying comparative advantages (Ferto & Hubbard, 2001). Furthermore it says nothing
about how a country acquires its market share. Market share may well be maintained by
costly government incentives.
3.2.3 Opportunities for Supply Chain Integration
The RTA method can also be used to determine the opportunities for supply chain
integration between countries and regions (Van Rooyen & Esterhuizen, 2001; ISMEA,
1999). A comparative analysis of supply chains in South Africa, Argentina and Australia is
used to assess whether the current competitiveness status within chains provides a basis for
increased trade between the countries. The analysis implies incomplete specialization in any
country, and international tradability. The analysis only considers industries that can be
regarded as competitive. RTA values form the basis for analysis.
Depending on the existence of trade barriers or free trade and the level of transaction
costs involved, added value can be created by exploiting competitive positions.
3.2.4 Trade Complementarities
The success of regional integration schemes depends largely on the extent of trade
complementarities in a regional trading bloc. For example, regional trading arrangements are
likely to succeed in strengthening intra-regional trade if the trade structures of member
countries exhibit strong complementarities. Trade complementarities, which measures the
compatibility of imports of country i with exports of country j, as defined below.

64
Where
C ij =Trade Complementarities index for trade between countries i and j
m hi =Share of good h in total imports of country i
x hj =Share of good h in total exports of country j
The trade complementarities index is zero when no good exported by one country is
imported by the other, and equals one when the shares of one country's imports correspond
exactly to those of the other's exports.
3.3 Research Objectives
The main objectives of this research study are:
• To overview Pakistan’s trade in all its aspects over time; • To analyze the performance of Pakistan’s textile and apparel sector trade over time;
and • To work out Pakistan’s trade potential in textile and apparel sector and explore
opportunities
3.4 Statement of Hypothesis
Keeping in view the theoretical frame work, the researcher developed the following
hypothesis statement;
Pakistan is facing a new structure in international trade and the country should be;
• Able to work its strengths
• Develop itself from a low income country to a middle level country through its trade
in Textiles

65
References
Altaf Zafar, Dr, (2007): Challenges in the Pakistan Cotton, Yarn, Textile and
Apparel Sectors, Chapter Five: Studies of the Cotton-Textile – Apparel Industries in
Pakistan and India: Cotton Trade Policy and Poverty Study
Anderson, James and Eric van Wincoop, (2004), “Trade Costs, Journal of Economics
Literature, 42, 691-751
Bagwell, K and R. W. Staiger 1999: “An Economic Theory of GATT,” American
Economic Review 89(1), 215-248.
Caesar Cororation and David Orden, (2007), (Chapter One), Studies of the Cotton-
Textile – Apparel Industries in Pakistan and India: Cotton Trade Policy and Poverty Study.
EW-P091261-ESW-TF055329, Cambridge, MA 02138
Collie, D. (1991): “Export Subsidies and Countervailing Tariffs,” Journal of
International Economics, 31, 309-324
Cooper, D.R & Emory, C.W. (1995): Business Research Methods (5th ed), Irwin,
USA: Mc-Graw Hills Companies
Kala Krishna and Cemile Yavas, (2002),” When Does trade hurt? Market, Transition
and Development Economics”, NBER Working Paper series; working paper 8995: National
Bureau of economic Research, Cambridge, MA 02138: http://www.nber.org: Retrieved on
2008-01-23
Lather, P. (1992): Critical Frames in Educational Research: Feminist and Post
Structural Perspectives, Theory into Practice, xxxi, 2, 87-99
Motta, M, J-F Thisse and A. Cabrales, (1997): “On the Persistence of Leadership or
Leapfrogging in International Trade”, International Economic Review, 38 (4), 809-824

66
Petrakis, E and S. Roy, (1999): “Cost –Reducing Investment, Competition and
Industry Dynamics, “International Economic Review”, 40 (2), 381-401
Porter E. Michael, (1985). Competitive Advantage: Creating and Sustaining Superior
Performance, the Free Press, New York NY 10020
Sarantakos. S. (1993): Social Research. Palgrave Macmillan Houndmills,
Basingstoke Hampshire RG216xs and 175 Fifth Avenue New York, N.Y. 10010. ISBN 1-
4039-4320
Warr PG (1994). Comparative and competitive advantage. Asia-Pacific Economic
Literature 8(2):1-14.
Esterhuizen D & Van Rooyen CJ (1999). How competitive is agribusiness in the
South African agro-food commodity chain. Agrekon 38(4):744-752.
Ferto, I. & L. J. Hubbard (2001). Regional comparative advantage and
competitiveness in Hungarian agri-food sectors. 77th EAAE Seminar/NJF, Seminar No 325.
Frohberg K & Hartmann M (1997). Comparing measures of competitiveness.
Institute of Agricultural Development in Central and Eastern Europe, Discussion Paper, No
2, Web page: http://www.landw.uni-halle.de/iamo/iamo.htm. Accessed on 03/04/03.
Sultana, N. 2007. The Role of Media in the Development and Promotion of English
in Pakistan. Unpublished Ph.D. thesis, National University of Modern language, Islamabad.

67
CHAPTER 4
INTERNATIONAL POLITICAL ECONOMY
Moral philosophy of Adam Smith who is widely acknowledged as the “father of
economics” is the source of political economy when he was Professor of Moral Philosophy
at the University of Glasgow, (Bucholz, 1989). The term Political economy originally was
for studying production, buying and selling, and their relations with law, custom, and
government. In the eighteenth century, it replaced the earlier approach of the Physiocrats.
Adam Smith, David Ricardo and Karl Marx were the principal exponents of political
economy.
4.1 International Political Economy
The theme of international political economy based on the concept that markets are
deeply entrenched in the larger sociopolitical set up. Therefore, it requires the integration of
the views of neoclassical economists and political economists to understand how markets
and market forces function to bring out economic activity and consequences. This also
coincides with the understanding of the functions of powerful actors, who attempt to
manipulate and control market forces to promote their private and vested interests. One has
to look deep in to the realities of life where there is a constant struggle and unending war
amongst human beings, groups, states, governments to grab position and power.
The purpose of the economic activity in a sociopolitical structure largely depends on
the value and belief system, historical perspective, and socially approved ways. All these
factors in fact determine and circumscribe the ways in which the markets mechanism is
permitted to function. An established “fair” and legal economic behavior in one society may
not be acceptable in another society: bribery is an offence in some countries whereas; it can
be an accepted business practice in other countries. In any case the dilution of rules and
procedures for the powerful is always on practice that is formed irrespective of the status of
a country.

68
4.2 Role of National Governments in International Political Economy
The National Government or State is an important player in the political economy.
To fulfill security, social justice, political and economic functions and welfare for its citizens
is its primary responsibility. Moreover, it gives identity to its citizens.
With in national political economy and at the larger canvass of international political
economy when the powerful actors advance their interest at the cost of others, the role of
state becomes more crucial. The commitments to free trade, foreign policy, and other
economic activities it could be argued should base on the national interest and not at the
behest of those in power.
Drazen (2000) explains that the Government polices like tax, expenditure,
concessions and exemption to promote and protect certain firms or individuals are the
political side of the state. The economic policies may have welfare effects but how the
objectives are chosen and collective choices are made, the process of deciding what policy
to adopt is different from the process of deciding on policy. In a political economy model for
example determination of tax rates or current consumption over future consumption will
reflect conflict over “preferences” in the economic system.
4.3 Political Economy of International Trade
The economic and political events played a very significant roll in the rise and fall of
international trade cooperation through the 19th century. Following two waves are the hall
mark of this period;
• The emergence of a Multilateral Trading System with low tariffs in Europe
• Decline of European Free Trade (1879-1914)
4.3.1 Trade Policy before World War I, (1860-1914)
The period after World War I was difficult for international trade relations. However,
in the second half of the 19th century widespread economic development took place.

69
Industrialization along with technological change facilitated trade expansion supported by a
network of bilateral trade treaties. Interestingly, this trend started with the Anglo-French
(Cobden-Chevalier) treaty of 1860. A series of other treaties among European countries was
trigged by this trend.
“Bilaterally agreed reciprocal tariff reductions, together with the application of the
unconditional most favored- nation (MFN) clause contained in the treaties, led to historically
low tariff levels, in particular for agricultural products. This period of largely unfettered
trade across Europe lasted for nearly two decades up to 1879, faltering gradually thereafter
and collapsing with World War I”, (World Trade Report, 2007). In light of subsequent
developments in international trade relations, it is most interesting to note that the bilateral
treaties among the leading trading nations in the late nineteenth century gave birth to a net
work of multilateral and nondiscriminatory arrangements. However, these arrangements
could not create a global trading system with low protection levels. The United States and
Latin American countries followed a high tariff regime. Trade between the colonial powers
and the territories was not only bilateral but largely driven by political factors.
Discrimination in trade and navigation policies was common. China and Japan, which had
been closed economies in the first half of the 19th century, were pressured into opening their
markets to international trade between 1840 and 1860, (World Trade Report, 2007).
Cheap industrial goods, reduced communication and transport costs along with
telegraph and railways network made Europe the hub of industrialization. The US and Japan
also joined the industrialization process. These new opportunities accelerated the integration
of markets on a global scale. However, the agricultural sector in the European continent was
kept at the back burner. Throughout the 19th century, debates on the benefits of free trade
took the center stage. At one hand, the mercantilist’s trade policies started fading away, and
on the other hand he unrestricted trade principles of the classical economists such as Adam
Smith and David Ricardo were opposed by Alexander Hamilton and Friedrich List, who
recommended intervention of government to protect emerging domestic industry. The John
Stuart Mill in “The Principles of Political Economy” also favored protection of infant
industry. Robert Torrens with optimal tariff argument suggested that under certain

70
conditions protection could improve national welfare, and the counter argument was
government failure. However, neither came up for the agricultural sector.
In the mid nineteen century, the United Kingdom played a leadership role in the
European experience. It was ahead in industrialization, export and import, technology and
textiles industry, and its currency was widely accepted in the world…London’s financial
markets were the lynchpin of the gold standard to which adherence had been growing
rapidly since 1872. Bairoch (1976) states that the trade policy in Europe was a feature of
more liberal, and market-oriented domestic economic policy regime.
Under the Cobden-Chevalier treaty, France also benefited, and after France and the
United Kingdom agreed on elimination of prohibitions, an outbreak of agreements followed
across Europe and many other countries joined contributing to the creation of a low tariff
area in Europe. During the Great Depression (1873-1896), prices of internationally traded
goods decreased steadily, and European trade treaty network started crumbling down in a
changed political and economic environment. However, up to World War I, the United
Kingdom remained firm in its free trade and low tariff policy but other European countries
with large agricultural sectors and less developed industrial sectors started to increase tariffs.
The major cause for protectionism was the agriculture crisis in the continental
Europe. With end of the US civil war (1861-65), grain production and exports recovered in
the United States, causing price decline of grain in Europe. Continental wheat farmers
immediately lost this market to United States suppliers. In the words of Woodruff (1971) “
with the great increase in the world production of grain from the 1870s until the end of the
century, the price of wheat dropped from about $1.50 a bushel in 1871 to 86 cents in 1885; a
decade later in 1894 the figure was about 70 cents.” Bairoch (1989) states that this inflow
caused a slowdown in the growth of agricultural production in continental Europe and a fall
in farmers’ income.
All this led to decline in consumer and investment goods, casting shadows on other
industrial sectors. Demands by agricultural sector for protection also encouraged others
sectors like iron, steel and textile industries to seek higher protection. Bairoch, (1989)

71
mentions that the rise of German tariffs in a customs law, introduced in 1879 was the major
shift to a more protectionist trade policy in Europe. “Continental European trade policy
turned even more protectionist during the 1890 to 1913 period.” and more than half of the 53
trade treaties of European countries expired. It gave rise to national sentiments. Nolde
(1932) mentions that the introduction of the Méline tariff in France supported additional
protection to agricultural sector, and strengthened protectionist policies all over the
continent. With the rise of tariff rates, more detailed and complex tariff schedules came into
being with maximum and minimum rates. It enhanced the uncertainty amongst traders. The
increased tariff rates and trade barriers changed the direction of trade flows. The European
powers strengthened their trade ties with their colonies, considering them valuable markets
and sources of supply.
During this period the rise of the United States was increasingly felt in international
trade relations, and leading position of the United Kingdom was eroded. The rivalry among
the major trading nations was suddenly on the anvil. “In the two decades prior to World War
I, a number of tariff wars broke out, usually provoked by the establishment of a new, more
protectionist tariff, or in the course of renegotiation of bilateral treaties. After the expiry of a
treaty, tariffs were often raised temporarily as a means of improving negotiating leverage.”
4.3.2 International Trade from 1918 to 1939
During this period, government controls took over the private transactions in
international trade relations. The policies were dictated by high tariffs, quantitative
restrictions and prohibitions on both exports and imports along with foreign exchange
controls.
Britain, France and Italy in 1916 were prepared to give trade preferences to each
other and no MFN status to Germany. Meanwhile, President Wilson of the United States in
his Fourteen Points for the post-war period announced a barriers free and fair trade regime
among all nations. In continental Europe territorial changes took place with large
displacements of people across Europe and emergence of new states, determined to use tariff
policy to protect their infant industry. Pre-war production pattern suddenly changed with the

72
division of Habsburg Austria into six independent states, causing disintegration of one single
market into six separate customs entities. Further significant events included lost of German
grain and industrial product producing province. Two important coal and steel producing
regions namely, Alsace and Lorraine went back to France. Russia lost territory in the West
and its role in external trade reduced as it became a centrally-planned economy.
The changed production, reduced exports and trade pattern posed a great challenged
but there was limited political willingness to cooperate internationally despite many efforts.
The United States emerged as the largest creditor and the strongest economy after the war.
Though the United States initiated the creation of League of Nations but was reluctant to
play an international role with all it resources. At the domestic level, role of governments in
economic affairs with more representative parliaments increased. Gradually, autarchy
prevailed in agriculture and raw material sectors. Due to more demand for raw material and
agriculture products and less imports of manufactured goods the economies out side Europe
boomed. Accepting the loss of wealth, repayment of war debts, realistic exchange rates and
lost opportunities were difficult for Europe. Williams (1947) and Horowitz (2004) point out
that hyperinflation and massive exchange rate adjustments happened frequently in the two
decades after the World War 1.
Tariff Policies
World economy in the post-war period is marked with uncertainty, political
instability, and mistrust among nations. In 1925, tariffs on manufactured good were higher
than before World War I in a majority of countries. The United States, Argentina, Australia,
Canada and India increased or kept tariffs very high by international standards.
By 1925-27, world trade started to exceed the pre-war level of 1913, and to upward
and instable tariffs revision stopped. Returning to the MFN principle was important to create
a stable trading system. MFN clause did not, however, extend to national treatment of
foreign traders or firms, implying tariff commitment in a discriminatory manner, and
restricting the applicability of bilaterally-agreed tariff reductions for third parties. The Tariff
reform in the United States Congress in 1929 focused on higher agricultural protection and

73
then to industrial products. The Congress passed the Smoot – Hawley Tariff Act, and it is
said that it shattered the limited trust remaining in the trading system and created havoc in
global trade flows.
Table 11: Applied Tariff Rates of Major Traders In 1925 (Percentage)
Manufactured goods All products 1913 1925 1913 1925
Argentina 28 29 26 26 Australia 16 27 17 25 Austria-Hungary 18 - 18 - Austria (18) 16 (18) 12 Czechoslovakia (18) 27 (18) 19 Hungary (18) 27 (18) 23 Poland (13-18) 32 (12-18 23 Belgium 9 15 6 8 Canada 26 23 18 16 Denmark 14 10 9 6 France 20 21 18 12 Germany 13 20 12 12 India 4 16 4 14 Italy 18 22 17 17 Netherlands 4 6 3 4 Spain 41 41 33 44 Sweden 20 16 16 13 Switzerland 9 14 7 11 United Kingdom - 5 - 4 United States 29
44 250
37 33 16
A: Germany and Austria for 1913 B: Average of old and new tariff (from October 1925) for 1925. C: Referring to Underwood Tariff applied in 1914. Note: Unweighted Arithmetic Average. Source: League of Nations (1927)
The monetary policies caused flee of capital flows from Europe to the United States.
Trade restrictions introduced in Europe in 1930 contributed to the financial panic and bank
failures in 1931. The United Kingdom (on 21 September, 1931) and the United States (on 20
April, 1933) discarded the gold standard. Japan also left the gold standard in September
1931, and strongly devalued the yen. Germany developed a multiple exchange-rate system
in July 1931.

74
In international trade relations discriminatory trade evolved, which introduced blunt
trade measures, prohibitions, quantitative restrictions, exchange controls and clearing
systems. “Almost a century-old tradition of free, MFN-based trade policy ended when the
United Kingdom surrendered its role as a stalwart of multilateral trade and the gold
standard”. Under their political influence, other leading nations also favored discriminatory
policies.
According to World Trade Report (2007), 1932-33 was perhaps the darkest period
for trade policy in the twentieth century as trade was at its lowest level in dollar terms since
1921.
Chart 1: World Merchandise Export, 1900-1950
(Indices, 1953=100)

75
Chart 2: World Merchandise Export Prices, 1900-1950 (Indices, 1953=100)
Chart 3: Volume Growth of World Merchandise Export, 1900-1950
(Indices, 1953=100)

76
In the United States, the failure of the Smoot-Hawley Act led to the Reciprocal Trade
Agreements Act of 1934. The important features of the act were the MFN principle, which
implies that all traders signing a treaty with the United States benefited from the tariff
reductions agreed in all other agreements, and detailed tariff setting was moved to executive
branch from Congress limiting the role of the interest groups. In that period 21 agreements
with 19 countries were concluded from 1934 to 1939, including agreements with Canada
(1936 and 1938) and the United Kingdom (1938). Contribution of the bilateral agreements
in reduction of high protection levels was quite significant. In other countries, tendencies
towards regional bloc-building were geared up due to national security concerns and to have
secure supply of raw material. However, the trend diminished due to military interventions.
World-wide economic integration before World War I might have been sustained through
better institutional arrangements. To fill the gap of such an institutional arrangements, the
establishment of the Bretton Woods institutions (IMF and World Bank), and eventually, the
multilateral trading system through GATT and WTO became inevitable.
4.4 International Financial System
International financial system consists of institutions and regulations that act on the
international level. The International Monetary Fund (IMF), World Bank ( WB), and
national agencies, government departments such as central banks, finance ministries, and
private institutions acting on the global scale, e.g., banks and hedge funds are parts of the
International Financial System.
The history of financial institutions is different from economic history and history of
money. In Europe, it started with the first commodity exchange, the Bruges Bourse in 1309.
The first global financiers the Fuggers started in 1487 in Germany. The first stock company,
Russia Company established in England 1553. The first foreign exchange market; The Royal
Exchange was set up in 1566 in England, the first stock exchange; The Amsterdam Stock
Exchange came in to being in 1602.

77
Milestones in the history of financial institutions are the Gold Standard of 1871–
1932, the founding of IMF, World Bank at Bretton Woods, and the abolishment of fixed
exchange rates in 1973.
4.4.1 International Monetary Fund (IMF)
The International Monetary Fund (IMF) oversees the global financial system. Having
its headquarters located in Washington, D.C. (USA), it follows the macroeconomic policies
of the member countries, in particular those with an impact on exchange rates and the
balance of payments. It offers financial and technical assistance to its members as well, thus
making it an international lender of last resort.
The IMF provides financial assistance to countries that experience serious financial and
economic difficulties from the funds deposited with the IMF from the institutions of the
member countries. Member states with balance of payments problems may request loans to
fill the gaps. In return, countries are usually required to launch certain reforms and structural
adjustment programs under "Washington Consensus". The Fund offers different loan
instruments;
• Concessional rates for low income countries
– Poverty Reduction & Growth Facility (PRGF)
– Exogenous Shocks Facility (ESF)
• Non concessional
– Stand-By- Arrangements (SBA)
• For natural disaster and conflicts
– Emergency Assistance (EA)
In the last two decades many countries in Africa, Latin America and Asia experienced
serious macroeconomic instability and approached IMF for funds. IMF regards BOP deficit
as domestic policy mistake. The growth and development require the creation of productive

78
capacity and prudent utilization thereby put certain “conditionalities” before contracting the
loan. The conditionality clause includes;
• Stabilization: the management of aggregate demand to reduce domestic absorption
• Structural adjustment: reforms to change the structure of production
• Liberalization and deregulation: removal of government intervention of all kind
(price control, quantity restriction, licensing and other barriers to trade
• Privatization: contracting out government functions to private agents
• Budget rationalization: bringing government expenditures and revenues into balance
• Institutional reform process: changes in government institutions to enhance the
economic reform process
The IMF describes itself as "an organization of 185 countries, working to foster
global monetary cooperation, secure financial stability, facilitate international trade, promote
high employment and sustainable economic growth, and reduce poverty". All UN member
states participate directly in the IMF with the exception of North Korea, Cuba, Andorra,
Monaco, Liechtenstein, Tuvalu, and Nauru. The IMF was created in July 1944, during the
United Nations Monetary and Financial Conference when the representatives of 45
governments met in the area of Bretton Woods, (New Hampshire, United States of America)
and agreed on a framework for international economic cooperation. Countries contributed to
a pool so the countries with payment imbalances could borrow on a temporary basis,
(Condon, 2007). The goal was to stabilize exchange rates and supervise the reconstruction of
the world's international payment system. The IMF was formally organized in 1945, and 29
countries signed its Articles of Agreement. The IMF has the same mandate today as it was in
1944.
Recent Reforms
Since World War II, the world economy and monetary system have undergone major
changes. Rapid advances in technology and communications have contributed to the
increasing international integration of markets and to closer linkages among national

79
economies, as a result, when financial crises erupt (like financial crisis of East Asia of
1999), the shock waves were felt through out the world. The closely integrated world and
more membership have enhanced the influence, importance and relevance of IMF. This has
required the IMF to adapt to new challenges and reforms in a variety of ways to continue
serving its purposes effectively. Contrary to thinking of the times, in the world of growing
trade, uncertainty has also increased.
In 1995, the International Monetary Fund began work on data dissemination
standards to guide member countries to disseminate the economic and financial data to
general public. “Guide to the General Data Dissemination System” is aimed at to improve
different aspects of statistical systems in a country, and is also part of the World Bank
Millennium Development Goals (MDGs), and Poverty Reduction Strategic Papers, (PRSP).
The reform agenda (2006) called the Medium Term Strategy, includes changes in
IMF governance to enhance the role of developing countries in the institution's decision-
making process, thus to help member countries adopt macroeconomic policies for sustained
growth and reduce poverty. The Executive Board of the IMF adopted the 2007 Decision on
Bilateral Surveillance, on how the IMF should analyze economic outcomes at the country
level replacing a 30-year-old decision of the Fund's member countries.
Controversial Role of the IMF
The conditionality clause has made the role of the IMF quite “controversial”. Critics
claim that IMF policy makers deliberately support military dictatorships friendly to
American and European corporations and blame IMF for having views generally apathetic
to democracy, human rights, and labor rights. Various examples are highlighted where
democratized govenments fell after receiving IMF loans. Favorable arguments say that
economic stability is a precursor to democracy.
The financial aid bound to so-called "Conditionalities" and Structural Adjustment
Programs are widely criticized. The economic performance targets, the conditionalities a
precondition for IMF loans, are claimed to retard social stability and inhibit the stated goals

80
of the IMF. Similarly, Structural Adjustment Programs lead to an increase in poverty in
recipient countries. Currency devaluation advocacies, "austerity programmes" and
increasing tax policies by the IMF are largely criticized as inflationary with economic
contraction as the ultimate outcome.
However, a research by the Pew Research Center shows that more than 60 percent of
Asians and 70 percent of Africans feel that the IMF and the World Bank have a positive
effect on their country. In 2005, the IMF implemented a sweeping debt-relief program
known as the Multilateral Debt Relief Initiative for the world's poorest countries.
Accordingly, 23 countries mostly in sub-Saharan Africa and Central America received total
relief of debts owed to the IMF.
4.4.2 Pakistan and IMF
The “love-hate” relationship of Pakistan and IMF is 40-year old. Political activists and civil
society have always been highly critical to IMF loans. In 1960s for the first time, IMF
extended a credit facility of $ 1.73 billion for 3 years. The focus was industrial sector
development and liberalization of import regime. In 1988 another fund injection of $ 497
million came in for social sector development and trade liberalization. In 2000 over $ 1
billion loan for Economic Reform Strategy under Poverty Reduction and Growth Facility
(PRGF) was extended. However, in 2004, in mid of economic boom, the Government
decided not to seek financing from the IMF, and Pakistan joined 70% of the member
countries with whom IMF has no lending relationships.
4.4.3 The World Bank (WB)
World Bank provides loans to developing countries for poverty reduction and
development, and offers advisory support. The Bank offers two types of loans;
• Investment loans for support of economic and social development
• Development policy loans to support policy and institutional reforms
Bank comprises of International Bank for Reconstruction and Development (IBRD)
and International Development Association (IDA):

81
• IBRD lends to middle income countries at a modest mark up over its own
borrowing from the capital markets
• IDA gives grants or loans on nominal interest rates to low income countries with
little exposure to international credit markets
The World Bank is one of the two (the other is IMF) Bretton Woods institutions
which were established in 1944 essentially to rebuild a “war torn” Europe after the World
War II. However, after the Marshall Plan, its focus shifted to building of infrastructure of
former European colonies. The Bank gave its first post war reconstruction loan of $ 250
million to France in 1946. Over a period of time many changes took place in its goals and
targets;
• 1968 to 1981, poverty alleviation
• 1980 to 1990, debt management and structural adjustments
• Presently, achievement of MDGs, poverty reduction and sustainable
development
The Bank gets fund from the sale of IBRD’s AAA-rated bonds in the international
financial markets. The IDA is sponsored by forty donor countries every three year, and also
from repayments of loans.
Criticism
It has been argued by many that Bank was created to promote business interest of the
United States and not to reduce poverty and it has actually increased poverty. Structure of
the Bank also comes under criticism as being undemocratic and the US has a veto on certain
constitutional decisions with over 16 percent shares in the Bank. The president of the Bank
is always an American nominated by the US president.
Some believe that Bank imposed damaging, destructive and anti- development
policies on the developing countries. Its NGO driven “imperialism” and blaming the poor
for their conditions is strongly criticized. It has also been suggested that Bank itself lacks
transparency in its policies.

82
4.5 World Trade Organization (WTO) The World Trade Organization (WTO), the successor to the General Agreement on
Tariffs and Trade (GATT), was set up on January 1, 1995. GATT which was created in
1948, as a de facto international organization, continued to operate for almost five decades.
Mandate and Mission
The WTO deals with the rules of trade between nations and is responsible for
negotiating, and implementing new trade agreements signed by the member countries after
ratified in their parliaments. Most of the WTO's current work comes from earlier
negotiations under the GATT from 1986-94 and called the Uruguay Round. The Doha
Development Agenda (DDA) was launched in 2001, and is the focus of new round of
negotiations. The “stated” goal of WTO is to improve the welfare of the peoples of its
member countries by lowering trade barriers and providing a platform for negotiation of
trade. Its mission is "to ensure that trade flows as smoothly, predictably and freely as
possible". It also has certain core functions based on five fundamental principles, which are
the foundation of the multilateral trading system.
4.5.1 Principles of the Trading System
The WTO sets the rules of the trade policy games, and establishes a framework for
trade policies. Five principles are at the heart of both the pre-1994 GATT and the WTO:
• Non-Discrimination has two major components:
• The most favored nation (MFN) rule
• The national treatment policy
The MFN rule requires that a WTO member has to grant the most favorable
conditions under which it allows trade in a certain product type to all other WTO members.
"Grant someone a special favour and you have to do the same for all other WTO members."
National treatment provides that imported and locally-produced goods should be treated

83
equally and was introduced to tackle non-tariff barriers to trade (e.g. technical standards,
security standards et al. discriminating against imported goods). Both the principles apply on
all WTO rules on goods, services, and intellectual property, but their precise scope and
nature may differ across these areas.
Reciprocity not only limits the scope of free-riding that may come up because of the
MFN rule, but also provides a better access to foreign markets. It is necessary that the gain
from negotiations be greater than the gain available from unilateral liberalization; reciprocal
concessions intend to ensure that such gains will materialize.
Binding and enforceable commitments means that all tariff commitments made by
WTO members in a multilateral trade negotiation and on accession are cataloged in
schedules (list) of concessions. The schedules establish "ceiling bindings". A country can
change its bindings, only after negotiating with its trading partners. It ensures compensating
for loss of trade. If satisfaction is not obtained, the complaining country may invoke the
WTO dispute settlement procedures.
Transparency requires all WTO members to publish their trade regulations, to
respond to requests for information by other members, and to notify regularly any changes
in trade policies to the WTO. These “internal transparency requirements” are facilitated by
WTO by periodic country-specific trade policy reviews through the Trade Policy Review
Mechanism (TPRM). Further more it improves predictability and stability, discouraging the
use of quotas and other measures to set limits on quantities of imports.
• Safety valves mean that under specific circumstances, governments can restrict
trade. It involves three types of provisions/ articles
• use of trade measures to attain noneconomical objectives
• ensuring "fair competition"
• permitting intervention in trade for economic reasons

84
4.5.2 WTO Agreements
The WTO oversees about 60 different agreements. Member countries must sign and
ratify all WTO agreements on accession. Some of the important agreements are as under:
Agreement on Agriculture (AoA)
With the establishment of the WTO these agreements came into being, and have
three pillars:
Domestic Support/ Subsidies have three categories or "boxes": a Green Box, an
Amber Box, and a Blue Box. The Green Box includes fixed payments to producers for
environmental programmes, however, the payments should be “decoupled” from the current
production levels. The Amber Box comprises domestic subsidies that a government has
agreed to reduce but not eliminate. The Blue Box means that so long as the payments are
linked to production-limiting program, subsidies can be increased without any limit.
Europe and the USA are allowed to spend $380 billion annually on agricultural
subsidies alone under the domestic support system. "It is often still argued that subsidies are
needed to protect small farmers but, according to the World Bank, more than half of EU
support goes to 1% of producers while in the US 70% of subsidies go to 10% of producers,
mainly agri-businesses". These subsidies can over flow the international markets with
“dumping” below-cost products, which can depress the prices and marginalize the
producers in poor countries. Market Access signifies the reduction of tariff or non-tariff
barriers to trade to give access to developing countries. Following was the reduction formula
since 1995;
• 36% average reduction by developed countries, with a minimum per tariff line
reduction of 15% over five years
• 24% average reduction by developing countries with a minimum per tariff line
reduction of 10% over nine years
• Least Developed Countries (LDCs) exempted from tariff reductions

85
• However, either had to convert non–tariff barriers to tariff “tariffication” or
"bind" their tariffs with a "ceiling" that could not be increased in future
Export Subsidies call for reduction of export subsidies by the developed countries by
at least 35 percent (by value) or by at least 21 percent (by volume) over the next five years
(1995 to 2000).
Agreement on Sanitary and Phyto-Sanitary (SPS) Measures
The SPS Agreement was negotiated during the Uruguay Round of the GATT, but
entered into force with the establishment of the WTO, it sets constraints on policies
regarding food safety (bacterial contaminants, pesticides’ inspection and labeling), animal
and plant health (imported pests and diseases) of the member countries. Under the SPS
agreement, the WTO has the power to outweigh the use of the precautionary principle that
allows a country to act on the side of caution if there is no scientific certainty about potential
threats to human health and the environment.
Agreement on Technical Barriers to Trade (TBT)
The Agreement was negotiated during the Uruguay Round and came into effect with
at the end of 1994. The objective of the TBT Agreement is “to ensure that technical
negotiations and standards, as well as testing and certification procedures, do not create
unnecessary obstacles to trade".
4.5.3 Chronology of Key Events International Trade Organization And General Agreement On Tariffs And Trade
GATT was, established like World Bank and International Monetary Fund for
international economic cooperation after World War II. During the negotiations at Bretton
Woods, the need for a comparable international institution for trade was realized. In 1945,
on the initiative of the United States, its allies stared negotiations to have a multilateral
agreement for the reciprocal reduction of tariffs on trade in goods. There after, in 1946, the
United Nations Economic and Social Committee adopted a resolution, and called for a

86
conference to draft a charter for an International Trade Organization (ITO). In 1947 the
agreement on the GATT was finalized in Geneva that paved way to sign the "Protocol of
Provisional Application of the General Agreement on Tariffs and Trade” by twenty three
countries on October 30, 1947.
In 1948, the negotiations on the ITO Charter (Havana Charter) failed. The ITO
Charter was never approved despite submitted to the US Congress repeatedly. It would get
involved in internal economic issues, was argument against the new organization. President
Truman, in December 1950 announced his inability to seek Congressional approval of the
ITO Charter. The GATT over the years "transformed itself" into a de facto international
organization in the absence of an international organization for trade.
GATT and WTO Rounds of Negotiations
The GATT operated for almost half a century as a semi-institutionalized multilateral
treaty regime on a provisional basis. Till the establishment of WTO in 1995 it remained the
only multilateral instrument administering the international trade from 1948.
Geneva to Tokyo Rounds
Under the GATT, seven rounds of negotiations took place; the first trade rounds
concentrated on further reduction of tariffs. The Kennedy Round in the mid-sixties came up
with anti-dumping agreement. The Tokyo Round during the seventies tried to improve the
system and non-tariff trade barriers. The full GATT membership did not agree to these
plurilateral agreements, therefore, often called “codes". The Uruguay Round attempted to
amend these codes, while turning them into multilateral commitments accepted by all WTO
members. However, only four of them remained plurilateral (government procurement,
bovine meat, civil aircraft and dairy products).

87
Table 12: GATT and WTO Trade Rounds
Name Start Duration Countries Subjects covered Achievements
Geneva April 1947 7 months 23 Tariffs Signing of GATT, 45,000 tariff concessions affecting $10 billion of trade
Annecy April 1949 5 months 13 Tariffs Countries exchanged some 5,000 tariff concessions
Torquay September 1950 8 months 38 Tariffs
Countries exchanged some 8,700 tariff concessions, cutting the 1948 tariff levels by
25% Geneva
II January
1956 5 months 26 Tariffs, admission of Japan $2.5 billion in tariff reductions
Dillon September 1960
11 months 26 Tariffs Tariff concessions worth $4.9 billion of
world trade
Kennedy May 1964 37 months 62 Tariffs,
Anti-dumping Tariff concessions worth $40 billion of
world trade
Tokyo September 1973
74 months 102
Tariffs, non-tariff measures, "framework"
agreements
Tariff reductions worth more than $300 billion dollars achieved
Uruguay September 1986
87 months 123
Tariffs, non-tariff measures, rules,
services, intellectual property, dispute
settlement, textiles, agriculture, creation of
WTO, etc
The round led to the creation of WTO, and extended the range of trade negotiations,
leading to major reductions in tariffs (about 40%) and agricultural subsidies, an
agreement to allow full access for textiles and clothing from developing countries, and an extension of intellectual property rights.
Doha November 2001 141
Tariffs, non-tariff measures, agriculture,
labor standards, environment,
competition, investment, transparency, patents etc
The round is not yet concluded.
Source: WTO Uruguay Round
The biggest negotiating mandate on trade ever agreed, the eighth round, known as
the Uruguay Round was initiated in September 1986, in Punta del Este, Uruguay. Several
new areas like trade in services, intellectual property, and trade reforms in the sensitive
sectors of agriculture and textiles came under discussions for trading system, and all the
original GATT articles were up for review.
The US and EU disagreed on agricultural trade reforms and decided to extend the
talks. However, "the Blair House accord" settled the differences, and in 1994, the deal was

88
signed at a meeting in Marrakesh, (Morocco) by ministers from most of the 123 participating
governments.
The Uruguay Round gave birth to WTO, which replaced GATT as an international
organization. It is widely regarded as the most profound institutional reform of the world
trading system since the GATT's establishment. The most important point is that the GATT
still exists as the WTO's umbrella treaty for trade in goods. There is a distinction between
GATT 1994; the updated parts of GATT and GATT 1947, the original agreement which is
still the heart of GATT 1994.
Besides legally binding agreement of the GATT 1994, the sixty agreements,
annexes, decisions and understandings were adopted in the Final Act. The structure of
agreements falls into six main components;
• The Agreement Establishing the WTO
• Goods and investment; the Multilateral Agreements on Trade in Goods including
the GATT 1994 and the Trade Related Investment Measures
• Services; the General Agreement on Trade in Services
• Intellectual Property ; the Agreement on Trade-Related Aspects of Intellectual
Property Rights (TRIPS)
• Dispute Settlement (DSU)
• Reviews of Governments' Trade Policies (TPRM)
Doha Round
The Doha Round or the Doha Development Agenda (DDA) was launched by the
WTO at the Fourth Ministerial Conference in Doha, Qatar in November 2001. The agenda
was liberalizing trade further and new rule-making, underpinned by commitments to
strengthen substantial assistance to developing countries.
The Doha round was an ambitious effort to make globalization more inclusive and
help the world's poor, particularly by slashing barriers and subsidies in farming. Due highly

89
contentious negotiations no agreement was concluded. Further intense negotiations at Fifth
Ministerial Conference in Cancun in 2003 could not make any progress.
The Sixth Ministerial Conference in Hong Kong in 2005, adopted a Declaration,
setting deadlines for the negotiations to be concluded, and some of them were adopted.
They included elimination of all forms of export subsidies and disciplines on all export
measures by 2013 and the deadline for establishment of modalities for further negotiations
being set on 30 April 2006.
However, these deadlines passed by without any conclusive agreements between the
Members. In 2006, Pascal Lamy, the WTO's Director-General, formally suspended the
negotiations at the end of a futile Ministerial meeting in Geneva. However, Lamy, in his
report to the WTO General Council on February 7, 2007, stated that "political conditions are
now more favorable for the conclusion of the Round than they have been for a long
time…..political leaders around the world clearly want us to get fully back to business,
although we in turn need their continuing commitment”.
Ministerial Conferences
So far there have been six ministerial conferences.
• The inaugural ministerial conference in Singapore (1996)
• Second held in Geneva (Switzerland)
• Third in Seattle (Washington)
• Forth one held in Doha
• Fifth held in Cancun ( Mexico)
• Sixth took place in Hong Kong (2005)
4.5.4 Institutional Structure
The topmost decision-making body of the WTO is the Ministerial Conference, which
meets twice a year. The Ministerial Conference can make decisions on all matters under any
of the multilateral trade agreements.

90
The second tier consists of General Council, the Dispute Settlement Body, and the
Trade Policy Review Body, which handle the work of the ministerial conference. These
three consist of the same membership and representatives of all WTO members, and each
meets under different rules.
Then comes three Councils for Trade, which work under General Council;
• Council for Trade in Goods
• Council for Trade-Related Aspects of Intellectual Property Rights
• Council for Trade in Services
At the fourth level comes the Subsidiary Bodies;
• The Goods Council have the following committees;
• Information Technology Agreement (ITA) Committee
• State Trading Enterprises
• Textiles Monitoring Body: consists of a chairman and 10 members acting under
it
• Groups dealing with notifications — process by which governments inform the
WTO about new policies and measures in their countries
• The Services Council deals with financial services, domestic regulations and
other specific commitments
• Dispute Settlement panels and Appellate Body to resolve disputes and the
Appellate Body to deal with appeals
Other Committees and Working Parties
• Committees On
• Trade and Environment
• Trade and Development (Subcommittee on Least-Developed Countries)
• Regional Trade Agreements
• Balance of Payments Restrictions

91
• Budget, Finance and Administration
• Working Parties On
• Accession
• Trade, debt and finance
• Trade and technology transfer
Having its headquarters in Geneva, Switzerland , the WTO has a membership of 152
countries. Many non-member having observer status, are negotiating their membership. It
has a budget of $ 141 million (USD) and around 625 people work in the WTO Secretariat.
The WTO operates on a one country, one vote system, but actual votes have never
been taken. Decision making is generally by consensus. The market size of the country
determines the bargaining power. Though, through consensus decision-making acceptable
decisions are encouraged but the process is time consuming, and it takes many rounds of
negotiation to develop a consensus decision. Moreover, the tendency to use ambiguous/
vague language on contentious issues makes future interpretation difficult. The WTO
negotiations in reality proceed not by consensus of all members, but by a process of
informal negotiations between small groups of countries. Criticized by the developing
countries, these negotiations are often called "Green Room" negotiations. It has been argued
that although the WTO's consensus governance model provides law-based initial bargaining,
trading rounds close through power-based bargaining favouring Europe and the United
States, and may not lead to improvement.
4.6 New Economic World Order
Since the end of the Cold War, globalization has been the most outstanding
characteristic of international economic affairs and to a considerable extent, of political
affairs as well (Gilpin, 2001). Vincent Cable of the Royal Institute of International Affairs
has pointed out that the major economic achievement of the post – World War II era has
been to restore the level of international economic integration that existed prior to World
War I.

92
Hanna (2004) writes that globalization along with regionalization is the overriding
trend in international economic affairs, leading to increased linkages amongst countries,
after the World War II.
Financial developments since mid 1980s and regionalism have profound affect on
international economy and its integration. However, the nation states, national political and
economic policies and markets have a very dominant role in this development process both
at domestic and international level. Economic globalization has brought key developments
in international trade and finance. The rise of foreign direct investment (FDI) by
multinational corporations (MNCs) and transnational corporations (TNCs) is also attributed
to globalization.
International trade has grown more rapidly than the global economic output.
Volume of trade in goods and services has gone up due to decreased transportation costs and
technology revolution. Every day, availability of more “trade able” goods has enhanced
international competition.
Wave of deregulation and privatization from the late 1970s onward has further
opened national economies, and more and more businesses are participating in international
markets. Financial deregulation and new financial instruments have contributed to more
integrated international financial system. The volume of foreign exchange trading in the late
1990s reached approximately $1.5 trillion per day, an eightfold increase since 1986. The
amount of investment capital seeking higher returns has grown, and by mid 1990s mutual
funds, pension funds etc totaled $ 20 trillion are ten times more than the 1980 figure,
(Gilpin, 2001).
4.6.1 Foreign Direct Investment (FDI)
In the second half of the 1980s huge surge of foreign direct investment (FDI) took
place by the multinational corporations (MNCs). FDI in fact, expanded more rapidly than
world trade and global economic output. In the early postwar decades, Japan and West
Europe became the major investors, and United States was both the world’s largest home
and host economy. As a consequence of this development, FDI outflows from the major

93
industrialized countries to the industrializing countries rose to approximately 15 percent
annually, and at the same time largest fraction of FDI, goes to the industrialized countries.
The largest part of FDI has been in the services and high-tech industries such as automobile
and information technology coupled with cross border trade and financial flows.
With an impressive growth of 38 percent, global FDI inflows went up to $1,306
billion in 2006. This was the third consecutive year of growth that approached the record
level of $1,411 billion in 2000. Inflows increased in all three groups of economies:
developed countries, developing countries and the transition economies of South-East
Europe and the Commonwealth of Independent States (CIS), (World Investment Report,
2007). The rise in global FDI flows was due to increase in green field investment and
partly due to increased corporate profits worldwide resulting higher stock prices and raised
value of cross-border mergers and acquisitions (M&As). A weaker dollar also contributed in
rise of global FDI flows in 2006.
In developed countries FDI inflows rose by 45 percent as compare to previous years
and reached $857 billion, and showing an increase of 21 percent from 2005. Flows to
developing countries and the transition economies attained the highest levels ever of $379
billion and $69 billion (68% increase) respectively. The United States was the leading host
country, followed by the United Kingdom and France. The largest inflows among
developing economies went to China, Hong Kong (China) and Singapore, and among the
transition economies to the Russian Federation.
Services accounted for the bulk of world inward FDI stock in 2005. Within services,
the share of infrastructure-related industries went up. Manufacturing was the second largest
sector, but its share declined from 41% in 1990 to 30% in 2005, and the share of the primary
sector was less than 10% of world inward FDI stock. The share of extractive industries in
total FDI increased somewhat between 2000 and 2005.
Worldwide countries adopt measures to improve their investment climate. In 2006,
according to UNCTAD’s annual survey on changes in national laws and regulations relevant
to FDI, a total of 184 policy changes were identified, and 80% of which were in the

94
direction of making the host-country environment more favorable. Most of the changes were
regarding introduction of new promotional efforts, including incentives aimed at increasing
FDI in certain economic activities.
FDI inflows have enhanced the role of developing countries in international
investment rule-making. At the end of 2006, they were party to 76% of all Bilateral
Investment Treaties (BITs) and, 61% of all Double Taxation Treaties (DTTs), and 81% of
all other International Investment Agreements (IIAs). Most importantly, FDI has remarkably
changed the international production and employment patterns.
4.6.2 Multinational Corporations (MNCs)
Multinational corporations (MNCs) have existed since the beginning of overseas
trade. In the 17th and 18th century large European firms like the Dutch East India Company,
and the British East India Company of “merchant adventurers” were the predecessors of
present day MNCs. In the age of colonization, though exploitative, MNCs were viewed as
agents of civilization and commercial and industrial development. These earlier MNCs were
more powerful than the today’s transnational concerns. They have their armies, fleets, and
even foreign policies. Moreover, they have control over vast territories, (Sub Continent,
South America, Africa, and East Indies). Agriculture and extractive industries were their
major interests, (Gilpin, 2001).
Present day MNCs though large business concerns yet modest than their forerunners
and mainly interested in manufacturing, retailing, services and follow a global corporate
strategy. In the 19th century, advancements in communications and technology have linked
the international markets more closely and MNCs became the instruments of better
international relations through commercial linkages. In words of Ostry (1997), the MNCs
are an important feature of globalization of world economy. Many believe that today the
MNCs have become a powerful force in international political and economic affairs.
A firm of a particular nationality having subsidiaries (partial or wholly owned) in
more than one country is called Multinational Corporation. According to one estimate over
40,000 MNCs with their cross border subsidiaries are doing business in international

95
markets. MNCs start and expand business in another economy through foreign direct
investment. The top MNCs have their headquarters in US, Japan, Western Europe. In 1996,
out of 500 largest global companies, 162 were from US and 126 from Japan, and total
revenues of these 500 companies were $11.4 trillion, total profits were $404 billion and total
assets were $33.3 trillion, (ILO Report).
Due to enormity of their resources, MNCs have the capacity to transform
international trade and production patterns. A decision to export from the home market or to
make investment overseas to service host market can have strong implications for
international economy. MNCs have strategic behavior, and to have long term standing and
profitability, they try to influence international rules and regimes of business and
competition.
According to Gilpin (2001), neoclassical economists have little to say about MNCs
because of their belief that markets determine the firm’s behavior, thus nationality of the
firm whether it operates domestically or internationally is of no importance. He further
argues that economists believe that theories of location and comparative advantage
determine the location of economic activities. Hence the business and production will go to
the efficient location.
MNCs enter a market through a variety of ways: by green field investment (building
new facilities), mergers, takeovers, and joint ventures. National governments compete for
investments from MNCs because they create jobs, revenues, and incomes and bring in
technology and capital. MNCs have grown in power and visibility in recent times. But they
are being criticized sometimes by both governments and consumers worldwide due to their
monopolistic powers, size, resources and mobility. It is perceived that they lack concern not
only for the economic well-being of the geographic regions they operate in, but also for their
workers. There is a general impression that MNCs have more power than national
governments and other international trade federations and organizations.
Despite such apprehensions, MNCs are gaining power and influence as barriers to
international trade are coming down, international business is getting more integrated, and

96
national governments are offering more incentives and facilities to attract FDI through
MNCs. According to Bartlett et al, (2003), MNCs produce 40 % of global manufacturing out
put, and quarter of the world trade. Around 85% of the world’s automobiles are made by
them. They also produce and market 70 % of computers, 35 % of toothpastes, and 65 % of
soft drinks.
4.7 Globalization
Globalization is often used to refer to economic globalization that is integration of
national economies into the international economy through trade, foreign direct investment,
capital flows, migration, and the spread of technology. Bhagwati (2004) and
Herman (1999) argue that sometimes the terms internationalization and globalization are
used interchangeably. However, there is a slight difference. International means between or
among nations. The term "internationalization" refers to international trade, relations,
treaties etc. "Globalization" means going beyond national boundaries for economic
purposes; international trade (comparative advantages) or for interregional trade
(absolute advantages). Croucher (2004) describes it as a process by which the people of the
world are unified into a single society and functions together. This process is a combination
of economic, technological, sociocultural and political forces.
Friedman (2008), "examines the impact of the 'flattening' of the globe", and argues
that globalized trade, outsourcing, supply-chaining, and political forces have changed the
world permanently, for both better and worse. He also argues that the pace of globalization
is quickening and will continue to have a growing impact on business organization and
practice.
The economists since 1981 has used the word "Globalization" however, its concepts
did become popular in the later half of the 1980s and 1990's. The earliest concepts of
globalization were written by an American entrepreneur-turned-minister Charles Taze
Russell, who coined the term 'corporate giants' in 1897. Globalization existed through out
history, during the Roman, the Parthian , and the Han Dynasty. The Muslim traders
established a global economy resulting in a globalization of crops, trade, knowledge and

97
technology. The Mongol Empire further integrated it along side Silk Road. Later on the
global integration continued through the expansion of European trade in the 16th and 17th
centuries. Globalization has had a tremendous impact on cultures around the world.
However, the 19th century globalization is marked by rapid growth in international trade
and investment between the European powers, their colonies, and, later on with the United
States.
During this period, sub-Saharan Africa and the Pacific Island were incorporated into
the world system. However, the World War 1, and collapse of the gold standards (1920s-
1930s), broke it down. After the World War II, era of planned globalization and economic
integration started with establishment of Bretton Woods Institutions, the GATT, and the
WTO.
Castells (1996) argues that global economy has the capacity to work as a unit, in real
time, on a planetary scale. Macshane (1996), mentions four interrelated factors that have
driven globalization: increased international trade; the growth of multinational corporations;
the internationalization of finance; and the application of new technologies in all these
operations, especially computer and other information.
Recently the Swiss think tank KOF, has measured the globalization by economic,
social, and political indices. However beside these, “an overall index of globalization and
sub-indices referring to actual economic flows, economic restrictions, data on personal
contact, data on information flows, and data on cultural proximity, on a yearly basis for 122
countries” has also been analyzed. According to the KOF index, the world's most globalized
country is Belgium followed by Austria, Sweden, the United Kingdom and the Netherlands.
The least globalized countries are Haiti, Myanmar, the Central African Republic and
Burundi.
Criticism
Supporters of globalization like Jeffrey Sachs, (2005), attributes drop in poverty rates
in countries like China to strong globalization as compared to Sub-Saharan Africa, where
poverty rates have remained stagnant, and have less globalization affects.
98
It is generally believed that Free Trade, Capitalism, and Democracy have facilitated
Globalization. Free trade supporters say it increases economic prosperity as well as
opportunity, especially among developing nations. It also enhances civil liberties and leads
to a more efficient allocation of resources. This leads to lower prices, more employment,
higher output and a higher standard of living for those in developing countries, (World
Bank).
The laissez-faire capitalism sees globalization as the beneficial spread of liberty and
capitalism. Supporters of democratic globalization believe that the market-oriented
globalization should be followed by a phase of building global political institutions
representing the will of people. Generally the argument given in favor of the globalization is
that from 1981 to 2001, the number of people living on $1 a day or less declined from 1.5
billion to 1.1 billion in absolute terms. It is also argued that the percentage of people living
on less than $2 a day has declined in areas affected by globalization. In East-Asia, including
China, the percentage has decreased by 50.1% compared to a 2.2% increase in Sub-Saharan
Africa.
Anti globalization critics say that poorer countries are sometimes at disadvantage, as
the export of poorer countries is largely based on agricultural goods, therefore it is difficult
for these countries to compete with subsidized farm products of the richer countries.
Chossudovsky (2003) mentions exploitation of foreign impoverished workers in the name of
globalization and cheap labor. Though the workers are free to leave their jobs, but in many
poorer countries, this would mean starvation for the workers, and their families.
Globalization has enhanced the economic gap between skilled and unskilled workers,
causing decline of the middle class, and increased economic inequality in the United States.
This also means that people in the lower class have a much harder time climbing out of
poverty because of the absence of the middle class as a stepping stone.
The so-called 'champagne glass' effect mentioned by Gorostiaga (1995), has been
included in the 1992 United Nations Development Program Report, which illustrates the
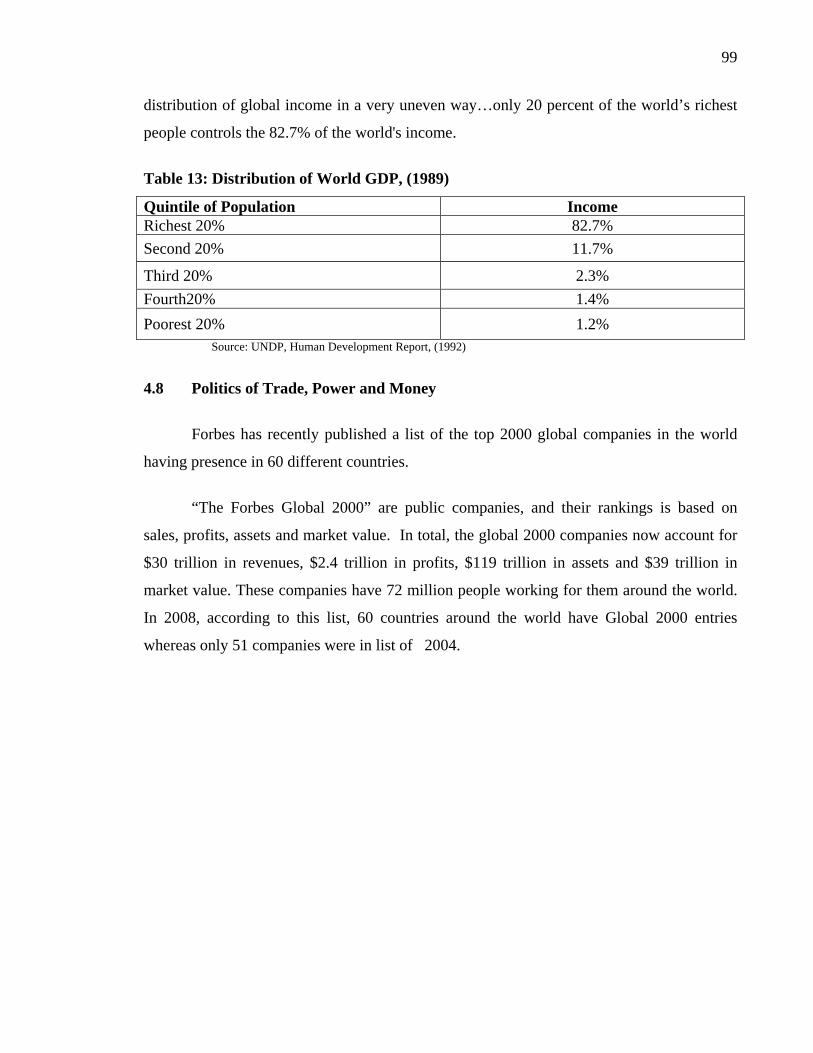
99
distribution of global income in a very uneven way…only 20 percent of the world’s richest
people controls the 82.7% of the world's income.
Table 13: Distribution of World GDP, (1989)
Quintile of Population Income Richest 20% 82.7% Second 20% 11.7%
Third 20% 2.3% Fourth20% 1.4% Poorest 20% 1.2% Source: UNDP, Human Development Report, (1992)
4.8 Politics of Trade, Power and Money
Forbes has recently published a list of the top 2000 global companies in the world
having presence in 60 different countries.
“The Forbes Global 2000” are public companies, and their rankings is based on
sales, profits, assets and market value. In total, the global 2000 companies now account for
$30 trillion in revenues, $2.4 trillion in profits, $119 trillion in assets and $39 trillion in
market value. These companies have 72 million people working for them around the world.
In 2008, according to this list, 60 countries around the world have Global 2000 entries
whereas only 51 companies were in list of 2004.

100
Table 14: The Top Companies Sorted by Market Value
Company Country Industry Sales ($bil)
Profits ($bil)
Assets ($bil)
Market Value ($bil)
PetroChina China Oil & Gas Operations 88.24 18.21 111.70 546.14
ExxonMobil United States Oil & Gas Operations 358.60 40.61 242.08 465.51
General Electric United States Conglomerates 172.74 22.21 795.34 330.93
China Mobile Hong Kong/China Telecommunications Services
37.06 8.29 62.44 308.59
Gazprom Russia Oil & Gas Operations 81.76 23.30 201.72 306.79
ICBC China Banking 37.48 6.31 961.65 289.57
Microsoft United States Software & Services 57.90 16.96 67.34 253.15
Petrobras-Petróleo Brasil
Brazil Oil & Gas Operations 87.52 11.04 129.98 236.67
Royal Dutch Shell
Netherlands Oil & Gas Operations 355.78 31.33 266.22 221.09
Berkshire Hathaway
United States Diversified Financials 118.25 13.21 273.16 216.65
AT&T United States Telecommunications Services
118.93 11.95 275.64 210.22
BP United Kingdom Oil & Gas Operations 281.03 20.60 236.08 204.94
Procter & Gamble
United States Household & Personal Products
79.74 11.13 144.40 203.67
Wal-Mart Stores United States Retailing 378.80 12.73 163.38 198.60
BHP Billiton Australia/United Kingdom
Materials 39.50 13.42 53.36 190.62
Nestlé Switzerland Food Drink & Tobacco 94.76 9.38 99.06 188.11
Sinopec-China Petroleum
China Oil & Gas Operations 133.79 6.90 77.44 186.38
Total France Oil & Gas Operations 199.74 19.24 165.75 181.80
HSBC Holdings United Kingdom Banking 146.50 19.13 2,348.98 180.81
Chevron United States Oil & Gas Operations 203.97 18.69 148.79 179.97
Bank of America
United States Banking 119.19 14.98 1,715.75 176.53
Johnson & Johnson
United States Drugs & Biotechnology 61.10 10.58 80.95 175.51
Toyota Motor Japan Consumer Durables 203.80 13.99 276.38 175.08
Source: “Forbes: Global 2000 Companies” www. forbes.com

101
4.8.1 Richest People in the World
Forbes has done a special report on the “World’s Billionaires” in 2008, and recorded
946 billionaires whose fortune has gone up due to strong equity markets, booming real estate
values and rising commodities prices. The combined net worth of these wealthiest people
has gone up from $ 900 billion to $ 3.5 trillion in 2008. In this list, there are 178 new
comers from “Mumbai to Madrid”. The new comer billionaire includes 19 from Russia, 14
from India, 13 from China, 10 from Spain, and few from Cyprus, Oman, Romania and
Serbia.
According to this report, “Ingenuity not industry” is the common characteristic
among these wealthiest people, and 60 percent of these fortunes have been made from a
scratch. These people have made money in every field … from media and real estate to
coffee, dumplings and ethanol. From the last years ranking, two-third get richer, however,
32 went down from the last year’s ranking. The ranking is;
• Warren Buffett from the US is the richest person in the world with net worth of $
62 billion
• Carlos Slim Helu from Mexico is number two with net worth of $ 60 billion
• Bill Gates from the US is number three having net worth of $ 58 billion
• Lakshmi Mittal from India ranks fourth with net worth of $ 45 billion
• Two more Indian occupy fifth and sixth position with net worth of $ 43 and $ 42
billion
4.9 Political Economy of Information
Traditional neoclassical economics literature assumes that markets are always
efficient except for some limited and specific markets. Stiglitz (2001) in recent studies has
reversed these assumptions. According to Stiglitz and Greenwald (1986)…whenever
markets are incomplete and or information is imperfect, even competitive market allocation
is not constrained Pareto efficient. Stiglitz does not believe in “invisible hand”. In an

102
interview, he says… information economics represents a fundamental change in the
prevailing paradigm within economics.
Problems of information are central to understanding not only market economics but
also political economy. Unfettered markets often not only do not lead to social justice, but
do not even produce efficient outcomes. Individuals and firms, in the pursuit of their self
interest are not necessarily or in general led as if by an invisible hand, to economic
efficiency. As a result, Stiglitz continues, governments can improve the outcome by well-
chosen interventions. The Sappington-Stiglitz theorem "establishes that an ideal
government could do better running an enterprise itself than it could through privatization”.
In Globalization and its Discontents (2002), Stiglitz argues that what are often called
"developing economies" are, in fact, not developing at all. He complains that the IMF has
done great damage through the economic policies it has prescribed for the countries in order
to qualify for IMF loans or from other lenders. The organization and its officials ignore the
implications of incomplete information, inadequate markets, and unworkable institutions-all
of which are especially characteristic of newly developing countries, he argues. Shapiro-
Stiglitz model (1984) explains why there is unemployment... Unemployment is driven by the
information structure of employment. “Information rules the game” both for economic and
political process. Though information imperfections and asymmetries of information are
persistent in every aspect of life, information economics is gaining ground and likely to have
even more influence in the future, (Stiglitz, 2001).

103
References
Bairoch, P, (1976) : Commerce extérieur et développement économique de l’Europe
au XIX siècle, Mouton, Paris La Haye: Écoles des Hautes Études en Sciences Sociales.
Bairoch, P, (1989) ‘European Trade Policy, 1815-1914’, in Mathias P. and Pollard S.
(eds), The Cambridge Economic History of Europe, Volume VIII, The Industrial
Economies: The Development of Economic and Social Policies, New York: Cambridge
University Press
Baldwin, R.E. (1997), "The Causes of Regionalism”: The World Economy, 20, 7, 865-
888.
Bartlett, C. et al, (2003): Transnational Management, 4th edition:
http://eninearticles.com/? Role-of-Multinational-Corporation-in-the-Modern-World
Retrieved on 03-06-2008
Bhagwati, Jagdish (2004): In Defense of Globalization. Oxford, New York: Oxford
University Press.
Boettke, Peter J. What Went Wrong with Economics? Critical Review Vol. 11, No.
1, P. 35. p. 58
Buchholz, Todd, (1989), new ideas from Dead Economists: An introduction to
modern economic thought, Penguin Books, ISBN 0140283137
http://en.wikipedia.org/wiki/Political_economy: Retrieved on 2008-04-23
Charles S. Mayer "In Search of Stability: Explorations in Historical Political
Economy", Cambridge University Press, Cambridge, 1987.

104
Chossudovsky, Miche, (2003): The Globalization of Poverty and the New World
Order; Edition 2nd ed. Imprint Shanty Bay, Ont: Global Outlook, 2003
Croucher L. Sheila, (2004): Globalization and Belonging: The Politics of Identity a
Changing World. Rowman & Littlefield, (2004)
Drazen, Allen, (2000): Political Economy in Macroeconomics, Princeton University
Press, Princeton, New Jersey (USA)
Friedman, Thomas L, (2008): "The Dell Theory of Conflict Prevention." Emergin: A
Reader. Ed. Barclay Barrios, Boston: Bedford, St. Martins, 2008
Gilpin Robert, (2001): Global Political Economy: Understanding the International
Economic Order, Princeton University Press, Princeton, New Jersey (USA)
Gorostiaga Xabier, (1995), "World has become a 'champagne glass' globalization
will fill it fuller for a wealthy few' National Catholic Reporter, Jan 27, 1995.
Greenwald, Bruce and Stiglitz, Joseph E. 1986, Externalities in Economies with
Imperfect Information and Incomplete Markets, Quarterly Journal of Economics, no. 90.
Groenwegen, Peter, (1987): "'Political Economy' and 'Economics',"
http://en.wikipedia.org/wiki/Political_economy
Hanna, Julia. (2004): Harvard Business School: Working Knowledge:
http://hbswk.hbs.edu/item/5602.html
Human Development Report, (1992): United Nations Development Program (New
York, Oxford University Press: Retrieved on 2007-07-08

105
International Labor Organization: Multinational Corporations: Bureau for Workers’
activities: http://www.itilo.it
KOF Index of Globalization: http://globalization.kof.ethz.ch/: Retrieved on 2008-02-
28
Lionel Robbins quoted in Llyoyd G. Reynolds: The Three Worlds of Economics,
New Haven: Yale University Press, 1971
Nolde, B. (1932) La Clause De La Nation La Plus Favorisée et les Tarifs
Préférentiels, Académie de Droit, International, Recueil de Cours, Tome 39.
November 2002. http://www.nber.org/papers/w9326
Ostry Sylvia, (1997): A New Regime for Foreign Direct Investment: (Washington,
D.C., Group of Thirty, 1997)
Sappington, David E. M. and Stiglitz, Joseph E. 1988: Privatization, Information and
Incentives. Columbia University; National Bureau of Economic Research (NBER) June
1988; NBER Working Paper No. W2196
Shapiro, Carl and Stiglitz, Joseph E. 1984: Equilibrium Unemployment as a Worker
Discipline Device. The American Economic Review, Vol. 74, No. 3 (Jun., 1984), pp. 433-
444.
Stiglitz Joseph E. 2002, Globalization and its Discontents, published by W.W.
Norton, 2003, ISBN 0393324397, 9780393324396
Stiglitz, Joseph E. 2001: Prize Lecture: Information and the Change in the Paradigm
in Economics. Joseph E. Stiglitz held his Prize Lecture December 8, 2001, at Aula Magna,
Stockholm University. He was presented by Lars E.O. Svensson, Chairman of the Prize
Committee.

106
Stiglitz, Joseph E. “There is no invisible hand”. London: The Guardian Comment,
December 20, 2002.
The Forbes Global 2000: List of Top 2000 Global Companies, 2008.
http://www.forbes.com. Retrieved on 2008-01-29
The World’s Richest People: Gates No Longer World’s Richest Man, 2008.
http://www.forbes.com. Retrieved on 2008-05-02
The World’s Richest People: Special Report, 2007. http://www.forbes.com.
Retrieved on 2008-01-29
University of Puget Sound: Political Economy: Retrieved on 2007-07-22: Website:
http://www.up.edu/x12490.xml
Woodruff, W. (1971) ‘The emergence of an international economy 1700-1914’, in
Cipolla (ed) The Fontana Economic History of Europe 4: 662.
World Investment Report: Transnational Corporations, Extractive Industries and
Development, (2005): United Nations Conference on Trade and Development, Publication.
New York and Geneva
World Investment Report: Transnational Corporations, Extractive Industries and
Development, (2007): United Nations Conference on Trade and Development, Publication.
New York and Geneva
World Trade Report, (2007): World Trade Organization, Switzerland
World Trade Organization, (WTO): http://www.wto.org

107
CHAPTER 5
PAKISTAN COTTON-TEXTILE AND APPAREL SECTOR
The Cotton-Textile is a very complex industry. It begins with agriculture, fiber
production of cotton and processed into yarn through different industrial stages and
through different weaving and knitting processes; it is converted into the finished cloths.
And every facet of the textile industry is a field itself, (Bernard, 1983). Textiles are very
important in our every day live, and even from the ancient times, textiles have been used
in a variety of ways. Industrial sector is also an important consumer of textiles.
International trade in textiles and clothing has played a very important role in the
development process of many countries. It has helped their integration into the world
economy, (World Trade Report 2006). A major part of merchandise exports of low and
middle income countries comprises of cotton- textile and clothing sector.
5.1 International Trade of Cotton-Textile and Apparels
Developing countries in 2004 accounted for more than one-half of world exports
of textiles and clothing. In no other category of manufactured goods developing
countries have such a large “net-exporting position”.
Thus liberalization of trade in textiles and clothing is of major significant for
many developing countries for the simple reason; it improves market access for them in
the area of their comparative advantage. However, increased competition from further
liberalization is a matter of concern for developing countries.
The quota restrictions of Agreement on Textiles and Clothing (ATC) were
essentially for imports of Canada, the European Union and the Unites States. These
three markets account for more than one-half of world textiles and clothing imports. The
end of the ATC quota regime did eliminate the quota completely for “protection in these
markets”. It is understandable that the removal of quotas have a significant impact on
global trade flows. The end of a special trade regime that had existed for more than 40
years for textiles and clothing is a remarkable step both in terms of trade liberalization

108
and the elimination of negotiated trade arrangements “in breach of WTO rules”, (World
Trade Report 2005).
5.1.1 Trends in Clothing and Textile International Trade
For the Textile and Clothing trade, 2006 was a significant year as it was the
second year after the phasing out of the Agreement on Textile and Clothing (ATC),
which replaced the Multi-Fiber Arrangement (MFA) in 1995. This shift was to affect
exports of many countries producing “winners and losers” from the additional
liberalization, (World Trade Report 2006). The termination of the ATC affected the
patterns and flows of trade in 2005, and even in 2006. The structural changes in world
trade of textiles and clothing went on unabatedly, (World Trade Report 2007).
China’s exports continued to increase the market share in all major developed
import markets. The combined textiles imports of the three economies: Canada, the
United States and the EU from China rose by 41 per cent in 2005. There was an increase
of 15 per cent in 2006. However, the market shares declined for major traditional
suppliers like Turkey, Romania, Morocco and Tunisia. Advanced developing economies
in East Asia also lost market shares.
Interestingly, some smaller suppliers expanded their textiles and clothing exports
even faster than China and the share of least developed countries in imports of the United
States and the European Union went up in 2006. Imports of textiles and clothing have
increased by 5.5 per cent, to about $350 billion in 2006 for the four major developed
markets. The increase was slightly faster than the preceding year. However, intra-
NAFTA textiles and clothing trade declined, and intra-EU trade did not have any
significant change in 2006, (World Trade Report, 2007).
The US imports from CAFTA, the Dominican Republic, and Sub-Saharan Africa,
went down by 7 to 10 per cent. The decrease in US imports from Asian economies such
as Hong Kong, China; Chinese Taipei and the Republic of Korea was 14 percent. US
imports from the EU declined by 2.5 per cent in 2006.
Imports from China increased by 15 per cent and it were nearly 30 per cent of
total US imports of textiles and clothing. There was a rise in imports from Indonesia,
Viet Nam, Bangladesh and Cambodia. Imports from India, rose 12 per cent in 2006.

109
In the US market, China gained as a leading supplier, but at the same time
imports from smaller Asian suppliers also rose rather faster than those from China. There
was a sharp rise of EU clothing imports from Hong Kong and China in 2006. Among the
developed markets Japan’s textiles and clothing imports are mainly concentrated on
China because of geographic proximity and the absence of import quotas in the past.
More than three-quarters of Japan’s textiles and clothing imports came from China in
2006. Most significantly, the share of imports of clothing was more than 80 per cent.
Amongst the four major developed markets, Canada was on the top in textiles
and clothing imports in 2006. Its imports from China went up by more than 20 per cent.
As a whole 2006 was a very favorable one for the textile trade of the developing
countries.
Table 15: Imports of Textile and Clothing in to Major Markets by Origin (2006) (Billion dollars and percentage change)
United States EU (25) Japan Canada World (Value) 106.4 197.5 30.0 11.2
Annual Growth World 4 6 6 9 China 15 13 8 22 India 8 13 12 6 Pakistan 12 12 -7 9 Bangladesh 22 31 4 19 Cambodia 25 17 - 21 Indonesia 25 17 4 18 Philippines 9 20 - 5 Viet Nam 18 48 6 33 Thailand 1 9 -2 0 Sri Lanka 2 21 12 - East Asia (4) -14 22 -5 -12 Sub-Saharan Africa -10 9 - - Egypt 32 13 - - Morocco 69 4 - - Tunisia - 1 29 - CAFTA -7 64 - - Mexico -10 13 6 7 Canada -7 6 -7 - United States - 11 -3 -1 EU (25) -3 1 -2 2 Romania 15 1 - - Bulgaria -18 13 - - Turkey -17 4 20 - Memorandum items: - - - - Least-developed countries 14 27 27 17 Hong Kong, China - 44 - -
Note: East Asia (4) Comprises Chinese Taipei; Macao, China and the Republic of Korea. EU (25) imports include intera-trade. Source: Global Trade Atlas and Euro stat, COMEXT

110
5.2 Pakistan Trade of Textile and Clothing
Textile trade that thrives on Cotton as basic raw material is the back bone of the
Pakistan’s economy. Cotton manufactures contribute around 60 percent of total export
earnings. Moreover, it accounts for 46 percent of the total manufacturing and gives
employment to 38 percent of the manufacturing work force. Cotton production and
quality plays the central role in the growth of the industry.
Pakistan Cotton-Textile manufacture export consists of Cotton Yarn, Cotton
Cloth, Knit wear, Bed wear, Towels, Tents, Canvas and Tarpaulin, Ready made
Garments, Synthetic Textiles and Made up Articles.
Cotton and cotton related products are the most significant industrial and
agriculture products for Pakistan. Altaf (2007) believes, “what happens to the economy
in Pakistan is very much dependent on the cotton-yarn- textile- apparel complex.” Figure 14: Export of Textile Manufactures (2005-06)
Cotton Yarn, 13.7
Cotton Cloth, 21.6Tow els, 5.8
Tents,Canvas and tarpaulin, 0.3
Made up Articles, 4.3
Readymade Garments, 13.9
Other, 0.1Syenthetic Textiles, 2
Bedw ear, 20.8
Knitw ear, 17.6
Cotton Yarn
Cotton Cloth
Knitw ear
Bedw ear
Tow els
Tents,Canvas andtarpaulinReadymadeGarmentsSyenthetic Textiles
Made up Articles
Other

111
Table 16: Pakistan Export of Textile Products
Million US $ 1990
1991
1991 1992
1992 1993
1993 1994
1994 1995
1995 1996
19961997
19971998
1998
1999
1999
2000
20002001
2001 2002
2002 2003
20032004
2004 2005
Cotton Manufacturers
3,274 3,648 3,746 3,792 4,646 5,008 5,022 4,889 4,559 5,111 5,225 5,404 6,668 7,572 8,099
Cotton Yarn 1,183 1,173 1,122 1,259 1,528 1,540 1,412 1,160 945 1,072 1,077 942 928 1,127 1,057
Cotton Cloth 676 819 863 821 1,081 1,267 1,262 1,250 1,115 1,096 1,035 1,133 1,346 1,711 1,863
Tents & Canvas 80 51 40 29 38 40 36 58 41 53 50 47 73 75 67
Cotton Bags 21 32 24 17 19 25 28 23 21 19 19 18 18 0 0
Towels 129 137 139 129 145 174 194 200 178 196 243 270 375 404 520
Bed Wear 246 284 352 286 340 422 456 59 611 710 735 919 1,329 1,383 1,420
Other Madcup 109 114 126 129 164 179 209 246 255 308 328 351 360 420 420
Garments 497 614 618 612 642 649 736 747 651 772 828 882 1,093 993 1,088
Hosiery 334 425 464 509 689 703 689 697 742 887 910 842 1,147 1,459 1,635
Cotton 467 578 320 142 125 564 73 168 30 109 177 66 94 234 302
Raw Cotton 412 518 271 80 62 507 31 126 2 73 138 25 49 48 111
Cotton Waste 56 60 49 62 63 57 42 42 28 36 39 42 45 187 193
All Cotton 3,741 4,246 4,066 3,933 4,771 5,572 5,095 5,057 4,590 5,220 5,402 5,470 6,761 7,806 8,402
Total Export(Pakistan)
6,133 6,904 6,814 6,803 8,137 8,770 8,320 8,628 7,779 8,569 9,225 9,124 11,160
12,313
14,391
Ratios.%
All Cotton Total Export Pakistan
61.0 61.2 59.7 57.8 58.6 64.0 61.2 58.6 59.0 60.9 58.6 60.0 60.6 63.4 58.4
Cotton/All Cotton 12.5 13.7 7.9 3.6 2.6 10.1 1.4 3.3 0.7 2.1 3.3 1.2 1.4 3.0 3.6
Cotton Manufacturers/All Cotton
87.5 86.3 92.1 96.4 97.4 89.9 98.6 96.7 99.3 97.9 96.7 98.8 98.6 97.0 96.4
Cotton Yarn 31.6 27.7 27.6 32.0 32.0 27.6 27.7 22.9 20.6 20.5 19.9 17.2 13.7 14.4 12.6
Cotton Cloth 18.1 19.4 21.2 20.9 22.7 22.9 24.8 24.7 24.3 21.0 19.2 20.7 19.9 21.9 22.2
Tents & Canvas 2.1 1.2 1.0 0.7 0.8 0.7 0.7 1.1 0.9 1.0 0.9 0.9 1.1 1.0 0.8
Cotton Bags 0.1 0.8 0.6 0.4 0.4 0.4 0.5 0.5 0.5 0.4 0.4 0.3 0.3
Towels 3.5 3.2 3.4 3.3 3.0 3.1 3.8 4.0 3.9 3.7 4.5 4.9 5.5 5.2 6.2
Bed Wear 6.6 6.7 8.6 7.3 7.1 7.6 9.0 10.1 13.3 13.6 13.6 16.8 19.7 17.7 17.3
Other Madcup 2.9 2.7 3.1 3.3 3.4 3.2 4.1 4.9 5.6 5.9 6.1 6.4 5.3 5.4 5.0
Garments 13.3 14.5 15.2 15.6 13.5 11.6 14.5 14.8 14.2 14.8 15.3 16.1 16.2 12.7 12.9
Hosiery 8.9 10.1 11.4 12.9 14.4 12.6 13.5 13.8 16.2 17.0 16.9 15.4 17.0 18.7 19.5
Source: Textile Commission’s Organization
5.3 Global Cotton Market
Trends in Production and Consumption
Cotton is the most useful textile fiber in the world and its market share is 56
percent in all the fibers used for apparel both home and industrial furnishing (Textile
Vision 2005). The global cotton production was 26 and 25 million metric tons in 2004-
05 and 2005-06. (APTMA) or 116.3 million bales in 2006 and 113.31 million bales in
2005-06 (Pakistan Economic Survey, 2006)

112
Global cotton consumption was 23 and 24 million metric tons in 2004-05 and
2005-06 respectively (APTMA). The global production is in harmony with consumption.
The export trend shows that the largest producers are also the largest consumer of cotton
and also importer of cotton.
Major Sources of Cotton Production
There are 75 cotton producing countries in the world but the top five countries
(China, 6324, 5770 MT, USA, 5062, 5201 MT, India, 4121, 4148 MT Pakistan 2482,
2089 in 2004-05 and 2005-06 respectively) produce more than 70 percent of the total
cotton. Pakistan is the 4th largest producer with 12 percent share in the world (Vision
2005).
Figure 15: Share of Cotton Production
Source: SMEDA
Global Cotton Trade
Cotton is a major component of international trade. Total exports in 2004-05
were 7738 million metric tons and in 2005-06 were 9609 million metric tons
respectively. The global imports were 2754 and 4536 million metric tons in 2004-5 and
2005-06 respectively.
International cotton price are highly inconsistent. COTLOOK A and B Indices
and U.S. price all these indicators generally move in the same direction. These indices
are shown in the following Figure to show the trends in international cotton prices,
(Salam, 2007).
India20%
Others 3%
China 28%
USA 29%
Uzbekistan8%
Pakistan12%

113
Figure 16: Nominal Cotton Price: Cotlook a and b Indices and U.S Price
Source: Cotton and Wool Situation and Outlook Yearbook, Economic Research Service, USDA number
converted from 480-lb bale to metric tons
5.4 Analyzing Opportunities for Pakistan Cotton-Textile and Apparel Sector
5.4.1 Revealed Comparative Advantage
The concept of revealed comparative advantage has been explained in model-I (Chapter
3).
The ratio is defined as:
Here export of cotton and cotton manufacturing for Pakistan (Xih) is $13.46 billion and
total export of Pakistan (Xit) during the same period was remained at $22.43 billions.
Similarly total world export of cotton and cotton manufacturing (Xwh) was nearly $388
billion during 2005-06 and world totals export (Xwt) was remained at $ 11926 billions
during the same period.
Putting values in the above model (Rih = (13.46/22.43)/ (388.3/11926) = 18
Rih = 18 which is very high than unity. This value reveals that Pakistan has great
opportunities in the export of cotton and cotton manufacturing.

114
5.4.2 Itemized Trade Performance of Cotton and Cotton Manufacturing
The itemized cotton trade performance was also calculated through Balasa or
RCA index as given in table 17.
Table 17: Itemized Trade Performance of Cotton and Cotton Manufacturing (2006) Item Export
(000 US$) Share (country
total export) Share in
world export Balasa/RCA
Index Lafay Index
Cotton 3,601,009 21.26 7.23 51.2 33.0 Textile articles, sets, worn clothing
3,242,514 19.15 8.97 63.5 32.0
Articles of apparel, accessories, knit
1,902,212 11.24 1.31 9.2 19.0
Articles of apparel, accessories, not knit
1,348,321 7.96 0.85 6.0 13.0
The balasa and Lafay index for all cotton and cotton products is very high which reveal
that Pakistan has trade competitiveness in the cotton and cotton manufacturing.
5.4.3 Relative Comparative Advantage
An improved version of revealed comparative advantage is the Relative Revealed
Comparative Trade Advantage (RTA) index, which reflects both imports and exports, as
shown in Model –II in Chapter 3 and is reproduced as:
X (M) refer to exports (imports), with the subscripts i and k denoting the product
categories, while j and 1 denote the country categories. The numerator is equal to a
country’s export (imports) of a specific product category relative to the export (import)
of this product from all other countries. The denominator reveals the exports (imports) of
all products but the considered commodity from the respective country as a percentage of
all other countries’ exports (imports) of all other products. The level of these indicators
shows the degree of revealed export competitiveness and import penetration. Values

115
below (above) zero point to a competitive trade disadvantage (advantage). The RTA
considers both export and import activities and this seems to be an advantage from the
viewpoint of trade theory. The ratio reflects the market share for specific product here
cotton (Table 18).
Table 18: Competitive advantage of Cotton Products based on the RTA Index Product RXA RMP RTA = (RXA-RMP)
Cotton seed 0.552 0.297 0.255 Oil of cotton seed 4.277 13.686 -9.459
Cake of cotton seed 0 0.010 -0.010 Cotton lint 0.0613 0.031429 0.030
Cotton linter 1.100 0.00 1.100 Values below (above) zero point to a competitive trade disadvantage (advantage). Thus,
the Pakistan cotton chain is internationally competitive. The primary products, cotton
seed, cake of cotton seed and cotton linter, are highly competitive, while oil of cotton
seed and cake of cotton seed are uncompetitive.
5.4.4 Trade Complementarities
Trade complementarities as given in Model-III of chapter 3 measures the compatibility
of imports of country i with exports of country j , as defined below.
The value of Cij can easily be calculated for different countries/blocs. For example using
this value can be calculated for USA, EU, Japan, Canada etc. as in table 19.
Table 19: Trade complementarities
Country/Region
Share of import of cotton & cotton manufacturing
Share of export of cotton & cotton manufacturing
Cij = 1-(Σ | Mhi – Xhj |) ÷ 2
USA 7 12 2.0 EU25 9 16 4.5 Canada 8 10 2.0 UAE 3 5 2.0 SAARC 4 3 0.5 Japan 6 4 2.0

116
The above values for all trading countries are greater than unity except SAARC
countries. This means that trading with SAARC countries in cotton and cotton products
is less profitable as compared to other countries where cotton trading is highly profitable.
5.5 Pakistan Cotton-Textile and Apparel Sector- The Value Chain
Cotton and cotton based products and textile is a very significant part of
Pakistan’s agriculture and industrial sector. The industry faced the major competitive
challenges after phasing out the MFA quota regime. To appreciate the challenges ahead,
it is important to understand “economics and political economy of the entire value
chain”, from growing raw cotton, ginning into lint, spinning into yarn, weaving into
fabric, production of cotton made up, non- apparel, and apparel production and
marketing, (Altaf, 2007)
5.5.1 Pakistan Cotton Situation
Pakistan is one of the largest producer and consumer of cotton in the world. It
contributes 8.6 percent of the value added in agriculture and around 1.8 percent to GDP.
Cotton is the principal cash crop of Pakistan, second to wheat, the country’s staple
food. According to Salam (2007) increased cotton production in the recent past has
helped in curtailing imports of edible oils as cotton seed is a valuable source of
vegetable oil for the domestic industry, and provides feed for livestock and dairy
farming. He further highlights the significance of cotton by stating that cotton picking,
a highly labor intensive activity is an important source of employment and income
generation for rural women folk.
Due to its forward and backward linkages, cotton crop not only holds a unique
position in the rural economy of Pakistan but also its performance is crucial for the
growth and development of agriculture sector and overall economy. “A good cotton
crop is imperative for the sustainable development of agriculture, food security and
success of poverty alleviation efforts at the micro and macro levels”, he further
emphasized

117
Production
The Cotton crop “the source of silver fiber”, was sown on the area of 3075
thousand hectares in 2006-07, 0.9 percent less than last year (3103 thousand
hectares). The production of cotton is provisionally estimated at 13.0 million bales
for 2006-07, lower by 0.1 percent over the last year’s production of 13.019 million
bales. Lower production was primarily due to decline in area sown in Sindh due
to excessive rains and floods. The crop yield in some areas was also affected by the
cotton leaf curl virus and late wheat harvesting. There are two major cotton producing
provinces in Pakistan, namely Sindh and the Punjab. The province of Punjab accounts
for around 80 percent of total cotton producing area and production as well. The Sindh
province produces only 20 percent. (Economic Survey, 2006-07).
The challenges and opportunities for cotton–textile value chain in the wake of
increased international trade and globalization are immense. The capacity of the
industry to face these challenges and get hold of the opportunities is largely depends on
it competitiveness. How to develop that competitiveness largely depends on looking
deep into the issues that have persistently retarded the growth of the sector.
Issues in Cotton
Cotton crop is highly vulnerable to pest and plant diseases during various
growing stages of its life cycle. According to Salam, cotton production and farming in
Pakistan is a high – risk proposition as it involves huge expenditures on pest control and
moreover substantial economic losses takes place due to pest.
The cotton yield and production is marked by fluctuations due to many factors
such as uncertain weather and climatic conditions, the hall mark of agriculture
production activities. Moreover, the domestic prices also get affected by variations in the
international market prices as happen in other commodity trading.
Altaf (2007) gives some historical perspective on Raw Cotton Policy that helps in
understanding the present issues and challenges faced by the industry. Cotton trade was
in the private sector till 1974. After the nationalization of industry by the Government of
Pakistan People’s Party, Cotton Export Corporation (CEC) was established and the free
market operations came to a halt. The function of CEC was at two levels; 1) purchase of

118
cotton from the farmers and 2) export to international markets at government regulated
prices. In 1970s to provide low cost inputs to domestic spinning industry, an export tax
of 30 to 35 percent was imposed. Resultantly, quality of ginned cotton suffered and
farmers did not get the due prices.
After denationalization, Minimum Export Price (MEP) was introduced on the
exports to check the under invoicing. Meanwhile, Karachi Cotton Exchange (KCA)
started buying directly from the ginners. The procedures became bureaucratic, and
malpractices took its roots. In the end the farmer suffered and the local market went into
isolation.
The “favorable” policies made domestic industry inefficient and complacent. The
imbalances in the supply and demand situation came up and forced the trader to carry
over the stock. In 1993-94, the country imported cotton as production fell due to curl leaf
cotton virus, (Salam, 2007).
Historically yarn spinning industry has been the “favored investment area”. Yarn
of low quality was exported. Spinning industry had no desire to improve as the selected
private sector players were favored by the government policies tools. Though the
domestic price policies were not very favorable for cotton, yet production went up. In
1994-97 the export duty on cotton was removed and there was a free flow of trade with
international prices. Since 2000, efforts are under way to improve the quality of cotton.
Pakistan Cotton Standards Institute (PCSI) was set up for standardization, however, the
powerful lobby with self interest again played their tactics, and bidding for raw cotton
through e-commerce was stopped. When PCSI tried to develop a training institute for
cotton ginning sector, the powerful players jumped in. All this made the farmers suffer.
A certain powerful lobby kept enjoying the gains at the cost of the farmer, and the sector
at large.
The government became a buyer in cotton trade through Trading Corporation of
Pakistan (TCP). The cotton support price was in operations with the make belief that it
would enhance productivity, create exportable surplus and preserve the interest of the
farmer, however, it did little for the farmers. The cotton market in Pakistan has
experienced fluctuations due to political economy of the markets and the players both in
public and private sector. All this was done at the expense of the sector and the farmer.

119
5.5.2 Ginning Sector
Ginning industry was concentrated in a few hands in 1986-87, and was regulated
by the cotton acts of Punjab and Sindh. Though some 800 units are actually working,
the number of ginning units installed exceeds 1220. Ginning is a seasonal operation and
a ginning factory that processes more than 10,000 bales is a large unit, while the average
factory processes 5,000 bales in a season. However, the maximum bales produced in one
season were 14 million bales in 2005, and capacity with full utilization of three shifts per
day is over 36 million bales.
Issues in Ginning
The cottonseed transportation and storage is done at a minimal cost and there
are no established procedures or standards for storage. The cottonseed is kept in the open
where it gathers dust, dirt and trash while waiting to be processed. Weather also takes
its toil. The cost to industry due to contaminated cotton is very high.
Table 20: Number of Ginning Factories and Machines
Location Number of factories
Punjab Sindh Total
1,075
146
1,221
Machine Type
Number of Installed Machines
Capacity per Machine (bales per 8-hour shift)
Total capacity (bales per day per shift)
80 saws 90 saws 100 saws Total
229
3,500
132
5,488
12.5
18.5
31
2,863
59,235
4,092
Source: Pakistan Cotton Ginners’ Association

120
Table 21: Industry Losses due to Cotton Contamination, 2004-05
Product/Category Value ($)
Cotton Yarn
Cotton fabrics
Ready made garments
Knit wear
Bed wear
Towels
Other textile products
Total
55,370
104,604
61,425
99,786
321,185
586,999
1069,394
2,298,763
Source: Textile Commission’s Organization
The sector is suffering from lack of technology. Generally the local craftsmen are
running the factories. The technology in all the machines needs improvement as the old
technology affects the quality of output. The sector also lacks overall standardization
from cleaning process to storage facilities. Another basic issue for the ginning sector is
shortage of working capital.
5.5.3 Spinning Sector
Next step in the chain is spinning of yarn. Over the years the number of units
increased from 70 in the late 1950s to 503 in 1995-96.
The growth of the spinning industry has been steady. The number of spindles
increased from 1.5 million in the 1950s to 10.5 million in 2004-05. The economies of
scale that was 12,500 spindles per unit increased to 18,000 per unit by 1998. Similar
trend followed in the rotor sector. From 16 thousand rotors in 1979-80, the number
increased up to 155 thousand in 2004-05.

121
Table 22: Installed and Working Capacity in the Spinning Sector, all Pakistan
Installed Capacity (000) Working Capacity (000) Capacity Utilization (%)
Year Units Spindles Rotors Spindles Rotors Spindles Rotors 1958-59 1979-80 1989-90 1990-91 1991-92 1992-93 1993-94 1994-95 1995-96 1996-97 1997-98 1998-99 1999-00 2000-01 2001-02 2002-03 2003-04 2004-05
70 187 266 277 307 334 471 494 503 440 442 442 443 444 450 453 456 458
1,581 3,781 5,271 5,568 6,216 6,860 8,419 8,610 8,717 8,230 8,368 8,392 8,477 8,601 9,060 9,260 9,592
10,485
01672758195
138132143143150166150146141148146155
1,4882,7014,4894,8275,3335,5206,2056,2626,5486,5386,6316,6716,8256,9137,7407,6768,0098,492
0 14 64 67 67 79 84 74 80 87 80 66 66 70 66 70 66 79
0.90 /a/ 0.74 /b/
087 0.87 0.86 0.80 0.73 0.73 0.75 0.79 0.79 0.79 0.81 0.80 0.82 0.83 0.83
0.590.830.890.890.830.830.610.560.560.610.530.400.440.480.470.470.45
Source: Textile Commission’s Organization /a/ average capacity utilization for period 1958-79 (spindles and rotors) /b/ average capacity utilization for period 1980-90 (spindles and rotors) Issues in Spinning
There are gaps between installed and working capacity. The capacity utilization
in 1990 in the spindle and rotor sectors was 80 percent. However, in1990s, the capacity
utilization dropped, the reason was a steady increase in the number of spindles and
rotors despite a bad cotton crop in 1993 and 1994. Though the installed capacity
increased in 1997-99, the working capacity of the rotors declined.
Figure 17: Capacity Utilization in Spinning Sector
Source: Cotton Report APTMA

122
5.5.4 The Textile Sector
The textile industry in Pakistan is based on cotton fibers; however it started using
man-made fibers in the 1980s. From an average share of 8.7 percent to total fiber
consumption in the 1980s, it went up to 22 percent in 1998-99, and in 2004-05, it was
19 percent. The local production of man-made fibers has resulted in higher
production of yarn blended with man-made fibers.
The important categories of man-made fibers are Polyester/Cotton (PC) and
Polyester/Viscose (PV). There are five domestic man-made fibers manufacturing units
but they are relatively uncompetitive to world standards. The spinners are in difficulties
with these manufacturers as the cost of local yarn for local mills is extremely high.
The commercial banks also do not extend credit facilities. Weavers take advantage of the
situation. Moreover, the blended yarn manufacturers pay a duty of 6.5 percent on
import of raw material. Modernization of the textile industry requires increased use of
man-made fibers in yarn production.
In the 1970s, half of total yarn production came from the Punjab province. The
trend still persists and now more than 70 percent of yarn production comes for the Punjab.
The share of total yarn production from Sindh has declined from 43 percent in the 1970s
to around 20 percent. This was the result of the relocation of installed capacity to the
Punjab province. The other provinces produce less than 10 percent of yarn. The yarn
industry in the Baluchistan province is closed since 1983.
The production of yarn in Pakistan (cotton and man-made) has increased at an
average annual rate of 4.7 percent since 1990-05. The share of exports of yarn increased
from 29 percent in the 1970s to 47.5 percent in 1991-92. The share of exports of yarn
declined to 26.5 percent in 2004-05. The major international markets for Pakistan cotton
yarn include Hong Kong, China, United States, and South Korea. Pakistan is a major
producer of cotton yarn and its share in the world production has increased from 7.2
percent in 1994 to 9.1 percent in 2004. This is lower than India (9.7 percent) and greater
than US (5.8 percent). Mainland China has a share of 46.8 percent.

123
5.5.5 Issues in Yarn Production
The spinning industry of Pakistan produces low counts yarn (22 counts), and
low value yarn. There is higher profitability in production of higher counts, but the
entrepreneurs are not willing to take any risk.
There are a number of reasons for this behavior. According to Altaf (2007), the
industry has been historically operating in a protected market. Pricing of raw cotton
favored the domestic processing industries until the early 1990s. He mentions…the
most basic reason, seems to be the creation of entrepreneurs by government fiat and
these were people who were not risk takers. Altaf (1983) provides ample evidence to that
affect. He argues that for key industries like textile, cement, sugar, edible oil, and flour
mills, granting permission to operate was the responsibility of the President/Prime
Minister. According to him the issuance of textile permissions was used as
political bribes.
The spinning sector has always been receiving more support from the
government than the weaving industry. A large number of non-performing spindles
points towards the various “soft packages” given by government to the sector. The
MFA quota regime also added to non-competitiveness of Pakistan’s spinning industry.
Altaf (2007) puts forward an other reason for inefficacy of the sector; availability
of a “captive market” in shape of former East Pakistan, now Bangladesh, where all kinds
of poor quality yarn were exported by the West Pakistan exporter.
5.5.6 Production of Cloth and Fabric
Pakistan faces sharp international competition in this segment of the value chain
that processes yarn into value-added products of cloth/fabrics and textile “made-ups”
such as towels, bed wear, and linen.
The average annual growth in production of cloth in Pakistan from 1990 to 2005
is 5.6 percent. Only 10 percent of production comes from mills, and the rest 90 percent
comes from non-mills. About two-thirds of output goes to the domestic market, and the
rest goes to the world market.

124
There were 25 thousand looms available in 187 textile units in the country in
1979-81, which further declined to 15 thousand after ten years and further went down to
9 thousand in 2004-05. The reason of small production share coming from mills can
be thus due to the declining number of looms in the integrated textile mills, more over,
out of the installed capacity, only about 50 percent is operative. About 50 percent of
capacity is in Punjab, and about 60 percent of cloth produced comes from Punjab. Out of
the rest, 45 percent capacity is in Sindh and the rest in other provinces. Production of
cloth type includes more than 50 percent grey cloth, and blended cloth accounts for
more than 10 percent, whereas the share of dyed and printed cloth, in 2004-05 was 31.7
percent.
Table 23: Quality of Cloth Production, Mill Sector (% distribution)
Quality 1997-98 1998-99 1999-00 2000-01 2001-02 Fine Grey Bleached Dyed & Printed Medium Grey Bleached Dyed & Printed Coarse Grey Bleached Dyed & Printed Total
42.3 36.5 1.8 4.0 26.0 10.8 2.1 13.1 31.7 27.3 0.6 3.8
100.0
30.0 18.2 4.8 7.0 41.0 21.0 2.1 17.8 29.1 22.8 0.9 5.4
100.0
19.9 17.4 0.6 2.0 56.4 33.1 2.5 20.8 23.7 18.3 0.3 5.0
100.0
20.7 18.4 0.3 2.1 57.2 31.8 3.3 22.1 22.0 14.1 0.9 7.1
100.0
24.6 22.5 0.2 1.9 54.4 27.1 3.0 24.3 21.0 14.6 0.7 5.7
100.0
Source: Costistics The share of fine quality cloth has gradually declined from 42.3 percent in
1997-98 to 24.6 percent in 2001-02. The bulk of the cloth is in grey form. Altaf (2007)
attributes the high share of fine cloth in 1997-98 to policy initiatives by the government
and the elimination of export subsidies and the benchmark price system.
In the form of grey, dyed and printed cloth, the share of medium quality increased
from 26 percent to 54.4 percent over the same period. However, the share of coarse
quality cloth decreased gradually from 31.7 to 21 percent.
The weaving industry has concentrated on the unprocessed cloth. It also lacks
marketing abilities to go for more specialized products. The weaving mills have very
125
basic marketing wings. Despite massive investment at subsidized rates, there is no quality
improvement.
Pakistan’s exports of fabric reflect its production pattern also. One-fifth of
fabric/cloth exports go to the U.S. market. Unbleached fabric accounts for about 40
percent of the exports which is of 22 percent of the world trade. Bleached fabric
accounts for about 15 percent of Pakistan’s exports.
Highly processed printed fabrics accounts for 29 percent of Pakistan’s exports,
which is around 15 percent of the total global market. The printed fabric suffers from
quality due to low-category technology, and many other defects. The dyed fabric
accounts for 14 percent of Pakistan’s exports. Total exports are around $195 million
out of total world market of $4.14 billion. Denim and calendared fabric as a quality driven
area faces competition from the United States, Italy and Hong Kong. The fabric
industry faces the challenge of producing a wider range of products and product mix
as well.
The Pakistan textile sector is heavily dependent on cotton fiber. The
international cotton market has been volatile and has more demand for blended fiber.
Pakistan produces fewer blends compared to its competitors. To tackle the challenges of
international trade, Pakistan has to over come these deficiencies along with weaknesses
in human resource.
5.5.7 Textile Made-Ups
The international market for textile made-ups has expanded by 11.7 percent.
The total world export of textile made-ups in 2005 was $30.2 billion. Major exporters
are China, Pakistan, India, Turkey and Portugal. Textile made-ups have following
major categories:
• Towels and cleaning clothes
• Bed wear and linen; blankets
• Curtains and furnishings
• Canvas products and table linen.

126
China export earnings from textile made-ups registered an increase of 178 in 2005 and
its share increased from 21.2 percent in 2001 to 33.9 percent in 2005. Pakistan’s
exports of these items grew by 107 percent, and its share went up from 8.6 percent in
2001 to 10.1 percent in 2005.
Table 24: Exports of Textile Made-Ups
Billion dollar % of World
2001 2002 2003 2004 2005 2001 2002 2003 2004 2005
World
China
Pakistan
India
Turkey
Portugal
17.4
3.7
1.5
1.1
1.0
0.8
19.1
4.4
1.8
1.3
1.2
0.8
23.5
6.1
2.3
1.6
1.6
0.8
26.4
7.7
2.3
1.8
1.8
0.8
30.2
10.3
3.1
2.4
2.0
0.8
21.2
8.6
6.3
6.0
4.5
22.9
9.2
6.6
6.5
4.1
26.2
10.0
6.8
6.9
3.5
29.3
8.9
6.8
7.0
3.2
33.9
10.1
7.9
6.5
2.5Source: International Trade Statistics (http://www.intracen.org/tradstat/site3-3d/indexpe.htm) 5.5.8 Towels and Cleaning Cloths
Pakistan stands at number second among towel exporters, and its share in the
world market increased from 7.1 percent in 2001 to 9.8 percent in 2006. Unlike other
textiles, the Pakistan towel industry is comprised of the organized sector. There are
about 325 units, and out of which 250 units are in the organized sector. Local and
imported technology is in use and there are around 9,000 locally manufactured
looms, and 250 imported auto looms. About 90 percent of production comes from
local looms and only 10 percent from the imported looms. Local looms produce 1000
kgs of towels per month, and the imported looms can produce 3500 kgs. This segment
has been able to produce quantity along with quality. Cotton towels and wash clothes are
the major export items and the United States is the major destination, accounting for
almost 50 percent of Pakistan’s export receipts.
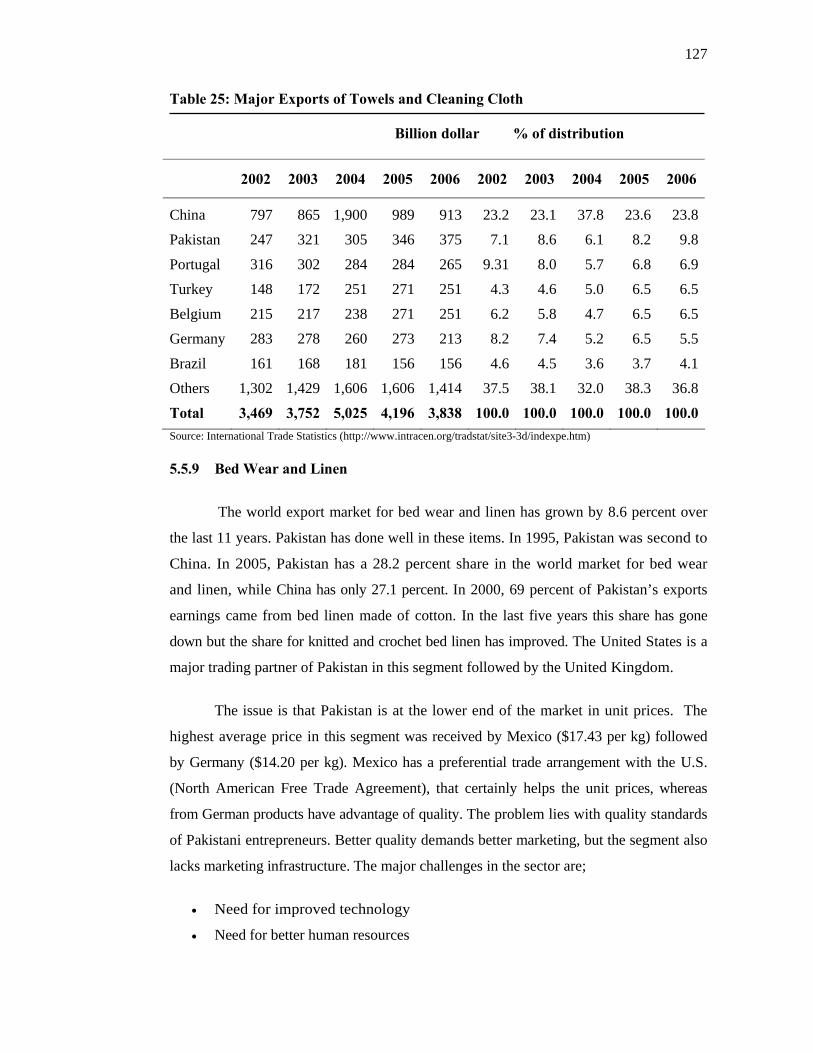
127
Table 25: Major Exports of Towels and Cleaning Cloth Billion dollar % of distribution
2002 2003 2004 2005 2006 2002 2003 2004 2005 2006
China
Pakistan
Portugal
Turkey
Belgium
Germany
Brazil
Others
Total
797
247
316
148
215
283
161
1,302
3,469
865
321
302
172
217
278
168
1,429
3,752
1,900
305
284
251
238
260
181
1,606
5,025
989
346
284
271
271
273
156
1,606
4,196
913
375
265
251
251
213
156
1,414
3,838
23.2
7.1
9.31
4.3
6.2
8.2
4.6
37.5
100.0
23.1
8.6
8.0
4.6
5.8
7.4
4.5
38.1
100.0
37.8
6.1
5.7
5.0
4.7
5.2
3.6
32.0
100.0
23.6
8.2
6.8
6.5
6.5
6.5
3.7
38.3
100.0
23.8
9.8
6.9
6.5
6.5
5.5
4.1
36.8
100.0Source: International Trade Statistics (http://www.intracen.org/tradstat/site3-3d/indexpe.htm)
5.5.9 Bed Wear and Linen
The world export market for bed wear and linen has grown by 8.6 percent over
the last 11 years. Pakistan has done well in these items. In 1995, Pakistan was second to
China. In 2005, Pakistan has a 28.2 percent share in the world market for bed wear
and linen, while China has only 27.1 percent. In 2000, 69 percent of Pakistan’s exports
earnings came from bed linen made of cotton. In the last five years this share has gone
down but the share for knitted and crochet bed linen has improved. The United States is a
major trading partner of Pakistan in this segment followed by the United Kingdom.
The issue is that Pakistan is at the lower end of the market in unit prices. The
highest average price in this segment was received by Mexico ($17.43 per kg) followed
by Germany ($14.20 per kg). Mexico has a preferential trade arrangement with the U.S.
(North American Free Trade Agreement), that certainly helps the unit prices, whereas
from German products have advantage of quality. The problem lies with quality standards
of Pakistani entrepreneurs. Better quality demands better marketing, but the segment also
lacks marketing infrastructure. The major challenges in the sector are;
• Need for improved technology
• Need for better human resources

128
• Need to have improved design and development
• Better standards and quality
• Better reputation in the international market
Table 26: Composition of Pakistan’s Exports of Bed Wear
Type 2000 2001 2002 2003 2004 2005
Million dollar Bed Linen, Knit, crochet Bed linen, Cotton Bed linen, other Textiles Total
4
515
225 745
7
581
243 831
28 808
208
1,044
109 1,044
226
1,380
179 874
235
1,288
203 1,116
607
1,926
% distribution Bed Linen, Knit, crochet Bed linen, Cotton Bed linen, other Textiles Total
0.6 69.1
30.3 100.0
0.8 69.9
29.3 100.0
2.7 77.4
19.9 100.0
7.9 75.7
16.4 100.0
13.9 67.9
18.2 100.0
10.5 58.0
31.5 100.0
Source: International Trade Statistics (http://www.intracen.org/tradstat/site3-3d/indexpe.htm) Table 27: Major Country Destination of Exports of Bed Wear from Pakistan Countries 2003-04 2004-05 United States United Kingdom Germany United Arab Emirates France Netherlands Belgium Spain Italy Canada Others Total
31.0 15.3 6.8 6.9 6.3 5.1 2.7 2.6 2.1 1.5 19.6 100.0
41.1 10.6 6.9 6.2 5.6 4.8 3.4 3.0 2.1 2.0 14.4 100.0
Source: Export Promotion Bureau

129
5.5.10 Apparels
In the entire chain, the apparel/clothing segment is the highest in value. After the
liberalization, reform and abolishing of quotas, the growth and demand has gone up.
The world trading patterns are in favor of Asian countries. The rate of growth and
quality in the developing countries is increasing faster than in the developed world.
Intra-regional trade is also on the increasing side. The developed world has imposed
non-tariff barriers such as child labor, the environmental and other social issues in order
to restrict the developing countries. Success in this competitive market largely
depends on the suppliers’ ability to meet the demand and to offer quality at a
competitive price, and have a unique product to sell for premium price.
The market increased at an annual growth rate of 4.1 percent in 1996-04. The
world exports of clothing were $234 billion in 2004. China captured a huge share of 26.5
percent, and its share has grown significantly in the last one decade.
Pakistan’s share is slightly over 1 percent of the world market, and India has a share of
about 3 percent.
Classification of this segment is based on the structure of the fabric used, and
purpose of the use like men’s wear, women’s wear, sportswear, hosiery etc. Pakistan
has recently made a slight shift to clothing from textiles production. Global export
trends are moving towards high street fashion market. Export products are now made of
diverse and quality fabrics and materials. Pakistan is far behind because of its inability to
convert yarns into fabrics and high value garments. The world clothing/apparel trade can
be divided into three categories
• Woven garments
• Knit garments
• Articles of apparel / clothing accessories
In 2001-04, the share of these categories was; woven garments 40 percent, knit
garments 13.4 percent, and articles of apparel/clothing accessories 47.5 percent. About 40
percent of Pakistan export earning of clothing come from the articles of apparel,
clothing and accessories. The U.S. is the major market for Pakistan’s exports.

130
Table 28: Exports of Clothing 2001 2002 2003 2004
World (Million dollars) Men/boys wear woven Women/girls clothing woven Men/boys wear knit/crochet Women/girls wear knit/crochet Articles of apparel, NES Clothing Accessories Articles of apparel and clothing accessories*
196.7 39.1 42.6 10.0 16.6 61.7 12.4 14..2
190.8 35.4 49.5 9.5
15.4 63.9 12.7 14.4
217.4 39.4 44.2 10.9 18.8 72.8 14.3 17.0
233.8 39.8 47.1 11.6 19.7 80.8 16.1 18.7
Pakistan (million dollars) Men/boys wear woven Women/girls clothing woven Men/boys wear knit/crochet Women/girls wear knit/crochet Articles of apparel, NES Clothing Accessories Articles of apparel and clothing accessories*
2.14 0.51 0.14 0.54 0.09 0.27 0.18 0.40
2.23 0.52 0.17 0.51 0.14 0.30 0.27 0.31
2.84 0.60 0.21 0.70 0.22 0.45 0.27 0.39
3.03 0.52 0.19 0.75 0.17 0.69 0.28 0.43
Pakistan as % of World Men/boys wear woven Women/girls clothing woven Men/boys wear knit/crochet Women/girls wear knit/crochet Articles of apparel, NES Clothing Accessories Articles of apparel and clothing accessories*
1.32 0.33 5.43 0.54 0.44 1.48 2.79
1.48 0.44 5.36 0.93 0.47 2.12 2.14
1.52 0.47 6.43 1.14 0.61 1.91 2.33
1.30 0.41 6.45 0.86 0.85 1.75 2.28
Clothing Exports of Pakistan (% distribution) Men/boys wear woven Women/girls clothing woven Men/boys wear knit/crochet Women/girls wear knit/crochet Articles of apparel, NES Clothing Accessories Articles of apparel and clothing accessories*
24.1 6.6 25.3 4.2 12.6 8.6 18.6
23.5 7.8
22.9 6.4
13.6 12.1 13.8
21.1 7.3 24.7 7.6 15.7 9.6 13.9
17.1 6.4
24.7 5.6
22.7 9.3
14.1 Total 100.0 100.0 100.0 100.0
Source: International Trade Statistics (http://www.intracen.org/tradstat/site3-3d/indexpe.htm) *other than textile fabrics; headgear of all materials
Production of apparel industry in 1972-73 was 9.5 million pieces, and it went up
to 685 million pieces in 2000-01. In 2000-01, the total number of units in the sector was
4,500, and out of these 80 percent were cottage industries. Out of 650,000 total
installed sewing machines only 200,000 are industrial, and the rest are domestic
machines or cottage-based small units. The majority of the units are located in Karachi
and Lahore. Other areas include Faisalabad, Gujranwala, Quetta, Sialkot and
Rawalpindi.

131
To improve the production quality, the industry needs to be reorganized as a
semi-formal sector, and the government should also facilitate quality improvements.
The apparel industry comprises knitting, dyeing, printing, finishing, stitching, trims,
accessories, and also packaging processes. The apparel industry is labor intensive and
around 700,000 people works for the sector.
5.6 Cotton Vision 2015
The Ministry of Food, Agriculture & Livestock has prepared a long term Cotton
Vision for sustained growth in cotton sector to meet the future needs of the domestic
textile sector and the international market. For the quality cotton production to match
the spinners’ requirements the Government is facilitating cotton research and
development processes, and provides support to stakeholders, and the farmer
community through a variety of fiscal, technological, administrative and
legislative measures.
To improve the quality and reputation of Pakistan’s cotton and its products in the
world market ambitious targets have been set such as:
• Cotton Production 20.7 Million Bales
• Cotton Yield/hectare 1,060 Kgs
• Mill Consumption of cotton 20.1 Million Bales
• Exportable Cotton Surplus 0.6 Mln Bales
• Improved Yarn Recovery 92%
• Clean/contamination free cotton production (84%), and supply of cleaner,
uniform graded and contamination free cotton for the domestic industry
5.6.1 Textile Vision 2005
Textile Vision 2005 is a long term strategy to prepare a market driven,
innovative, internationally integrated and competitive textile sector ready to take
advantage of the opportunities after the MFA regime.
The vision is to have the “multi dimensional approach” of sectoral analysis of the
textile value chain and sub sectors, inputs, technology, research, human resource,

132
regulation, and institutional support requirements. It also emphasizes on implementation
and monitoring arrangements.
The textile sector had shown impressive growth during the four decades after
independence, though the share of value added products was modest. However,
gradually stagnation and stalemate crept in due to certain changes in the global and
domestic environments. According to Textile Vision 2005, during the 1990s a
combination of different factors adversely affected the industry:
• Removal of export duty on raw cotton
• leaf curl virus attack reducing the supply and hiking the price
• Frequent changes in the political governments, and inconsistency in the Policies
of the Government and Financial Institutions
• Rapid expansion of the installed industry without economies of scales
• Rapidly changing the global market trends and demands and shift towards man
made fibers
A number of textile units closed and defaulted on the bank loans. The State Bank
of Pakistan became strict with regulations and the banks with drew the funding facility
for expansion or BMR. The industry already short of value added products started losing
the competitive advantage mainly due to its inability to keep pace with the technological
advancements and changes around the world.
Textile Vision 2005 further states that the survival of the industry was dependent
upon the quotas and regulatory protections given by the Government. Meanwhile, efforts
were made to address the bottlenecks and problems of the industry with a view to
formulate strategies for its revival. The following steps were taken;
• JICA Study on Textile Sector of Pakistan (July 1992)
• Development of a Market Based Strategy for the Pakistan Textile and Clothing
Industry. (Gherzi Textile Organization 1993)
• Long Term Strategy for Restructuring of Textile Industry in Pakistan, (National
Commission on Textile Industry, 1999)
The basic recommendations for the growth of textiles industry were;
improvement in research and development, up gradation of technology, quality

133
standards, market expansion, human resource development, quality service delivery to
buyers, funding for shuttle-less looms, product diversification, stronger apparel sector,
rationally modified tariff structures, and consistent policies of the government. More
over, the need to formulate a long term and dynamic textile policy was felt.
5.7 Significance of Agriculture Sector for Pakistan
The importance of the agriculture sector can not be over emphasized as it
provides the basic raw material for Cotton, Textile and clothing industry, which
contributes around 70 percent to export earnings. Pakistan is essentially an agrarian and
rural economy. Agriculture provides livelihood to 66 percent of its population that live in
the rural areas, and employs 43.4 percent of the total work force. Its contribution to GDP
is 20.9 percent, second to the services sector. Economic Survey 2006-07 has very rightly
called it a “dominant driving force for growth, poverty reduction and the center of the
national economic policies.”
There have been mixed trends over the last six year in agriculture growth.
Due to unprecedented drought during 2000-01 and 2001-02, agriculture registered
negative growth. From 2002-03 to 2004-05, better availability of irrigation water had a
positive affect on agricultural growth. The performance of agriculture remained weak
during 2005-06 because the major crops did not perform well. In 2006-07, it grew by
5.0 percent.
Forestry, live stock, poultry & fisheries and marine also contribute towards the
over all agriculture economy.
Crop Situation Pakistan has two crop seasons: Kharif and Rabi, and the agriculture outputs are
closely linked to the supply of water. Kharif crops are rice, sugarcane and cotton whereas
the major Rabi crop is wheat.
Rice is a high value cash crop. It accounts for 5.7 percent of the total value added
in agriculture and 1.2 percent to GDP. Provinces of the Punjab and Sindh are famous for
production of rice. Pakistani rice is known for its quality and aroma in the world.

134
The sugar industry has a share in the value added of agriculture. Its contribution to
GDP is 3.5 percent. Wheat is the largest grain crop and the main diet of the Pakistani
people. It accounts for 14.4 percent to the value added in agriculture and 3.0 percent to
GDP. Other major crops are gram, tobacoo, bajra and jawar. The Oilseed crops include
cottonseed, mustard, sunflower and canola seed. Pakistan produces pulses as well.
For food security and export surpluses at competitive prices, Pakistan requires
development of agriculture sector and resources. Due to inefficient farming
practices and low productivity, cost of production of various crops is high, and yield
is limited. Innovation and technology is lacking, and use of out dated machinery
and tools has made the sector inefficient.
Government has taken a number of steps to make the agriculture sector
competitive. It includes; plant protection facilities and schemes, better irrigation
system, agriculture credits for farmers, production and development loans and
initiation of research and development projects.
5.8 Opinion Around the World
The comments of National Textile Association (NTA), America, on Pakistan
Textile Sector in the light of the Trade Policy Review of Pakistan (2008) by the WTO
are;
• Generous SBP (State Bank of Pakistan) concessionary finance to exporters,
especially of textiles and clothing has distorted industrial incentives
• Pakistan has been unable to benefit from the quota abolition due to its high costs,
low labor productivity, and inefficient production processes
• Cotton- textile is Pakistan’s most important industry and it is based on locally
grown and imported cotton, and is concentrated in preliminary processing stages
production of cotton, textiles, clothing, synthetic & manmade fibers
• The Ministry of Textile Industry formulated export goal of US$14.5 billion by
2009 which calls for raising the share of man-made fibers from 18% to 50%.
• Tariffs up to 35% in 2007/08, are the main measures assisting the industry
• Several assistance packages and incentives, such as income tax concessions,
gradual lowering of tariffs on imported textile machinery and parts to encourage

135
investment for balancing, modernization, and rehabilitation, and a number of
various tariff and sales tax concessions and exceptions on raw materials, research
and development fund have been introduced to help the industry
• The Government is considering another major incentives package of over Rs. 29
billion on the recommendations of the National Textile Strategy Committee
• Labor law amendments, 2006 have helped the industry especially fixing of
minimum labor wages on an hourly basis
• Establishment of textile and garment cities, and provision of modern
infrastructure on private-public partnership basis, in Karachi, Lahore, and
Faisalabad, to promote value-added production is a major incentive for the
industry
• Pakistan may gain from new quota-free regime, and textile production expands,
however, the clothing segment may contract as it faces greater overseas
competition
• Unless productivity improves substantially to capture the potential benefits
arising from abolishing quotas, the real income will go down
• The WTO, TPR indicates that Pakistan has not been able to benefit from the
quota abolition so far due to its high cost inputs, low labor productivity, and
inefficient production processes. Productivity enhancement by 60% to match
Chinese levels could result in annual turn over of US$1 billion
Textile Industry at Crossroads, (Dawn, January 01, 2007)
It has been pointed out that “technological developments, changing protectionism
policies in the industrialized markets as well as shifting market structure of the world
textile industry are both, a source of opportunity and threat. However Pakistan’s
response to these changes occurring worldwide seems to be constrained by its own
structural weaknesses”.
The author suggests certain measures to enhance Pakistan’s competitive position
in the international market, which seems to be “caught in the state of arrested
development”,

136
• Creation of level playing fields for all the sub-sectors to stimulate competition
within the industry
• Need to change the mind set of the local “influential entrepreneurs” who are
used to incentives and has become “sluggish and inefficient”
• Enhancement of productivity and efficiency of the labor force is needed
which calls for technical and vocational training
• Close linkages between industry and academia and public research institutes
and industry are needed
• Upgrading of the technological base especially in the garment manufacturing
is badly needed
• Development of specialized capital markets to accommodate the agriculture
and textile related technology fund requirements
• Establishment of the research & development institutes jointly funded by the
industry and the government are important
• Change in management style and separation of the ownership and
management is very crucial for required outputs
Pakistan Textile Industry - Bright Prospects Ahead: Khaleej Times Special Report
Khaleej Times in this special report on Pakistan foresees a bright future for the
textile industry of Pakistan due to rising world demand (around 2.5 per cent) for textiles.
Pakistan textile industry is currently facing several challenges especially the tough
competition from the India, Bangladesh and China. To have bright prospects, it needs to
improve the quality of its products through value addition. Obsolete technology used by
the industry needs upgrading and modernization. There should be emphasis on research
& development and skilled labor force for productivity.
Pakistan: Textile Sector Sets Productivity Targets
Asian Textile Business, (2002) reports that the government has launched a
benchmarking campaign for the textile sector to maximize its productivity, and has
selected eleven spinning mills mostly located in Punjab Province as a first step. The
National Productivity Organization (NPO), an expert agency under the Ministry of
Industries and Production, has stared a benchmarking study of the spinning industry with

137
the help of the Asian Productivity Organization, because this sector has the maximum
potential for output improvement.
To enhance the productivity standards by 5 percent, a budget of Rs 47 million
during 2002-03 has been allocated. The campaign would be extended to weaving and
knitting sector later on.
Promoting Better Environmental Practices in the Textile Processing Sector of
Pakistan
World Wild Life (WWF) and EU- Small Project Facility has launched a few
projects to sensitize cotton-textile industry on Better Environmental Practices and
Cleaner Production Processes (CPP) to equip the sector to meet the challenges of
conforming to international quality standards and to put up with the legislations and
obligations.
Though the textile processing sector is one of the most important industrial
sectors of Pakistan in terms of production, export and labor force employment yet the
industry is not capable enough to meet the international environmental considerations.
The report further mentions the inadequate capacity of the exporters to comply
with certain legislations in the importing countries, therefore, have faced cancellation
of their orders. Through out the world the consumers, businesses and respective
governments have certain preferences for ecologically friendly production and
consumption. Pakistan textile industry and exporter should try to meet these standards
to be competitive internationally.
5.9 Challenges in the Pakistan Cotton, Yarn, Textile and Apparel Sectors
Altaf (2007) articulates the importance of the whole value chain of cotton-yarn-
textile apparel sector for Pakistan’s economic growth and development. He points out
that the emerging trends in international and domestic markets; rising production cost
and ever increasing competition, pose serious threats to the performance and potential of
the industry as a whole.

138
He stresses upon the need of an internationally linked and globally competitive
strategy based upon the evaluation of the strengths and weaknesses, for the sector. Altaf
is an agriculture economist and has close linkages with the agriculture sector and the
farmers. He is a former Pakistan Federal Secretary of the Ministry of Food, Agriculture
and Livestock, so that way he is an “insider” and knows the dynamics of the industry
from field to firm level.
His analysis of the economics and political economy of the entire value chain -
from raw cotton, ginning, spinning, weaving, and production and marketing of cotton
made ups, and apparel is very convincing and thought provoking. He is of the view that
a “collective approach” to the problem is a must as the entire value chain needs
modifications. The intervention by the government should not only be for the “self
interest” of the eminent industrialists rather it should be across the board. Moreover, the
long term and consistent policies of the government are crucial for the sector.
Though the major strength is availability of the raw material – cotton, and it is the
base of the entire industry. The price and marketing of cotton is dependent on character,
staple and grade, therefore quality of cotton is crucial for the producers and processors.
He is also skeptical about the role of powerful players in the price fluctuations of the raw
cotton, which affects the incomes of all concerned, “the entire chain is substantially
affected by the powerful players in the marketing of this commodity leading to either
worsening of poverty or its alleviation.”
The contaminated cotton is a major weakness. Only a limited quantity of
contamination free cotton was available from 1980 to 2007. This situation may
jeopardize the competitive supply and production of raw material if use of contaminated
cotton is not stopped, and cultivation of other varieties of cotton likes GM cotton, is not
encouraged. However, how can the producers have motivation to improve the quality if
the industry is not ready to pay? The strength of cheap labor is also turning into
weakness because of the “myopic view” of the entrepreneurs and lack of skilled
manpower. The humble wages (Rs. 3000 to 4000 monthly) can only demoralize the
worker. Well trained human resource through out the industry is lacking. There is a need
for workforce development.

139
The use of obsolete second hand machinery by the yarn industry has
compromised the quality of processing of textiles and apparel sector. The industry needs
to use man-made fiber (mmf) as man-made staple and filament are in demand
internationally.
Up beat about the achievement of the industry in terms of its rapid growth of yarn
and textile production, he is critical of the industry for not having sufficient
entrepreneurial spirits, and always asking for bailouts from the government. He is of the
view that industry has developed in the protected market environment that goes beyond
not only the MFA quota regime. The policies of 1950s and early 1960s also made the
textile industry “filthy rich”. He also criticizes the benefit seeking role of the All
Pakistan Textiles Mills Association (APTMA) from the successive governments by
“blackmail”, thus compromising the competitive ability of the industry. He analyzed the
financial position of the textile units and lamented;
“If one were to examine the par value of the shares at the moment, the majority
of these shares are well below the par value. How they have been surviving and why
these units have not been liquidated is something of a mystery. One view is that
although these are public limited companies, they are all within the extended family and
the units are not operating. There are no transactions of the shares and therefore these
units will always have spindles and looms that are not operating. This is wasteful and the
investment is not adding to the growth or industrial output of the country. A policy
intervention would be needed to make these units productive.”
5.10 Concessions
Concerns of the Industry are:
• The cost of doing business has gone up due to increase in the minimum wages and
the power tariff and energy costs. It has raised the cost in the spinning
industry alone by Rs. 75 million per annum
• Monopolized buying by selected international brands has reduced the
margins
• Obsolete inventories, window dressing of balance sheets, and anti-dumping
actions by the EU are major problems

140
• Effective and informed industry-specific research to be done by the
government and its various institutes
• Removal of the import duty on textile machinery and spare parts
• Modification of eligibility criteria for SBP’s long term financing and export
• Swapping of the loans from high cost of capital to a lower cost of capital and other
forms of concessions
• Availability of short term loans at reduced rates of interest effective from
October 2006 so that the industry could compete in the international market
• Importation of polyester staple fiber, a banned item under the temporary
scheme
• Eligibility for SBPs LTF-EOP schemes for the outstanding loans of the entire
spinning and weaving industry irrespective of the period to make entire industry
viable
• A Technology Up-gradation Fund (TUF) like India where the industry is allowed
a rebate of 5 percent on the interest rate to encourage capital formation.
5.11 Politics of Concessions and Rebates
Historically the industry has received various forms of support and
concessions. Rs. 25 to Rs. 40 billion under 6 percent R&D rebates to garments and
knitwear during the fiscal year 2006-07 have been paid. More over, fabrics and home
textiles also get 3 percent and 5 percent rebates for R&D, respectively. A total of
nearly Rs. 12 billion have been provided of which 34 percent went to the spinning
industry.
Bank loans are being swapped with long term finance facility for export-oriented
industries and textile exporters enjoy financing at 7 percent. Refinance is also provided
at 7 percent. A senior bank official shares the following information on loans
disbursement and then written off.

141
Table 29: Loans to Textile Sector
Rs. Billion Textile Sector up to 2003 2004 2005 2006
Disbursement Disbursement Disbursement Disbursement
Total
95.36
133.77 45.42 19.84
Textile (million rupees)
Dec, 2007 Loans NPLs %
All Banks & DFIs 587,029 63,078 10.75
All Banks 581,813 62,501 10.74
All Commercial Banks 578,944 59,748 10.32
Altaf (2007) argues…the root cause of all this was the creating of robber barons in
the 1960s. They have become a powerful mafia.
5.12 Opportunities and Future After elimination of trade restrictions in 2005, Pakistan has lost its preferential
status with the E.U and exports are facing a price war in its established markets (U.S.
and E.U). In the home market cheap Chinese and Thai products have gained ground.
Industry has been exporting large quantities at a lower price which has reduced the profit
margins. At the same time China has got 30 percent, India 5 percent and Pakistan 3
percent only in the U.S. market.
In 2007, industry is seeking concessions package with the promise of exports
worth $20 billion and creation of six million new jobs. Industry needs productivity
enhancement to touch $ 20 billion exports. How that would be done, Altaf (2007) argues.
There are over 500 textile units and only 20 percent of the total textile mills are ISO
9000/ 2000 certified. In such a situation where is the quail. The management style needs a
big change. Family affair management should be replaced by managers hired from the
market on the basis of required skills and competencies. Other wise unit value of the textile
units keeps reflecting negativities.

142
Regional trade and preferential agreements also pose a big challenge as the
least developed countries have preferential treatment. Pakistan has bilateral
agreements and FTA with Sri Lanka and China. With China and India there are 48
complimentary products. All three countries could gain from expanded regional trade. A
big challenge and opportunity!
Government needs to devise competitive, uniform and consistent polices to
remain competitive in the international markets. A big challenge for the state and the
policy makers!
Presently industry is managed by the industrialists who are not ready to take
the challenges. The industry needs entrepreneurs who can take the risks and initiatives
and cash the opportunities with ingenuity. Altaf, (2007) is of the view that the strategy
for progress for the Pakistan Cotton-Textile and Apparel industry…must encompass both
private and public dimensions. Private sector should think beyond the installation of latest
machinery and work on production plan and proper marketing and management for
productivity enhancement Public sector should provide road infrastructure, and storage
facilities to reduce transitional cost. An integrated supply chain leads to value added in
production.

143
References
All Pakistan Textile Mills Association, (APTMA): http:// www.aptma.org.pk
Altaf Zafar, Dr, (1983) : Pakistani Entrepreneurs; Their Development,
Characteristics and Attitudes, Croom Helm Ltd, Provident House, Burrell Row,
Beckenham, Kent BR3 1AT, Australia
Altaf Zafar, Dr, (2007): Challenges in the Pakistan Cotton, Yarn, Textile and
Apparel Sectors, Chapter Five: Studies of the Cotton-Textile – Apparel Industries in
Pakistan and India: Cotton Trade Policy and Poverty Study
Asian Textile Business: http://www.allbusiness.com/asia/980338-1.html, Date:
Tuesday, October 1 2002: Retrieved on 2008-04-23
Caesar Cororation and David Orden, (2007), Studies of the Cotton-Textile –
Apparel Industries in Pakistan and India: Cotton Trade Policy and Poverty Study. EW-
P091261-ESW-TF055329, Cambridge, MA 02138
Corbman P. Bernard, (1983): Textiles Fiber to Fabric: McGraw- Hill
International Editions 1983, McGraw- Hill Book Co. Singapore
International Trade Statistics (http://www.intracen.org/tradstat/site3-
3d/indexpe.htm)
National Textile Association (NTA), America, Free Daily Textile News Blog:
http://www.nationaltextile.org
Pakistan Economic Survey, (2006-07), Finance Division, Government of
Pakistan, Islamabad
Pakistan News Service - PakTribune : http://www.paktribune.com; Retrieved on
2007-05-27
Pakistan; Khaleej Times Special Report: Textile Industry - Bright Prospects
Ahead, (Aneela Batool): http://khaleejetimes.com; Retrieved on 2008-03-10

144
Salam Abdul, (2007), (Chapter Three), Studies of the Cotton-Textile – Apparel
Industries in Pakistan and India: Cotton Trade Policy and Poverty Study. EW-P091261-
ESW-TF055329
The Daily Dawn; Textile Industry at Crossroads, (Dr. Bari): Dawn, January, 01,
2007), http://www.dawn.com/2007/01/01: Retrieved on 2008-04-23
World Trade Report, (2006): exploring the links between Subsidies, Trade, and
the WTO. World Trade Organization, Switzerland
World Trade Report, (2007): World Trade Organization, Geneva, Switzerland
WWF: Promoting Better Environmental Practices in the Textile Processing
Sector of Pakistan: http://www.wwfpak.org/toxics_bettertextileprocessing.php: Retrieved
on 2008-04-23

145
CHAPTER 6
TRADE AND INDUSTRIAL REGIME OF PAKISTAN
Robert (1997) classifies international political economy as …the politics of trade,
markets, international bargaining and the role of government and extra governmental
actors in these processes. According to him each actor whether it is a country or
corporation has its respective role and specific policies for interacting in the global
marketplace. Therefore, to understand the interactions amongst parties it is important to
understand each party’s policies and the reasoning behind them. In terms of countries as
global actors, these international policies are rooted in domestic policy. The implication
of this idea is that policies are subjective and national goals, needs and internal
institutions, which emerge as a result of culture, history, and national development
agenda shape international actions.
Adelman (1999) argues that…no area of economics has experienced as many
abrupt changes in leading paradigm during the post World War II era as has economic
development. These changes have had profound implications for the way the role of
government has been viewed.
Welch (1992) says that business and government are partners in creating a
functional, prosperous society. While admiring Mahathir Mohammad, the Prime
Minister of Malaysia for his “clearest articulation of the role of government in business”,
he points out, “When you look at the success of Malaysia…Malaysia is looking more
like Singapore every day- fantastic growth in GDP, no inflation. So the model is
working”.
Pakistan is the seventh most populous country in the world with 160 million
inhabitants that is 2.3 percent of world population. It has national and international
commitments and struggling hard to achieve its development goals. Government of
Pakistan has created an elaborated institutional frame work for trade and its
development.

146
6.1 Institutional Framework for Trade
In Pakistan international and inter-provincial trade and taxation are
responsibilities of the federal government. The Constitution (Article 151 (3) provides for
free trade and commerce nationally. It also prohibits provincial governments from
levying discriminatory taxes or other restrictions on inter or intra-district trade. However,
the Parliament may impose them in the larger "public" interest, as defined by the
authorities to ensure availability of products at "reasonable" prices. Provincial
governments may constitutionally ban or restrict inter-provincial trade with the consent
of the President in the interests of public health, order or morality. Further more, to
protect animals or plants from disease or to prevent or check “serious" shortages of
"essential" commodities, these restrictions can be imposed.
Provincial governments have a role in trade-related functions. Though provincial
trade taxes have never been imposed, inter-provincial movement of wheat and flour is
some times periodically and temporarily restricted especially when there are harvest
variations between provinces essentially to maintain and stabilize local producer prices.
The Economic Coordination Committee of the Cabinet (ECC) is the main
executive arm responsible to make economic policy decisions. It holds regular meetings
to approve economic and trade policy recommendations. It also reviews and evaluates
import / export policies. It also monitors and examines their impact on production and
investment. Under the chairmanship of the Prime Minister, the Federal Cabinet annually
approves general trade policies and initiatives.
The Ministry of Commerce has the mandate to formulate trade policy. To
discharge this responsibility, it looks after multilateral, bilateral, and regional trade
arrangements and trade policy implementation. The Federal Board of Revenue (FBR)
administers and collects customs and domestic federal taxes on imports. The Trade
Development Authority of Pakistan (TDAP), former Export Promotion Bureau, (EPB)
facilitates and assists traders and businessmen in marketing their products and gives
them information on market-access and other WTO related obligations. The Foreign
Trade Institute of Pakistan has been replaced by Trade Competitiveness Institute of
Pakistan. It conducts policy research on trade competitiveness. It endeavours to build
capacity and develop human resource in commerce and trade matters.

147
The Government’s main advisory body on tariffs is the National Tariff
Commission (NTC). It makes recommendations to the Ministry of Commerce, though
otherwise operationally independent. Many other federal ministries and agencies also
have key role and responsibility in trade-related policy formulation, and implementation.
The following table gives a detailed picture.
Table 30: Main Ministries and Agencies Responsible for Trade-Related Issues
Government ministry/agency Key areas of responsibility Ministry of Food, Agriculture and Livestock Agricultural policy, fisheries, forestry, SPS,
quarantine Agricultural Prices Commission Support prices Trading Corporation of Pakistan Support prices, buffer stocks, state trading PASSCO Support prices, buffer stocks
Ministry of Economic Affairs and Statistics External economic assistance, statistics Ministry of Finance and Revenue Finance, revenue (including tariffs and taxes), budgets
Central Board of Revenue Tariffs, taxes, investment incentives Ministry of Information Technology Telecommunications and information technology
Pakistan Telecommunication Authority Telecommunications regulation Pakistan Electronic Media Regulatory Authority Broadcasting, television regulation
Ministry of Communications Road transport Ministry of Petroleum and Natural Resources Petroleum and gas
Oil and Gas Regulatory Authority Oil and gas regulation Ministry of Ports and Shipping Ports and shipping Ministry of Privatization Privatization
Privatization Commission Privatization Ministry of Railways Rail transport Ministry of Textile Industry Textile and jute Ministry of Water and Power Power and electricity
National Electric Power Regulatory Authority Power regulation Ministry of Tourism Tourism Ministry of Commerce Import and export policies, WTO coordination,
SAPTA and other regional agreements, investment incentives
Export Promotion Bureau/Trade Development Authority
Export promotion
National Tariff Commission Tariffs, contingency protection Ministry of Industries, Production and Special Initiativesa
Industrial policy
National Productivity Organization Productivity Ministry of Health SPS, pharmaceuticals Ministry of Planning and Development Planning and development Planning Commission Vision 2030, five-year and annual plans; Poverty
Reduction Strategy Paper (PRSP) Civil Aviation Authority Air transport Monopoly Control Authority Anti-monopoly legislation and policies Public Procurement Regulatory Authority Government procurement Pakistan Standards and Quality Control Authority Standards Pakistan Intellectual Property Organization Intellectual property protection Board of Investment/ Ministry of Investment Investment, including foreign, promotion and
facilitation Export Processing Zones Authority Export processing zones
a, The Ministry of Industries and Production until May 2005.
Source: WTO Secretariat, and Government of Pakistan

148
Main Trade Laws and Regulations
The Ministry of Commerce issues its Trade Policy annually, after approval of the
Federal Cabinet. The time coincides with the federal budget. (June). Laws, regulations,
ordinances and most administrative guidelines and rules are published in the Government
Gazette. Trade-related measures and procedures are contained in laws, ordinances, and
regulations, including statutory regulatory orders (SROs).
Pakistan has an automatic (electronic) and sufficiently advanced post-entry
auditing Customs legislation to facilitate trade. All legislative changes that include
customs and taxation provisions are incorporated at the time of federal budget in the
annual Finance Act, and subsequently it is passed by Parliament.
6.1.2 Trade Regime
In the initial years, the policy makers adopted an import substitution strategy to
develop the industrial base of the country, and tariff and non tariff barriers against
imports were very high. The overvalued rupee was due to policies of anti – export bias.
The tariff loaded policies kept exports meager, in other words, less than half the import
bill in the early 1980s, (UNDP, 2006). In late 1980s, a shift took place when the import
tariffs were rationalized and subsequently, policies of export-led – growth took the front
seat, and exports went up significantly.
World trade has doubled from three trillion dollars to six trillion dollars in the last
ten years of the 20th century. According to UNDP, Sectoral and Contextual Studies on
Trade (2006) though generally, Pakistan did well but its participation has been not been
very impressive rather its share of world export declined from 1990 to 2000. In 2004, it
was only 0.15 %.
Imports also showed a mixed trend. In early 1990s due to extraordinary import of
machinery and wheat, imports went up. Imports fell in 1993-94 and in 1997-98. During
these periods demand management policies were pursued to restore macro-economic
stability. The decline in import bill during 1998-99 was, however, due to an import
“compression policy” after the economic sanctions of 1998 to protect Pakistan’s foreign
exchange.

149
Pakistan’s trade regime is very narrow. Both exports and imports are
concentrated in a few commodities and even direction of imports and destination of
exports are limited. Interestingly five markets (EU, USA, Canada, Japan and OPEC and
few developing countries in Asia) are the export destinations and the same five regions
accounts for the main source of imports.
Figure 18: Pakistan Major Exports 2005-06
Leather , 6.9
Rice, 7
Syenthetic Textile, 1.2
Sports Goods, 2.1
Cotton Manufacturer,
59.4
Others, 23.4
CottonManufacturer
Leather
Rice
SyentheticTextile
Sports Goods
Others
Figure 19: Trade as Percentage of GDP
Source: UNDP
According to a leading newspaper the trade deficit was $ 12 billion in 2005-06.
The huge and growing trade deficit has posed serious concerns for economic managers
of the country. It has also put extreme pressure on the current account deficit which was

150
financed by the sale of utility and industrial units through privatization, FDI and overseas
remittances, (Dawn, 2006).
6.1.3 Trade Policy of Pakistan
Trade Policy is a yearly “road map” of the vision and other initiatives of macro-
economic agenda of the Government. It is a reflection of government’s commitment to
enhance trade activities both in short term and long term. In its composition, the policy
is a continuation of the past initiatives, along with future strategies and implementation
frame work.
Trade is an important part of Pakistan's development and poverty-reduction
strategy. Vision 2030, adopted in May 2005, aims to turn Pakistan into a developed
country by 2030 through rapid and sustainable development, and by giving “freedom of
enterprise and enlarged opportunities”. It also acknowledges the forces of globalization
and information technology and vows to manage these global forces of change.
Overall focus of trade policy has been on reducing protection, and achieving a
more outward looking trade regime. To contribute to policies of export- led growth, it
attempts to obtain better market access, and promote greater integration into the global
economy. Increased economic efficiency and thus international competitiveness are the
center piece of the policy.
The main objectives of the Trade Policy 2005-2006, according to the UNDP
Study (2006) were:-
• Higher Employment
• Poverty Alleviation
• Sustained Economic Development
6.1.4 Trade Policy Reforms
Import Strategy
Import strategy is based on Facilitation, Rationalization, and Deregulation, and its
salient features are:

151
• Liberal policy for imports
• Reduced negative list (only 30 items and that too on the basis of security,
health , moral and religious grounds)
• Except brewery, import of all type of machinery including project relocation
machinery
• Enlarged temporary importable scheme
• For overseas Pakistanis relaxed car rules
• Import of raw material not locally available under temporary import
• Zero rated import of machinery for different sectors of economy such as
mineral, gem and jewelry, horticulture, and pharmaceutical
Export Strategy
Export strategy is pro active and aggressive and based on:
• Export diversification
• Trade facilitation
• Export Competitiveness
• Capacity building of human capital on WTO rules and trade negotiations
• Compliance and Quality Infrastructure
• Export of Services
• Buyers driven FDI
• Identification of new markets
According to Economic Survey, (2006-07) the Ministry of Commerce to boost
exports has initiated a five pillar Rapid Export Growth Strategy (REGS):-
• Improved market access through trade diplomacy and new FTAs and PTAs with
priority countries
• Trade promotion in neglected regions
• Strengthening of trade promotion infrastructure
• Skill development in export – oriented industries
• “Fast track” development of infrastructure to encourage FDI

152
For better production capacity and to meet local and international demand following
was emphasized:-
• Generate export surplus
• Encourage investment by facilitating import of capital goods and raw material
• Expose local industry to foreign competition
• Smooth supply of essential commodities to consumers
6.1.5 Trade Policy 2006-07
The policy has earmarked the following export development initiatives:-
• Research and development support for the textile & footwear sector
• Skill development in textile sector
• Cool chain and cold storage for horticulture products,
• Emphasis on agri-business export and strengthening of SME
• Freight Subsidy Scheme to encourage exports
• Re-Export of imported goods in original and un-process form
• Establishment of Expo Centers, Warehouses, Carpet Cities, cement and
clinker Terminal in Karachi
• Quality Standards Certification assistance
• Facilitation to exhibitors, business delegations, and temporary export
permissions for participation in fairs/exhibitions
• Financing for export oriented projects
The import initiatives include import of:
• Used machinery for construction and petroleum companies
• Ground handling equipment & machinery by industrial users
• Used machinery / parts by industries, mobile clinics & medical
equipments and medical equipment by returning doctors
• Used refrigerated lorries, waste disposal trucks, fire engines,
and security equipment, air guns, pistols, aircraft, chemicals, and
CKD kits
• Pharmaceutical raw material

153
6.1.6 Trade Policy 2007-08: Speech by the Commerce Minister
The Trade Policy for 2007-08 sets a higher export growth rate with an export
target of US $ 19.2. Mr. Humayun Akhtar Khan, Federal Minister for Commerce
appreciated Ministry of Commerce for good performance of the assigned role of
increasing the country’s exports. For the first time in the history of Pakistan the
merchandise exports crossed the US $ 17 billion. The minister attributed this growth to
the good performance of textiles group (6 % increase 2006-07) in the face of challenges.
The hard work of businessmen and the business friendly policies of the government
brought dividends.
A major challenge for export growth momentum is the supply-side low
competitiveness, he mentions. Competitiveness includes a productive workforce,
improved quality, in time delivery of order, and better research and development.
However, Pakistan presently ranks at 91 out of 125 countries, according to the global
competitiveness index. Lack of productive capacity, low investment in new machinery
and technology, higher costs of inputs, and investments in the non-industrial sectors such
as speculative businesses, stocks and real estate is another challenge, he maintains.
Pakistan produces “low end and low quality products”, and to increase exports
both in value and volume, higher value added and sophisticated products for niche
markets are needed. Energy shortages and fragmented industrial structure also pose
threats for export growth.
Challenges for market access are even bigger at international level…the
European Union’s drug related GSP incentives to Pakistan’s textile products ended in
2005. In textiles many competitors have preferential /duty-free / market access being
LDCs, particularly for the EU and US markets. Due to negative travel advisories on
Pakistan large international importers and chains are reluctant to visit Pakistan has
caused diversion of trade to Bangladesh, China and Vietnam from Pakistan to its
competitors in textile.
Pakistan’s international competition in Textile products has been affected by
many factors to name a few; competition from China, India, Vietnam and Bangladesh in
the major markets of the US and the EU; regional preferential arrangements North

154
American Free Trade Area, (NAFTA), Central American Free Trade Area (CAFTA),
U.S. sponsored Qualified Industrial Zones (QIZs) in Jordan and Egypt allowing duty free
access to their products, and also fall in unit prices in the textile sector, the 5.8% average
antidumping duties in the European market on Pakistan bed-linen exports.
The globalisation has set stringent international standards. Moreover, the
consumers and the markets are conscious about international environment, labour, health
and safety standards. Product diversification is important so that demand decline for one
product should not affect the over all export growth. The WTO has transformed world
into an integrated single market and elimination of tariff non-tariff measures has created
lots of opportunities. Minister mentioned following trade policy initiatives taken in the
last four years (2003-4 to 2006-07) to enhance export competitiveness:
Reducing cost of doing business
• Long Term Financing of Export Oriented Projects (LTF-EOP) and relocation
of industries
• Freight Subsidies including inland freight subsidy
• Sales Tax Facilitation and special incentives for Priority Export Sectors
• Research and Development Support for Textile Sector (R&D)
Marketing and business facilitation
• Expo Pakistan and Retail Sale Outlets
• Encouraging Women Entrepreneurs
Sectoral development
• Industrial Clusters
• Facilitating Export of Pharmaceutical Products
Infrastructure development
Special Export Zones, Textile City and Garment Cities
Creation of Pakistan Horticulture Development and Export Board
155
Productivity and quality enhancement
• Garment Skill Development Board
• Contamination Free Cotton
Compliance facilitation
• In-house Effluent Treatment Plants
• Establishment of Combined Effluent Treatment Plants (CETPs)
Trade diplomacy
Regional Conferences of Envoys and Commercial Officers
Regional Agreements
Long term institutional and procedural reforms to boost exports
• Creation of Trade Development Authority (TDAP)
• Revamping of the Trade Bodies Law and framing of Rules and Tariff
Rationalization
• Strengthening Domestic Commerce and Insurance Sector
• Setting up of Trade Competitiveness Institute of Pakistan
• Redefining the role of National Tariff Commission (NTC)
• Facilitating Transit Trade and Logistics
• Transport Logistic and Trade Facilitation Initiatives; National Trade
Corridor Improvement Programme and Trade & Transport Facilitation
Project Pakistan School of Fashion Design • Reconstruction Opportunity Zones (ROZs):
Export measures to enhance competitiveness, productivity & export capacity
• Long Term Financing for Export Oriented Projects and Scheme of Export
Oriented Units (EOUs)
• Equity Fund for Brand Acquisition, and to Encourage SPS Compliance
• Export Credit Risk Management and Insurance Schemes
• Social, Environment & Security Compliance
• Agri-Marketing Integrated Centres (AMIC)
156
Export facilitation and marketing support
• Assistance in Reaching International Standards and Support for Compliance
Certifications
• Assistance for opening exporters’ offices abroad, and Overseas Business
Support Units
• Support for Marketing of Branded Products
• E-Marketing
• SME Facilitation for export diversification
The Trade Policy speech also highlighted the import measures based on the
pillars of liberalisation, deregulation, and facilitation. The import initiatives are proposed
to encourage businessmen and entrepreneurs to have new machinery, add capacity, and
thus improve the competitiveness.
Though Minister appreciated the efforts of the government for improved business
environment with sound trade and fiscal policies to put the economy on solid
foundations, but he says, “Challenges still remain”. The trade deficit is… the result of
macro policy focus on growth, fiscal deficit and debt, which makes exports expensive
and imports cheaper and, therefore, hurts industrial investment and trade
competitiveness. He further states … it is important to have a balance in the macro
policy so that exports could be encouraged and the current account deficit be
reduced. High levels of GDP growth can only be sustained in the long run through high
level of growth in exports.
He is of the view that the issues of exports competitiveness need to be addressed
to have export growth and economic development. Technology up gradation, skilled
manpower, diplomatic efforts for more market access, better utilities and infrastructure
and reduction the cost of doing business are important. He asks business community to
take Pakistan’s exports to a greater altitude while taking advantage of the incentives and
opportunities as this is the only way to come out of poverty and to create prosperity.
6.2 International Trading System and Pakistan
In the International Trading System, Pakistan follows a two pronged trade
strategy and have joined both multilateralism and regionalism clubs because:-

157
• Regional Trade Agreements/ arrangements (RTAs) are exclusive and
discriminatory. They offer deeper and comprehensive trade reforms with
fewer like-minded committed countries with geographical proximity
• Multilateral Trading Arrangements are beneficial as almost every country
in the world gets engaged in a mutual process of trade initiatives
Bilateral and Regional Trade Agreements
Pakistan has initiated market access negotiations with various trading partners
through Free Trade Agreements (FTAs) and Preferential Trade Agreements (PTAs), in a
bid to:
• Seek maximum market share for Pakistani exports
• Ensure level playing fields for Pakistani exporters
Following Free Trade Agreements (FTAs) or Preferential Trade Agreements (PTAs)
have been concluded or in the pipeline:
• Sri Lanka (June 2005)
• SAFTA Agreement (January 2006)
• Early Harvest Program (prelude to FTA) with Malaysia (January 2006)
• PTA with Iran (October 2006)
• China (July 2007)
• D-8 countries (July 2007)
RTAs, FTAs and PTAs negotiations are underway with USA, OIC, GCC, EU,
ASEAN, Jordan, Yemen, Syria, Bahrain, Egypt, MERCOSUR, Mauritius, Thailand,
Brunei, and Japan.
Multilateral Trade Arrangements
Pakistan is an original WTO Member since it came into being (1995). As an
active member of the Organization, Pakistan has been participating in all the
Ministerial Conferences, and other important events. Under the WTO rules,
Pakistan grants MFN treatment to all trading partners. However, a number of import

158
items from India are prohibited / restricted. Recently there has been some progress to
wards trade liberalization with India. Trade with Israel is completely banned.
6.3 WTO and Pakistan
The Ministry of Commerce has a special WTO Wing to deal with WTO matters,
multilateral issues, including agreements and negotiations. The Minister of Commerce
chairs the WTO Council which has federal ministers, federal secretaries and the central
bank governor as members. The Council examines matters relating to WTO Agreements.
It formulates strategies for protecting Pakistan’s interests with in the parameters of its
multilateral obligations. It also ensures inter-ministerial and inter-provincial coordination
and harmony on these vital issues.
The Parliamentary Standing Committees in the Senate and the National
Assembly supervise the Ministry of Commerce in formulating and implementing WTO -
related policies.
6.3.1 Trade Policy Review
Trade Policy Review Body (TPRB) of WTO reviews the trade policies of its
member countries. From 1995 onwards, three such reviews: 1995, 2001-02 and 2007-08
have taken place in case of Pakistan. Comments from the Trade Policy Review (TPR) of
Pakistan are:-
• Pakistan's trade policies are based on the principles of multilateralism and non-
discrimination, and therefore, its involvement in preferential and regional trade
arrangements is limited.
• Pakistan has significantly improved the external transparency of its trade and
investment regime. It has also met its regular GATT/WTO notification requirements.
• The tariff is Pakistan’s main trade policy instrument and is a major source of tax
revenue. The importance of the instrument has increased recently due to elimination
of non-tariff barriers on a number of items, and also falling tax revenues.
• Pakistan has restructured its custom tariff and rate of average applied tariff has fallen
since 2001-02. The simple average MFN tariff rate in 2007-08 is 14.5%, which is

159
below the rate of 2001/02. Pakistan maintains import prohibitions and restrictions as
well.
• The number of tariff lines went up from 6,803 in 2006-07 to 6,909 in 2007-08. These
were 5,477 in 2001-02. The split of existing tariff lines was to meet needs of various
sectors of economy.
• Under the Rules of Origin, Pakistan follows preferential rules of origin under
bilateral, plurilateral trade agreements and unilateral schemes. Providing for product-
specific rules, they incorporate various value addition and change in tariff
classification criteria. Introduction of non-preferential rules of origin in the Import
Policy Order is also on the cards.
• Pakistan has no MFN tariff quotas. However, quotas on imports of certain goods
eligible for tariff exemptions and concessions operate effectively as per tariff quotas.
• Export subsidies are linked to export-performance requirements. They have been
provided in different forms. It includes direct financial support, concessionary export
finance, and tax holidays in export-processing zones.
• Duty drawbacks are given on input-output coefficients. Drawbacks correspond to
duties and other levies actually paid on imported raw materials being used for the
manufacture of export products.
• Several forms of support to production and a number of tax and non-tax incentives
are prevalent. Priority in this regard has been given to science and technology, hi-
tech industries, small and medium-sized enterprises.
• Modest government support has been given to agriculture, livestock, fisheries, and
forestry sector. Despite an agrarian economy, Pakistan is a net food importing
country. Over all production had not been able to keep pace with the ever expanding
food requirements.
• Lastly, government procurement is largely used as a tool to support local industry.

160
Table 31: Pakistan's Tariff Structure: 2001- 02 and 2004 - 08 (Per cent)
Tariff structure 2001/02 2004/05 2005/06 2006/07 2007/08 Final
bounda
1. Bound tariff lines (% of all tariff lines) 36.6 .. 98.4b98.0 98.0 98.0
2. Simple average applied rate 20.4 16.8 14.4 15.0 14.5 61.3
Agricultural products (HS01-24) 21.8 19.0 15.6 15.4 14.9 95.1
Industrial products (HS25-97) 20.2 16.5 14.2 14.9 14.5 56.6
WTO agricultural products 22.1 19.3 15.7 15.3 14.8 96.1
WTO non-agricultural products 20.1 16.5 14.2 15.0 14.5 56.7
Textiles and clothing 26.4 21.7 18.9 19.4 19.3 24.1
3. Tariff quotas (% of all tariff lines) 0.0 0.0 0.0 0.0 0.0 0.0
4. Domestic tariff "peaks" (% of all tariff lines)c 0.9 1.2 1.1 1.0 1.1 0.0
5. International tariff "peaks" (% of all tariff lines)d 57.1 52.0 40.1 41.5 40.0 95.1
6. Overall standard deviation of tariff rates 16.0 11.9 11.0 11.3 11.7 22.3
7. Coefficient of variation of tariff rates 0.8 0.7 0.8 0.8 0.8 0.4
8. Duty free tariff lines (% of all tariff lines) 0.0 0.0 0.0 0.0 5.8 0.0
9. Non-ad valorem tariffs (% of all tariff lines) 0.9 0.6 0.7 0.7 0.6 0.0
10. Non-ad valorem tariffs with no AVEs (% of all tariff lines) 0.9 0.6 0.7 0.7 0.6 0.0
11. Nuisance applied rates (% of all tariff lines)e 0.0 0.0 0.0 0.0 0.0 0.0
Not available.
a Based on 2006/07 tariff schedule. Implementation of the U.R. was reached in 2004. Calculations on bound averages are
based on 6,670 bound tariff lines (representing 98% of total lines), out of which 6,618 (97.2%) are fully bound and 52
(0.8%) are partially bound.
b As of 26 October 2005.
c Domestic tariff peaks are defined as those exceeding three times the overall simple average applied rate.
d International tariff peaks are defined as those exceeding 15%.
e Nuisance rates are those greater than zero, but less than or equal to 2%.
Note: Calculations exclude specific rates and include the ad valorem part of compound rates. The 2001/02 tariff schedule is
based on eight-digit HS96 nomenclature consisting of 5,477 tariff lines; the 2004/05, 2005/06, and 2006/07 tariff
schedules are based on HS02 nomenclature consisting, respectively of 6,231, 6,336, and 6,803 tariff lines; the 2007/08
tariff schedule is based on HS07 nomenclature consisting of 6,909 tariff lines.
Source: WTO calculations, based on data provided by the authorities of Pakistan.

161
Figure 20: Tariff Averages
Table 32: Preferential Rules of Origin and Tariffs in Trade Agreements, 2007
Trade agreement Wholly produced or obtained
Minimum value addition Cumulation rules Product specific
rules Maximum tariffs/tariff
margins South Asian Association for Regional Cooperation
Yesa 40% of f.o.b.; 30% for LDCs; 35% for Sri Lankab
Minimum aggregate originating content of 50% f.o.b.c
Yesd Maximum 20% by 2008 (5% by 2009 on LDC imports); maximum 5% by 2013
Organization of Islamic Conference
Yesa 40% of f.o.b.; 30% for LDCs
Minimum aggregate originating content of 60% of f.o.b.; 50% for LDCs
Possible in accordance with negotiated sectoral agreements
Maximum tariffs of 25%, 15% and 10% on certain items; fast-track programme to raise margins of preference to 50%
Group of Developing Eight Countries
Being drafted Being drafted Being drafted Being drafted Maximum 10% on certain items
Economic Cooperation Organization
Yesa 40% of f.o.b. Minimum aggregate originating content of 60% of f.o.b.
Possible in accordance with negotiated sectoral agreements
Maximum 10% by 2009
Pakistan-Sri Lanka FTA
Yesa 35% of f.o.b.e Minimum value addition of 25% in exporting countryf
None Tariffs phased out on most goods by June 2008
Pakistan-China FTA Yesg 40% of f.o.b. Minimum value addition of 25% in exporting countryh
None Tariffs phased out on many goods and maximum 50% margins of preference on others by 2012
Pakistan-Malaysia PTA (Early Harvest programme)i
Yesg 40% of f.o.b. Minimum value addition of 25% in exporting countryh
Certain textiles and jewelleryj
Tariffs of 5% eliminated and 50% margin of preference on 10% duties for a few goods
Pakistan-Iran PTA Yes .. .. .. Margins of preference mainly of 10% and 30%
Pakistan-Mauritius PTA
Yes .. .. .. Margins of preference of mainly 50% extended to 100% after one year on selected goods
Global System of Trade Preferences
Yesa 50% of f.o.b.; 40% for LDCse
Minimum total value addition of 60%; 50% for LDCs
Negotiable Margins of preference of from 40% to 65%
.. Not available. a Fish caught in high seas must be in vessel registered in member country and operated by its citizens or an entity with domestic equity
(including state) of 65%, or 75% equity of all members. b Final good must be classified to different tariff heading (4-digit HS) than all non-originating material inputs. c Also, must be minimum domestic minimum domestic value content (value of inputs originating in the exporting member plus domestic
value addition in the exporting member) of 20% of f.o.b. value, and meet change in tariff classification requirements. d Generally require lower minimum value addition of mainly 30% or 40% and change in 6-digit HS classification. e Final good must be in a different 6-digit tariff classification than all non-originating material inputs. f Minimum total value addition in two countries of 35%. g Fish caught in high seas must be in vessels registered in member or entitled to fly its flag. h Minimum value addition in two countries of 40%. i EHP rules to be replaced under FTA. j Based on change in 4-digit tariff classification (spinning, weaving, bleaching, dyeing, printing and finishing sufficient transformation to be
originating goods). Source: Compiled by WTO Secretariat.

162
6.3.2 WTO Notifications
There are more than 32 WTO notifications (2007). They cover anti-dumping, safeguards,
subsidies, countervailing measures, technical barriers to trade, state trading, and intellectual
property.
Table 33: WTO Notifications, 2001 to End-September 2007
Legal basis, instrument or provision Subject WTO documents Frequency
Agreement on Implementation of Article VI of the GATT 1994 (Article 16.4)
Anti-dumping actions (taken within the preceding six months)
G/ADP/N/158, 03/08/2007 G/ADP/N/161, 11/09/2007
Semi-annual or ad hoc
Agreement on Implementation of Article VI of the GATT 1994 (Article 18.5)
Laws/regulations (and changes thereto, including changes in the administration of such laws)
G/ADP/N/1/PAK/2/Suppl.2, 14/04/2003 Ad hoc as and when a Member establishes or changes laws and regulations
Agreement on Subsidies and Countervailing Measures (Article 25.11)
Countervailing duty actions (preliminary and final)
G/SCM/N/153/Add.1, 18/04/2007 G/SCM/N/130/Add.1/Rev.3, 01/05/2007
Ad hoc
Agreement on Subsidies and Countervailing Measures (Article 32.6)
Laws/regulations (and changes thereto, including changes in the administration of such laws)
G/SCM/N/1/PAK/2/Suppl.2, 14/04/2003 Ad hoc as and when a Member establishes or changes laws and regulations
Agreement on Safeguards (Article 12.6)
Administrative arrangements; laws/regulations (and changes thereto)
G/SG/N/1/PAK/3, 10/10/2003 Ad hoc (promptly after the establishment of laws, regulations, etc. with updates)
Agreement on Safeguards (Article 12.1(c))
Termination of safeguard investigation
G/SG/N/9/PAK/1, 04/10/2005 Ad hoc
Understanding on the Interpretation of Article XVII of GATT 1994 (Article XVII:4(a))
Foreign trade by state trading enterprises
G/STR/N/9/PAK, 07/07/2003 Annual
Agreement on Trade-Related Aspects of Intellectual Property Rights (Article 63.2)
Laws and regulations IP/N/1/PAK/I/2, 01/10/2004 Once or ad hoc
Agreement on Technical Barriers to Trade (Article 10.6)
Measures in force G/TBT/N/PAK/25, 06/06/2007 Ad hoc
Source: WTO Central Registry of Notifications.
6.4 Industrial Sector of Pakistan
In Pakistan the Agriculture sector provides the basic raw material to industrial
sector and the performance of the agriculture sector casts shadows on industrial sector
invariably. The sector comprises of Textile and ancillary industry. Engineering &
Automobile Industry, Fertilizer, Cement Industry, Chemical, Paint & Varnish Industry,
Mining & Quarrying sector and Small and Medium Enterprises.
Being the second largest sector of the economy, it contributed 25 percent to GDP
in 2006-07 with a broad based growth of 8.45 percent. Large scale manufacturing
accounted for 69.5 percent of the Industrial GDP with a growth of 8.75 percent, though
the last year growth in the sector was 10.68 percent. There were many reasons to this
163
decline such as reduced production of cotton crop, sugar shortage, steel and iron
problems and high oil prices.
The main contributors to industrial growth are the textile group, 18.9 percent
(cotton, 7 percent, cotton yarn, 11.9 percent), food and beverages group, 26.4 percent,
(cooking oil 6.8 percent, sugar 19.6 percent), the non- metallic mineral products group,
(cement 21.11 percent), the automobile group, (car and jeeps 3 percent, motorcycles /
scooters 12.30 percent, tractors 11.40 percent). According to economic Survey 2006-07,
the textile industry of Pakistan is amongst the best in the world. Presently, installed
number of textile units of different capacity is over 500; however, many of them are shut
down.
The availability of basic raw material (cotton) and cheap labor has played a major
role in the growth of the industry. Textile industry is the main contributor to export
earning and have immense potential in the global market. In 2005, it showed (though
modest) growth of 5 percent. However, the garment and knitwear sectors need more
attention. The industry to meet the challenges of post quota period is gearing it self up to
face the challenge through balancing, modernization and restructuring (BMR). Major
investment has been made in the spinning, weaving, processing, and made up sectors. It
has created around 454,000 direct jobs along with enhancing the production capacities.
Import of textile machinery is the single largest item in the machinery group.
Textile machinery worth US $ 771.500 million was imported in 2006-07. Installation of
new machinery has facilitated yarn and cotton production. As a result exports grew up to
$10.37 billion in 2005-06. It is expected that exports will touch $12 billion in 2006-07.
6.4.1 Ancillary Textile Industry
Cotton ginning, cotton yarn, cotton fabric, fabric processing (grey dyed-printed)
home textiles, towel, hosiery & knitwear and ready made garments are the component of
textile industry. Interestingly, these products are produced both in organized large - scale
sector as well as in un-organized cottage and medium & small units. Ginning is the first
mechanical process involved in the processing of cotton and it separates lint from seed.
Spinning converts fibers into yarn. This is the first process in the value chain that
converts ginned cotton into cotton yarn. A bad job in the spinning industry goes through

164
out the entire chain. Pakistan has the third largest spinning capacity in Asia, (7.6 %) and
a capacity of 5 % of the total world.
There are three sub-sectors in weaving; integrated, independent weaving units
and power looms. Modest investment has taken place in the sector. Due to the policies
of the Government, the power loom sector is on the way to modernization and has
recorded high growth. However, the sector is producing low value added grey cloth due
to limited access to credit facilities to buy modernized equipment.
Cotton Cloth is made in organized mill sector as well as in the non mill sector.
Out put of non mill sector is seven times more than the mill sector. Cloth sector renders
services to down stem sectors like Bed Wear, Made ups and Garments.
Table 34: Profile of Textile Industry
SUB-SECTOR NO OF UNITS SIZE (INSTALLED CAPACITY) PRODUCTION
1. Ginning 1221 5,488 Saws 10.314 M Bales
2. Spinning 456 a) 9.6 million
b) 146,640 Rotors
1.818 M. Kgs
Yarn
3. Weaving
Composite Unites
Independent Mills
Power Loom Sector
50
140
20,000-25,000 Shuttle-less looms
225,000 Conventional looms
5,600 M. Sq Mt
(Approx)
4. Finishing
Organized Sector
Small Scale Sector
106
625
-
-
2,700 M.Sq. MT
5. Garment Units 5,000 450,000 Sewing Machines
650 M PCs
6. Terry Towels 400 7,600 looms
55 M. Kgs
Source: Textile Ministry and Board of Investment
Textile down stream industry comprises of Hosiery industry, Readymade
Garment industry, Towel industry, Tarpaulin & Canvas, and Synthetic Fiber
Manufacturing Sector. Hosiery industry consists of around 12,000 Knitting Machines
with capacity utilization of around 70 percent. Readymade Garments industry earns
around $1 billion from exports, and enjoys duty free import of machinery and income tax

165
exemptions. This is the highest value addition segment of textile industry and consists of
large, small and medium scale units. Towel industry is heavily export oriented and
comprises of 7500 Towel Looms both in the organized and un- organized sector.
Tarpaulin & Canvas sector produces sun blinds, tents, sails, pneumatic mattresses and
camping goods. The 90 percent of the production is exported, and local consumption is
only 5-10 percent.
Synthetic Fiber Manufacturing Sector has made progress to catch up with the
demands of the textile sector. There are seven Polyester fiber Units producing 625000
tons per annum. Two Acrylic Fiber Units and one Viscose fiber Unit have also gone into
production. Synthetic Fiber Manufacturing, Filament Yarn Manufacturing, and Art Silk
& Weaving industries are also working.
6.5 Small and Medium Enterprises (SMES)
SMEs are the real back bone of both developing and developed economies and
same is true for Pakistan. Studies show that their contribution is over 55 percent to GDP,
and over 65 percent to total employment in the high income countries. SMEs and
informal enterprises create around 60 percent of jobs in low income countries and their
contribution to GDP is 70 percent. In the middle income countries they create 95 percent
of jobs and add about 70 percent o GDP. (Economic Survey 2006-07)
In Pakistan this sector contributes 30 percent to GDP, 25 percent to manufactured
exports, 78 percent to labor force and 35 percent to value addition in manufacturing.
Around 3.2 million SMEs are working in Pakistan, and their activities range from trade,
whole sale, and retail to restaurants etc.
Realizing the significance of the sector Government has started giving due
attention on the development of the sector and efforts are made to identify the bottle
necks and constraints of sector. SMEs policy is in place. Small and Medium Enterprise
Development Authority (SEMEDA) has been set up to look after the sector. Asian
Development Bank is giving support to sector and local banks have also enhanced the
lending ceiling. However, non availability of funds is the major set back to development
of the sector. Other impediments include lack of information, technology & innovation,
and connections.

166
SME Policy, 2006-07
The objective of SME Policy is to provide a frame work (short, medium and
long-term) along with an implementation mechanism to achieve higher economic growth
based on SME and led by private sector development. Following are the broad
principles:-
• The SME Policy may be implemented and supported through an SME Act 2006
• Measures should be taken for promotion of ‘Entrepreneurship Culture’ and support
for growth of existing enterprises.
• Different sets of policy measures may be adopted for small and for medium
enterprise
• Special focus may be given to women and marginalized groups within the policy
• Rural based and agro processing enterprises may be supported
• For SME development, decisive and concurrent measures such as business
regulations, fiscal, trade rules, labor, incentives and support should be taken
• Private sector will be involved in implementation of the policy Source: SME Bank
6.6 Industrial Policy
There is no Industrial Policy as such. The researcher was informed over the phone (Dy.
Secretary, Ministry of Industries. May, 2008), that bits and pieces from different policies,
especially the Investment Policy are being used for direction. The website of the Ministry of
Industries & Production also does not carry any policy guidelines. 6.7 Investment Policy, 2006-07
Pakistan’s Investment Policy is very liberal and forward looking. Following are the
highlights of the Investment Policy:-
• All economic sectors in Pakistan open to FDI (except Arms and Ammunition, High
Explosives, Radioactive Substance, Security Printing and Currency & Mint).
• 100% foreign equity allowed
• Remittance of royalty, technical & franchise fee, capital, profits and dividends allowed
• Attractive incentive packages:-

167
• 0-5% customs duty on import of machinery
• No sales tax & withholding tax on import of machinery
• Import of raw material for export oriented manufacturing zero-rated
• Initial depreciation allowance at the rate of 50 %
• Network of Export Processing Zones/Industrial Estates for establishment of industries
and businesses
• Foreign investment fully protected under the;
• Promotion & Protection Act 1976
• Protection of Economic Reforms Act 1992
• Bilateral Agreements to boost the confidence of the investors and investing countries
• Investment Promotion & Protection : 47 Countries
• Avoidance of Double Taxation Treaty : 52 Countries.
Table 35: Investment Policy Matrix
*Specified Industries: **PME= Plant, Machinery and Equipment - Arms and ammunitions I***IDA= Initial Depreciation Allowance - High Explosives. - Radioactive substances - Security Printing, Currency and Mint. No new unit for the manufacturing of alcohol, except, industrial alcohol Source: Board of Investment
Non -Manufacturing Sectors
Policy Parameters
Manufacturing Sector Agriculture Infrastructure &
Social
Services including IT &
Telecom Services
Govt. Permission
Not required except 4 specified industries *
Not required except specific licenses from concerned agencies.
Remittance of capital, profits, dividends, etc
Allowed
Allowed
Upper Limit of foreign equity allowed
100%
60% 100% in CAF
100% 100%
Minimum Investment Amount (M $)
No
0.3 0.3 0.15
Customs duty on import of PME**
5%
0 5% 0-5%
***Tax relief (IDA, % of PME cost)
50% 50%
Royalty & Technical Fee
No restriction for payment of royalty &
technical fee.
Allowed as per guidelines - Initial lump-sum upto $100,000 - Max Rate 5% of net sales - Initial
period 5 years

168
6.8 Textile Policy, 2007
“Export Plan 2006-13 seeks to increase textile and garment sector’s exports from
$9.98 billion in the fiscal year 2006 to $24.36 billion by the fiscal year 2013. The textile
exports target for the current fiscal year has been set at $12 billion.” (Daily Times, 23
August, 2007).
The Ministry of Textile Industry has proposed an attractive incentive package to
be included in forthcoming Textile Industry Development Policy 2007 to meet this
target. The aim of the policy is to develop international competitiveness of textile sector
on “war footing” in the short as well as in the long run. According to the proposed
policy:
• A sizeable machinery-manufacturing base inside the country is a requirement of
textile industry, being the largest industrial sector. Import of textile machinery
causes out flow of foreign exchange, therefore, “incentives like zero-rated import
of plant and equipment, tax holidays for initial 10 years, inclusion of their end-
product in any future scheme designed to subsidize import of textile machinery”
be given to attract foreign investment in textile machinery manufacturing sector.
• Incentive package of tax holidays for 10 year and 50 percent of the normal rate
for the next 5 year to encourage foreign investment in cotton warehouses on the
pattern of Bangladesh. (This initiative is a part of the approved export
development plan of the Planning Commission of Pakistan )
• Provision of land on concessionary terms and conditions
• Fiscal incentives; exemption of custom duties and taxes on import of capital
equipments (plant, machinery and accessories), corporate income tax holiday
• Chinese investment to be encouraged in dedicated textile industrial parks to be
setup by the government
• Exemption from income tax for foreign consultants and technicians hired by the
textile industry to enhance productivity of local business
6.9 Private Sector Stake Holders
The Government also receives formal and informal advice from the private sector
on trade issues and policies. Federation of Pakistan Chambers of Commerce & Industries
(FPCC& I) represents directly or indirectly almost the entire private sector and industry

169
in the organized sector. Membership of FPCCI is confined to chambers and associations
representing specific products or industries. Federation has 32 chambers and 65 sector
specific associations as members.
The primary aim of FPCCI is advocacy to promote, and safeguard the interest of
private sector. It serves as a bridge between the private sector and the government.
FPCCI has affiliations and linkages with the following international business entities:
The Islamic Chamber of Commerce and Industry
The International Chamber of Commerce (ICC)
ECO Chamber of Commerce & Industry
SAARC Chamber of Commerce & Industry
G-77 Chamber of Commerce & Industry
Confederation of Asia & Pacific Chambers of Commerce & Industry (CACCI)
6.10 International Trade and Developing Countries
IMF in a report (2001) asserts that integration into global economy is a powerful
instrument for countries to promote economic growth, development and poverty
alleviation. The report further elaborate that integration of world economy has raised
living standards all over the world. And most of the developing countries have shared
this prosperity. In some countries the incomes have gone up dramatically. The
developing countries as a group are becoming increasingly important in world trade,
accounting for one-third of world trade. The share was very humble in early 1970s
(about a quarter only).
Estimated gains from free merchandise trade ranges from US $ 250 billion to
US$ 680 billion per year according to this report. Though two third of these gains direct
to industrialized countries but developing countries also reap the benefits as their share
in the gains is twice the level of aid they are receiving currently.
The progress in China and India and other higher-income countries in Asia
(Korea, Singapore etc) have been spectacular because they opted for trade liberalization
and other market –oriented reforms. Success of East Asia is attributed to fall of average
import tariffs from 30 percent to 10 percent over the last 20 years.

170
Sustained economic growth needs open trade and investment policies with rest of
the world. Opening up the economies has enabled many developing countries, which are
defined by the World Bank as the “new globalizers”, to develop competitive advantage.
The number of people living in absolute poverty has declined by over 120 million (14
percent) between 1993 and 1998 in these countries, (World Bank).
There is evidence that outward looking countries have consistent growth which is
faster than the inward looking countries, (IMF, 1997). Findings are that recently opened
economies with lowering of tariffs (like India, Vietnam and Uganda) have faster growth
and substantial poverty reduction, (David, 2001).
Dollar and Kraay, (2001) emphasized that free trade benefits poor and increases
their incomes because subsidies are “channeled to narrow privileged interests”.
6.11 Economic Structure and Economy of Income
Tony Killick, (The Adaptive Economy) has given the following economic
structure for the low, middle and high income countries, associated with Hollis Chenery.
To further dilate upon the structure, it is mentioned that the low income countries are the
one where per capita income is below US $ 300. In the middle income countries, the
predicted value of per capita income is US $1000. (The predicted value is based on the
assumption of population of 20 million people). In the high income countries per capita
goes beyond US $ 4,000.
Table 36: The Economic Structures of Low- Middle- and High-Income Countries
Indicator Low-income Middle-income High-income As a percentage of GDP
1. Gross Domestic Saving 9 20 26 2. Investment 14 23 26 3. Trade: Exports Imports
16 21
23 26
23 23
4. Food consumption 39 29 15 5. Agriculture 48 23 7 6. Manufacturing 10 18 28 7. Services 31 38 47 As a percentage of merchandise exports 8. Primary products (nonfuel) 71 42 28 9. Manufactures 7 20 61 Source: Syrquin and Chenery (1989)

171
6.12 Aim of Trade
Pronk, (2004) argues that… Trade is not an aim itself. The ultimate objective of
economic policy making is not to expand trade, but to increase income and welfare.
Trade is an instrument. Its expansion should be assessed against the objectives.
He further mentions that trade gains can be static resulting from an optimum
allocation of resources in a competitive world, and there are dynamic gains due to
openness of trade thus contributing to investment, knowledge, innovation, productivity,
and growth.
6.13 Trade Has Worked for Pakistan
The per capita income in Pakistan was $ 79 in the 1950s. The per capita income
in Pakistan increased by over five times from $79 in 1950 to $429 in 2001, according to
a report, (Dawn, 2005). Per capita income was $ 492 in 2002-03. (Economic Survey,
2002-03).
Dawn, (2004), while quoting then prime minister has reported that Senate was
told that the per capita income would reach $ 600 in 2004.
In a recent report (2007), Pakistani Defence Forum has mentioned that Pakistan
has per capita income of $ 847 now as compare to $441 in 1999, which is nearly 100%
increase. In 1999-2000, it was $426. In six years the per capita has almost doubled.
While talking to BBC World, then prime minister said that Pakistan’s per capita
income has reached to $ 800 per annum, almost double in four years. He further
mentioned that, “we have no restriction on trade from any country. Tariffs have been
reduced. Pakistan is most open trade country in South Asia”, (Dawn 2006)

172
References
Adelman Irma (1999). The Role of Government in Economic Development,
Working Paper, No. 890, Department of Agriculture and Research and Policy Division
of Agriculture and Natural Resources, University of California
Bates, Robert (1997), Open Economy Politics: The Political Economy of the
World Coffee Trade, Princeton University Press.
Economic Survey of Pakistan (2002-03)
David Dollar and Aart Kraay, (2001): Trade, Growth and Poverty, World Bank
mimeo, 2001
David Dollar, (2001): Globalization, Inequality, and Poverty, World Bank
mimeo, 2001
Dawn (10 April, 2004): Per Capita Income to reach $600 this year, says Shaukat:
http://www.dawn.com: Retrieved on 2008-05-25
Dawn, (3 January 2005): Less people, More prosperity; http://dawn.com:
Retrieved on 2008-05-25
Dawn (2006): Pakistan’s per capita income at $ 800: (5, February, 2006)
Retrieved on 2008-05-25
Government of Pakistan, Islamabad: http://www.pakistan.gov.pk
IMF, (2001): Global Trade Liberalization and the Developing Countries; IMF
Issues Brief: http://www.imf.org : Retrieved on 05-21-2008
Jan Pronk, (2006): (Dutch politician and Diplomat): Trade Liberalization: A
Political Approach: http://www.janpronk.nl
Killick Tony: The Adaptive Economy: Adjustment Policies in Small, Low-
Income Countries. Economic Development Institute of the World Bank, EDI
Development Institute (ODI)

173
Pakistan Defence Forum: http://www.pakistanidefenceforum.com: Retrieved on
2008-05-25
The Planning Commission of Pakistan: http://www.pakistan.gov.pk
Trade Policy Speech: Minister for Commerce, (2008), Ministry of Commerce,
Government of Pakistan, Islamabad. http://www.commcerce.gov.pk
UNDP, (2006): Sectoral and Contextual Studies on Trade: Trade Initiatives from
Human Development Perspective Project (TIHP- UNDP), A Country Case Study. United
Nations Development Program, Pakistan
Welch Jack (1997): Jack Welch Speaks: Wisdom from the World’s Greatest
Business Leader, Janet C. Lowe, John Wiley & Sons Inc, New York
World Bank, Poverty Rates; (1981 - 2002): http://www.worldbank.org :
Retrieved on 2007-06-04.
World Bank: Globalization, Growth, and Poverty: Facts, and an Agenda for
Action http://www.worldbank.org: Retrieved on 2007-12-29
World Trade Organization, (WTO): http://www.wto.org
WTO Industrial Negotiations: Implications for Pakistan: Actionaid, Pakistan
www.actionaid.org/pakistan

174
CHAPTER - 7
DEVELOPMENT OF BT COTTON IN PAKISTAN
7.1 Introduction
Globally, cotton and other crop plants require an intensive use of pesticides to inhibit
insect/pests population (PARC, 2007). In Pakistan, over the past 30 years, pesticides are
being used to protect cotton crop against sucking and chewing insects. Among the chewing,
lepidopteran are the primary pests causing 20-30 percent annual yield losses in the country.
Different approaches have been used to develop inbuilt resistance against the bollworms and
the only successful approach to engineering crops for insect tolerance/resistance is the use of
addition of Bt toxin, a family of toxins originally derived from soil bacteria (PARC, 2007).
Major advances in biotechnology have made it possible to directly identify and
isolate genes, know their functions, and transfer them from one organism to another which
have many applications for increasing plant productivity, improving plant resistance to
diseases and pests, and improving the quality of the output (Gandhi and Namboodiri, 2006).
Bt cotton was among the first transgenic crops to be used in commercial agriculture. A gene
from the soil bacterium Bacillus thuringiensis (Bt) has been transferred to the cotton
genome (Qaim et al., 2003). This gene codes for production of a protein that is toxic to the
cotton bollworm, a severe insect pest in most cotton-growing regions of the world (Qaim
and de Janvry, 2004). Bt is a gram-positive, aerobic, spore- forming bacteria that is found in
soil, plant surfaces and in grain storage dust (Qaim et al., 2003). There are almost eighty
different serotypes of Bt, which are capable of producing many different toxins, including
endotoxins, exotoxins and enterotoxins (PARC, 2007). Toxins produced by Bt are known as
"Bt toxins". The Bt toxins consist of two main types, Cry (crystal) toxins (cry genes) and
Cyt (Cytolytic) toxins. The Cry proteins are effective against different insect orders, being
the most effective against lepidoptera (caterpillars), coleoptera (beetles) and diptera - small
flies and mosquitoes (Qaim and Zilberman, 2003).

175
At the moment, Monsanto launched Bollgard II by combining Cry2Ab2 and Cry1Ac
proteins in a single product provides an additional tool to delay the development of insect
resistance to Cry proteins in cotton which provides increased control of cotton bollworm, as
well as certain secondary insect pests of cotton, including armyworm (PARC, 2007).
7.2 Background of Bt Cotton in the World
Bacillus thuringiensis, commonly known as Bt is a bacterium that occurs naturally in
soil which has been used as a biological pesticide for more than 50 years (Qaim and
Zilberman, 2003). It is a gram positive bacterium discovered by Japanese bacteriologist
during 1901, from diseased silkworm (Bombyx mori) larvae, produces proteinaceous
crystalline inclusion bodies upon sporulation. Berliner isolated from diseased larvae of
Ephetia kuhniella and designated as Bacillus thuringiensis during 1915. Further research on
Bt by Steinhaus (1951) led to renewed interest in biopesticides and as a result more potent
products such as Thuricide® and Dipel® were introduced (Barton et al., 1987). There are
several subspecies of this bacterium which are effective against Lepidopteran, Coleopteran
and Dipteran insects (Hoftey and Whitley, 1989). Formulations based on Bt occupy the key
position accounting for 90% of the total biopesticides (Neale, 1997). The insecticidal
proteins produce in the crystal form constitute two different families, Cry and Cyt, which
have been further classified on the basis of amino acid identity into 300 Cry and 22 Cyt sub-
groups (http://epunix.biolos.susx.ac.uk/home/Neil_Crickmore/Bt/ toxins.html).
The identification of Bacillus thuringeinsis var kurstaki strain provided a boost for
the commercialization of Bt product in the market. The problems associated with the Bt
formulation based biopesticides such as shelf life, potency and the presence of viable spores
have been overcome by using modern tools in microbiology and genetic engineering
(PARC, 2007). Genes encoding for the δ- endotoxins have been cloned since 1980s
(Schneph and Whitley, 1981) and the expression of introduced gene in tobacco and tomato
provided the first examples of genetically modified plants with resistance to insects (Barton
et al., 1987).

176
7.3 Is there a Need to Grow Bt Cotton in Pakistan?
In 1960s, Pakistan's population was 96.32 million, which grew to 122.49 million in
1990s and 163.76 million in 2008-09 (Government of Pakistan, 2009). Due to a sharp
decline in mortality since the 1650s without a corresponding reduction in fertility, the
population growth rate has increased from 2 percent in 1950s to 3 percent in 1980s. With
accelerated efforts of the national population planning programme and other socioeconomic
changes, a decline in fertility and birth rate occurred during the 1990s, thereby reducing the
population growth rate to 2.6 percent during inter-census period of 1981-1998, and further to
1.87 percent per annum by the year 2005 which is still amongst the highest in the region
(Government of Pakistan, 2009). Given the existing trend, total population is estimated to
reach 167 million by the year 2010 and 194 million by 2020 (NIPS, 2008). In the wake of
growing population, the need for food security, provision of employment opportunities and
housing are being burden on the economy and without population stabilization, addressing
the critical issue such as global warming, biodiversity, the environment, energy, food
supply, water supply, migration and security is extremely difficult (Government of Pakistan,
2009).
These population and resource facts, combined with a renewable commitment to
fighting poverty, indicate that the main thrust of national policies aimed at solving issues of
rural poverty and food insecurity must include broader agricultural and rural development
objectives, such as significant increase in food production (Hayee, 2005). He further argued
that to escape from poverty, rural population depends directly or indirectly on increased
agricultural productivity and an innovation that increases productivity will have a major
impact on food-security efforts. Bt cotton can play a significant role to enhance agricultural
productivity as the productivity of cotton in Pakistan is 0.5 ton/ha as compared productivity
of Bt cotton in China is 9 ton/ha which implies a huge cotton productivity gap. This gap can
be narrowed down by the adoption of Bt cotton in Pakistan which will have major impact on
food security efforts in the country.

177
7.4 Development of Bt Cotton in Pakistan
Pakistan, unlike its neighbor India was slow to adopt Bt cotton and proper
legislation (Biosafety rules, SOPs for GM crop release, Plant Breeders Rights and Seed Act
1976 amendments) was either delayed or not yet promulgated thus delaying the available
technology to the farmers. Rao (2009) narrated the history of development of Bt cotton in
Pakissan.com. Pakistan Atomic Energy Commission (PAEC) had sought special permission
in 1997 from the Ministry of Environment under “Voluntary Code of Conduct for release of
GMO into the environment” prepared by NIBGE; and it conducted, checked and analyzed
many safety tests on various cotton varieties which contain gene of genetically modified
organism called Bacillus thuringiensis (Bt), a bacterium that is deadly to the “Sundies”.
Pakistan enacted the Biosafety Rules in April 2005 which provide legal
requirements for import, export, transport, and handling of biological agents, genetic
engineering organisms or vectors, seeds, crops and foods, besides setting conditions for the
researchers; seeds developers and companies (Pakissan.com). In May 2005 PAEC provided
40,000.00 Kg basic seed of Bt cotton (insect resistant) varieties “IR-FH-901”, “IR-NIBGE-
2”, “IR-CIM-448” and “IR-CIM-443”.
Recently, National Biosafety Committee (NBC) of EPA of GoP approved six cases
of Bt cotton (Cry lAc- event MON 531) based on previous history of its safe usage in other
parts of the world. The MON 531 event is not patented in Pakistan and GoP is using
flexibility of TRIPS regulation of Data Exclusivity (39A) allowing parties to use Biosafety
data of others. At least six national seed companies have been given permission for field
testing. It will take another year for commercial approval and officially approved BT cotton
(+MON531 event) will not be available till 2010-11 season. Meanwhile unapproved seed
sale of Bt cotton will touch the mark of almost 100% during this season which will sta;t in
April-May this year. GoP also approved import of Bt cotton hybrid seed to Monsanto as
well as to National seed company (Guard) from India. Another approval was given to
import Bt cotton from China (Ali Akbar and Auriga) for evaluation (Pakissan.com).

178
A positive development was approval of Monsanto plan to introduce advanced GM
crop technology in Pakistan by GoP during 2009. In this regard Ministry of Food and
Agriculture (MINFAL) has been working on a two pronged strategy i.e. developing the
technology through indigenous capabilities as well as inviting the multi-national companies
(MCS) to bring in the latest cotton production and protection in the country (Government of
Pakistan, 2009). In this respect letter of intent and memorandum of understanding has been
signed with Monsanto company for introduction of latest technology (bollgard-II) in the
country to maximize cotton production. National Biosafety Committee (NBC) of Ministry
of Environment ahs also authorized biosafety clearance to eight cotton varieties with
bollard-1 in the country (Government of Pakistan, 2009). It is expected that if followed in
letter and spirit this will pave the way for establishment of viable seed industry in Pakistan
(Pakissan.com).
Cotton is cultivated on large area in Pakistan-3.2 million ha and thus a lucrative seed
market for MNC, Chinese seed companies as well as for national seed sector. It is essential
that GoP should move faster to formulate efficient and effective laws to build viable seed
sector in the country. Technology is available, though at a cost. Almost 100 percent Bt
cotton in India is by foreign technology (not by their public sector!!) Asking price is also
declining rapidly. Even genuine investor needs returns of his investment. In order to achieve
target of 20 million bales in 2015 we have to make best use of available technologies from
USA, China and even from India. A level plaing flied is needed for public as well as for
private (national/MNC) sector (Pakissan.com).
7.5 Global Adoption of Bt Cotton
Bt cotton was among the first transgenic crops to be used in commercial agriculture
(Qaim et al., 2003). Commercial cultivation of Bt cotton has taken in US, Australia and
Mexico in 1996, and by China and South Africa after a lag of one year. Countries such as
India, Indonesia and Colombia have taken up its commercial cultivation much later, since
2002. Over half of the world cotton production is from Biotech cotton (not only Bt but
herbicide tolerant also). More than 15 cotton producing countries officially approved

179
cultivation of Biotech cotton. Among the top cotton producing countries, Pakistan is a major
exception.
Bt was developed by the US company Monsanto as one of the first GM crop
technologies which became commercially available in the mid-1990s (Gandhi and
Namboodiri, 2006). Since the introduction transgenic crops in 1996, there has been a
substantial increase in their area (Chaturvedi, 2002). Bt is currently grown in a large number
of countries, including United States (95%), China (95%), Australia (89%), South Africa
(80%), India (70%), Argentina (40%), Indonesia and Pakistan (Gandhi and Namboodiri,
2006 and PARC, 2007).
In the USA and China, Bt cotton covers about 30–40 per cent of the cotton area in
both countries (Qaim de Janvry, 2005). Recent studies show that USA and Chinese Bt
adopters realize significant pesticide and cost savings in most cotton-producing regions
(Carpenter et al., 2002; Pray et al., 2002; Huang et al., 2002a). Preliminary benefits of Bt
cotton have also been reported for South Africa (Thirtle et al., 2003; Isma¨el et al., 2002)
and Mexico (Traxler et al., 2001). Nonetheless, relatively little is known about Bt–
insecticide interactions and productivity effects under different agroecological conditions
(GRAIN, 2001). The broader impacts of GM crops in general, and Bt cotton in particular,
are still a matter of controversy, especially with respect to long-term environmental
implications and sustainability (Batie and Ervin, 2001; Benbrook, 2001; UK Soil
Association, 2002). This holds true both in developed and developing countries.
USA, China and Australia have reported positive experiences with Bt cotton. Bt
cotton has spread very rapidly in China. There is good demand for it from the farmers since
it reduces the cost of pesticide applications as well as the exposure to pesticides (Gandhi and
Namboodiri, 2006). In China the government has played a major role in providing GM
technology to the farmers (Pray, EC, et al, 2002).
In Argentina, Bt cotton was patented by Monsanto and released in 1998 by Genética
Mandiyú, a joint venture between Monsanto, Delta and Pine Land (D&PL), and the local

180
company Ciagro (Qaim and de Janvry, 2004). Unlike other countries, however, in Argentina
the diffusion of Bt cotton has been rather slow. According to official statistics, four years
after its introduction, Bt technology only covered about 5% of the national cotton area in
Argentina as compared to GM soybeans which were adopted almost completely in the
country within a similar time frame (Qaim and de Janvry, 2004). However, their
introduction in India has been relatively late and controversial and they still have
considerable ground to cover in the country (Gandhi and Namboodiri, 2006).
7.6 Adoption of Bt Cotton in Pakistan
Pakistan, unlike its neighbor India was slow to adopt Bt cotton. Proper legislation
(Biosafety rules, SOPs for GM crop release, Plant Breeders Rights and Seed Act 1976
amendments) was either delayed or not yet promulgated thus delaying the available
technology to the farmers (PARC, 2007). Bt cotton (insect resistant) varieties “IR-FH-901”,
“IR-NIBGE-2”, “IR-CIM-448” and “IR-CIM-443” were grown over 8,000 acres of land
during 2005-06. Large quantities of illegal Bt seed are in use. PARC (2007) revealed that
area under illegal Bt cotton is 80 percent with nearly 36 unapproved varieties. Most of these
varieties are Cotton leaf curl virus susceptible, poor in fiber quality and high input
demanding unapproved varieties. Almost all these varieties employed Monsanto
Cry1Acgene (MON 531) as it was not patented in Pakistan.
7.7 Impact of Bt Cotton in the World
Qaim and de Janvry (2003) analyzed the adoption and impacts of Bt cotton in
Argentina against the background of monopoly pricing. Based on survey data, it is shown
that the technology significantly reduces in secticide applications and increases yields;
however, these advantages are curbed by the high price charged for genetically modified
seeds. Using the contingent valuation method, it is shown that farmers’ average willingness
to pay is less than half the actual technology price. A lower price would not only increase
benefits for growers, but could also multiply company profits, thus, resulting in a Pareto
improvement.

181
Qaim et al. (2003) assessed the agronomics and sustainability of transgenic cotton in
Argentina. Study results revealed that Transgenic Bt cotton can halve pesticide application
rates in Argentina while significantly increasing yields. Yield effects are bigger than in other
countries, due to the current low levels of insecticide use. Although smallholder farmers are
not currently using the technology, gross benefits are predicted to be highest for them.
Biological model simulations showed that rapid resis-tance buildup in pest populations
appears to be unlikely if mini-mum non-Bt refuge areas are maintained.
Qaim and de Janvry (2004) carried out adoption and impacts of Bt cotton in
Argentina against the background of monopoly pricing. Survey data revealed that the
technology significantly reduces insecticide applications and increases yields; however,
these advantages are curbed by the high price charged for genetically modified (GM) seeds.
Studies showed that farmers’ average willingness to pay is less than half the actual
technology price. A lower price would not only increase benefits for growers, but could also
multiply company profits.
Purcell and Perlak (2004) assessed the global impact of insect-resistant (Bt) cotton.
Study results revealed that insect-resistant (Bt) cotton has been rapidly adopted since its
introduction in 1996. Farmers around the world both large and smallholders benefit from
this technology through increased productivity, convenience, and time savings. The vast
majority of farmers using Bt cotton globally are smallholder farmers. The economic,
environmental, and social benefits derived from adoption of this important tool have very
positive implications for the farmers.
Qaim and de Janvry (2005) analyzed the effects of insect-resistant Bt cotton on
pesticide use and agricultural productivity in Argentina. Farm survey data revealed that the
technology reduces application rates of toxic chemicals by 50 per cent, while significantly
increasing yields. Using a damage control framework, the effectiveness of Bt versus
chemical pesticides was estimated, and technological impacts are predicted for different
farm types. Gross benefits could be highest for smallholder farmers, who are not currently

182
using the technology. The durability of the advantages is analyzed by using biological
models to simulate resistance development in pest populations. Rapid resistance buildup and
associated pest outbreaks appear to be unlikely if minimum non-Bt refuge areas are
maintained. Thus, promoting a more widespread diffusion of Bt cotton could amplify the
efficiency, equity, and environmental gains. Conclusive statements about the technology’s
sustainability, however, require longer-term monitoring of possible secondary effects and
farmers’ behavior in maintaining refuges.
Hofs et al. (2006) assessed the impact of Bt cotton adoption on pesticide use by
smallholders: a two year survey in Makhatini Flats, South Africa. The survey explored
insecticide use in fields cropped with conventional or Bt cotton varieties in a smallholder
farming area. The study was carried out during the 2002-2003 and 2003-2004 growing
seasons as part of a broader survey based on daily monitoring of a sample of smallholdings.
The adoption of Bt cotton led to a decrease in pyrethroid use, but the level of insect
resistance of this cultivar was not sufficient to completely drop this pesticide from the
spraying programme. On the other hand, organophosphates were still being applied in
substantial amounts, thus raising questions as to the impact of Bt cotton adoption on farmers'
health. The overall economic results obtained with Bt cotton were slightly positive despite
the low cotton yields obtained in the Flats during our survey. Bt cotton adoption did lead to
labour savings, but the extent of this gain was not as high as expected. In conclusion,
cropping Bt cotton in Makhathini Flats did not generate sufficient income to expect a
tangible and sustainable socioeconomic improvement due to the way the crop is currently
managed. Adoption of an innovation like Bt cotton seems to pay only in an agro-system
with a sufficient level of intensification.
Gandhi and Namboodiri (2006) analyzed the adoption and economics of Bt cotton in
India. Survey findings revealed that biotech crops, which made their appearance in the world
about a decade ago, have gained substantial popularity and acceptance in many parts of the
world including US, China, Australia, Mexico, Argentina and South Africa. However, their
introduction in India has been relatively late and controversial and they still have
considerable ground to cover in the country. Data from the survey, which covered the

183
important cotton states of Gujarat, Maharashtra, Andhra Pradesh and Tamil Nadu, and 694
farmers, indicates that Bt cotton offers good resistance to bollworms as well as several other
pests. The incidence of these pests is reported to be considerably lower in Bt cotton as
compared to Non-Bt cotton. The yields of Bt cotton are found to be higher and the yield
increase/difference statistically significant in all the states under both irrigated and rain-fed
conditions. As a result, given the good market acceptance of the product, the value of output
per hectare is higher in all the states and conditions. The question of higher cost of
cultivation exists, and is confirmed, mainly because of high seed cost and not commensurate
reduction in pesticide cost. However, the profit is found to be higher in all the states to the
estimated extent of about 80-90 percent on an average when the effects of associated inputs
are included. The returns are highest in Maharashtra followed by Gujarat and then Andhra
Pradesh. Subjective assessment indicates that farmers see advantage in Bt cotton in pest
incidence, pesticide cost, cotton quality, yield and profit. Almost all farmers indicate that
they plan to plant Bt cotton in the future. To increase the benefits from the technology, the
farmers strongly urge reduction in the seed cost, greater field extension and demonstration
work on the correct practices, and more Bt cotton varieties to suit the diverse agro-
ecological settings of India.
Frisvold and Reeves (2007) analyzed the economy wide using global trade analysis
project model. Productivity gain estimates are based on 2005 adoption rates for Bt cotton in
seven countries. Global economic benefits are nearly $1.4 billion, while US benefits are
over $200 million. Increased production from Bt cotton adoption leads to a 3% reduction in
the world cotton price. Employment and trade balances in the textile and apparel sectors
increase for China and India, but generally decline elsewhere. Individual countries obtain
greater economic welfare gains if they adopt Bt cotton than if they do not adopt. Non-
adopting regions lose cotton market share to adopting regions.
Wang et al. (2008) assessed the impact of Bt cotton on the farmer’s livelihood
system in China. A sample of 169 farmers and extension personnel in the main cotton
production areas in Hebei province in the year 2002 and 2003 was taken. The results showed
that the application of Bt cotton increased the cotton growing area as well as farmers'

184
income due to higher productivity of Bt cotton. For 67% of the farmers interviewed, cotton
area has been continuously increasing since 1997. The income from cotton played a
significant role in the investment to education, leisure and health care. The socio-economic
impacts of cotton production are nevertheless not yet optimal because there were still many
factors limiting them. Lack of labor and land were the main limiting factors. Productivity is
restrained by the high price of Bt cotton seeds which pushed farmers to keep seeds from
their own cotton production (42% of the farmers in 2002 and 2003). Farmers are still lacking
technical command in using Bt-cotton: 78% of the farmers admitted that while more than
94% of the farmers complained not getting information from local extension and technical
services. More success in using Bt-cotton calls upon going beyond providing seeds and asks
for continuous assistance from research and extension department, notably to achieve a full
knowledge of the Bt-cotton characteristic so as to optimally integrate it into the farmers’
system.
7.8 Performance of Bt Cotton in Pakistan
Hayee (2005) conducted a study entitled Cultivation of Bt Cotton Pakistan’s
Experience. Study results revealed that illegal import and multiplication of Bt cotton seed in
Sindh and Punjab provinces of Pakistan created havoc at farmers' fields. Absence of
biosafety guidelines at government level and awareness at farms level further complicated
the issue in the country. Those were the civil society organizations that brought the problem
at national as well as government level and attempted to protect the national biodiversity and
farmers' interests.
Hayee (2005) conducted a study entitled Cultivation of Bt cotton Pakistan’s
experience. The results of study revealed that illegal import and multiplication of Bt cotton
seed in Sindh and Punjab provinces of Pakistan created havoc at farmers' fields. Absence of
biosafety guidelines at government level and awareness at farms level further complicated
the issue in the country. Those were the civil society organizations that brought the problem
at national as well as government level and attempted to protect the national biodiversity and
farmers' interests. To mitigate the issue in future, the author made some recommendations

185
which are as under: There is a need to create awareness at public as well as private level
regarding safe use of biotechnology, its allied issues and their impact on various elements of
our ecosystems. Capacity building in the areas of biosafety conservation, regulations and
their effective implementation is proposed. Establishment of National Biosafety
Implementation and Monitoring Committee, comprising biological scientists, social,
political and legal personnel for effective implementation of the biosafety guidelines at
national level are also proposed. Intellectual property rights (IPR), biosafety and ethics
needs to be addressed at public and private level and must be openly debated by all the
stakeholders. Scientific research may be conducted on long-term effects of biotechnology
along with ethical and safety principle. Considering the potential risks involved in
development, release and use of transgenic organisms in the open environment, safety of
users and the environment must be ensured. There is need to develop and adopt safety
protocols during laboratory experiments as well as during eventual use of GMOs and
products derived thereof. Pharma crops using HIV-1, AIDS virus should be banned from the
open fields, as they will contaminate our food supply with dangerous consequences, not only
for human beings also for the other organisms in the food chain.
Rao (2009) assessed the performance of IR-FH-901, IR-NIBGE-2, IR-CIM-448 and
IR-CIM-443 Bt varieties planted on 8000 acres of land in season 2005-06. Study findings
revealed that adopters of Bt cotton varieties in Bahawalpur, Multan, Muzaffergarh and
Karor Pakka observed and evaluated independently its resistance and susceptibility to
different pests including factors like abiotic stress and yield than compared it with non Bt
cotton varieties grown in the same locations. A large number of farmers have visited these
fields, and become aware of the benefits of the locally developed Bt cotton.
Although germination of these Bt cotton seed varieties varied from 65 - 85 percent,
but mixing or impurities were less than 2 percent. In the beginning overall attack of
“Lashkari Sundi” “American Sundi” and other bollworms remained low as compared to
previous years but attack of sucking pests like Jassid, Whitefly, Thrips and other Aphid
were high in both Bt and non Bt cotton crops. No serious incidence of cotton leaf curl virus
disease was reported in Bt cotton varieties. Heat stress in cotton crop was also recorded in

186
different region, however no stress was observed in Bt cotton varieties.
Bt cotton varieties yielded significantly more per acre as compared to non Bt cotton
varieties - an average 23-28 maund (40 Kg) per acres versus 17-20 maund to traditional
cotton varieties. This translates into more than 30 percent increase in yield. It is noteworthy
that in Bt cotton crops average number of cotton Bolls per plant are 120 while average Boll
weight is app. 1.75 grams including seeds and number of plants per acre are as
recommended by the department of agriculture. The economical gain by using Bt cotton per
acre is more than Pak Rs. 3,000 at the market sale price of Rs. 1100/ Maund. In Pakistan
average cotton grower has 10 acres of land; increase in such small income per acre would
improve his quality of life. It is expected that cotton growers should have Bt seeds of the
above varieties for at least 75,000 acres of land in 2006-07.
PARC (2007) assessed the status of cotton harboring Bt gene in Pakistan. A survey
was conducted in the cotton growing areas of Sindh and Punjab provinces during July -
August, 2007. The major objective was to investigate the presence/absence of Cry toxin in
Bt transformed cotton. In Sindh province, ten districts (Hyderabad, Nawabshah, Sanghar,
Mirpur Khas, Dera Allah Yar, Umer Kot, Matiari, Khairpur, Sukkar, and Nowshero
Feroze) were surveyed and samples of cotton were collected from 42 different locations. It
was observed that almost 80 percent of cotton growing area in Sindh has become under Bt
cotton. Study results revealed that an exotic source of Bt cotton named as Australian Bt was
also found in the field. A very high incidence (60-100%) of CLCuV infection was observed
in Aus-Bt cotton. Similarly, eleven districts (Multan, Khanwewal, Lodhran, Bahwalpur,
Rahim Yar Khan, Vehari, Bahawalnagar, Pakpattan, Sahiwal, Jhang and Faisalabad) were
surveyed in the Punjab province and samples were collected from 84 different locations.
Almost 50 percent area has been occupied by Bt cotton in these districts. In Punjab, Bt
cotton is grown with different names, however, Bt-121 has occupied major area. A range of
segregation (10-20%) was observed in some of the fields of Bt cotton.
Five samples were randomly collected from each location. Of these five, two were
further subjected to ImmunoStrip analysis for the detection of Bt-Cry protein. The results of

187
ImmunoStrip analysis revealed that 81 percent (34/42) and 90 percent (76/84) samples from
Sindh and Punjab provinces, respectively, were positive for Bt protein. The level of Bt gene
expression varied from low (+) to high (+++) indicating that source of seed is different. All
positive samples harbored CryIAb/Ac gene, whereas, none of the sample was found to have
Cry2Ab and CryIF genes. A part of the samples within a location giving negative response
indicates the possibility of seed mixing/segregation for Bt gene. The samples showing
negative reaction in the ImmunoStrip analysis were further analyzed to confirm their
transgenic nature by ELISA for npt- II (Kanamycin) marker gene encoded protein. Overall,
Bt transgenic cotton is widely grown in the cotton growing areas of Sindh (80%) and
Punjab (50%).
7.9 Conclusions and Suggestions
Bt transgenic cotton is widely grown in the cotton growing areas of Sindh and
Punjab. The level of Bt gene expression varied from low to high indicating that source of
seed is different. ImmnunoStrip analysis revealed that only CryIAb/Ac gene is present in
exotic as well as in the local germplasm. None of the sample harbor Cry2Ab and CryIF
genes in the cotton area surveyed. A part of the samples within a location giving negative
response indicates the possibility of seed mixing/segregation for Bt gene. All the Bt
transformed germplasm is susceptible to CLCuV. The exotic germplasm was comparatively
more susceptible to CLCuV than the local. Incidence of CLCuV was higher than previous
years (farmer saying). Mealy Bug presence was clearly noticed in majority of the fields.
Irrespective of intensity/incidence, CLCuV was present in the cotton area surveyed.
Bt-Cry genes have wolrdwide proven performance to increase cotton production by
providing protection against boll worm. In order to fully utilize its potential in Pakistan,
government and all key stakeholders will have to integrate. A more efficient use of this
important biological insecticide can be achieved by adopting following measures:
National Biosafety Guidelines, 2005, must be followed to approve all genetically
modified crop varieties including cotton. This will encourage the introduction of this
advanced technology through legal means with its complete package of benefits. After

188
approval of Bt cotton cultivation by Govt. of Pakistan, R&D sector should be encouraged to
transfer Bt-Cry genes into such genetic backgrounds which: (i) must have resistance against
CLCuV (ii) are suitable for a given ecology and (iii) meet the set fiber quality parameters
(fiber length and strength, GOT% etc.) and other desirable features required for the release
of a normal commercial variety. Diversity of Bt-Cry genes has to be maintained under a
timeframe for durable resistance and to enhance the life of Bt transformed cotton varieties.
Repeated use of only one Bt gene may result in the development of cross resistance in insect
pests over a period of time.
Effective, stringent, and transparent enforcement of quarantine measures must be
observed on the import of exotic plant materials. The uncontrolled import of genetically
engineered varieties might irreversibly damage our cotton crop, just like Banana Bunchy
Top Virus from untested and non approved Australian variety of banana has done in Sindh.
The introduction of Aus-Bt cotton in Sindh province, which is highly susceptible to CLCuV,
will increase the inoculum pressure. This will play a role in the evolution of new virus strain
as it has happened in case of “Burewala virus” resulting in huge losses to cotton crop in the
country.
Expression of Bt-Cry genes in the approved cotton varieties need to be continuously
monitored during the crop growing season and over the years according to standards
described in this report. A threshold level of Bt toxin “Cry-protein” is very crucial as
extremely low level of toxin may lead to the development of cross resistance. There is a
need to develop awareness among the farmers regarding the appropriate management
practices for fully utilizing the Bt potential taking into account the ineffectiveness of Bt
against sucking insects pests which require conventional pest management measures.

189
References
Barton, K., Whitley, H., Yang, N.S. 1987. Bacillus thuringiensi - endotoxins in
transgenic Nicotiana tabaccum provides resistance to Lepidopteran pests. Plant Physiol., 85,
1103-1109.
Batie, S.S. and D.E. Ervin (2001), ‘Transgenic crops and the environment: missing
markets and public roles’, Environment and Development Economics 6: 435–457.
Benbrook, C. (2001), ‘Do GM crops mean less pesticide use?’, Pesticide Outlook
12:204–207.
Carpenter, J., A. Felsot, T. Goode, M. Hammig, D. Onstad, and S. Sankula (2002),
Comparative Environmental Impacts of Biotechnology-derived and Traditional Soybean,
Corn, and Cotton Crops, Ames: Council for Agricultural Science and Technology.
Chaturyedi, S. 2002. Agricultural biotechnology and new trends in IPR regime:
Challenges before developing countries, Economic and Political Weekly, 37, 13, March 30.
Frisvold, G.B. and Reeves, J.M. 2007. Economy-wide impacts of Bt cotton.
Proceedings of the Beltwide Cotton conferences, January 2007.
Gandhi, V.P. and Namboodiri, N.V. 2006. The adoption and economics of Bt cotton
in India: Preliminary results from a study. Indian Institute of Management, Ahmedabad,
India.
Government of Pakistan (2009). Economic Survey of Pakistan, Economic Advisor’s
Wing, Finance Division, Government of Pakistan, Islamabad.
GRAIN (2001), ‘Bt cotton through the back door’, Seedling 18, Barcelona: Genetic
Resources Action International.

190
Hayee, A. 2005. Cultivation of Bt cotton Pakistan’s experience. Actionaid,
Islamabad, Pakistan, 2005
Hofs, J.L., Fok, M., Vaissayre, M. 2006. Impact of Bt cotton adoption on pesticide
use by smallholders: A 2-year survey in Makhatini Flats (South Africa). Crop protection, 25:
984-988.
Hoftey, H., Whitley, H.R. 1989. Insecticidal crystal proteins of Bacillus
thuringiensis. Microbiol. Rev., 53, 242-255.
Huang, J., S. Rozelle, C. Pray, and Q. Wang (2002a), ‘Plant biotechnology in China’,
Science 295: 674–677.
Isma¨el,Y., R. Bennett, and S.Morse (2002), ‘Benefits fromBt cotton use by
smallholder farmers in South Africa’, AgBioForum 5: 1–5.
Neale, , M.C. 1997. Bio-pesticides- hormonisation of registration requirements
within EU directive 91-414. An industry view. Bulletin of European and Mediterranean
Plant Protection Organization, 27, 89-93.
PARC. 2007. Status of cotton harboring Bt gene in Pakistan. Plant Biotechnology
Program, Institute of Agri-Biotechnology and Genetic resources, National Agricultural
Research Centre, Islamabad.
Pray, C.E., J. Huang, R. Hu, and S. Rozelle (2002), ‘Five years of Bt cotton in China
– the benefits continue’, The Plant Journal 31: 423–430.
Qaim, M., Zilberman, D. 2003. Yield effects of genetically modified crops in
developing countries. Science 299, 900-902.

191
Qaim, M., Cap, E.J. and de Janvry, A. 2003. Agronomics and sustainability of
transgenic cotton in Argentina. AgBioForum, 6(1&2): 41-47.
Qaim, M. and de Janvry, A. 2003. Genetically modified crops, corporate pricing
strategies, and farmers’ adoption: The case of Bt cotton in Argentina. Amer. J. Agr. Econ.
85(4) (November 2003): 814-828.
Qaim, M. and de Janvry, A. 2004. Cheaper GM seeds could boost adoption, farm
benefits and company profits: The case of Bt cotton in Argentina. Crop Biotech Brief,
Vol.IV, No.1, 2004.
Qaim, M. and de Janvry, A. 2005. Bt cotton and pesticide use in Argentina:
Economic and environmental effects. Environment and Development Economics 10: 179-
200.
Rao, I.A. 2009. First Bt cotton grown in Pakistan. Pakissan.com
Schnepf, H.E., Whitley, H.R. 1981. Cloning and expression of Bacillus thuringiensis
crystal protein gene in E. coli. Proc. Natl.Acad. Sci. USA, 78, 2893-2897.
Traxler, G., S. Godoy-Avila, J. Falck-Zepeda, and J. Espinoza-Arellan (2001),
TransgenicCotton in Mexico: Economic and Environmental Impacts, Auburn: Auburn
University.
UK Soil Association (2002), Seeds of Doubt: North American Farmers Experience
of GM Crops, Bristol: UK Soil Association.
Wang, G., Wu, Y. Gao, W., Fok, M. and Liang, W. 2008. Impact of Bt cotton on the
farmer’s livelihood system in China. ISSCRI International Conference “Rationales and
evolutions of cotton policies”, Montpellier, May 13-17, 2008.

192
CHAPTER 8
CONCLUSIONS AND RECOMMENDATIONS
Cotton- Textile and Apparel sector is the largest sector of the country’s export
earnings with more than 60 percent share. Cotton contributes 8.6 percent of the value added
in agriculture and around 1.8 percent to GDP. Cotton is the principal cash crop of Pakistan,
second to wheat also acts as source employment to the country labor force especially in
rural areas.
Pakistan is the 4th largest producer after USA, China and India with 12 percent share
in the world. Pakistan Cotton-Textile manufacture export consists of Cotton Yarn, Cotton
Cloth, Knit wear, Bed wear, Towels, Tents, Canvas and Tarpaulin, Ready made Garments,
Synthetic Textiles and Made up Articles.
Pakistan has great potential for exporting cotton and cotton manufacturing
especially after phasing out of the Agreement on Textile and Clothing (ATC), which
replaced the Multi-Fiber Arrangement (MFA) in 1995. Due to this, exports of many cotton
producing countries went up. China’s exports continued to increase the market share in all
major developed import markets. The combined textiles imports of the three economies:
Canada, the United States and the EU from China rose by 41 per cent in 2005. Interestingly,
some smaller suppliers expanded their textiles and clothing exports even faster than China
and the share of least developed countries in imports of the United States and the European
Union went up in 2006. Imports of textiles and clothing have increased by 5.5 per cent, to
about $350 billion in 2006 for the four major developed markets. The increase was slightly
faster than the preceding year.
In the US market, China gained as a leading supplier, but at the same time imports
from smaller Asian suppliers also rose rather faster than those from China. There was a
sharp rise of EU clothing imports from Hong Kong and China in 2006. Among the
developed markets Japan’s textiles and clothing imports are mainly concentrated on China
193
because of geographic proximity and the absence of import quotas in the past. More than
three-quarters of Japan’s textiles and clothing imports came from China in 2006. Most
significantly, the share of imports of clothing was more than 80 per cent.
Amongst the four major developed markets, Canada was on the top in textiles and
clothing imports in 2006. Its imports from China went up by more than 20 per cent. As a
whole 2006 was a very favorable one for the textile trade of the developing countries.
Pakistan’s share grew by 12 percent each in US and EU markets, followed by 9 percent in
Canada market, and -7 in Japan market during 2006 as compare to previous year.
Nonetheless Pakistan has greater opportunities in exporting cotton and cotton
manufacturing but it is unfortunate and unfavorable that these exports concentrate on few
regions like USA, Canada, Japan, KSA, and UAE. Pakistan has to diversify its export on
other regions and countries
Analytical findings reveal that Pakistan has comparative edge on the basis of
Comparative Advantage, Reveal Comparative Advantage, Relative Trade Advantage, and
Trade Complementarities. The estimated value of revealed comparative advantage of cotton
in Pakistan is 18 which is very high than unity. This value reveals that Pakistan has great
opportunities in the export of cotton and cotton manufacturing. Moreover, the estimated
values of balasa and Lafay index for all cotton and cotton products is very high which
reveal that Pakistan has trade competitiveness in the cotton and cotton manufacturing. The
estimated value of relative trade index for primary products, cotton seed, cake of cotton seed
and cotton linter, are positive which imply that these products are highly competitive, while
oil of cotton seed and cake of cotton seed are uncompetitive. Furthermore, the value of trade
complementarities variable for USA, EU, Japan and Canada (trading countries) are greater
than unity except SAARC countries. This means that trading with SAARC countries in
cotton and cotton products is less profitable as compared to other countries where cotton
trading is highly profitable. Still domestic resource cost analysis (DRC) proves that Pakistan
has greater opportunities in cotton production. The values of reveal comparative advantage
and relative trade advantage further suggest that Pakistan has greater opportunities and

194
prospects for exporting cotton and cotton manufacturing. Similarly trade complementarities
show and suggest that Pakistan should focus on Middle east market with highest trade
complementarities, followed by Canada, USA, EU, SAARC countries and then Japan.
Bt transgenic cotton is widely grown in the cotton growing areas of Sindh and
Punjab. Bt cotton can play a significant role to enhance agricultural productivity as the
productivity of cotton in Pakistan is 0.5 ton/ha as compared productivity of Bt cotton in
China is 9 ton/ha which implies a huge cotton productivity gap. This gap can be narrowed
down by the adoption of Bt cotton in Pakistan which will have major impact on food
security efforts in the country.
8.1 Recommendations
Though Pakistan has great opportunities and also has the market potential for exporting
cotton and cotton manufacturing but after the termination of MFA, Pakistan now faces
greater competitions and tough time with other cotton producing countries especially
neighboring China and India. Keeping in view the present scenario the following
recommendations are extended for better and long term export prospects for Pakistan cotton
sector to remain in, in the world market.
• Cost efficiency: low cost of production is the first step for competitiveness. To fetch
greater margin and gaining from competition our cost of cotton production must be
low. Pakistan has the advantage of economical harvesting as this activity is almost
labor intensive. Similarly low cost production technology especially plant protection
measures should be economical.
• Higher productivity with quality of cotton: Adoption of BT cotton in compliance
with SPS measures and IPM practices will enhance cotton productivity and
consequently its exports. Effective, stringent, and transparent enforcement of
quarantine measures must be observed on the import of exotic plant materials. The
uncontrolled import of genetically engineered varieties might irreversibly damage
195
our cotton crop, just like Banana Bunchy Top Virus from untested and non approved
Australian variety of banana has done in Sindh. The introduction of Aus-Bt cotton in
Sindh province, which is highly susceptible to CLCuV, will increase the inoculum
pressure. This will play a role in the evolution of new virus strain as it has happened
in case of “Burewala virus” resulting in huge losses to cotton crop in the country.
Expression of Bt-Cry genes in the approved cotton varieties need to be continuously
monitored during the crop growing season and over the years according to standards
described in this report. A threshold level of Bt toxin “Cry-protein” is very crucial as
extremely low level of toxin may lead to the development of cross resistance. There
is a need to develop awareness among the farmers regarding the appropriate
management practices for fully utilizing the Bt potential taking into account the
ineffectiveness of Bt against sucking insects pests which require conventional pest
management measures.
• Diversification: Pakistan total export in general and cotton and cotton
manufacturing export in special are concentrated on few region/countries. These
region/countries are namely, USA, Canada, Japan, EU, KSA, and UAE. There are
only five countries that produce about 97 percent of the world cotton while the rest
are cotton importers. Pakistan should explore other markets especially the Latin
American countries and African countries for sustainable export earnings.
• Policy formulation: Government should adopt export oriented policies with more
focus on value chain rather than raw material exports. Bangladesh imports raw
cotton and cotton yarn and export cotton manufacturing more than Pakistan. The
cancer of subsidy to textile is long time debatable issue in Pakistan. The argument of
infant industry is no more valid for textile industry. To make this industry more
competitive government should gradually withdraw subsidy. The exporters should be
facilitated with easy non-trade barriers and unnecessary formalities.
Output is always uncertain and input is always certain and expensive. To make a
dynamic policy, negative aspects (thou shall not etc) needs to be taken out and

196
positive dimensions brought in. The underlined philosophy of new liberalism is that
the individuals have to censor themselves; there can not be any market oriented
external censor.
• Market prospects: The agricultural attaché in all embassies of Pakistan abroad
should be eminent agricultural scientists and they should advocate for better market
ties through different means. They should annually organize cotton based products
fair and exhibitions. They should also make arrangements for delegates to visit
Pakistan textile industries and should arrange visits of Pakistani exporters to their
working countries.
• Pakistan’s participation in international trade has paid dividends and has led the
country to improvements in its economy. From a low income country Pakistan has
come up to a middle income country with per capita of over $ 800, (Chapter Six:
6:12: refers). Per capita income that was only $79 in 1950 went up to more than $
800 in 2006.
8.2 Future Research
The researcher ends research with the motivation and aim to start a new research on
trade and development to devise and design a practical model for trade diversification and
mainstreaming trade in poverty alleviation policies. Models are never static but fulfill a
purpose and that is to enable future improvement and additions.
Pakistan has huge untapped potential. So far, a single sector of economy; Cotton,
Textile and Apparel sector has contributed in scaling Pakistan from a low income country to
a middle income one. Indigenous trade initiatives and technologies can lead to creation of a
trade regime that underscores the National goals of sustainable economic growth leading to
socio economic development of the People of Pakistan, and to positioning Pakistan as a
reliable trading partner, and a hub of economic activity.

197
Hypothesis is proven that international trade can help the country to work its
strengths and develop itself. This despite the fact that Pakistan’s major export is based on
Cotton- Textile and Apparel Products, however, it also poses a threat that in case Pakistan
has to carry on this trend then it must diversify its trade and not be dependent on Cotton -
Textile and Apparel sector alone. Economy is always a moving target. The goal post will
always and continuously keep on shifting, and policy and strategies must be evolutionary so
that one continues work through the current trend.

APPENDICES

xxii
INSTALLED CAPACITY IN THE TEXTILE SECTOR (For month of Dec 2007)
S.No Name of Mills Location SPINDLE ROTOR Status 1 A.A COTTON MILLS BHAIPHERU 22672 0 2 A.A SPINNING MILLS KHURRIANWALA 50544 0
3 A.A.TEXTILE LTD.NO.1 (IBRAHIM FIBR) FAISALABAD 19008 0
4 A.A.TEXTILE LTD.NO.2 (IBRAHIM FIBR) FAISALABAD 21600 0
5 A.J.SPG.MILLS (HIMALIYA) SHEIKHUPURA 15840 0
6 A.J.TEXTILE MILLS LTD GADOON AMAZAI 47520 0
7 A.M.Z.SPG.& WVG.MILLS(KARIM) KOTRI 24960 0 CLOSED
8 ABBAS SPINNING & WVG MILLS KOTRI 13872 0
9 ABBASI TEXTILE MILL RAHIMYAR KHAN 49384 0 CLOSED
10 ABDULLAH TEXTILE MILLS LTD. MIANCHUNNU 7008 1600
11 ACCORD TEXTILES LTD KAMALIA 19200 0 12 ADIL TEXTILE MILLS BHIKKI 17280 0
13 ADNAN TEXTILE MILLS LTD. KARACHI 0 2496
14 AGAR TEXTILES L (CALICO) KOTRI 13056 0
15 AHMAD DIN TEX.MILLS (RAO) FAISALABAD 18720 0
16 AHMAD HASSAN TEXTILE CHOWK SARWAR 17640 0
17 AHMED FINE TEXTILE MILLS LTD. RAHIMYAR KHAN 22560 0
18 AHMED ORIENTAL TEXTIL RAHIMYARKHAN 17496 0
19 AISHA COTTON MILLS SITE 17952 0 20 AKRAM INDUSTRIES LTD HABIBABAD 22560 0
21 AL MOQEET TEXTILE MILLS NOORIABAD 19008 0
22 AL TEXTILES LTD. LAHORE 20160 0
23 AL ZAMIN TEXTILE MILLS(MUSTAFA) KHURRIANWALA 14400 0 CLOSED
24 AL-AHMAD TEXTILE MILL NOORIABAD 0 1200 CLOSED 25 ALAM COTTON MILLS R/MANGA ROAD 30240 26 ALAM SPINNING MILLS LAHORE 18000 0 27 AL-AZHAR TEXTILE MILL BAHAWALPUR 19560 0
28 AL-BASIT TEXTILE MILLS LTD (COTEX) NOORIABAD 0 1544
29 ALHAMD TEXTILE MILLS D.G.KHAN 121080 0 30 ALI AKBAR SPINNING FEROZWATTOAN 24480 0 31 ALI ASGHAR TEXTILE KARACHI 34000 0 32 ALI HAQ TEXTILE MILLS LAHORE 0 3600 33 ALI TEXTILE (JHANG) JHANG 25992 0 34 AL-KARAM TEXTILE NO.1 LANDHI 62400 0
35 AL-KARAM TEXTILE NO.2(AMNA IND.) LANDHI 20664 0
36 ALLAWASAYA TEXTILE MULTAN 28672 0

xxiii
MILLS 37 ALLIANCE TEXTILE MILL JHELUM 28704 0 38 AL-NASR TEXTILES LTD. MANGA RWROAD 41376 0 39 AL-QADIR TEXTILE MILL CHAKWAL 36240 0 40 AL-QAIM TEXTILE MILL CHAKWAL 26880 0 41 AMER COTTON MILLS JAMBER 23424 0 42 AMIN SPINNING MILLS MIRPUR 12480 0 43 AMIN TEXTILE MILL NO2 SHEIKHUPURA 31116 0 44 AMIN TEXTILE MILLS KOTRI 17056 0 45 AMJAD BROTHERS LTD. KASUR 0 600 46 AMJAD TEXTILE MILLS BASTI MALUK 33408 0
47 AMNA INDUSTRY (AL-KARAM-2) LANDHI 20664 0
48 AMNA TEXTILE INDUSTRIES FAISALABAD 7680 0
49 AMSA TEXTILE MILLS F.B.AREA 0 1600 CLOSED 50 AMTEX PVT. LTD. FAISALABAD 27600 2100
51 ANMOL TEXTILE MILLS(OKARA) OKARA 37440 0
52 ANNOOR TEXTILE MILL DHABEJI 20880 0 CLOSED 53 ANOUD TEXTILE MILLS NOORIABAD 23664 0 54 ANWAR TEXTILE MILLS DHABEJI 21468 0
55 APOLLO TEXTILE MILLS LTD.NO.3 MUZAFFARGARH 22080 0
56 APOLLO TEXTILE NO.1 MUZAFFARGARH 16800 0 57 APOLLO TEXTILE NO.2 MUZAFFARGARH 18240 0 58 ARAIN FIBRES LTD. D.G.KHAN 21120 0 59 ARAIN MILLS LTD BASTI MALANA 20160 0 60 ARAIN TEXTILE MILLS D.G.KHAN 18240 0 61 AREEHA (PVT.) LTD. BASTIMANALA 20106 0 62 ARSHAD TEXTILE MILLS JARANWALA 17496 0 63 ARSHAD USMAN TEXTILE SHEIKHUPURA 17184 0
64 ARTISTIC DENIM MILLS LTD. KARACHI 11600 864
65 ARTISTIC MILLINERS (SPINNING) KARACHI 10296 768
66 ARUJ TEXTILE MILL DINANATH 12480 0
67 ASHER IMRAN SPG.MILLS(HALA) PHOLNAGAR 16800 0
68 ASHIANA COTTON PROD. JHANG 24240 0 69 ASHRAF SPINNING LAHORE 0 1000 70 ASIM TEXTILE MILLS KHURRIANWALA 19200 0 71 ASLAM TEXTILE MILLS JARANWALA 15360 0
72 ATARA TARPAULINE &TEX KAHNA NAU 0 1960 CLOSED
73 ATTOCK TEXTILE MILLS JAND 12480 0 CLOSED 74 AWAIS QURNI SPINNING SARGODHA 0 1200 75 AYESHA SPINNING MILLS SHEIKHUPURA 41032 0 76 AYESHA TEXTILE NO.1 ISMAILABAD 41580 0 77 AYESHA TEXTILE NO.2 SHEIKHUPURA 31356 0 78 AZAD TEXTILE MILLS MANGLA BHONG 25296 0 79 AZAM RAZA TEXTILE LAHORE 0 0

xxiv
80 AZAM TEXTILE MILLS PHOLNAGAR 19200 0
81 AZGARD NINE LIMITED (LAGLER) MANGA 0 672
82 AZIZ SPINNING MILLS RAIWIND 17280 0 83 AZIZ SPUNTEX (PVT)LTD MUZAFFARGARH 0 600 CLOSED 84 AZMAT TEXTILE MILLS DHABEJI 24864 0 CLOSED 85 BABRI COTTON MILLS KOHAT 54288 0 86 BAIG SPINNING MILLS SITE 15192 0
87 BAJWA SPINNING MILLS(TEX.CORP.) HYDERABAD 12400 0 CLOSED
88 BASHIR COTTON MILLS NANKANA 20640 0 89 BEXITEX LTD. LAHORE 0 780 90 BHANERO TEXTILE NO.1 KOTRI 26304 192 91 BHANERO TEXTILE NO.2 FEROZWATTOAN 41472 0 92 BILAL FIBRES LTD. JARANWALA 29016 0 93 BILAL SPINNING MILLS PHOLNAGAR 40160 0 94 BILAL TEXTILE MILLS FAISALABAD 20640 95 BISMA TEXTILE MILLS FEROZWATTOAN 17136 0
96 BISMILLAH TEXTILE MILLS FAISALABAD 9144 164
97 BLESSED TEXTILES LTD FEROZWATTOAN 23376 0 98 BLUE STAR SPINNING LAL SOHANRA 15360 0
99 BROTHERS COTTON INDUSTERY KARACHI 0 0 CLOSED
100 BROTHERS TEXTILE MILL PHOLNAGAR 17280 0
101 BUREWALA TEXTILE MILL DAWOODABAD 42912 0
102 C.A TEXTILE MILLS SHEIKHUPURA ROAD 13728 0 103 CENTRAL COTTON NO.3 KOTRI 14384 0 CLOSED 104 CENTRAL COTTON NO.4 KOTRI 12544 0 CLOSED 105 CENTRAL COTTON NO1&2 DHABEJI 26904 0 CLOSED 106 CENTRAL FIBRE IND. MARIPUR ROAD 8576 0
107 CHAKWAL SPINNING MILL PHOLNAGAR 33960 0
108 CHAKWAL TEXTILE MILLS CHAKWAL 16932 0
109 CHAUDHARY FIBERS MULTAN 0 400 CLOSED
110 CHAUDHRY TEXTILE MILL SHEIKHUPURA 5928 2000
111 CHAWLA SPINNING MILLS FAISALABAD 25000 0 112 CHENAB LTD. TOBATEKSINGH 19200 0 113 CHINIOT TEXTILE MILLS PHOLNAGAR 18456 0 114 CHIRAGH TEXTILE MILLS MANGA RWROAD 20184 0
115 CHOTI TEXTILE MILLS(GHAZI) D.G.KHAN 39696 0
116 COLONY INDUSTRIES(SHEIKH) MANGA RWROAD 34104 0
117 COLONY SARHAD TEXTIL ISMAL KOT 24960 0 118 COLONY TEXTILE MILLS MULTAN 186576 0
119 COLONY THAL TEXTILE MILLS ISMAIL PUR 28896 408
120 COMFORT KNITWEARS LTD FEROZPUR ROAD 17592 0
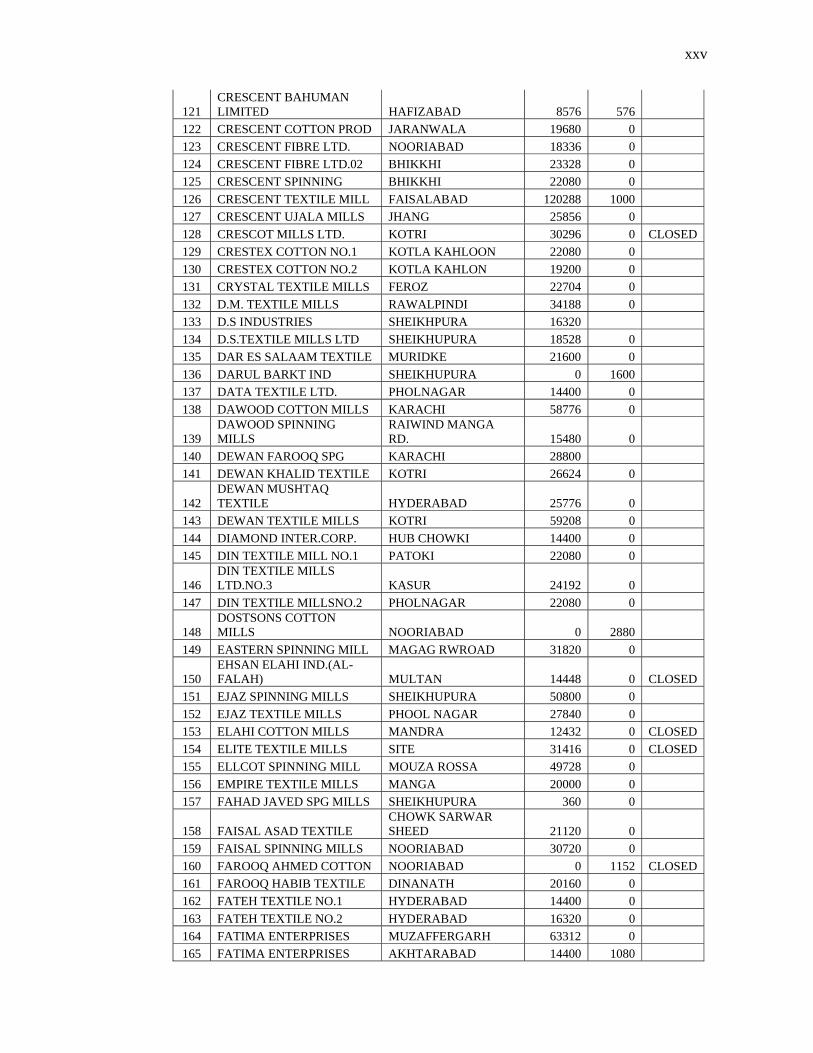
xxv
121 CRESCENT BAHUMAN LIMITED HAFIZABAD 8576 576
122 CRESCENT COTTON PROD JARANWALA 19680 0 123 CRESCENT FIBRE LTD. NOORIABAD 18336 0 124 CRESCENT FIBRE LTD.02 BHIKKHI 23328 0 125 CRESCENT SPINNING BHIKKHI 22080 0 126 CRESCENT TEXTILE MILL FAISALABAD 120288 1000 127 CRESCENT UJALA MILLS JHANG 25856 0 128 CRESCOT MILLS LTD. KOTRI 30296 0 CLOSED 129 CRESTEX COTTON NO.1 KOTLA KAHLOON 22080 0 130 CRESTEX COTTON NO.2 KOTLA KAHLON 19200 0 131 CRYSTAL TEXTILE MILLS FEROZ 22704 0 132 D.M. TEXTILE MILLS RAWALPINDI 34188 0 133 D.S INDUSTRIES SHEIKHPURA 16320 134 D.S.TEXTILE MILLS LTD SHEIKHUPURA 18528 0 135 DAR ES SALAAM TEXTILE MURIDKE 21600 0 136 DARUL BARKT IND SHEIKHUPURA 0 1600 137 DATA TEXTILE LTD. PHOLNAGAR 14400 0 138 DAWOOD COTTON MILLS KARACHI 58776 0
139 DAWOOD SPINNING MILLS
RAIWIND MANGA RD. 15480 0
140 DEWAN FAROOQ SPG KARACHI 28800 141 DEWAN KHALID TEXTILE KOTRI 26624 0
142 DEWAN MUSHTAQ TEXTILE HYDERABAD 25776 0
143 DEWAN TEXTILE MILLS KOTRI 59208 0 144 DIAMOND INTER.CORP. HUB CHOWKI 14400 0 145 DIN TEXTILE MILL NO.1 PATOKI 22080 0
146 DIN TEXTILE MILLS LTD.NO.3 KASUR 24192 0
147 DIN TEXTILE MILLSNO.2 PHOLNAGAR 22080 0
148 DOSTSONS COTTON MILLS NOORIABAD 0 2880
149 EASTERN SPINNING MILL MAGAG RWROAD 31820 0
150 EHSAN ELAHI IND.(AL-FALAH) MULTAN 14448 0 CLOSED
151 EJAZ SPINNING MILLS SHEIKHUPURA 50800 0 152 EJAZ TEXTILE MILLS PHOOL NAGAR 27840 0 153 ELAHI COTTON MILLS MANDRA 12432 0 CLOSED 154 ELITE TEXTILE MILLS SITE 31416 0 CLOSED 155 ELLCOT SPINNING MILL MOUZA ROSSA 49728 0 156 EMPIRE TEXTILE MILLS MANGA 20000 0 157 FAHAD JAVED SPG MILLS SHEIKHUPURA 360 0
158 FAISAL ASAD TEXTILE CHOWK SARWAR SHEED 21120 0
159 FAISAL SPINNING MILLS NOORIABAD 30720 0 160 FAROOQ AHMED COTTON NOORIABAD 0 1152 CLOSED 161 FAROOQ HABIB TEXTILE DINANATH 20160 0 162 FATEH TEXTILE NO.1 HYDERABAD 14400 0 163 FATEH TEXTILE NO.2 HYDERABAD 16320 0 164 FATIMA ENTERPRISES MUZAFFERGARH 63312 0 165 FATIMA ENTERPRISES AKHTARABAD 14400 1080
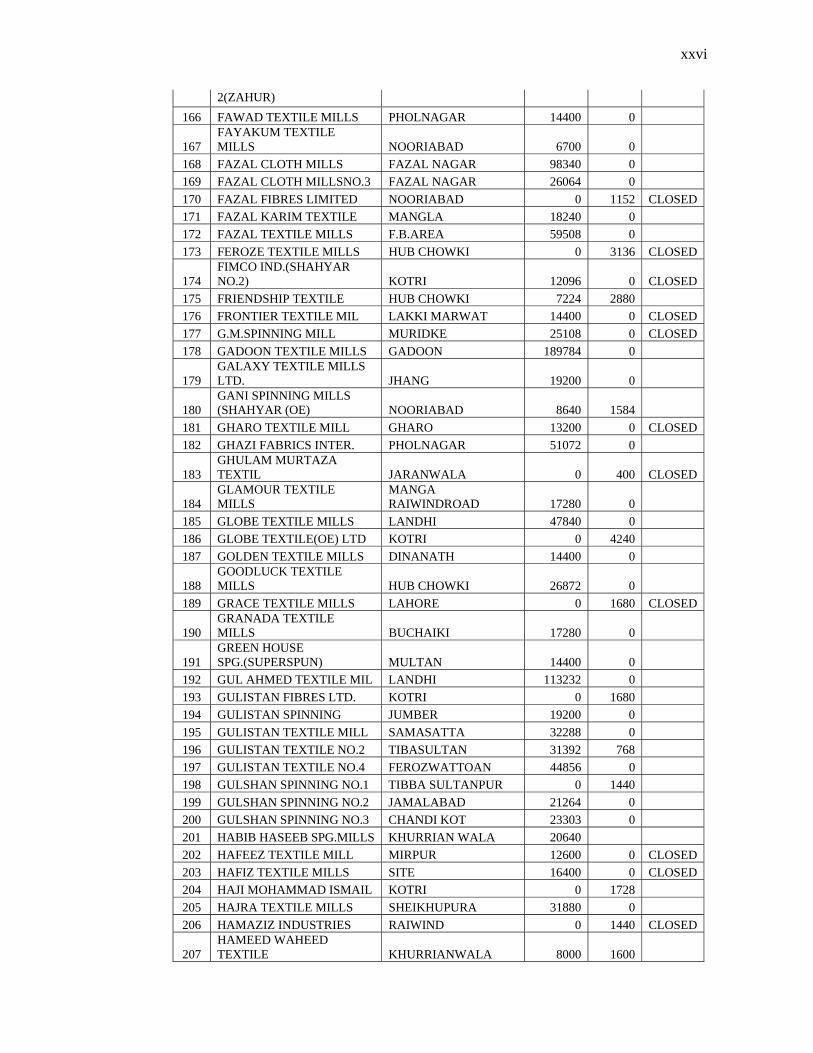
xxvi
2(ZAHUR) 166 FAWAD TEXTILE MILLS PHOLNAGAR 14400 0
167 FAYAKUM TEXTILE MILLS NOORIABAD 6700 0
168 FAZAL CLOTH MILLS FAZAL NAGAR 98340 0 169 FAZAL CLOTH MILLSNO.3 FAZAL NAGAR 26064 0 170 FAZAL FIBRES LIMITED NOORIABAD 0 1152 CLOSED 171 FAZAL KARIM TEXTILE MANGLA 18240 0 172 FAZAL TEXTILE MILLS F.B.AREA 59508 0 173 FEROZE TEXTILE MILLS HUB CHOWKI 0 3136 CLOSED
174 FIMCO IND.(SHAHYAR NO.2) KOTRI 12096 0 CLOSED
175 FRIENDSHIP TEXTILE HUB CHOWKI 7224 2880 176 FRONTIER TEXTILE MIL LAKKI MARWAT 14400 0 CLOSED 177 G.M.SPINNING MILL MURIDKE 25108 0 CLOSED 178 GADOON TEXTILE MILLS GADOON 189784 0
179 GALAXY TEXTILE MILLS LTD. JHANG 19200 0
180 GANI SPINNING MILLS (SHAHYAR (OE) NOORIABAD 8640 1584
181 GHARO TEXTILE MILL GHARO 13200 0 CLOSED 182 GHAZI FABRICS INTER. PHOLNAGAR 51072 0
183 GHULAM MURTAZA TEXTIL JARANWALA 0 400 CLOSED
184 GLAMOUR TEXTILE MILLS
MANGA RAIWINDROAD 17280 0
185 GLOBE TEXTILE MILLS LANDHI 47840 0 186 GLOBE TEXTILE(OE) LTD KOTRI 0 4240 187 GOLDEN TEXTILE MILLS DINANATH 14400 0
188 GOODLUCK TEXTILE MILLS HUB CHOWKI 26872 0
189 GRACE TEXTILE MILLS LAHORE 0 1680 CLOSED
190 GRANADA TEXTILE MILLS BUCHAIKI 17280 0
191 GREEN HOUSE SPG.(SUPERSPUN) MULTAN 14400 0
192 GUL AHMED TEXTILE MIL LANDHI 113232 0 193 GULISTAN FIBRES LTD. KOTRI 0 1680 194 GULISTAN SPINNING JUMBER 19200 0 195 GULISTAN TEXTILE MILL SAMASATTA 32288 0 196 GULISTAN TEXTILE NO.2 TIBASULTAN 31392 768 197 GULISTAN TEXTILE NO.4 FEROZWATTOAN 44856 0 198 GULSHAN SPINNING NO.1 TIBBA SULTANPUR 0 1440 199 GULSHAN SPINNING NO.2 JAMALABAD 21264 0 200 GULSHAN SPINNING NO.3 CHANDI KOT 23303 0 201 HABIB HASEEB SPG.MILLS KHURRIAN WALA 20640 202 HAFEEZ TEXTILE MILL MIRPUR 12600 0 CLOSED 203 HAFIZ TEXTILE MILLS SITE 16400 0 CLOSED 204 HAJI MOHAMMAD ISMAIL KOTRI 0 1728 205 HAJRA TEXTILE MILLS SHEIKHUPURA 31880 0 206 HAMAZIZ INDUSTRIES RAIWIND 0 1440 CLOSED
207 HAMEED WAHEED TEXTILE KHURRIANWALA 8000 1600

xxvii
208 HAMID TEXTILE MILLS WAN-ADHAN 0 1344 209 HAMRAZ INDUSTRIES MIRPUR SAKRO 0 1600 CLOSED 210 HAQ TEXTILE MILLS KHURRINWALA 0 864 CLOSED 211 HARAPPA TEXTILE MILL HARAPPA 18480 0
212 HARUM TEXTILE MILLS (NAYAB) KOTLA KAHLOON 19200 0
213 HASEEB SPINNING MILLS NIA LAHORE 19184 0
214 HASHIR TEXTILE MILLS (MOHIB) MUZAFFARGARH 104280 0 CLOSED
215 HASHMI SPINNING MILLS(CAPITAL) RAJA JANG 17280 0
216 HASSAN SPINNING MILL KHURRIANWALA 23040 0 217 HATTAR TEXTILE MILLS GADOON AMAZI 19200 0
218 HIRA SPINNING(SHARIF) RAIWIND/MANGA RD. 21120 0
219 HI-TECH SPINNING MILL MANGA RAIWIND ROAD 0 1800
220 HUSAIN INDUSTRIES LANDHI 28840 0 221 HUSSAIN MILLS LTD. FAZALABAD 28808 2000 222 IBRAHIM TEXTILE NO.1 KHURRIANWALA 21600 0 223 IBRAHIM TEXTILE NO.2 KHURRIANWALA 17280 0 224 IBRAHIM TEXTILE NO.3 KHURRIANWALA 19200 0 225 IDEAL SPINNING MILLS SHEIKHUPURA ROAD 16464 0 226 IDREES TEXTILE MILLS FEROZWATTOAN 27684 0
227 IHSAN COTTON PRODUCTS MANGA RAIWIND 0 2664
228 IHSAN RAIWHND MILLS KASUR 6048 0 229 IIS TEXTILE (RAINBOW) PHOLNAGAR 0 3200 230 IMPERIAL TEXTILE MILL KHANPUR SHAMALI 16464 0
231 IMTIYAZ TEXTILE MILLS(HAJI A.D) CHICHAWATNI 0 800 CLOSED
232 INDUS DYG.& MFG.CO. BAGGASHER 62912 0
233 INDUS DYG.& MFG.CO.LTD HYDERABAD 20448 0
234 INDUS SPINNING MILL HYDERABAD 12048 0 CLOSED 235 INDUS TEXTILE MILL HYDERABAD 24800 0 CLOSED 236 INTERNATIONAL TEXTILE KORANGII 0 1080 237 ISHAQ TEXTILE MILLS JARANWALA 16320 0 238 ISHTIAQ TEXTILE MILL NOORIABAD 17280 0 239 ISLAND TEXTILE MILLS KOTRI 19200 0
240 ITTEFAQ TEXTILE NO.3(MARRIYAM) PHOLNAGAR 17280 0
241 J.A.TEXTILE MILLS FAISALABAD 20760 0 242 J.K.FIBRE MILL( SHAHID) FAISALABAD 44808 0 243 J.K.SPINNING (ZEESHAN) KHURRIANWALA 15360 0
244 JAHANIAN FIBRE (PVT.) LTD. JAHANIAN 0 600
245 JAKKEY TEXTILE MILLS SITE 0 1100 246 JAMHOOR TEXTILE MILLS MIAN CHANNU 24960 0 247 JAMIA SPG & WVG MILLS SITE 0 1024 CLOSED 248 JANANA DE MALUCHO KOHAT 70896 200 249 JUBILEE SPG&WVG MILLS SITE 22388 0 250 JUNAID COTTON MILL KOTRI 13456 0 CLOSED

xxviii
251 JUPITER TEXTILE MILLS LTD. HYDERABAD 0 0 CLOSED
252 KAMAL SPINNING MILLS FAISALABAD 9360 0 CLOSED 253 KAMANI TEXTILE MILL MANDRA 12480 0 CLOSED 254 KASHIR TEXTILE MILLS SHAHKOT 17280 0 255 KASHMIR TEXTILE MILL MIRPUR 12600 0 256 KASSIM TEXTILE MILLS LANDHI 0 1464 257 KHALID NAZIR SPINNING KAMOKE 17280 0 258 KHALID SHFIQUE SPG. RUSSA VILLAGE 19200 0
259 KHALID SIRAJ TEXTILE MILLS LTD. PHOOL NAGAR 17280 0
260 KHAS TEXTILE MILLS NOORIABAD 0 2464 261 KHAWAJA SPINNING MILL EMINABAD 20376 0 262 KHAWAJA TEXTILE MILLS BHIMBER 12480 0
263 KHOKHAR TEXTILE MILLS D.D. PANAH ROAD 15360 0
264 KHURSHID SPINNING MIL KHURIANWALA 14400 0 265 KHYBER SPINNING MILLS GADOON 23040 0 266 KHYBER TEXTILE MILLS BALDHER 51240 0 267 KOHAT TEXTILE MILLS SAIFABAD 44400 0 268 KOHINOOR INDUSTRIES FAISALABAD 71648 0 269 KOHINOOR SPINNING NO3 CHAKWAL 28800 0 270 KOHINOOR SPINNING1&2 CHAKWAL 45216 0 271 KOHINOOR TEXTILE MILL RAWALPINDI 133675 0 272 KOHINOOR(GUJAR KHAN) GUJAR KHAN 56592 0 273 KOTRI TEXTILE MILL DHABJI 12400 0 CLOSED 274 KUNJAH TEXTILE MILLS MANGOWAL 40320 0 275 LAHORE SPINNING MILLS PHOLNAGAR 12500 0 CLOSED
276 LAHORE TEX.&GEN MILL(MARGALA 3) MURIDKE 15816 0
277 LAHORE TEX.&GEN.NO.2 MURIDKE 29904 0 278 LATIF COTTON MILLS NOORIABAD 25104 1152 279 LATIF FIBERS LTD. NOORIABAD 26016 0 280 LATIF SHAKIR TEXTILE GADOON 14400 0 281 LATIF SPINNING MILLS LANDHI 10560 0 CLOSED 282 LATIF TEXTILE MILLS NOORIABAD 0 1992 283 LEGLER NAFEES DENIM MANGA 0 672
284 LEGLER-NAFEES COTTON MILLS MUZAFFARGARH 32784 0
285 M.D.TEXTILE MILLS KOTH KAMOKE 0 1896 CLOSED 286 M.F.M.Y.INDUSTRIES KARACHI 9200 0 287 M.G.M. CORPORATION FEROZWATTOAN 21040 0 288 M.I.TEXTILE MILLS AASAL- RWROAD 0 3000 289 MADINA WEAVING MILLS BUREWALA 0 800 CLOSED
290 MAHMOOD TEXTILE MILLS Ltd. MUZAFFARGARH 79632 0
291 MALIKWAL TEXTILE MILL
KUTHIALA SHEIKHAN 18576 0
292 MANZOOR TEXTILE MILLS HABIBABAD 26880 0
293 MAQBOOL TEXTILE MILLS MUZAFFARGARH 39312 0

xxix
294 MAQBOOL USMAN FIBRES (PVT) LTD. BHIKHI 20640 0
295 MARGALA TEXTILE 1&2 HASSABABDAL 27720 0 296 MARHABA TEXTILE LTD NOORIABAD 14480 0
297 MARIAM TEXTILE NO.1(ITTEFAQ) LAHORE 13740 0 CLOSED
298 MARIAM TEXTILE NO.2(ITTEFAQ) PHOLNAGAR 12480 0
299 MARRAL FIBRES (PVT) LTD. MULTAN 0 1000
300 MARRAL TEXTILE MILLS BHAIPHERU 17544 0 301 MASOOD SPINNING MILLS KABIRWALA 22032 0 302 MASOOD TEXTILE MILLS FAISALABAD 14400 0 303 MAYFAIR SPINNING MILL MANGA RW.ROAD 30816 0 304 MEHR DASTGIR SPINNING MULTAN 17280 0 305 MEHR DASTGIR TEXTILE MULTAN 12480 0
306 MEHRAN RAMZAN TEXTILE MANGA RW. ROAD 17280 0
307 MEKOTEX (PRIVATE)LTD LANDHI 0 2520 308 METCO TEXTILE NOORIABAD 24252 0
309 METROPOLITAN (COFCOT) HYDERABAD 39600 0
310 MIAN TEXTILE IND.LTD PHOLNAGAR 18456 0 311 MIMA COTTON MILLS FAISALABAD 23640 0 312 MODERN TEXTILE MILLS TANDOJAM 4490 480 CLOSED 313 MODIFIL INDUSTRIES F.B.AREA 0 3200 CLOSED
314 MOHAMMAD FAROOQ TEX. KORANGI 12584 0
315 MOIZ TEXTILE MILLS LTD. RAIWAND 25177 0
316 MONNOO INDUSTRIES LTD LAHORE 12480 0
317 MONNOOWAL TEXTILE MILLS LTD. MIAN CHANNU 20208 0
318 MORO TEXTILE MILLS MORO 15360 0
319 MUKHTAR TEXTILE MILLS (FRIENDS) NIA LAHORE 14400 0
320 MULTAN TEXTILE WORKS MULTAN 0 100 CLOSED 321 MUSARAT TEXTILE MILLS FAISALABAD 0 1296 CLOSED 322 MUSHARKA SPINTEX LTD. MULTAN 0 400 323 MUSTAFA INDUSTRIES JUIANWALA MOR 0 600 324 N.N.TEXTILE MILL HUB CHOWKI 0 1376 CLOSED 325 N.P.COTTON MILLS HUB CHOWKI 0 2880 326 N.P.SPINNING MILLS RAIWIND 37808 200 327 N.P.WATERPROOF TEX. HUB CHOWKI 0 1800 328 NADEEM TEXTILE MILLS NOORIABAD 32304 0 329 NAFEESA TEXTILE LTD. THEING MOOR 33664 0 330 NAGARIA TEXTILE MILLS LANDHI 20700 0 331 NAGINA COTTON MILLS KOTRI 47040 0 332 NAJIA SPINNING MILLS HABIBABAD 9072 0 333 NASEEM SPINNING LTD HABIBABAD 0 1200
334 NATIONAL SPINNING MILLS KOTRI 13872 0

xxx
335 NAUROZE ASSOCIATES MULTAN 12400 0 336 NAVEED TEXTILE NO.1 SHEIKHUPURA 12480 0 CLOSED 337 NAVEED TEXTILE NO.2 SHEIKHUPURA 24792 0 CLOSED 338 NAZIR COTTON MILLS KHARIANWALA 28800 0 339 NEELUM TEXTILE MILLS KHARIANWALA 0 2592 340 NISHAN-E-QADIR TEXTIL KOT LAKHPAT 0 1004 CLOSED
341 NISHAT (CHUNIAN) LTD-NO.1&2 KAMOGAL 129624 0
342 NISHAT MILLS LIMITED FAISALABAD 183038 0 343 NISHAT PRODUCTS LTD. MULTAN 0 2496 CLOSED 344 NOON TEXTILE MILL BHALWAL 16100 0 345 NOOR SPINNING MILLS SHEIKHUPURA 0 1400 346 NORRIE TEXTILE MILL NOORIABAD 14400 400 CLOSED 347 NORTH STAR TEXTILES NANKANA 53280 0 348 NUSRAT TEXTILE MILL JAUHARABAD 20520 0 CLOSED 349 OLYMPIA BLENDED NO.2 CHICHUKIMALIA 22192 0 350 OLYMPIA BLENDED NO.1 CHICHUKIMALIA 14760 0 351 OLYMPIA SPG&WVG.MILL LANDHI 44484 0 352 OLYMPIA TEXTILE MILL SHEIKHUPURA 23288 0 353 PAK KUWAIT TEXTILE JAUHARABAD 42240 0
354 PAK LAND TEXTILE MILLS MANGA 0 0
355 PAK PANTHER SPINNING MANGA RWROAD 33304 0
356 PARADISE FIBRES PVT LTTL BHAIPHERU 20592 0
357 PARADISE SPG(ZAHUR.3) PHOLNAGAR 20520 0 358 PARAMOUNT SPINNING KOTRI 24000 0 359 PIONEER SPINNING MILL PHOLNAGAR 15408 0 360 PIONEER TEXTILE MILL KORANGI 0 1200 CLOSED 361 PLATUNUM SPG MILLS RAIWND 6500 0 362 POPULAR FIBRE MILLS NOORIABAD 24840 0 363 POPULAR SPINNING MILL NOORIABAD 16176 0 364 PREMIUM TEXTILE LTD. NOORIABAD 36672 0 365 PRIDE SPINNING MILLS FAISALABAD 15360 0 366 PURJNAD TEXTILE MILLS MULTAN 12400 0 367 QADRI TEXTILE MILLS BAHAWALNAGAR 12480 0 CLOSED 368 QUALITY TEXTILE MILLS FEROZWATTOAN 24240 0 369 QUETTA TEXTILE NO.3 KOTRI 15120 0 370 QUETTA TEXTILE NO.4 PHOLNAGAR 17600 0 371 QUETTA TEXTILE NO1&2 KOTRI 13960 864 372 QURESHI TEXTILE MILLS MIAN CHUNNU 16752 0 373 QUTUB TEXTILE MILLS SHEIKHUPURA 0 1600 374 RAFI COTTON (AWAN1) KHURRIANWALA 17280 0
375 RAFIQ SPINNING MILLS LTD. FAISALABAD 9600 3000
376 RAHIMBAKSH TEXTILE D.G KHAN 12480 0 377 RAHMAN COTTON MILLS TAKHT I BHAI 84456 0 378 RAHMANIA TEXTILE MIL FAISALABAD 24400 0 CLOSED
379 RAHMAT WAZIR TEX.(HASSAN AFTAB) JUIANWALA MOR 12480 4400 CLOSED
380 RAI TEXTILE MILLS DINANATH 12480 0

xxxi
381 RAMBOW INDUSTRY (I.I.S TEXTILE) PHOLNAGAR 0 3200
382 RAMZAN BUKSH TEXTILE PHOLNAGAR 17280 0 383 RASHID TEXTILE MILL SITE 11120 1536 CLOSED 384 RAVI SPINNING MILLS MANGA RWROAD 14400 0 385 RAVI TEXTILE MILLS LAHORE 17640 0 386 RAWAL TEXTILE MILLS CHICHUKIMALIA 19776 0 387 RAYON TEXTILE MILLS SITE 0 1728 CLOSED 388 REDCO TEXTILE MILLS RAWAT 14400 0 389 REGENT TEXTILE LTD SITE 19776 0 390 RELIANCE COTTON SPG. FEROZWATTOAN 26976 0
391 RELIANCE WEAVING MILLS
392 RESHAM TEXTILE IND HABIBABAD 17280 0 393 RIAZ TEXTILE MILLS FEROZWATTOAN 33936 0 394 RIZWAN TEXTILE MILLS CHAKWAL 51660 0
395 ROOMI SPINNING MILLS(SINTEX) MIANCHANNU 0 1200 CLOSED
396 ROYAL TEXTILE MILLS GADOON AMAZAI 25920 0 397 RUBY TEXTILE MILLS MANGA RWROAD 17280 0 398 S.A.F. TEXTILE LTD. SHEIKHPURA 30816 0 399 S.FAZALILAHI & SONS SITE 0 2680 400 S.Q TEXTILE MILLS FAISALABAD 0 1400 401 SADHUJA TEXTILE MILLS MORO 27216 0 402 SADIA TEXTILE KARACHI 2832 0 403 SADIQ TEXTILE MILLS MULTAN 5000 0
404 SADIQABAD TEXTILE MILLS MULTAN 24880 0 CLOSED
405 SAFOORA SONS WASTE MULTAN 0 200 CLOSED
406 SAHRISH TEXTILE MILLS (FRIENDS) NIA LAHORE 13680 0
407 SAIF TEXTILE MILLS GADOON 88476 0 408 SAITEX SPINNING MILL PHOLNAGAR 17280 0 409 SAJJAD TEXTILE MILLS PHOLNAGAR 18288 0 410 SALFI TEXTILE MILLS LANDHI 19920 0 411 SALIM YARN(SHAHYAR 1) KOTRI 12312 0 412 SALLY TETILE MILLS JAUHARABAD 40309 0
413 SALMAN NOMAN ENT.LTD PHOLNAGAR 17760 0
414 SANA INDUSTRIES LTD. HUB CHOWKI 26944 0 415 SANAULLAH WOOLLEN KARACHI 6336 120 416 SAPPHIRE FIBRES 1&2 KHARIANWALA 38832 0 417 SAPPHIRE FIBRES NO.3 FEROZWATTOAN 43920 0 418 SAPPHIRE TEXTILE NO.1 KOTRI 43680 0 419 SAPPHIRE TEXTILE NO.2 KOTRI 27144 0 420 SAPPHIRE TEXTILE NO.3 NOORIABAD 0 3504 421 SAPPHIRE TEXTILE NO.4 JUMBER 17280 0 422 SAPPHIRE TEXTILE NO.5 FEROZWATTOAN 18528 0 423 SARDARPUR TEXTILE PHOLNAGAR 15120 0
424 SARFARAZ TEXTILE MILLS CHINNIOT 24768 0
425 SARFRAZ SARFRAZ NAGAR 47880 0

xxxii
YAQOOB(ZAHUR 2) 426 SARGODHA SPINNING FAISALABAD 51405 0
427 SARGODHA TEXTILE MILL SARGODHA 31440 0
428 SARHAD TEXTILE MILLS GADOON 22704 0 429 SARITOW SPINNING MILL PHOLNAGAR 18240 0 430 SCHON SPINNING MILLS SITE 12624 1000 CLOSED 431 SERVICE INDUSTRIES GUJRAT 47420 0 432 SHADAB TEXTILE MILLS SHEIKHUPURA 26880 0
433 SHADMAN COTTON MILLS KOTRI 23376 0
434 SHADMAN COTTON NO.2 FEROZWATTOAN 21288 0 435 SHADMAN COTTON NO.3 FEROZWATTOAN 30384 0 436 SHAFI SPINNING MILLS FEROZWATTOAN 0 1512 437 SHAFIQ TEXTILE MILLS F.B.AREA 28000 0 CLOSED 438 SHAH JEWANATEX MILLS GHOUSPUR 16320 0 439 SHAHAB FIBRES MULTAN 0 0 CLOSED
440 SHAHBAZ GARMENTS(YASIR) KHURRIANWALA 0 864 CLOSED
441 SHAHDADKOT TEXTILE SHAHDADKOT 25056 0 CLOSED
442 SHAHEEN COTTON FACTORY SARGODHA 0 1000
443 SHAHEEN COTTON MILL SHEIKHUPURA 32928 0 444 SHAHNAWAZ TEXTILE MANGA RWROAD 21528 0 445 SHAHPUR TEXTILE MILL JUMBER 18240 0 446 SHAHZAD TEXTILE NO.1 SHEIKHUPURA 20640 0 447 SHAHZAD TEXTILE NO.2 SHEIKHUPURA 17712 0
448 SHAMA COTTON MILLS (SAFURA) KOTRI 0 1120 CLOSED
449 SHAMS TEXTILE MILLS CHINIOT 40320 0 450 SHEIKHUPURA TEXTILE PHOLNAGAR 16320 0
451 SHOIAB SALMAN BROTHER SAHIWAL 0 2000
452 SIBTEX (PVT) LTD. FAISALABAD 0 0 453 SIDDIQSONS DENIM MILL HUB CHOWKI 13440 1944 454 SIFTAQ INTERNATIONAL NOORIABAD 0 1536 CLOSED 455 SILVER FIBRE SPINNING KHARIANWALA 16320 0
456 SILVER TEXTILE MILLS(AJAX) KARACHI 0 1900
457 SIND FINE TEXTILE SHIKARPUR 0 1176 CLOSED 458 SITARA CHEMICAL NO.1 KHURRIANWALA 19200 0 459 SITARA CHEMICAL NO.2 KHURRIANWALA 18240 0 460 SITARA SPG MILLS FAISALABAD 23328 0 461 SOHAIL TEXTILE MILLS JHAMKE, 25872 0 462 SONIJA TEXTILE MILLS SITE-KARACHI. 0 400
463 SPINCOT MILLS (NAVEED.3) FAZALABAD 31144 0
464 SPINGHAR TEXTILE HATTAR 14400 0 465 SPINTERE ENTERPRISES MIANCHANNU 16500 0
466 STANDARD TEXTILE MILLS(AL-AMIN) KOTRI 14616 1920
467 STAR TEXTILE MILLS SITE 20320 0

xxxiii
468 SUFI TEXTILE MILLS JHANG 20464 1000 469 SULEMAN SPINNING MILL D.G.KHAN 20160 0 470 SULTAN TEXTILE MILLS SITE 12600 0 471 SUN RAYS TEXTILE MILL KHANPUR SHOMALI 33063 0 472 SUN RISE TEXTILE SHEIKHUPURA ROAD 0 0 473 SUNSHINE COTTON MILLS JUIANWALA MOR 15540 0 474 SUPERIOR TEXTILE MILL MANGA RWROAD 17280 0 475 SURAJ COTTON MILL NO.1 NOORIABAD 24576 0
476 SURAJ COTTON MILLS NO.2 SHAKOT 41856 0
477 SURRIYA TEXTILE MILL KOTRI 19020 0 478 TAHA SPINNING MILLS FEROZWATTOAN 11088 0 479 TAJ TEXTILE MILLS PHOLNAGAR 39360 0
480 TANVEER SPG.& WVG. MILLS LTD. SHEIKHUPURA 22704 0
481 TAQEES (PRIVATE) LTD SITE 10240 0
482 TARBELA COTTON & SPINNING HARIPUR 25296 0
483 TARIQ INDUSTRIES LTD SHAH KOT 0 1400 CLOSED 484 TARIQ SPINNING GUJRAWALA 0 2000
485 TATA TEXTILE MILLS KHANPUR BAGGASHER 44400 0
486 TAXILA COTTON MILLS HASANABDAL 27588 0
487 TAYMOOR SPINNING MILL BHAGTANWALA 16632 0
488 TAYYAB TEXTILE MILLS CHINIOT 19680 0
489 THREE STREE HOISERY MILLS NO.1 MULTAN 21672 0
490 THREE STREE HOISERY MILLS NO.2 MULTAN 11496 0
491 TIME TEXTILE INDUSTRY KARACHI 4928 0 492 TRIBAL TEXTILE MILL DERA ISMAIL KHAN 19812 0 493 TRITEX COTTON MILLS JUMBER 25920 0 494 UMER SPINNING MILLS FAISALABAD 16128 0 495 UNI SPINNERS LTD. KARACHI 12480 0 CLOSED
496 UNITED TEXTILE MILLS(SILVER) HYDERABAD 9440 0 CLOSED
497 UNIVERSAL TEXTILE F.B.AREA 3456 1400 CLOSED 498 USMAN LIMITED HUB CHOWKI 14400 0 499 USMAN TEXTILE MILLS SITE 0 1080 CLOSED 500 WANHAR TEXTILE MILLS FAISALABAD 0 1200 501 WAQAS SPINNING (AAJ) SHORKOT 13392 0 502 WINDHER TEXTILE MILLS WINDHER 144 0 503 WISAL KAMAL FABRICS SHEIKHUPURA 14544 1200 504 YAHYA TEXTILE MILLS D.G.KHAN 21408 0 505 YAN TEXTILE IND.LTD MANGA RWROAD 0 1400 CLOSED 506 YOUSAF WEAVING MILLS PHOLNAGAR 18800 0 507 YUSUF TEXTILE MILLS KORANGI 24336 0 508 ZAFAR TEXTILE MILL JAUHARABAD 24960 0 CLOSED 509 ZAHID INDUSTRIES OKARA 0 400 CLOSED 510 ZAHIDJEE FABRIC LTD. FAISALABAD 16512 0 511 ZAHIDJEE TEXTILE MILL KHURRIANWALA 23184 0 512 ZAHUR TEXTILE MILLS PHOLNAGAR 27360 0

xxxiv
513 ZAIBTUN TEXTILE MILL SITE 12432 0 CLOSED 514 ZAINAB TEXTILE MILLS KHURRIANWALA 38400 0 515 ZAMAN TEXTILE MILLS KOTRI 20640 0 516 ZIA UL REHMAN TEXTILE FAISALABAD 0 0 TOTAL 11048270 168508

xxxv
DEWAN SALMAN FIBER LTD
PPRROOFFIILLEE
Dewan Salman Fiber Limited (DSFL) is a Pakistan-based company. The
Company is engaged in manufacture and sale of Polyester, acrylic fiber and tow
products. During the fiscal year ended June 30, 2006, the company produced 104,364
tons of polyester staple fiber, and 12,194 tons of acrylic fiber and two.
Quarterly
(Dec ’07) Annual (2006)
Annual (TTM)
Net Profit Margin -54.63 % -0.61 % -
Operating Margin -34.66 % 3.64 % -
EBITD Margin - 9.20 % -
Return on Average Assets
-21.03 % -0.45 % -
Return on Average Equity
-141.54 % -1.93 % -
Employees 3,745 - -

xxxvi
NISHAT (CHUNIAN) LIMITED
PPRROOFFIILLEE
Nishat (Chunian) Limited is a Pakistan-based company engaged in the business
of spinning, weaving, dyeing, stitching, processing, doubling, sizing, buying, selling and
otherwise dealing in yarn, fabric and made-ups made from raw cotton, synthetic fiber
and cloth and to generate electricity for internal use. As at June 30, 2007, the company
operated 142,196 spindles, 293 air jet looms, one dyeing and stitching plant, a modern
dyeing and finishing plant having capacity of 71.000 meters per day and captive power
plants with a total capacity of 33 megawatts.
Quarterly (Dec ’07)
Annual (2007)
Annual (TTM)
Net Profit Margin -6.76 0.13 % -0.02 %
Operating Margin 0.64 % 8.73 % 7.65 %
EBITD Margin - - 13.44 %
Return on Average Assets
-4.96 % 0.11 % -0.02 %
Return on Average Equity
-19.74 % 0.37 % -0.07 %
Employees
4,859 - -

xxxvii
IBRAHIM FIBERS (IBFL)
PPRROOFFIILLEE
Ibrahim Fibers Limited is incorporated in Pakistan under the Companies
Ordinance 1984, and is listed on all stock exchanges in Pakistan. The Principal business
of the company is manufacture and sale of Polyester Staple Fiber and Yarn.
Share Price Rs. 2003 2004 2005 2006
High 31.70 44.00 55.00 45.90
Low 16.15 29.00 36.00 34.30
Average 23.93 36.50 45.50 40.10

xxxviii
THE CRESCENT TEXTILE MILLS LIMITED
PPRROOFFIILLEE
The Crescent Textile Mills Limited is engaged in the business of textile
manufacturing consisting of spinning, combing, weaving, dyeing, bleaching, printing,
buying, selling and dealing in yarn, cloth, and other goods and fabrics made from raw
cotton and synthetic fibers. It also operates a cold storage, which provides storage
facilities to farmers. The Company is capable of producing yarn from 06 count to 120
count, carded and combed in 100% cotton, as well as blends with poly cotton. Its
spinning units are equipped to produce regular ring spun yarn, compact ring spun yarn,
spandex yarn, slub yarn, and multi-count and multi-twist yarn. The Company has 168
air-jet looms and 12 towel air jet looms to convert its own yarn into customer specific
cloth/terry fabrics. The Company has a stitching division, where a range of home textile
and hospitality products are made. These include quilted bed-ina-bag items, bed linen,
table linen, kitchen linen and furnishings. Quarterly
Mar ’08) Annual (2007)
Annual (TTM)
Net Profile Margin 1.31% 1.53% 0.79%
Operating Margin 4.47% 1.46% 1.24%
EBITD Margin - 6.20% 5.13% Return on Average
Assets 1.15% 1.01% 0.62%
Return on Average
Equity 2.84% 2.48% 1.71%
Employees 4,408 - -

198
BIBLIOGRAPHY
A. Gledhill, Pakistan (Stevens, London, 1957), Altaf Zafar, Dr, (1983): Pakistani
Entrepreneurs; Their Development, Characteristics and Attitudes, Croom Helm Ltd,
Provident House, Burrell Row, Beckenham, Kent BR3 1AT, Australia
Adelman Irma (1999): The Role of Government in Economic Development,
Working Paper, No. 890, Department of Agriculture and Research and Policy Division
of Agriculture and Natural Resources, University of California
All Pakistan Textile Mills Association, (APTMA): http:// www.aptma.org.pk
Altaf Zafar, Dr, (1983): Pakistani Entrepreneurs; Their Development,
Characteristics and Attitudes, Croom Helm Ltd, Provident House, Burrell Row,
Beckenham, Kent BR3 1AT, Australia
Altaf Zafar, Dr, (2007): Challenges in the Pakistan Cotton, Yarn, Textile and
Apparel Sectors, Chapter Five: Studies of the Cotton-Textile – Apparel Industries in
Pakistan and India: Cotton Trade Policy and Poverty Study
Anderson, James and Eric van Wincoop, (2004): Trade Costs, Journal of
Economics Literature, 42, 691-751
Asian Textile Business: http://www.allbusiness.com/asia/980338-1.html, Date:
Tuesday, October 1, 2002: Retrieved on 2008-04-23
Bagwell, K and R. W. Staiger (1990): “An Economic Theory of GATT,”
American Economic Review 89(1), 215-248.
Bairoch, P, (1976): Commerce extérieur et développement économique de
l’Europe au XIX siècle, Mouton, Paris La Haye: Écoles des Hautes Études en Sciences
Sociales.

199
Bairoch, P, (1989): ‘European Trade Policy, 1815-1914’, in Mathias P. and
Pollard S. (eds), The Cambridge Economic History of Europe, Volume VIII, The
Industrial Economies: The Development of Economic and Social Policies, New York:
Cambridge University Press
Baldwin, R.E. (1997): "The Causes of Regionalism”: The World Economy, 20, 7,
865-888.
Bartlett, C. et al, (2003): Transnational Management, 4th edition:
http://eninearticles.com/? Role-of-Multinational-Corporation-in-the-Modern-World
Retrieved on 03-06-2008
Barton, K., Whitley, H., Yang, N.S. (1987): Bacillus thuringiensi - endotoxins in
transgenic Nicotiana tabaccum provides resistance to Lepidopteran pests. Plant Physiol.,
85, 1103-1109.
Barwale, R.B., Gadwal, V.R., Zehr, U and Zehr B. (2004): Prospect of Bt cotton
technology in India. AgBioForum, The Journal of Agrobiotechnology Management and
Economics 7(1&2).
Bates, Robert (1997): Open Economy Politics: The Political Economy of the
World Coffee Trade, Princeton University Press.
Batie, S.S. and D.E. Ervin (2001): ‘Transgenic crops and the environment:
missing markets and public roles’, Environment and Development Economics 6: 435–
457.
Benbrook, C. (2001): ‘Do GM crops mean less pesticide use?’, Pesticide Outlook
12:204–207.
Bhagwati, J. (1992): "Regionalism versus Multilateralism": The World
Economy, Retrieved on 2007-05-27

200
Bhagwati, Jagdish (2004): In Defense of Globalization. Oxford, New York:
Oxford University Press.
Blinder, Alan S; William J Baumol and Colton L Gale (2001): Monopoly:
Microeconomics: Principles and Policy. Thomson South-Western. pp. 212. ISBN 0-324-22115-0
Board of Investment, Ministry of Investment (BOI), Government of Pakistan:
http://www.pakboi.gov.pk
Boettke, Peter J. What Went Wrong with Economics? Critical Review Vol. 11,
No. 1, P. 35. p. 58
Buchholz, Todd (1989): new ideas from Dead Economists: An introduction to
modern economic thought, Penguin Books, ISBN 0140283137
Caesar Cororation and David Orden (2007): Studies of the Cotton-Textile –
Apparel Industries in Pakistan and India: Cotton Trade Policy and Poverty Study. EW-
P091261-ESW-TF055329, Cambridge, MA 02138
Carpenter, J., A. Felsot, T. Goode, M. Hammig, D. Onstad, and S. Sankula
(2002): Comparative Environmental Impacts of Biotechnology-derived and Traditional
Soybean, Corn, and Cotton Crops, Ames: Council for Agricultural Science and
Technology.
Charles S. Mayer "In Search of Stability: Explorations in Historical Political
Economy", Cambridge University Press, Cambridge, 1987.
Chaturyedi, S. (2002): Agricultural biotechnology and new trends in IPR regime:
Challenges before developing countries, Economic and Political Weekly, 37, 13, March
30.
Chossudovsky, Miche (2003): The Globalization of Poverty and the New World
Order; Edition 2nd ed. Imprint Shanty Bay, Ont: Global Outlook, 2003
CIA: The World Fact Book - Pakistan: https://www.cia.gov/library/
publications/the-world-factbook/rankorder/2003rank.html

201
Claude Smadja: WEF; http://www.abc.net.au/rn/talks/lm/stories/s146446.htm:
and http://www.weforum.org: Retrieved on 2008-05-27
Collie, D. (1991): “Export Subsidies and Countervailing Tariffs,” Journal of
International Economics, 31, 309-324
Concluding remarks at the Pakistan Development Forum (2006): by John Wall,
World Bank Country Director for Pakistan: http://www.worldbank.org/html
Cooper, D.R & Emory, C.W. (1995): Business Research Methods (5th ed), Irwin,
USA: Mc-Graw Hills Companies
Corbman P. Bernard (1983): Textiles Fiber to Fabric: McGraw- Hill International
Editions 1983, McGraw- Hill Book Co. Singapore
Croucher L. Sheila (2004): Globalization and Belonging: The Politics of Identity
a Changing World. Rowman & Littlefield, (2004)
Daily Dawn Annual Budget, 2007; June 9, 2007: http://www.dawn.com
David Dollar and Aart Kraay (2001): Trade, Growth and Poverty, World Bank
mimeo, 2001
David Dollar (2001): Globalization, Inequality, and Poverty, World Bank mimeo,
2001
Dawn (10 April, 2004): Per Capita Income to reach $600 this year, says Shaukat:
http://www.dawn.com: Retrieved on 2008-05-25
Dawn (2006): Pakistan’s per capita income at $ 800: (5, February, 2006)
Retrieved on 2008-05-25

202
Dawn, (3 January 2005): Less people, More prosperity; http://dawn.com:
Retrieved on 2008-05-25
Doing Business in 2006: South Asian Countries Pick up Reform Pace says World
Bank Group; Pakistan Among Top 10 Reformers (September12, 2005),
http://worldbank.org
Dominick Salvatore, Fordham University, New York: http://www.bepress.com
Drazen, Allen (2000): Political Economy in Macroeconomics, Princeton
University Press, Princeton, New Jersey (USA)
Dunn, John quoted in Vincent Cable, The Diminished Nation – State: A study in
the loss of economic power, 1995
Economic Survey of Pakistan (2002-03)
Economy of Pakistan: Wikipedia:http://.enwikipedia.org/wiki/
economy_of_pakistan
Esterhuizen D & Van Rooyen CJ (1999): How competitive is agribusiness in the
South African agro-food commodity chain. Agrekon 38(4):744-752.
Ethier, W. (1998): "The New Regionalism", the Economic Journal, 108, 1149-1161
Evolution of Trade Theories: http://referenceforbusiness.com/encyclopedia/gov-
inc/impoting.html
Ferto, I. and L.J. Hubbard (2001): Regional comparative advantage and
competitiveness in Hungarian agri-food sectors. 77th EAAE Seminar/NJF, Seminar No
325.
Francois Quesney (1694-1774): http://en.wikipedia.org/wiki/ Fran%C3% A7ois_
Quesnay

203
Free Trade Agreement: http://en.wikipedia.org/wiki/List of_free_trade_
agreements
Free Trade Arrangements: http://www.export.gov/fta
Free Trade: http://en.wikipedia.org/wiki/Free_trade Retrieved on 2008-04-23
Friedman, Thomas L (2008): "The Dell Theory of Conflict Prevention." Emergin:
A Reader. Ed. Barclay Barrios, Boston: Bedford, St. Martins, 2008
Frisvold, G.B. and Reeves, J.M. (2007): Economy-wide impacts of Bt cotton.
Proceedings of the Beltwide Cotton conferences, January 2007.
Frohberg K & Hartmann M (1997): Comparing measures of competitiveness.
Institute of Agricultural Development in Central and Eastern Europe, Discussion Paper,
No 2, Web page: http://www.landw.uni-halle.de/iamo/iamo.htm. Accessed on 03/04/03.
Gandhi, V.P. and Namboodiri, N.V. (2006): The adoption and economics of Bt
cotton in India: Preliminary results from a study. Indian Institute of Management,
Ahmedabad, India.
Gilani, S.Y.R., (2008): Address by the Prime Minister of Pakistan Syed Yousuf
Raza Gilani at The Launch of ‘The Indus Entrepreneurs’ (TiE) Islamabad Chapter
Rawalpindi June, 2008.
Gilpin Robert (2001): Global Political Economy: Understanding the International
Economic Order, Princeton University Press, Princeton, New Jersey (USA)
Good Africa: http://www.goodafrica.net/index.asp. Retrieved on 2007-03-23
Gorostiaga Xabier (1995): "World has become a 'champagne glass' globalization
will fill it fuller for a wealthy few' National Catholic Reporter, Jan 27, 1995.

204
Government of Pakistan (2009): Economic Survey of Pakistan, Economic
Advisor’s Wing, Finance Division, Government of Pakistan, Islamabad.
Government of Pakistan, Islamabad: http://www.pakistan.gov.pk
Government of Pakistan, Islamabad: http://www.pakistan.gov.pk
Government of Pakistan: Ministry of Commerce: http://www.commerce.gov.pk
GRAIN (2001), ‘Bt cotton through the back door’, Seedling 18, Barcelona:
Genetic Resources Action International.
Greenwald, Bruce and Stiglitz, Joseph E. (1986): Externalities in Economies with
Imperfect Information and Incomplete Markets, Quarterly Journal of Economics, no. 90.
Groenwegen, Peter (1987): "'Political Economy' and 'Economics',"
http://en.wikipedia.org/wiki/Political_economy
Hanna, Julia. (2004): Harvard Business School: Working Knowledge:
http://hbswk.hbs.edu/item/5602.html
Hayee, A. (2005): Cultivation of Bt cotton Pakistan’s experience. Actionaid,
Islamabad, Pakistan, 2005
Hertz, Noreena (2004): The Debt Threat. Harper Collins Publishers, 2004 NY.
Hettne, B (1995): Development Theory and the Third World: Towards an
International Political Economy of Development: Longman Development Studies, 2nd
edition
Hofs, J.L., Fok, M., Vaissayre, M. (2006): Impact of Bt cotton adoption on
pesticide use by smallholders: A 2-year survey in Makhatini Flats (South Africa). Crop
protection, 25: 984-988.
Hoftey, H., Whitley, H.R. (1989): Insecticidal crystal proteins of Bacillus
thuringiensis. Microbiol. Rev., 53, 242-255.

205
http://en.wikipedia.org/wiki/Adam_Smith
http://en.wikipedia.org/wiki/Classical_economics:
http://en.wikipedia.org/wiki/History_of_economic_thought
http://en.wikipedia.org/wiki/Kenynesian_economics
http://en.wikipedia.org/wiki/Political_economy: Retrieved on 2008-04-23
http://en.wikipedia.org/wiki/Trade
http://www.nytimes.com/2008/02/13/opinion/lweb13krugman.html
http://www.referenceforbusiness.com/encylopedia:
Huang , J., Hu Ruifa, Rozelle, S. Qiao, F. and Pray C.E. (2001): Small holders,
transgenic varieties, and production efficiency: The case of cotton farmers in China.
California Agricultural Experiment Station, Giannini Foundation for Agricultural
Economics, Department of Agricultural and Resource Economics, University of
California Davis, USA.
Huang, J., S. Rozelle, C. Pray, and Q. Wang (2002a): ‘Plant biotechnology in
China’, Science 295: 674–677.
Human Development Report (1992): United Nations Development Program
(New York, Oxford University Press: Retrieved on 2007-07-08
IMF (2001): Global Trade Liberalization and the Developing Countries; IMF
Issues Brief: http://www.imf.org : Retrieved on 05-21-2008
Innovation: http://www.hillaryclinton.com and http://en.wikipedia.org: Retrieved:
2008-03-27
International Labor Organization: Multinational Corporations: Bureau for
Workers’ activities: http://www.itilo.it
International Trade Statistics (http://www.intracen.org/tradstat/site3-
3d/indexpe.htm)

206
International Trade Theories: free Essays, Cliff Notes and Term Paper Database:
http://www.essays.cc/free_essays/b5/1vt197.shtml: Mahoney, M Trigg, R Griffin, M
Pustay (1998): Techniques for Analyzing Industries and Competitors: New York: Free
Press. George S. Yip, (1995), Total Global Strategy. Salvatore Dominic, (1999),
International Economics, McGraw-Hill. Ball, Mcculloch, (1999) International Strategic
Ishrat Husnain - Economy of Pakistan. Article by the Governor of State Bank of
Pakistan; http://www.bis.org/review/r050217g.pdf
Isma¨el,Y., R. Bennett, and S.Morse (2002): ‘Benefits fromBt cotton use by
smallholder farmers in South Africa’, AgBioForum 5: 1–5.
James Shikwati (2002): http://www.smh.com.au
Jan Pronk (2006): (Dutch politician and Diplomat): Trade Liberalization: A
Political Approach: http://www.janpronk.nl
Jo-Ann Crawford and Sam Laird: Regional Trade Agreements and the WTO Centre
for Research in Economic Development and International Trade, University of
Nottingham
Jones, S. Griffith (1988): “Debt Crisis Management in the Early 1980s: Can
Lesson be Learnt”? Development Policy review, Vol.6. 1988
Jones, S. Griffith (1989): Growing out of Debt: A Conference organized by the
British All parliamentary Group on Overseas Development
José Manuel Salazar-Xirinachs, Chief Trade Advisor of the Organization of
American States, March 1999, Trade and Development: Towards a New Consensus at
the ICTSD International Centre for Trade and Sustainable Development , Geneva
Kala Krishna and Cemile Yavas (2002),” When Does trade hurt? Market,
Transition and Development Economics”, NBER Working Paper series; working paper
8995: National Bureau of economic Research, Cambridge, MA 02138:

207
http://www.nber.org: Retrieved on 2008-01-23
Kemp, M. C. and H. Wan (1976): "An Elementary Proposition Concerning the
Formation of Customs Unions", Journal of International Economics, 6, 95-98
Kenen B. Peter (1994): The International Economy, (3rd Edition), Press
Syndicate of the Cambridge University Press, USA
Killick Tony: The Adaptive Economy: Adjustment Policies in Small, Low-
Income Countries. Economic Development Institute of the World Bank, EDI
Development Institute (ODI)
Knowledge Based Economy.www.oecd.org/document/14/0,3343.html: Retrieved
on 2008-03-23
KOF Index of Globalization: http://globalization.kof.ethz.ch/: Retrieved on 2008-
02-28
Kohn, Alfie (1986): No Contest – The Case Against Competition. Boston New
York London: Houghton Mifflin Co. ISBN 0-395-63125-4.
Lather, P. (1992): Critical Frames in Educational Research: Feminist and Post
Structural Perspectives, Theory into Practice, xxxi, 2, 87-99
Lionel Robbins quoted in Llyoyd G. Reynolds: The Three Worlds of Economics,
New Haven: Yale University Press, 1971
Mary Robinson, former President of Ireland: Africa needs friar Trade, not
Charity: Yale Global Online: http://yaleglobal.yale.edu
Milton Friedman (2002): “Monopoly and the Social Responsibility of Business
and Labor”. The University of Chicago Press. pp. 208. ISBN 0-226-26421-1
Monopolies: http://en.wikipedia.org/wiki/Monopoly. Retrieved on 2008-03-23

208
Monopolies: The Linux Information Project (2005 – 2006): http://www.linfo.org
Retrieved on 2008-03-23
Motta, M, J-F Thisse and A. Cabrales (1997): “On the Persistence of Leadership
or Leapfrogging in International Trade”, International Economic Review, 38 (4), 809-
824
National Textile Association (NTA), America, Free Daily Textile News Blog:
http://www.nationaltextile.org
Neale, , M.C. (1997): Bio-pesticides- hormonisation of registration requirements
within EU directive 91-414. An industry view. Bulletin of European and Mediterranean
Plant Protection Organization, 27, 89-93.
Net Aid: http://www.mercycorps.org: retrieved on 22- 02-2007
Nicholas Louise (2007): Comparative Prospects for Growth of Real GDP:2000-
2015:
Nolde, B. (1932) : La Clause De La Nation La Plus Favorisée et les Tarifs
Préférentiels, Académie de Droit, International, Recueil de Cours, Tome 39.
November 2002. http://www.nber.org/papers/w9326
OECD Report (1993): http://www.oecd.org: Retrieved on 2007-06024
Ostry Sylvia (1997): A New Regime for Foreign Direct Investment:
(Washington, D.C., Group of Thirty, 1997)
Pakistan – The Economy; Retrieved on 2008-04-12. http://www.mongabay.
com/reference/country_studies/pakistan/ECONOMY.html
Pakistan Defence Forum: http://www.pakistanidefenceforum.com: Retrieved on
2008-05-25

209
Pakistan Economic Survey (2006-07), Finance Division, Government of
Pakistan, Islamabad
Pakistan Economy Profile (2007): Retrieved on: 2007-12-20: http://www.
indexmundi.com/pakistan/economy_profile.html
Pakistan ends 15-year ties with IMF; Daily Times, 7 September 2004, Pakistani
Newspaper Article, 2004. http://www.daliytimes.com.pk
Pakistan News Service - PakTribune : http://www.paktribune.com; Retrieved on
2007-05-27
Pakistan; Khaleej Times Special Report: Textile Industry - Bright Prospects
Ahead, (Aneela Batool): http://khaleejetimes.com; Retrieved on 2008-03-10
PARC (2007): Status of cotton harboring Bt gene in Pakistan. Plant
Biotechnology Program, Institute of Agri-Biotechnology and Genetic resources, National
Agricultural Research Centre, Islamabad.
Partnering Handbook: McGraw-Hill. Salvatore Dominic (1995): Theory and
Problems of International Economics: McGraw-Hill. Mahoney, et al (1998)
Pemsl, D.E., Orphal, J. and Waibel, H. (2003): Bt-cotton productivity
considerations from India and China. A paper presented in a conference on International
Agricultural Research for Development, Gotingen, October 8-10, 2003.
Petrakis, E and S. Roy (1999): “Cost –Reducing Investment, Competition and
Industry Dynamics, “International Economic Review”, 40 (2), 381-401
Porter E. Michael (1985): Competitive Advantage: Creating and Sustaining
Superior Performance, the Free Press, New York NY 10020
Pray, C.E., J. Huang, R. Hu, and S. Rozelle (2002): ‘Five years of Bt cotton in
China – the benefits continue’, The Plant Journal 31: 423–430.

210
Qaim, M. and de Janvry, A. (2003): Genetically modified crops, corporate
pricing strategies, and farmers’ adoption: The case of Bt cotton in Argentina. Amer. J.
Agr. Econ. 85(4) (November 2003): 814-828.
Qaim, M. and de Janvry, A. (2004): Cheaper GM seeds could boost adoption,
farm benefits and company profits: The case of Bt cotton in Argentina. Crop Biotech
Brief, Vol.IV, No.1, 2004.
Qaim, M. and de Janvry, A. (2005): Bt cotton and pesticide use in Argentina:
Economic and environmental effects. Environment and Development Economics 10:
179-200.
Qaim, M., Cap, E.J. and de Janvry, A. (2003): Agronomics and sustainability of
transgenic cotton in Argentina. AgBioForum, 6(1&2): 41-47.
Qaim, M., Zilberman, D. (2003): Yield effects of genetically modified crops in
developing countries. Science 299, 900-902.
Rao, I.A. 2009. First Bt cotton grown in Pakistan. Pakissan.com
Reason Magazine: Trade, not Aid; http://www.reason.com Retrieved on 2008-
02-25
Richard Jolly (1988): UNICEF: Growing out of Debt: A Conference organized
by the British All parliamentary Group on Overseas Development.
Robert Richard Torrens (1780-1864): http://en.wikipedia.org/wiki/
Robert_Torrens
Salam Abdul (2007): (Chapter Three), Studies of the Cotton-Textile – Apparel
Industries in Pakistan and India: Cotton Trade Policy and Poverty Study. EW-P091261-
ESW-TF055329

211
Sappington, David E. M. and Stiglitz, Joseph E. (1988): Privatization,
Information and Incentives. Columbia University; National Bureau of Economic
Research (NBER) June 1988; NBER Working Paper No. W2196
Sarantakos. S. (1993): Social Research. Palgrave Macmillan Houndmills,
Basingstoke Hampshire RG216xs and 175 Fifth Avenue New York, N.Y. 10010. ISBN
1- 4039-4320
Schatan, J (1987): World Debt- Who is to pay? English edition, Zed books,
London
Schnepf, H.E., Whitley, H.R. (1981): Cloning and expression of Bacillus
thuringiensis crystal protein gene in E. coli. Proc. Natl.Acad. Sci. USA, 78, 2893-2897.
Shapiro, Carl and Stiglitz, Joseph E. (1984): Equilibrium Unemployment as a
Worker Discipline Device. The American Economic Review, Vol. 74, No. 3 (Jun.,
1984), pp. 433-444.
Simon Jenkins: Do not patronize Africa: give Trade, not Aid:
http://www.thirdworldtraveler.com: Retrieved on 2007-01-28
Smith, Adam (1937): The Wealth of Nations, N. Y. Random House, p. 643; first
published in 1776
Somesh K. Matura (2004): Globalization and Development: Some Issues and
Empirical Facts; Lecture at the department of Economics, Jamia Millia Islamia, New
Delhi
Stiglitz Joseph E. (2002): Globalization and its Discontents, published by W.W.
Norton, 2003, ISBN 0393324397, 9780393324396
Stiglitz, Joseph E. “There is no invisible hand”. London: The Guardian
Comment, December 20, 2002.
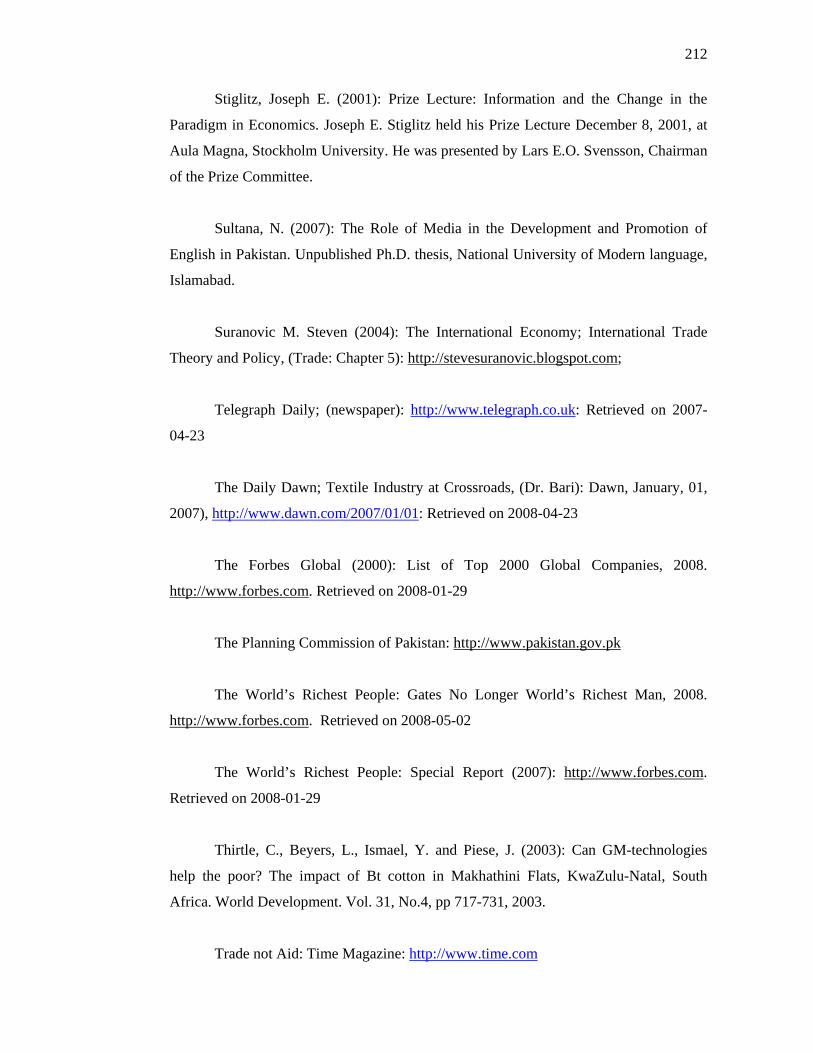
212
Stiglitz, Joseph E. (2001): Prize Lecture: Information and the Change in the
Paradigm in Economics. Joseph E. Stiglitz held his Prize Lecture December 8, 2001, at
Aula Magna, Stockholm University. He was presented by Lars E.O. Svensson, Chairman
of the Prize Committee.
Sultana, N. (2007): The Role of Media in the Development and Promotion of
English in Pakistan. Unpublished Ph.D. thesis, National University of Modern language,
Islamabad.
Suranovic M. Steven (2004): The International Economy; International Trade
Theory and Policy, (Trade: Chapter 5): http://stevesuranovic.blogspot.com;
Telegraph Daily; (newspaper): http://www.telegraph.co.uk: Retrieved on 2007-
04-23
The Daily Dawn; Textile Industry at Crossroads, (Dr. Bari): Dawn, January, 01,
2007), http://www.dawn.com/2007/01/01: Retrieved on 2008-04-23
The Forbes Global (2000): List of Top 2000 Global Companies, 2008.
http://www.forbes.com. Retrieved on 2008-01-29
The Planning Commission of Pakistan: http://www.pakistan.gov.pk
The World’s Richest People: Gates No Longer World’s Richest Man, 2008.
http://www.forbes.com. Retrieved on 2008-05-02
The World’s Richest People: Special Report (2007): http://www.forbes.com.
Retrieved on 2008-01-29
Thirtle, C., Beyers, L., Ismael, Y. and Piese, J. (2003): Can GM-technologies
help the poor? The impact of Bt cotton in Makhathini Flats, KwaZulu-Natal, South
Africa. World Development. Vol. 31, No.4, pp 717-731, 2003.
Trade not Aid: Time Magazine: http://www.time.com

213
Trade Policy Speech: Minister for Commerce (2008): Ministry of Commerce,
Government of Pakistan, Islamabad. http://www.commcerce.gov.pk
Trade Theories:
Trade, not aid, is what Africa needs: the Financial Express; (newspaper):
Retrieved on 2007-12-28: http://www.financialexpress.com
Trade: http://en.wikipedia.org/wiki/Trade
Traxler, G., S. Godoy-Avila, J. Falck-Zepeda, and J. Espinoza-Arellan (2001):
TransgenicCotton in Mexico: Economic and Environmental Impacts, Auburn: Auburn
University.
UK Soil Association (2002): Seeds of Doubt: North American Farmers
Experience of GM Crops, Bristol: UK Soil Association.
UNDP (1999): Human Development Report, New York: Oxford University Press
UNDP (2006): Sectoral and Contextual Studies on Trade: Trade Initiatives from
Human Development Perspective Project (TIHP- UNDP), A Country Case Study. United
Nations Development Program, Pakistan
University of Puget Sound: Political Economy: Retrieved on 2007-07-22:
Website: http://www.up.edu/x12490.xml
USA History; Trade not aid, (Anthea Spitaliotis): http://www.usahistory.com
Wang, G., Wu, Y. Gao, W., Fok, M. and Liang, W. (2008): Impact of Bt cotton
on the farmer’s livelihood system in China. ISSCRI International Conference
“Rationales and evolutions of cotton policies”, Montpellier, May 13-17, 2008.
Warr PG (1994): Comparative and competitive advantage. Asia-Pacific
Economic Literature 8(2):1-14.

214
Watson, Peter (2005): Ideas: A History of Thought and Invention from Fire to
Freud. Harper Collins; ISBN 0-06-621064-X
Welch Jack (1997): Jack Welch Speaks: Wisdom from the World’s Greatest
Business Leader, Janet C. Lowe, John Wiley & Sons Inc, New York
What is Development: Adam Szirmai: The Dynamics of Socio- Economic
Development: An Introduction. Cambridge University Press 0521817633
What is Productivity? Diane Galarneau and Cécile Dumas (1993): About
Productivity Spring 1993 (Vol. 5, No. 1) Article No. 5. (IS 931 A5)
What is the WTO?: World Trade Organization: http://www.wto.org
Woodruff, W. (1971): ‘The emergence of an international economy 1700-1914’,
in Cipolla (ed) The Fontana Economic History of Europe 4: 662.
World Bank Report (2000): The Quality of Growth: (2000): (V. Thomas, M.
Dailami): http://www.worldbank.org: Retrieved on 2006-12-23
World Bank, Poverty Rates; (1981 - 2002): http://www.worldbank.org :
Retrieved on 2007-06-04.
World Bank: Globalization, Growth, and Poverty: Facts, and an Agenda for
Action http://www.worldbank.org: Retrieved on 2007-12-29
World Development Report (1990): World Trade Organization, Switzerland,
United Nations Conference on Trade and Development, Publication. New York and
Geneva,
World Economic Prospects (2007): http://www.euromonitor.com/: Retrieved in
2007
215
World Economy: Wikipedia, the free encyclopedia; http://wikipedia.org:
Retrieved on 2008-03-22
World Investment Report: Transnational Corporations, Extractive Industries and
Development (2005): United Nations Conference on Trade and Development,
Publication. New York and Geneva
World Trade Organization, (WTO): http://www.wto.org
World Trade Report (2006): exploring the links between Subsidies, Trade, and
the WTO. World Trade Organization, Switzerland
World Trade Report (2007): World Trade Organization, Geneva, Switzerland
World Trade Report (2007): World Trade Organization, Switzerland, United
Nations Conference on Trade and Development, Publication. New York and Geneva,
World Trade Report (2007): World Trade Organization, Switzerland
WTO (2007): Trade Profiles, 2007. World Trade Organization, Switzerland
WTO Industrial Negotiations: Implications for Pakistan: Actionaid, Pakistan
www.actionaid.org/pakistan
WWF: Promoting Better Environmental Practices in the Textile Processing
Sector of Pakistan: http://www.wwfpak.org/toxics_bettertextileprocessing.php: Retrieved
on 2008-04-23
Yamada, Miwa (2008): Evolution in the Concept of Development: How Has The
World bank’s Legal Assistance Extended its Reach? Institute of Development
Economics: http://www.ide.go.jp
Yip, George (1999): (Dean, Rotterdam School of Management, Erasmus
University) http://en.wikipedia.org/wiki/George_Yip

216
Zafar, A. (1983): Pakistani Entrepreneurs; Their Development, Characteristics
and Attitudes, Croom Helm Ltd, Provident House, Burrell Row, Beckenham, Kent BR3
1AT, Australia Alexander Hamilton: http://en.wikipedia.org/wiki/Alexander_Hamilton
Zafar, A. (2008): Challenges in the Pakistan Cotton, Yarn, Textile, and Apparel
Sectors, Chapter-3 Discussion Paper entitled “Cotton-Textile-Apparel Sectors of
Pakistan: Situations and Challenges Faced edited by Cororaton, C.B. et al. 2008,
Markets, Trade and Institutions Division, IFPRI Discussion Paper 00800.
Zafar, A. (2009): Chairman, Pakistan Agricultural Research Council (PARC)
informed during one of his meeting with the scientists of PARC, Islamabad, Pakistan,
June, 2009.


