351 0 - pcbs.gov.ps
Palestine in Figures 2 0 0 9 3 5 1 Palestinian National Authority Palestinian Central Bureau of Statistics May, 2010
Transcript of 351 0 - pcbs.gov.ps

P a l e s t i n e
in Figures
2009
351Palestinian National Authority
Palestinian Central Bureau of Statistics
May, 2010

1
Palestinian Central Bureau of Statistics
Palestine in Figures2009
May, 2010

2
This document is prepared in accordance with the standard procedures stated in the Code of Practice for Palestine Official Statistics 2006.
© May, 2010All rights Reserved
Suggested Citation:
Palestinian Central Bureau of Statistics, 2010. Palestine in Figures 2009. Ramallah - Palestine
All correspondence should be directed to:Palestinian Central Bureau of StatisticsP. O. Box 1647. Ramallah - Palestine
Tel: (972/970) 2 2982700
Fax: (972/970) 2 2982710
E-Mail: [email protected]
Web-Site: http://www.pcbs.gov.ps

3
MAP OF PALESTINE

4

5
About the Palestinian Central Bureau of Statistics
The Palestinian Central Bureau of Statistics (PCBS) is the main provider of Palestine’s official statistics.. Its main function is to provide accurate and impartial official statistics on demographic, social, economic and area statistics to serve the Palestinian citizenry, and to serve the needs of businesses and theirorganizations for statistical information.
In this publication, PCBS introduced a new design with richer content, taking into consideration the needs of users and beneficiaries, and hoping that it will meet their requirements.
How can PCBS help you? Over the last few years we have laid great emphasis on developing and enhancing our services in order to meet users’ needs, and to achieve the overall goal of providing users with quality products and services. PCBS’ Division of Users Services is responsible for enabling the public to access statistical information on Palestine, and for answering specific questions from users.
All correspondence should be directed to:Palestinian Central Bureau of Statistics
P. O. Box 1647. Ramallah - PalestineTel: (972/970) 2 2982700Fax: (972/970) 2 2982710
E-mail: [email protected]: http://www.pcbs.gov.ps

6
Explanation of Symbols in Tables:
(-) = Nil(0) = Less than half of the unit(..) = Not available
Note: The data mentioned in this report represent the Palestinian 1. Territory (West Bank Including Jerusalem, and Gaza Strip), unless otherwise stated.
Data produced in this Booklet is based on two main sources: 2. first, the Palestinian Central Bureau of Statistics, where data derived from different surveys and censuses, and secondly, the data obtained from administrative records of public and private institutions. For those who need more detail on the sources, please contact the Division of User Services in PCBS.
Scholastics Year3. : starts in August of every year and ends in June of the following year.Agricultural Year: starts in October of every year and ends in 4. September of the following year.
7
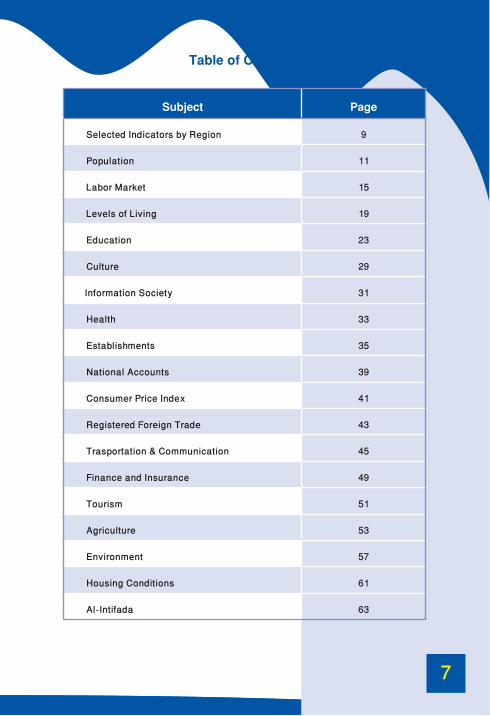
Table of Contents
Subject Page
Selected Indicators by Region 9
Population 11
Labor Market 15
Levels of Living 19
Education 23
Culture 29
Information Society 31
Health 33
Establishments 35
National Accounts 39
Consumer Price Index 41
Registered Foreign Trade 43
Trasportation & Communication 45
Finance and Insurance 49
Tourism 51
Agriculture 53
Environment 57
Housing Conditions 61
Al-Intifada 63

8

9
Selected Indicators by Region
IndicatorPalestinian
TerritoryWestBank
Gaza Strip
Total Area (km2) 6,020 5,655 365
Population Density (Capita/km2) 2009 654 433 4,073
Sex Ratio 2009 103.1 103.1 103.0
Crude Birth Rate 2009 32.7 30.1 36.9
Crude Death Rate 2009 4.3 4.4 4.1
Percentage of Population Less than 15 Years, Mid Year 2009 41.9 40.0 44.9
Percentage of Population 65 Years and above, Mid Year 2009 3.0 3.4 2.5
Life Expectancy at Birth for Males, Mid Year 2009 70.5 70.9 69.9
Life Expectancy at Birth for Females, Mid Year 2009 73.2 73.7 72.5
Natural Increase Rate, Mid Year 2009 2.9 2.7 3.3
Average of Household Size, 2007 5.8 5.5 6.5
Unemployment Rate 15 Years and Over, 2009 24.5 17.8 38.6
Percentage of Persons 10 Years and Over Who Use the Internet, 2009 32.3 32.7 31.5
Students Rates per Teacher in the Schools, 2007/2008 25.2 .. ..
Students Rate per Class in Basic Stage, 2008/2009 32.7 30.1 37.5
Students Rate per Class in Secondary Stage, 2008/2009 29.7 25.4 39.3
Adult literacy for persons 15 years and above, 2009 94.6 94.4 94.9
Beds in Hospitals per 1000 of Population, 2008 1.3 1.3 1.5
Average Number of Rooms in Housing Units, 2007 3.6 3.5 3.7
Average of Housing Density 2008 1.7 1.6 1.9
Number of Fixed Telephone Lines, 2008 354,804 251,261 103,543
Number of Internet Subscribers, 2007 529,476 366,643 162,833
Gross Domestic Product (US $ Million), 2008 4,820.9 3,705.4 1,115.5
Gross Domestic Product Per Capita (US $), 2008 1,340.4 1,718.4 774.5
Total Value of Exports, (Value in Million US $) 2008 558 558 ـ
Total Value of Imports, (Value in Million US $) 2008 3,466 2,908 558

10
Data showed that the population of the Palestinian Territory is young; the percentage of persons in the age group (0-15) was 41.9% of the total population in the Palestinian Territory 2009, 40.0% in the West Bank and 44.9% in Gaza Strip. The elderly population aged (65 years and over) was 3.0% of the total population in Palestinian Territory, 3.4% in the West Bank and 2.5% in Gaza Strip in the midyear 2009.
Crude birth rate declined in the Palestinian Territory during the period 1997 -2009.
Data showed that the crude birth rate in the Palestinian Territory dropped from 42.7 births per one thousand of the population in 1997 to 32.7 births in 2009. The crude birth rate in the West Bank was 30.1 births compared to 36.9 births in GazaStrip in 2009.

11
Population
Estimated Number of Palestinians in the World by Country of Residence,Mid Year 2009
Country Number Percent
Palestinian Territory 3,935,249 36.6
Israel 1,231,061 11.5
Arab Countries 4,960,234 46.2
Foreign Countries 611,507 5.7
Total 10,738,051 100
The estimated number of Palestinians all over the world Mid Year 2009 was 10.7 million distributed as follows: 3.9 million in the Palestinian Territory (36.6% of the total Palestinians all over the world); 1.2 million (11.5%) in Israel; 5.0 million (46.2%) in the Arab countries. The number of Palestinians living in foreign countries wasestimated to be 612 thousand (5.7%) of the total Palestinians in the world.
Estimated Population in the Palestinian Territory by Region and Sex, Mid Year 2009
RegionNumber of Population
Males Females Both Sexes
Palestinian Territory 1,997,625 1,937,624 3,935,249
West Bank 1,243,064 1,205,369 2,448,433
Gaza Strip 754,561 732,255 1,486,816
The population of the Palestinian Territory was estimated about 3.9 million midyear 2009, distributed as (62.2%) in the West Bank and (37.8%) in Gaza Strip

12
Estimated Crude Birth Rate and Crude Death Rate in the Palestinian Territory by Region, Selected Years
RegionYear
1997 2000 2005 2007
Palestinian Territory
Crude Birth Rate 42.7 40.9 37.3 32.7
Crude Death Rate 4.9 4.5 4.0 4.3
West Bank
Crude Birth Rate 41.2 38.8 34.5 30.1
Crude Death Rate 5.1 4.6 4.1 4.4
Gaza Strip
Crude Birth Rate 45.4 44.5 42.2 36.9
Crude Death Rate 4.7 4.3 3.9 4.1
Population Pyramid in the Palestinian Territory Mid Year, 2009
Data showed that the population of the Palestinian Territory is young; the percentage of individuals in the age group (0-14) was 41.9% of the total population in the Palestinian Territory mid year 2009, The elderly population aged (65 years and over ) was 3.0% of the total population in Palestinian Territory in mid year2009.

13
Average Household’s Size, Sex Ratio in the Palestinian Territory by Governorate, 1997, 2007
GovernorateAverage Household Size Sex Ratio
1997 2007 1997 2007
Palestinian Territory 6.3 5.8 103.2 103.1
West Bank 6.0 5.5 103.2 103.1
Jenin 5.9 5.3 103.8 103.2
Tubas 6.1 5.3 103.1 103.3
Tulkarm 5.8 5.3 102.2 102.1
Nablus 5.9 5.4 103.3 102.3
Qalqilya 6.1 5.6 105.7 105.2
Salfit 6.0 5.4 103.6 103.3
Ramallah & Al-Bireh 5.9 5.3 100.4 101.4
Jericho & Al Aghwar 6.2 5.5 101.7 100.3
Jerusalem 5.4* 5.2 102.1* 103.5
Bethlehem 5.8 5.3 104.8 103.8
Hebron 6.7 6.1 104.9 104.1
Gaza Strip 6.9 6.5 103.1 103.0
North Gaza 7.2 6.7 103.7 103.7
Gaza 6.9 6.5 103.6 103.5
Deir Al-Balah 6.9 6.4 102.4 101.6
Khan Yunis 6.9 6.3 102.5 103.1
Rafah 6.9 6.5 102.0 101.8*Based on the projected number of population in those parts of Jerusalem which were annexed in 1967 by Israel.
Data indicated that there is a decrease in the average household’s size in the Palestinian Territory, where the average size was 5.8 person in 2007 compared with 6.3 in 1997. The average family household’s size in the West Bank was 5.5 person in 2007 compared with 6.0 in 1997, while in the Gaza Strip, the averagesize was 6.5 person in 2007 compared with 6.9 in 1997.

14
Registered Marriages and Divorces at the Shari’a Courts and Churches in the Palestinian Territory by Governorate, 2008
Governorate Registered Marriages Registered DivorcesPalestinian Territory 33,774 4,399West Bank 19,006 2,803Jenin 2,326 272Tubas 417 32Tulkarm 1,540 301Nablus 2,822 433Qalqilya 840 173Salfit 609 99Ramallah & Al-Bireh 1,804 382Jericho & Al Aghwar 306 56Jerusalem 2,927 438Bethlehem 494 111Hebron 4,921 506Gaza Strip 14,768 1,596North Gaza 2,754 289Gaza 5,335 625Deir Al-Balah 1,838 181Khan Yunis 2,984 298Rafah 1,857 203
The registered marriages in the Palestinian Territory in 2008 reached 33,774 contracts, of which 19,006 in the West Bank and 14,768 in Gaza Strip.Registered divorces in 2008 totaled 4,399 in the Palestinian Territory, of which 2,803 in the West Bank and 1,596 in Gaza Strip.
Percentage Distribution of Private Households in the Palestinian Territory by Region, 2007
Household Type Palestinian Territory West Bank Gaza Strip
One Person Household 3.5 4.1 2.4Nuclear Household 78.9 81.9 73.0Extended Household 16.4 12.2 24.5Composite Household 0.1 0.2 0.1Not Stated 1.1 1.6 0.0Total 100 100 100
The results of the census 2007 showed that 78.9% of all private households in the Palestinian Territory were nuclear households; in the West Bank 81.9% of private households were nuclear households compared to 73.0% in Gaza Strip. The extended household formation in the Palestinian Territory represented 16.4% of private households in 2007. The percentage of one person households and composite households in the Palestinian Territory for the same year were 3.5% and 0.1% respectively.

15
Labor Market Percentage Distribution of Population 15 Years and Above in the Palestinian
Territory by Labor Force Status and Region (ILO Standards), 2009
Labor Force Status Palestinian Territory WestBank
GazaStrip
Full Employment (working full time: 35 hours and above per week) 28.9 33.3 21.0
Working less than usual (lack of employment) 1.7 2.0 1.0
Working under poor conditions or forinsufficient income 0.8 0.7 1.0
Did not work and seeking job 10.2 7.8 14.5
Did not work and did not seek job due todiscouragement 3.3 3.2 3.4
Did not work – Old or illness 6.1 6.2 5.9
Did not work – Home duties 27.7 27.0 28.8
Did not work – Students 21.3 19.8 24.4
Total 100 100 100
Population Aged 15 Years and Above in the Palestinian Territory by Labor Force Status and Region (ILO Standards), 2005-2009
Labor Force Status and Region 2005 2006 2007 2008 2009
Palestinian Territory
Labor Force Participation Rate 40.7 3.41 41.9 41.3 41.6
Unemployment Rate 23.5 6.23 21.5 26.0 24.5West Bank
Labor Force Participation Rate 42.9 44.1 44.1 43.0 43.8
Unemployment Rate 20.3 18.6 17.7 19.0 17.8Gaza Strip
Labor Force Participation Rate 36.7 1.36 38.0 38.1 37.6
Unemployment Rate 30.3 34.8 29.7 40.6 38.6
The labor force participation rate in the Palestinian Territory continued at thesame level in 2009 compared with 2008.Unemployment rate in the Palestinian Territory decreased from 26.0% in 2008 to 24.5% in 2009. It decreased from 40.6% to 38.6% in Gaza Strip and from 19.0 % to 17.8% in the West Bank.

16
Percentage Distribution of Persons Aged 15 Years Above in the PalestinianTerritory by Labor Force Status and Region, 2009
RegionIn
Labor Force
Outside LaborForce
Total Employment Unemployment Total
According to ILO Standards
Palestinian Territory 41.6 58.4 100 75.5 24.5 100
West Bank 43.8 56.2 100 82.2 17.8 100
Gaza Strip 37.6 62.4 100 61.4 38.6 100
According to the Relaxed Definition
Palestinian Territory 44.8 55.2 100 69.9 30.1 100
West Bank 46.9 53.1 100 76.6 23.4 100
Gaza Strip 41.0 59.0 100 56.2 43.8 100
Unemployed (According to the ILO Standards):Unemployed persons are those individuals aged 15 years and over who did not work at all during the reference period, who were not absent from a job, were available for work and actively seeking a job during the reference period by one of the following methods news paper, registered at employment office, ask friends or relatives or any other method.
Unemployed (According to the Relaxed Definition):The number of unemployed persons was calculated under the relaxed definition by adding those persons outside labour force because they were frustrated. To unemployed persons according to the ILO Standards,

17
Unemployment Rate of Participation Persons in Labor Force by Years of Schooling and Sex (ILO Standards) in the Palestinian Territory, 2005- 2009
Sex and Years of Schooling 2005 2006 2007 2008 2009
Males0 16.4 5.16 19.4 23.1 26.11-6 28.8 31.0 26.1 33.0 30.27-9 26.0 26.8 24.4 29.0 26.910-12 24.1 25.0 23.9 27.4 25.413+ 16.6 15.9 14.5 18.6 16.5Total 23.7 24.2 22.1 26.5 24.1
Females0 1.6 1.8 1.2 2.7 3.21-6 7.8 9.1 4.3 7.4 5.37-9 11.3 9.1 6.3 7.1 8.310-12 17.2 13.2 9.6 13.1 15.313+ 32.5 31.3 32.4 34.9 35.7Total 22.3 20.5 19.0 23.8 26.4
Both Sexes0 8.0 8.4 8.9 12.3 14.81-6 26.2 27.9 22.6 29.2 26.97-9 24.8 25.1 22.5 27.3 25.510-12 23.5 23.9 22.3 26.0 24.513+ 21.8 20.8 20.3 24.4 23.5Total 23.5 23.6 21.5 26.0 24.5
Unemployment Rate of Participation of Persons in Labor Force in thePalestinian Territory by Age Groups, 2009
Results revealed that unemployment is concentrated among the youth aged 15-24 years with 38.9%, followed by persons aged 25-34 yearswith 24.9% in 2009.

18
Percentage Distribution of Employed Persons Aged 15 Years and Above in thePalestinian Territory by Economic Activity, Selected Years
Economic Activity 1999 2000 2005 2006 2007 2008 2009
Agriculture, Hunting, Forestry &Fishing
12.6 13.7 14.6 16.1 15.6 13.4 11.8
Mining, Quarrying & Manufacturing 15.5 14.3 13.0 12.4 12.5 12.1 12.1Construction 22.1 19.7 12.9 11.1 11.0 10.9 11.7Commerce, Hotels & Restaurants 17.0 17.5 19.4 19.2 19.5 20.2 19.1
Transportation, Storage &Communication
4.7 4.9 5.7 5.7 5.6 5.0 5.7
Services & Other Branches 28.1 29.9 34.4 35.5 35.8 38.4 39.6 Total 100 100 100 100 100 100 100
The results showed that more than one third of employed persons (39.6%) from the Palestinian Territory were employed in the services sector while 19.1% were employed in commerce, hotels and restaurants. The construction sector has been the most affected since 1999 with only 11.7% employed in 2009.
Distribution of Employed Persons Aged 15 Years and Above in the Palestinian Territory by Place of Work, 2005-2009
Results indicated that employed persons in 2009 were distributed by place of work as follows: 63.4% working in the West Bank, 26.4% working in Gaza Strip, and 10.2% working in Israel and the settlements.

19
Levels of Living
Concepts and Definitions:
Expenditure: Includes the following:
Cash spent on purchase of goods and services for living purposes.- The value of goods and services payments or part of payments received from - the employer.Cash expenditure spent as taxes (non-commercial or non-industrial), gifts, - contributions, interests on debts and other non-consumption items.
Consumption: Includes the following:
Cash spent on purchase of goods and services for living purposes.- The value of goods and services payments or part of payments received from - the employer.Own-produced goods and food, including consumed quantities during the - recording period.Estimated rent value of the dwelling.-
Relative Poverty line: It refers to the estimation of poverty line that what covers the household’s basic needs (shelter, clothes, and food), in addition to other needs including health care, education, transportation, personal care, and housekeeping supplies for household of 6 members (2 adults and 4 children).
Deep Poverty line: It refers to the estimation of what covers household’s basic needs (shelters, clothes, and food) for household of 6 members (2 adults and 4children).
Poverty Gap: gives the percentage by which the average income of the poor isbelow the poverty line.
Poverty severity: gives the mean of the squared consumption deficits.

20
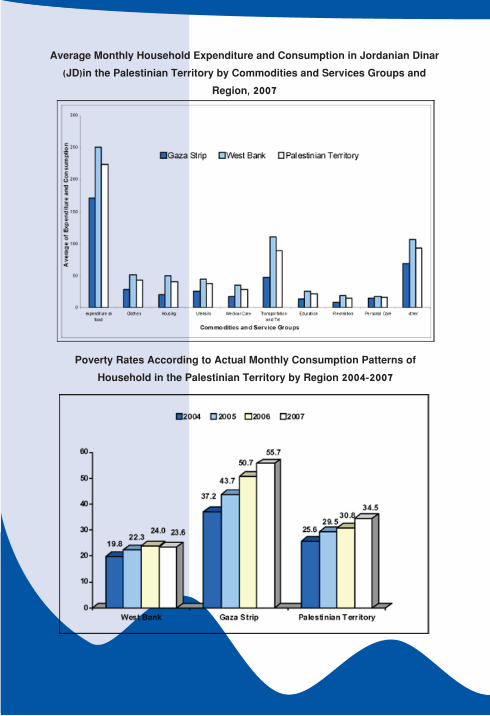
Average Monthly Household’s Expenditure and Consumption in Jordanian Dinar (JD) in the Palestinian Territory by Commodities,
Services Groups and Region, 2007
Commodities and Services Groups Palestinian Territory West Bank Gaza Strip
Food Cash Expenditure 223.8 250.7 171.6
Total Food Consumption 233.3 263.5 174.9
Non-Food Cash Expenditure 342.0 414.9 200.7
Total Non-Food Consumption 442.7 527.3 278.9
Total Consumption 676.0 790.8 453.8
Total Cash Expenditure 607.8 707.7 414.5
Percentage Distribution of Household’s Consumption in Jordanian Dinar (JD)in the Palestinian Territory by Commodities, Services Groups and Region, 2007
Commodities and Services Groups Palestinian Territory West Bank Gaza Strip
Total Food Consumption 34.5 33.3 38.5
Total Non-Food Consumption 65.5 66.7 61.5
Total Consumption 100 100 100
According to data presented in the above table, it is noticed that the level of living in the West Bank is better than in Gaza Strip. Data showed that the percentage of consumption on food in the West Bank was 33.3% compared to 38.5% in Gaza Strip, while the consumption on non-food from the total consumption in WestBank and Gaza Strip were 66.7% and 61.5% respectively

21
Poverty Rates According to Consumption of the Palestinian Household in the Palestinian Territory by Region, 2004-2007
Year
Poverty Rates
Region Poverty Poverty
GapPoverty Severity
Deep Poverty
2004
West Bank 19.8 4.8 2.6 11.6
Gaza Strip 37.2 10.4 6.3 26.0
Palestinian Territory 25.6 6.6 3.9 16.4
2005
West Bank 22.3 5.8 3.0 13.1
Gaza Strip 43.7 12.5 7.1 27.9
Palestinian Territory 29.5 8.0 4.4 18.1
2006
West Bank 24.0 6.1 2.9 13.0
Gaza Strip 50.7 14.8 8.0 34.8
Palestinian Territory 30.8 8.3 4.2 18.5
2007
West Bank 23.6 5.8 3.2 13.9
Gaza Strip 55.7 17.6 11.4 43.0
Palestinian Territory 34.5 9.8 6.0 23.8
Poverty Rates According to Consumption of the Palestinian Household in thePalestinian Territory by Locality Type, 2007
Type of Locality Poverty Poverty GapPoverty Severity Deep Poverty
Urban 33.1 8.8 5.5 23.9
Rural 30.3 8.7 5.0 18.1
Refugee camp 47.7 15.6 9.7 34.6
22
Average Monthly Household Expenditure and Consumption in Jordanian Dinar (JD)in the Palestinian Territory by Commodities and Services Groups and
Region, 2007
Poverty Rates According to Actual Monthly Consumption Patterns ofHousehold in the Palestinian Territory by Region 2004-2007

23
Education
Basic and Secondary Education Indicators in the Palestinian Territory,2004 /2005 -2008 /2009
IndicatorScholastic Years
2004/2005 2005/2006 2006/2007 2007/2008 2008/2009
SchoolsGovernment 1,661 1,726 1,775 1,833 1,871UNRWA 273 279 286 309 315Private 258 272 276 288 302Total 2,192 2,277 2,337 2,430 2,488
StudentsMales 526,038 535,028 543,265 548,759 554,611Females 517,897 532,461 542,009 549,198 554,515Both Sexes 1,043,935 1,067,489 1,085,274 1,097,957 1,109,126
Teachers*Males 17,810 19,520 19,080 19,430 11,680Females 20,994 22,865 23,215 24,129 16,213Both Sexes 38,804 42,385 42,295 43,559 27,893
ClassesMales 12,097 12,604 12,961 13,675 14,037Females 12,137 12,724 13,199 13,577 13,906Co-Education 5,581 5,691 5,803 6,105 6,409Total 29,815 31,019 31,963 33,357 34,352Note: The data does not include the Israeli Municipality and Culture Committee Schools in Jerusalem.* In the scholastic year 2008/2009,data includes school teachers in West Bank only.
75% Of the total schools in the Palestinian Territory were under the supervision of Government, and females constituted 50% of all school students in the scholastic year 2008/2009.
24
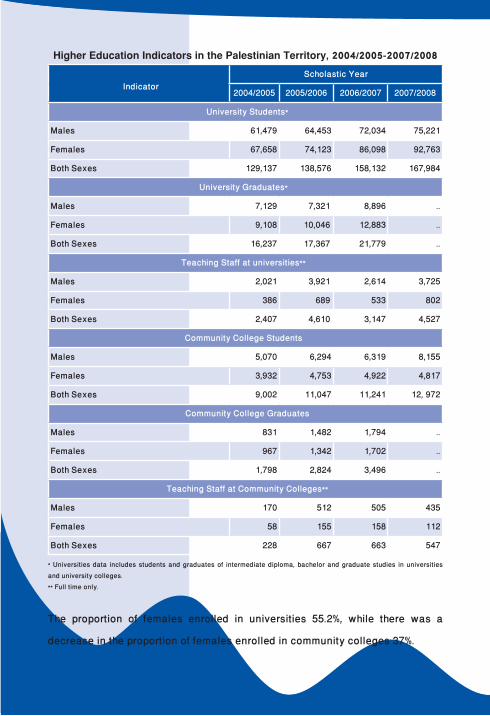
Higher Education Indicators in the Palestinian Territory, 2004/2005-2007/2008
IndicatorScholastic Year
2004/2005 2005/2006 2006/2007 2007/2008
University Students*
Males 61,479 64,453 72,034 75,221
Females 67,658 74,123 86,098 92,763
Both Sexes 129,137 138,576 158,132 167,984
University Graduates*
Males 7,129 7,321 8,896 ..
Females 9,108 10,046 12,883 ..
Both Sexes 16,237 17,367 21,779 ..
Teaching Staff at universities**
Males 2,021 3,921 2,614 3,725
Females 386 689 533 802
Both Sexes 2,407 4,610 3,147 4,527
Community College Students
Males 5,070 6,294 6,319 8,155
Females 3,932 4,753 4,922 4,817
Both Sexes 9,002 11,047 11,241 12, 972
Community College Graduates
Males 831 1,482 1,794 ..
Females 967 1,342 1,702 ..
Both Sexes 1,798 2,824 3,496 ..
Teaching Staff at Community Colleges**
Males 170 512 505 435
Females 58 155 158 112
Both Sexes 228 667 663 547
* Universities data includes students and graduates of intermediate diploma, bachelor and graduate studies in universities and university colleges.** Full time only.
The proportion of females enrolled in universities 55.2%, while there was a
decrease in the proportion of females enrolled in community colleges 37%.

25
Pre School Education Indicators in the Palestinian Territory, 2004/2005-2008/2009
IndicatorScholastic Year
2004/2005 2005/2006 2006/2007 2007/2008 2008/2009*Kindergartens
Government 3 4 4 3 2Private 898 931 941 969 669Total 901 935 945 972 671
ChildrenMales 38,099 39,835 40,831 43,626 26,725Females 35,020 37,307 38,120 40,697 25,285Both Sexes 73,119 77,142 78,951 84,323 52,010
TeachersMales 23 25 31 20 12Females 2,837 2,942 3,108 3,265 2,052Both Sexes 2,860 2,967 3,139 3,285 2,064
ClassesMales 13 13 12 15 5Females 22 15 25 30 31Co-Education 2,912 3,052 3,122 3,327 2,123Total 2,947 3,080 3,159 3,372 2,159
Note: The data does not include the Israeli Municipality and Culture Committee kindergartens in Jerusalem.* Data of scholastic year 2008/2009 includes West Bank data only.
The government runs a very small number of kindergartens, while the private sector is the main provider of this type of education.
Drop-Out Rates from Schools in the Palestinian Territory by Stage and Sex, 2003/2004-2006/2007
Stage and SexScholastic Year
2003/2004 2004/2005 2005/2006 2006/2007Basic Stage
Males 0.9 0.9 0.8 1.3Females 0.6 0.6 0.5 0.5Both Sexes 0.7 0.7 0.6 0.9
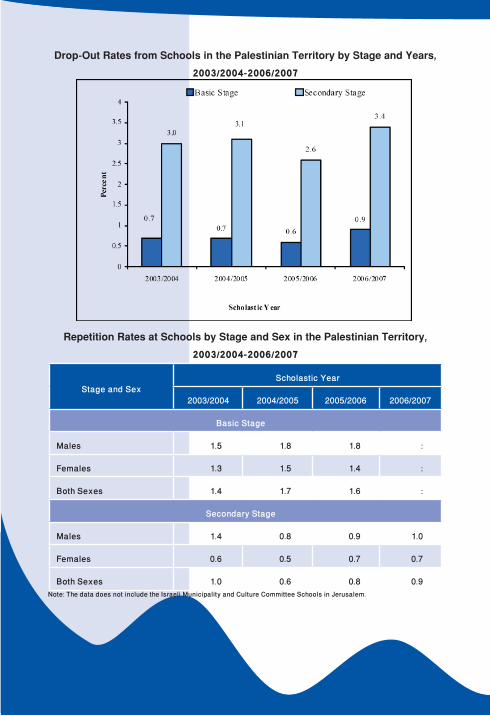
Secondary StageMales 2.3 2.5 2.3 3.0Females 3.6 3.7 2.9 3.8Both Sexes 3.0 3.1 2.6 3.4
Note: The data does not include the Israeli Municipality and Culture Committee Schools in Jerusalem.
26
Drop-Out Rates from Schools in the Palestinian Territory by Stage and Years, 2003/2004-2006/2007
Repetition Rates at Schools by Stage and Sex in the Palestinian Territory, 2003/2004-2006/2007
Stage and SexScholastic Year
2003/2004 2004/2005 2005/2006 2006/2007
Basic Stage
Males 1.5 1.8 1.8 :
Females 1.3 1.5 1.4 :
Both Sexes 1.4 1.7 1.6 :
Secondary Stage
Males 1.4 0.8 0.9 1.0
Females 0.6 0.5 0.7 0.7
Both Sexes 1.0 0.6 0.8 0.9Note: The data does not include the Israeli Municipality and Culture Committee Schools in Jerusalem.

27
Average Number of Students per Class in the Palestinian Territory by Stage and Supervising Authority, 2004/2005-2008/2009
Stage and SupervisingAuthority
Scholastic Year
2004/2005 2005/2006 2006/2007 2007/2008 2008/2009
Total
Total 35.0 34.4 34.0 32.9 32.3
Government 34.3 33.9 33.3 32.6 32.1
UNRWA 42.4 41.1 40.9 37.9 37.3
Private 23.9 23.7 24.6 24.5 24.4
Basic Stage
Total 35.6 35.0 34.5 33.3 32.7
Government 34.8 34.4 33.7 33.0 32.4
UNRWA 42.4 41.1 40.9 37.9 37.3
Private 24.5 24.2 25.1 25.0 24.6
Secondary Stage
Total 30.7 30.7 30.6 30.4 29.7
Government 31.6 31.5 31.4 31.2 30.4
Private 17.6 18.1 19.1 19.3 19.7
Although there is a decline of in the average number of students per class in UNRWA schools, it is still the highest among the three supervisory authorities.
Average Number of Students per Teacher in the Palestinian Territory bySupervising Authority, 2004/2005-2007/2008
Supervising AuthorityScholastic Year
2004/2005 2005/2006 2006/2007 2007/2008
Total 26.9 26.1 25.7 25.2
Government 26.5 25.8 25.3 25.1
UNRWA 33.4 31.5 31.3 29.8
Private 16.7 16.8 17.5 17.3

28
Percentage Distribution of Persons (15 Years and Above) in the PalestinianTerritory by Educational Attainment, 2004-2009
Educational AttainmentYear
2004 2005 2006 2007 2008 2009Total 100 100 100 100 100 100Illiterate 7.7 7.1 6.5 6.1 5.8 5.4Can Read and Write 7.7 7.3 7.2 7.3 6.4 6.3Elementary 18.5 18.6 17.7 17.2 16.0 15.6Preparatory 34.7 35.6 35.7 35.9 36.1 36.8Secondary 19.4 19.3 20.2 20.4 21.8 21.0Intermediate Diploma 4.6 4.6 4.8 4.7 5.1 4.8Bachelor and above 7.3 7.5 7.8 8.4 8.8 10.1
Along with the decline in the illiteracy rate among individuals 15 years and above, there is a rise in the proportion of those with high educational qualifications (Intermediate diploma and above).
Educational Attendance of Persons (6 Years and Above) in the PalestinianTerritory by Age, Sex 2004-2006, 2008
Age and SexYear
2004 2005 2006 2008Both Sexes
6-11 96.0 98.4 98.5 99.212-14 96.4 97.2 97.6 96.615-17 84.2 86.1 85.5 86.518+ 11.7 12.0 12.1 13.5Total 44.5 45.8 46.1 46.1
Male6-11 96.2 98.5 98.3 99.212-14 96.2 96.3 96.3 95.115-17 81.8 83.5 80.6 81.618+ 12.8 12.3 12.2 13.0Total 45.1 46.1 45.6 45.7
Female6-11 95.8 98.3 98.8 99.112-14 96.6 98.2 99.0 98.115-17 86.6 89.0 90.5 91.918+ 10.7 11.6 12.1 13.9Total 44.0 45.6 46.6 46.6
Whereas education is seen as the only investment of the Palestinian people, there is an increase in enrollment for all age groups and both sexes.
29
Culture
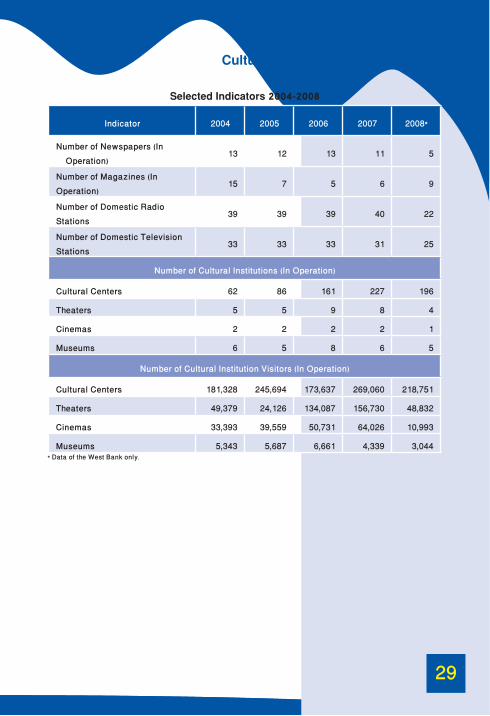
Selected Indicators 2004-2008
Indicator 2004 2005 2006 2007 2008*
Number of Newspapers (In Operation)
13 12 13 11 5
Number of Magazines (In Operation)
15 7 5 6 9
Number of Domestic Radio Stations
39 39 39 40 22
Number of Domestic Television Stations
33 33 33 31 25
Number of Cultural Institutions (In Operation)
Cultural Centers 62 86 161 227 196
Theaters 5 5 9 8 4
Cinemas 2 2 2 2 1
Museums 6 5 8 6 5
Number of Cultural Institution Visitors (In Operation)
Cultural Centers 181,328 245,694 173,637 269,060 218,751
Theaters 49,379 24,126 134,087 156,730 48,832
Cinemas 33,393 39,559 50,731 64,026 10,993
Museums 5,343 5,687 6,661 4,339 3,044* Data of the West Bank only.

30
Percentage of Availability of Mass Media for the Household in the Palestinian Territory by Region, 2009
ICT Tools Palestinian Territory West Bank Gaza Strip
Percentage of Households that have:
TV Set 95.7 97.0 93.2
Video 14.9 19.7 5.6
Home Library 20.3 22.1 16.8
Percentage of Persons (10 Years and Above) Who are Members in Cultural Institutions in the Palestinian Territory by Type of Cultural Institution and
Region, 2009
Cultural Institution Palestinian Territory West Bank Gaza Strip
Sports Club 6.9 8.4 4.3
Cultural Club 3.0 4.3 0.7
Public Library 3.3 4.2 1.9
Charitable Society 4.3 5.1 3.0
Union 4.6 5.1 3.6
Political Party 3.5 4.2 2.2
Other 2.0 0.5 4.5

31
Information Society
Percentage of Households in the Palestinian TerritoryWho Have Some ICT Tools by selected Years
The percentage of households having a computer in the Palestinian Territory reached 49.2%, in 2009 compared with 26.4% in 2004. With regard to internet connectivity, 28.5% of households in the Palestinian Territory have Internet connection in 2009 compared with 9.2% in 2004 . while the percentage of households that own TV dish in the Palestinian Territory was 92.0% in 2009 compared with 74.4% in 2004. The data also indicated that 92.4% of the Palestinian households (at least one member) possess a mobile phone in 2009 comparedwith 72.8% in 2004.
Percentage of Persons (10 Years and Above) in the Palestinian Territory Who Use Computer and the Internet by Selected Years
The data showed that 57.1% of persons (aged 10 years and Above) use computer in the Palestinian Territory in 2009 compared with 35.7% in 2004. Data revealed that 32.3% of persons (10 years and Above) use Internet in 2009 comparedwith 11.9% in 2004.

32
ICT Access Among Economic Enterprises in the Palestinian Territory, 2007
Indicator Percentage Percentage of Enterprises Using Computer 21.3 Percentage of Enterprises Using Internet 12.7Percentage of Enterprises Practiced Electronic transactions 2.3Percentage of Enterprises having Website 2.6Percentage of Enterprises Engaged in Research and Development in (IT) 1.2Number of Computers in Enterprises Per 100 Employees 24.0Percentage of Employees Who Are Using Computer 22.0Percentage of Employees Who Are Using the Internet 15.0Percentage of (IT) Specialist 3.5
21.3% of economic enterprises in the Palestinian Territory used computers in the year 2007; while 12.7% of the total number of enterprises accessed the internet. Also 2.3% of the enterprises were using electronic transactions and the percentage of enterprises that have website was 2.6%.
Main Indicators for Research and Development (R&D) in the West Bank, 2007-2008
IndicatorYear
2007 2008Number of Enterprises Engaged in R&D that completed interview 38 40Number of R&D Personnel 1,555 1,542Number of R&D Personnel with Full – Time Equivalent FTE 566 669Number of Researchers in R&D 981 992Number of Researchers (Males) in R&D 744 765Number of Researchers (Females) in R&D 237 227Number of Researchers in R&D with FTE 280 363Number of Researchers in R&D with FTE Per Million inhabitants 120 150Total Expenditure on R&D (million$) 11.5 10.9Percentage of External Funds for R&D 50.4 40.3Expenditure on R&D Per Researcher with FTE (Thousands $) 41 30
Data showed that the number of employees in research and development reached 1,542 workers representing 669 workers in Full-Time Equivalent in 2008 (Full-Time Equivalent defined as 90.0% of the total number of working hours in the year on research and development) compared with 1,555 workers representing 566 workers in full time equivalent in 2007. The number of researchers was 992 of whom 363 researchers in full time equivalent in 2008 compared with 981 researchers of whom 280 researchers in full time equivalent in 2007.

33
Health
Governmental & Non-Governmental Hospitals Activitiesin the Palestinian Territory, 2004-2008
Indicator 2004 2005 2006 2007 2008
Number of GovernmentalHospitals 24 24 26 24 24
Number of Non-GovernmentalHospitals 50 52 52 53 52
Total Number of Beds 5,108 5,007 5,346 5,067 4,929
Grand Total of Beds Occupancy Rate (%) 61.3 64.5 62.4 65.2 60.0*
Mean of Duration (Days) 2.8 2.7 2.6 2.9 2.7*
Grand Total of Hospitalization Days 1,142,880 1,178,893 1,202,824 1,206,342 1,068,464*
*:Statistics do Not include non-governmental and private hospitals in Gaza Strip
The increase in the bed occupancy rate and in the hospitalization days ndicated that there is a need for increasing the number of beds in hospitals.
Rates of Physicians, Dentists, and Beds per 1000 Population in the Palestinian Territory, 1997-2008
YearRates per 1000 Population
Physicians Dentists Beds
1997 0.99 0.25 1.091998 1.15 0.33 1.301999 1.28 0.37 1.272000 1.40 0.39 1.402001 1.46 0.40 1.382002 1.44 0.39 1.472003 1.54 0.41 1.412004 1.56 0.42 1.402005 1.62 0.40 1.332006 1.60 0.55 1.372007 1.70 0.50 1.352008 1.90 0.60 1.30
Data shows that the rates of physicians, dentists and beds per 1000 persons isstill low compared to international rates.

34
35
Establishments
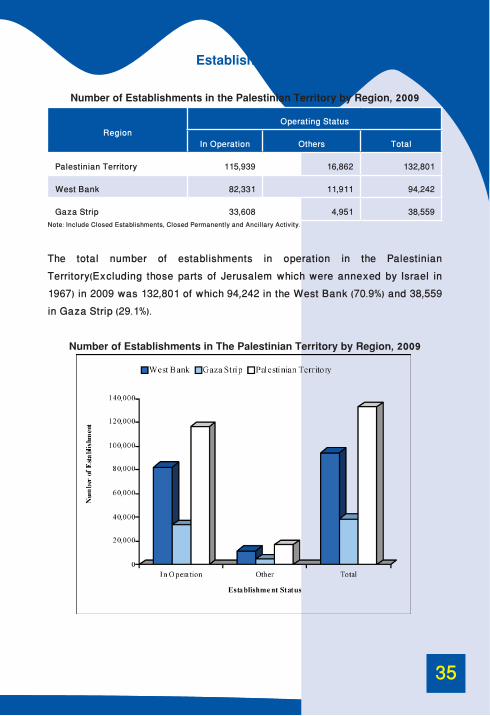
Number of Establishments in the Palestinian Territory by Region, 2009
RegionOperating Status
In Operation Others Total
Palestinian Territory 115,939 16,862 132,801
West Bank 82,331 11,911 94,242
Gaza Strip 33,608 4,951 38,559Note: Include Closed Establishments, Closed Permanently and Ancillary Activity.
The total number of establishments in operation in the Palestinian Territory(Excluding those parts of Jerusalem which were annexed by Israel in 1967) in 2009 was 132,801 of which 94,242 in the West Bank (70.9%) and 38,559 in Gaza Strip (29.1%).
Number of Establishments in The Palestinian Territory by Region, 2009

36
Number of Establishments in the Palestinian Territory by Governorate andOperating Status, 2009
GovernorateOperating Status
In Operation others Total
Palestinian Territory 115,939 16,862 132,801
West Bank 82,331 11,911 94,242
Jenin 11,693 2,046 13,739
Tubas 1,769 316 2,085
Tulkarm 6,570 1,124 7,694
Nablus 14,458 2,723 17,181
Qalqiliya 4,135 652 4,787
Salfit 2,351 267 2,618
Ramallah and Al-Bireh 11,683 1,529 13,212
Jericho & Al Aghwar 1,370 172 1,542
Jerusalem* 4,473 419 4,892
Bethlehem 6,272 693 6,965
Hebron 17,557 1,970 19,527
Gaza Strip 33,608 4,951 38,559
North Gaza 4,991 731 5,722
Gaza 13,887 2,256 16,143
Deir Al-Balah 4,722 807 5,529
Khan Yunis 6,115 709 6,824
Rafah 3,893 448 4,341*: Excluding those parts of Jerusalem which were annexed by Israel in 1967.
Hebron’s governorate has the highest number of establishments with 17,557 followed by Nablus governorate with 14,458 establishments and Gaza governorate with 13,887. Jericho and Al-Aghwar governorate has the lowest number of establishments with 1,370.

37
Number of Establishments in Operation in the Privates Sector, Non Governmental Organization Sector and Government Companies by Selected Economic Activity
in the Palestinian Territory, 2005 –2009
Economic Activity 2005 2006 2007 2008 2009
Industry 13,344 12,909 15,340 15,229 15,274
Financial Intermediation 468 727 844 844 846
Construction 644 570 627 590 521
Transport, storage & communications 869 823 1,215 1,175 1,116
Services activities (profit and non-profit) 20,099 19,967 24,655 24,603 24,420
Wholesale, retail trade & repairs 55,024 54,862 59,253 59,299 59,171Data do not include that part of Jerusalem which was annexed forcefully by Israel in 1967.
The distribution of operating establishments by economic activity in the private sector, non governmental organization sector and government companies, 2009 indicated that the activities of wholesale, retail and repairs came first with 59,171 establishments which represented 51.0%.
38

39
National Accounts
GDP by Economic Activity in Palestinian Territory* for the Period 2005-2008 at Constant Prices, (2004 is the Base Year)
Values: In Million US $
Economic Activity 2005 2006 2007 2008
Agriculture and fishing 236.2 240.3 252.2 286.1
Mining, Manufacturing, Electricity and Water Supply 774.9 648.6 695.6 717.5
Construction 310.2 312.3 299.1 314.4
Wholesale and retail trade 427.5 415.0 442.3 497.5
Transport 265.2 285.5 336.1 345.5
Financial intermediation 200.5 184.8 272.9 280.0
Services 1,047.5 849.3 931.1 1,007.0
Public administration and defense 641.5 679.1 658.8 685.2
Other** 656.0 707.4 666.0 687.7
Gross domestic produce 4,559.5 4,322.3 4,554.1 4,820.9* Execluding those part of Jerusalem which were annexed by israel in 1967.** Other includes: Public owned enterprises plus Households with employed persons minus FISIM plus VAT on imports, net plus Customs duties.
The value of GDP in 2008 indicate to overall growth rate of 5.9% compared with the year 2007.
40
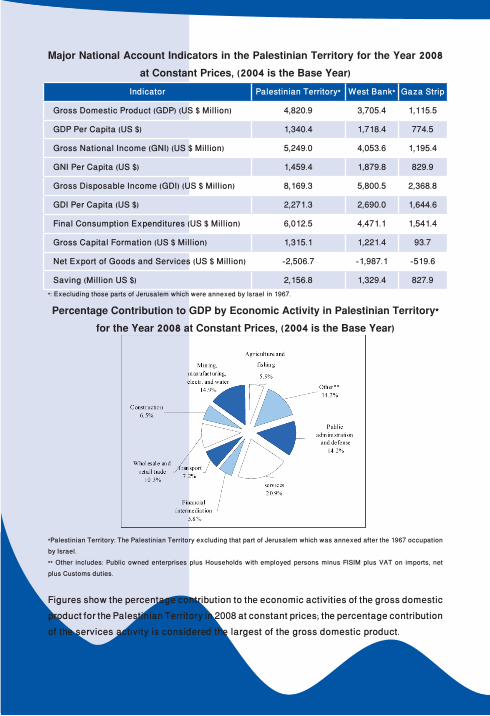
Major National Account Indicators in the Palestinian Territory for the Year 2008 at Constant Prices, (2004 is the Base Year)
Indicator Palestinian Territory* West Bank* Gaza Strip
Gross Domestic Product (GDP) (US $ Million) 4,820.9 3,705.4 1,115.5
GDP Per Capita (US $) 1,340.4 1,718.4 774.5
Gross National Income (GNI) (US $ Million) 5,249.0 4,053.6 1,195.4
GNI Per Capita (US $) 1,459.4 1,879.8 829.9
Gross Disposable Income (GDI) (US $ Million) 8,169.3 5,800.5 2,368.8
GDI Per Capita (US $) 2,271.3 2,690.0 1,644.6
Final Consumption Expenditures (US $ Million) 6,012.5 4,471.1 1,541.4
Gross Capital Formation (US $ Million) 1,315.1 1,221.4 93.7
Net Export of Goods and Services (US $ Million) -2,506.7 -1,987.1 -519.6
Saving (Million US $) 2,156.8 1,329.4 827.9*: Execluding those parts of Jerusalem which were annexed by Israel in 1967.
Percentage Contribution to GDP by Economic Activity in Palestinian Territory* for the Year 2008 at Constant Prices, (2004 is the Base Year)
*Palestinian Territory: The Palestinian Territory excluding that part of Jerusalem which was annexed after the 1967 occupation by Israel.** Other includes: Public owned enterprises plus Households with employed persons minus FISIM plus VAT on imports, net plus Customs duties.
Figures show the percentage contribution to the economic activities of the gross domestic product for the Palestinian Territory in 2008 at constant prices; the percentage contribution of the services activity is considered the largest of the gross domestic product.
41
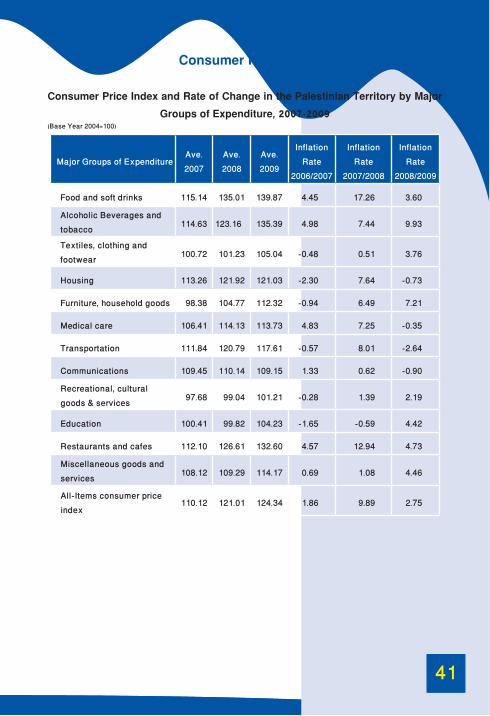
Consumer Price Index
Consumer Price Index and Rate of Change in the Palestinian Territory by MajorGroups of Expenditure, 2007-2009
(Base Year 2004=100)
Major Groups of ExpenditureAve.2007
Ave.2008
Ave.2009
InflationRate
2006/2007
InflationRate
2007/2008
InflationRate
2008/2009
Food and soft drinks 115.14 135.01 139.87 4.45 17.26 3.60
Alcoholic Beverages andtobacco 114.63 123.16 135.39 4.98 7.44 9.93
Textiles, clothing andfootwear 100.72 101.23 105.04 -0.48 0.51 3.76
Housing 113.26 121.92 121.03 -2.30 7.64 -0.73
Furniture, household goods 98.38 104.77 112.32 -0.94 6.49 7.21
Medical care 106.41 114.13 113.73 4.83 7.25 -0.35
Transportation 111.84 120.79 117.61 -0.57 8.01 -2.64
Communications 109.45 110.14 109.15 1.33 0.62 -0.90
Recreational, culturalgoods & services 97.68 99.04 101.21 -0.28 1.39 2.19
Education 100.41 99.82 104.23 -1.65 -0.59 4.42
Restaurants and cafes 112.10 126.61 132.60 4.57 12.94 4.73
Miscellaneous goods andservices 108.12 109.29 114.17 0.69 1.08 4.46
All-Items consumer priceindex
110.12 121.01 124.34 1.86 9.89 2.75

42

43
Registered Foreign Trade
Palestinian Exports Indicators in the Palestinian Territory, 2003-2008Value in Million US $
Indicator 2003 2004 2005 2006 2007 2008 Total Palestinian Exports 280 313 335 367 513 558
Total Palestinian Exports by Country To Israel 256 281 290 327 455 499 To Arab Countries 15 20 26 30 35 46To Other Countries 9 12 19 10 23 13
Total Distribution of Exports National Exports 196 216 234 264 347 390 Re- Exports 84 97 101 103 166 168
Total Exports by Region West Bank* 235 273 294 333 491 558Gaza Strip 45 40 41 34 22 ـ
*: Doesn’t include those parts of Jerusalem Governorate which were annexed by Israel in 1967.
The results indicate that there was an increase of exports during the years 2003–2008. The increase in exports in 2008 was 9% compared with 2007. The results reveal that the increase for the West Bank was 14% in 2008 compared with 2007 while there was no exports from Gaza Strip in 2008 due to the imposed siege .

44
Palestinian Imports Indicators in the Palestinian Territory, 2003-2008 Value in Million US $
Indicator 2003 2004 2005 2006 2007* 2008
Total Palestinian Imports 1,800 2,373 2,667 2,759 3,284 3,466
Total Imports by Means of Transportation
By Land** 1,522 2,102 2,411 2,337 2,730 2,817
Through Electricity Networks & Pipes
278 271 256 422 554 649
Total Imports by Country
From Israel 1,310 1,748 1,873 2,002 2,443 2,795
From EU Countries 155 205 241 226 246 223
From Arab Countries 46 65 69 67 86 75
From American Countries 43 56 51 48 48 60
From other countries 246 299 433 416 461 313
Net Trade Balance -1,520 -2,060 -2,332 -2,392 -2,771 -2,908*Revised Data.**Include imports through crossing borders, ports and deliveries from Israel.Note: PCBS advises to use the numbers cautiously as they are based on various data sources and diversity of methodology
for each data source..
The data of 2008 indicate that the value of imports increased by 5.5% compared with 2007. Israel represents 80.6% of total value of imports with an increase of 14.4% compared with 2007. Imports from Arab Countries showed a decrease of13% compared with 2007.
Palestinian Foreign Trade Indicators in Services with Israel, 2003-2008Value in Million US $
Indicator 2003 2004 2005 2006 2007 2008
Total in Export Services 73.12 92.58 127.74 131.34 121.84 126.56
Total in Import Services 61.59 94.03 119.15 123.23 104.66 95.10
Net Trade Balance in Services 11.53 - 1.45 8.59 8.11 17.18 31.46
The data of Foreign Trade on Services reveal that there was an increase in exports by 4% in 2008 compared with 2007 and a decrease in import by 9% in 2008 compared with 2007.

45
Transportation & Communication
Main Indicators of Transportation & Communicationsin Palestinian Territory*, 2004-2008
Indicator 2004 2005 2006 2007 2008
Road network Length (kilometers) (1)
4,996.0 .. 5,146.9 .. ..
Number of Licensed Road Vehicles
122,814 135,359 116,646 77,584(2) 96,736 (2)
Number of Road Accidents 4,722 5,628 3,509 3,776 3,675 (2)
Number of Injured Persons 5,107 6,667 6,026 5,137 4,403 (2)
Number of Material Received by Mail
641,769 581,013 520,972 730,343 320,123 (2)
Number of Material Dispatched by Mail
95,943 96,669 86,633 181,217 31,307 (2)
Number of Jawwal Cellular Phone Subscribers(1) 436,628 567,584 821,800 1,021,481 1,314,406
Number of Main Telephone 271,458 337,025 321,999 348,788 354,804
Monthly Average of Calls Number
33,905,287 48,159,356 45,243,238 37,169,718 97,648,283
Monthly Average ofCalls Length (minutes)
125,744,878 123,981,708 117,789,075 .. ..
Note: PCBS advises to use the numbers related to roads cautiously as they are based on various statistical sources. * Data does not include those parts of Jerusalem Governorate annexed by Israel in 1967.(1) Data include those parts of Jerusalem Governorate annexed by Israel in 1967.(2) Data does not include Gaza Strip.

46
Number of Licensed Road Vehicles in the Palestinian Territory*, 2004-2008
*Data does not include those parts of Jerusalem Governorate which were annexed by Israel in 1967. ** Data 2008 does not include Gaza Strip
Data of 2008 showed that the majority of vehicles were private cars (67.4%), while the percentage of trucks and commercial cars was 20.5% in the West Bank, Taxis represented 8.7% of the total vehicles in the West Bank, and the remaining vehicles represented 3.4%;, while the data of vehicles in Gaza Strip was not available in 2008.
Road Network Length (kilometers)in the Palestinian Territory,* 2003, 2004, 2006
* Data includes those parts of Jerusalem Governorate annexed by Israel in 1967.

47
Number of Registered Road Accidents and Casualties in Palestinian Territory* By Year, 2004-2008
*Data does not include those parts of Jerusalem Governorate which were annexed by Israel in 1967.
** Data does not include Gaza Strip.
Number of Main Telephone and Number of Cellular Phone Subscribers inPalestinian Territory, 2004-2008 (In Thousands)
The number of subscriptions to cellular phone in 2008 increased by 29% compared with pervious year.

48

49
Finance and Insurance
Indicators for Financial Intermediation in the Palestinian Territory, 2004-2008Value in US $ 1000
Indicator 2004 2005 2006 2007 2008
Number of Establishments
45 46 47 48 50
Number of Employees 4,484 4,700 5,431 5,406 6,221
Compensation of Employees
65,193.6 66,767.3 89,659.9 102,567.2 113,790.0
Output 194,293.0 299,342.5 298,638.7 386,507.3 420,882.1
Intermediate Consumption
44,095.6 42,120.6 44,053.1 58,421.0 78,710.8
Value Added 150,197.4 257,221.9 254,585.6 328,086.3 342,171.3
G. F. C. F. 7,503.4 34,480.0 34,794.3 23,536.1 24,978.4
The data show that there were 50 operating enterprises during 2008 in Financial Intermediation activities, this number was distributed as follows: financial institutions 40 enterprises, and insurance companies 10 enterprises, and the value of output was 420.9 million US$, with an increase in the year 2008 by 8.9% compared with the year 2007.

50

51
Tourism
Hotel Activities in the Palestinian Territory, 2004-2009
Indicator 2004 2005 2006 2007 2008 2009
Number of Operating Hotels 80 77 79 82 87 100
Number of Beds 7,575 7,923 8,863 8,901 8,985 11,301
Number of Rooms 3,554 3,691 4,140 4,094 4,270 5,126
Number of Guests 100,184 131,908 151,801 315,866 446,133 452,625
Number of Guest Nights 268,695 350,219 383,603 673,458 1,127,286 1,042,290
Room Occupancy (%) 13.5 15.5 15.8 25.1 35.9 32.5
The total number of hotels in the Palestinian Territory is 115 hotels, including temporary closed hotels. There were 100 operating hotels in December 2009, with average number of rooms of 5,126 and average number of beds of 11.301.
Percentage Distribution of Guest Nightsin the Palestinian Territory by Nationality, 2009

52
Main Economic Indicators for the Tourism Establishments by Tourism Activity in thePalestinian Territory, 2007
(Value in 1000 US $ )
Tourism Activity No.
of
Esta
blis
hmen
ts
No. of Persons Engaged
Com
pens
atio
n of
Em
ploy
ees
Output
Inte
rmed
iate
Co
nsum
ptio
n
Value Added
Handicrafts and Traditional Goods factories 112 414 1,368 3,490 1,585 1,905
Souvenir shops 536 1,127 1,935 13,226 3,502 9,724Hotels & Similar Establishments 82 1,263 7,988 163,297 26,424 136,873
Tourism Restaurants 290 1,956 7,376 38,127 18,923 19,204Travel & Tourism Agencies 218 1,247 8,835 46,200 13,213 32,987Renting a car 38 137 612 3,755 1,002 2,753Total 1,276 6,144 28,114 268,095 64,649 203,446
The data showed that the value of production in various activities in 2007 amounted to US$ 268.1 million, distributed among the various tourism activities. The results showed that the amount of the value added in various activities in 2007 amounted to US$ 203.4 million. The results also revealed that the number of workers in tourism establishments was 6,144 workers in 2007, of whom 1,783 workers were without compensation from employers and 4,361 were salary and wage workers; the results showed that there were 5,666 male and 478 female workers.
Average Expenditure of Hotel Guests in the West Bank by Type of Expenditure and Region, 2009(value in US$)
Type of Expenditure
Region
West Bank
North West Bank
Middle West Bank Je
rusa
lem South
West Bank
Hotel and Accommodations 589.9 205.8 487.1 871.4 337.1Food and Drinks 315.7 96.5 187.2 550.6 106.6Shopping 364.9 127.7 211.1 578.5 195.4Transportations and Telecommunications 175.6 79.4 134.4 199.6 176.7Other Expenditures 81.2 55.2 115.1 102.0 45.5Total Expenditures 1,529.7 564.5 1,134.9 2,304.5 863.2
The average expenditure during a hotel guest visit in 2009 was US$ 1,529.7 The distribution of expenditure according to the mode of consumption during the hotel guests visit showed that US$ 589.9 was spent on hotels and accommodations, US$ 364.9 spent on shopping, US$ 315.7 spent on food and drink, US$ 175.6 on transportation and telecommunications, and US$ 81.2 on other expenditures

53
Agriculture
Agricultural Indicators in the Palestinian Territory, 2004/2005-2007/2008 Area: dunum, Value: US$1000
IndicatorAgricultural Year
2004/2005 2005/2006 2006/2007 2007/2008
Area of Field Crops 506,686 496,006 482,494 495,388
Area of Vegetables* 179,139 192,961 187,344 185,770
Area of Fruit Trees 1,147,525 1,136,693 1,164,562 1,172,387
Number of Cattle 33,746 36,284 34,255 32,986
Number of Sheep 803,165 793,874 744,764 688,899
Number of Goats 371,198 387,123 343,565 322,082
Number of Broilers (Thousands birds) 40,641 31,533 26,581 27,682
Number of Layers (Thousands birds) 2,556 3,372 2,797 2,695
Number of Beehives 64,685 65,921 65,948 66,733Note: The data has not been collected according to international recommendations about the statistical unit, so users should deal carefully with these data.* Vegetables area does not include flowers.
The data revealed that fruit trees constituted 63.3% of the cultivated area of the Palestinian Territory, while vegetables and field crops comprised 10.0% and 26.7% of the cultivated Palestinian areas, respectively. Data also indicated that there was a decrease in the number of cattle, sheep and layers while increase in the number of broilers in 2007/2008, in comparison with the previous year, 2006/2007.

54
Percentage Distribution of Cultivated Area of Field Crops, Vegetables* and FruitTrees in the Palestinian Territory, 2007/2008
* Area of vegetables does not include flowers.
Area of Cultivated Land, Forest and Wooded Landin the Palestinian Territory by Region
RegionAgricultural Land
(km2) 2008Forest and Wooded
Land (km2) 2007
Palestinian Territory 1,513.0 94.3
West Bank 1,403.1 91.1
Gaza Strip 109.9 3.2
Data revealed that the area of cultivated land in 2009 totaled about 1,513.0 km2
(of which 1,403.1 km2 in the West Bank and 109.9 km2 in Gaza Strip). Data showed that the area of forests and wooded land in the Palestinian Territory totaled 94.3 km2 (91.1 km2 in the West Bank and 3.2 km2 in Gaza Strip) in 2007.

55
Number of Cattle, Sheep, Goats, Broiler and Layers, Beehives in the Palestinian Territory, 2006/2007,2007/2008
* Number of Broilers and Layers in Thousands.
Olive Presses in the Palestinian Territory, 2004-2008 Quantity: Metric ton; Value: US$1000
Indicator 2004 2005 2006 2007 2008
Number of Operating Olive Presses 242 203 246 224 264
Quantity of Olives Pressed 95,765 27,310 159,059 36,033 76,388
Quantity of Oil Extracted 22,106 6,790 34,002 8,869 17,584
Number of Persons Engaged 1,110 611 1,595 1,100 1,375
Number of Paid Employees 823 365 1,096 748 1,028
Compensation of Employees 819 283 1,099 499 899
Olive Presses Revenues 5,266 2,502 12,319 4,935 7,799
Value Added 3,481 1,613 9,554 3,204 5,217
Gross Fixed Capital Formation 2,941 1,072 4,991 3,731 7,017
56
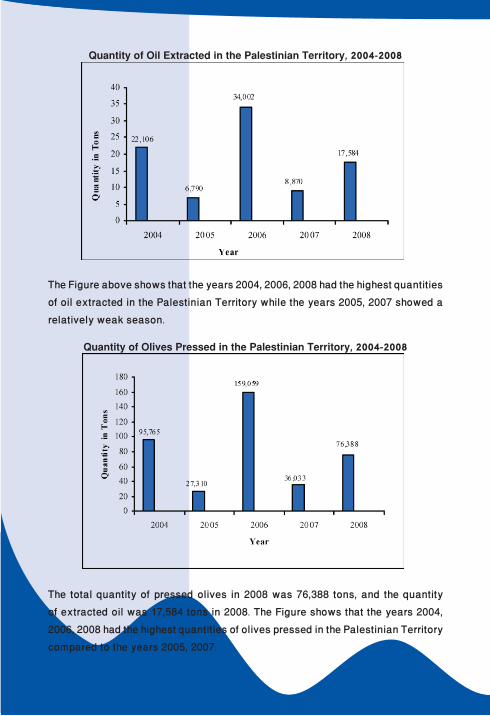
Quantity of Oil Extracted in the Palestinian Territory, 2004-2008
The Figure above shows that the years 2004, 2006, 2008 had the highest quantities of oil extracted in the Palestinian Territory while the years 2005, 2007 showed a relatively weak season.
Quantity of Olives Pressed in the Palestinian Territory, 2004-2008
The total quantity of pressed olives in 2008 was 76,388 tons, and the quantity of extracted oil was 17,584 tons in 2008. The Figure shows that the years 2004, 2006, 2008 had the highest quantities of olives pressed in the Palestinian Territory compared to the years 2005, 2007.

57
Environment
Selected Indicators for Water Statisticsin the Palestinian Territory, 2005-2008
Million m3
Indicator 2005 2006 2007 2008
Annual Available Water Quantity 315.2 319.1 335.4 308.7
Annual Pumped Quantity from Groundwater Wells 214.7 223.5 241.2 225.7
Annual Discharge of Spring Water Quantity 53.6 51.7 44.8 25.2
Annual Quantity of Water Purchased from Israeli Water Company (Mekorot)for Domestic Use
42.2 43.9 49.4 52.8
Annual Quantity of Water Supply for Domestic Sector 153.2 160.2 175.6 185.5
Percentage of Households Connected to the PublicWater Network (%)
90.5 88.6 .. 88.2
The quantity of water pumped in the Palestinian Territory in 2008 reached 225.7 million m3 for domestic and agricultural uses, while the Quantity of annual discharges of springs was 25.2 million m3. The quantity of water purchased from Israeli Water Company (Mekorot) was 52.8 million m3. The quantity of water supplied for domestic use in the Palestinian Territory was 185.5 million m3.
Percentage Distribution of Households Wastewater Disposal Method in the Palestinian Territory by Region, 2009
RegionWastewater Disposal Method
Network PorousCesspit
Tight Cesspit Other Total
Palestinian Territory 52.1 45.5 1.7 0.7 100
West Bank 35.5 61.0 2.5 1.0 100
Gaza Strip 83.8 16.0 0.0 0.2 100
The percentage of households in the Palestinian Territory in 2009 connected to the public sewage network was 52.1% distributed as 35.5% in the West Bank and 83.8% in Gaza Strip.

58
Area, Population, and Population Density in the Palestinian Territory by Region Mid Year 2009
Region Governorate
Area (km2) Population Mid
Year 2009Population Density
(Capita\ km2)
Palestinian Territory 6,020 3,935,249 654
West Bank 5,655 2,448,433 433
Gaza Strip 365 1,486,816 4,073
Data indicated that population density in the Palestinian Territory was 654 capita/ km2 at the mid of 2009, with 433 capita/ km2 in the West Bank and 4,073 capita/ km2
in Gaza Strip.
Percentage Distribution of Households in the Palestinian Territory by the Main Electricity Source in Households and Region , July 2009
Region
Main Electricity Source in Housing Unit
TotalPublic Network No Electricity
Palestinian Territory 99.9 0.1 100
West Bank 99.9 0.1 100
Gaza Strip 99.9 0.1 100
The data indicated that 99.9% of households in the Palestinian Territory were connected to the public electricity network in July 2009; this percentage was 99.8% in July 2008, compared to 97.2% in July 1999.
Imported Electricity (MWh) in the Palestinian Territory by Region and Source, 2008
Region
Source
TotalIsraeli Electricity Company
Palestinian Electricity Company
Egypt Jordan
Palestinian Territory 3,666,100 410,312 134,370 64,340 4,275,122
West Bank 2,735,650 - - 64,340 2,799,990
Gaza Strip 930,450 410,312 134,370 - 1,475,132
Total electrical energy purchased in the Palestinian Territory in 2008 reached 4,275,122 MWh; with 2,799,990 MWh in the West Bank (imported Electricity from israel and jordan) and 1,475,132 MWh in Gaza Strip.

59
Number of Settlements and Settlers in the West Bank by Governorate, 2008
Governorate Number of Settlements Number of Settlers
West Bank 144 500,670
Jenin 5 2,107
Tubas 7 1,328
Tulkarm 3 2,627
Nablus 11 11,206
Qalqiliya 7 28,827
Salfit 12 30,824
Ramallah & Al-Bireh 24 87,059
Jericho & Al-Aghwar 17 5,430
Jerusalem 26 261,885
Area J1 16 198,458
Area J2 10 63,427
Bethlehem 13 54,111
Hebron 19 15,266
According to 2008 data, the number of Settlements in the West Bank totaled 144. According to Settlement distribution, the data showed that most of these settlements were in Jerusalem Governorate (26 settlements) of which 16 settlements were annexed by Israel. Data indicated that the number of settlers in the West Bank in 2008 reached 500,670 most of whom live in Jerusalem Governorate (261,885 settlers) while 198,458 settlers live in the Jerusalem Governorate (J1).

60

61
Housing Conditions
Percentage Distribution of Households by Housing Density in the Palestinian Territory, 2004-2008
Housing Density 2004 2005 2006 2007 2008
Less than 1 10.9 11.3 7.11 12.0 12.2
1.00- 1.99 42.2 44.7 39.8 47.3 44.5
2.00- 2.99 30.6 29.6 29.8 29.4 30.6
3.00+ 16.3 14.4 18.7 11.3 12.7
Total 100 100 100 100 100
Average of Housing Density 1.8 1.8 1.8 1.7 1.7
The data in 2008 showed that the average housing density in the Palestinian Territory was 1.7 (persons per room). The data showed the percentage of highdensity households (3+) was 12.7% in 2008 compared with 16.3% in 2004.
Average Housing Density in the Palestinian Territory, 2004-2008

62
Number of Buildings and Housing Units in the Palestinian Territoryby Region, 2007
RegionBuildings Housing Units
Number Percentage Number Percentage
Palestinian Territory* 466,707 100 701,937 100
West Bank 319,270 68.4 456,314 65.1
Gaza Strip 147,437 31.6 245,623 34.9*: Excluding those parts of Jerusalem annexed by Israel in 1967.
Percentage Distribution of Households in the Palestinian Territory by Number of Rooms in the Housing Units, Selected Years
Data indicated that 15.9% of the households in the Palestinian Territory lived in housing units with 1-2 rooms in year 2008.

63
Al-Intifada
Palestinian Martyrs in Al-Aqsa Uprising (Intifada) by Place of Residence and Age Groups by Governorate, 29/9/2000-31/12/2009
Place of Residence(Governorate)
Age Groups
Total Lessthan 18
18-29 30-39 40-49 50+ Un
known
Total 1,364 3,858 940 408 467 198 7,235
West Bank 405 1,147 353 115 159 4 2,183
Jenin 68 255 59 17 39 0 438
Tubas 13 40 8 0 2 0 63
Tulkarm 45 144 33 14 15 0 251
Nablus 113 317 91 38 39 2 600
Qalqiliya 17 38 15 9 8 0 87
Salfit 6 17 8 2 5 0 38
Ramallah & Al-Bireh 49 79 32 9 13 0 182
Jericho and Alaghwar 3 9 3 0 0 0 15
Jerusalem 20 40 14 1 11 0 86
Bethlehem 22 66 41 9 12 0 150
Hebron 49 142 49 16 15 2 273
Gaza Strip 957 2,690 581 288 305 194 5,015
North Gaza 321 750 136 88 91 60 1,446
Gaza 295 971 238 108 125 83 1,820
Deir Al-Balah 97 293 60 24 28 13 515
Khan Younis 112 346 72 40 32 29 631
Rafah 132 330 75 28 29 9 603
Within Israel 2 13 2 3 1 0 21
Abroad 0 8 4 2 2 0 16 Note: The data may change due to ongoing research; it reflects documented cases only.
64
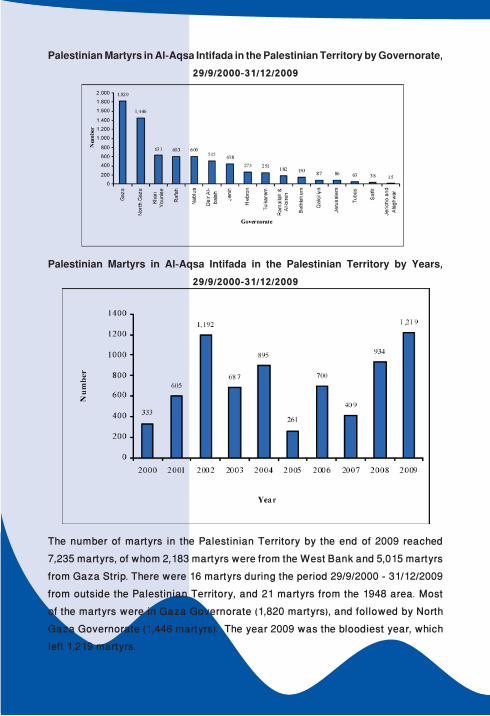
Palestinian Martyrs in Al-Aqsa Intifada in the Palestinian Territory by Governorate, 29/9/2000-31/12/2009
Palestinian Martyrs in Al-Aqsa Intifada in the Palestinian Territory by Years, 29/9/2000-31/12/2009
The number of martyrs in the Palestinian Territory by the end of 2009 reached 7,235 martyrs, of whom 2,183 martyrs were from the West Bank and 5,015 martyrs from Gaza Strip. There were 16 martyrs during the period 29/9/2000 - 31/12/2009 from outside the Palestinian Territory, and 21 martyrs from the 1948 area. Most of the martyrs were in Gaza Governorate (1,820 martyrs), and followed by North Gaza Governorate (1,446 martyrs). The year 2009 was the bloodiest year, which left 1,219 martyrs.


![NERC Regional Entity...Translate this page%PDF-1.5 %âãÏÓ 342 0 obj > endobj 351 0 obj >/Filter/FlateDecode/ID[18609F6DC19E5EDA71D6A2A70FED8135>7CE21D7059F21642BAB94512E25E7F76>]/Index[342](https://static.fdocuments.us/doc/165x107/5ab2cb597f8b9a6b468dd10a/regional-entitytranslate-this-pagepdf-15-342-0-obj-endobj-351-0-obj-filterflatedecodeid18609f6dc19e5eda71d6a2a70fed81357ce21d7059f21642bab94512e25e7f76index342.jpg)