
34995776
17
© 2008 PALGRAVE MACMILLAN. 1467-3584 Vol. 8, 4, 309–323 TOURISM AND HOSPITALITY RESEARCH 309 www.palgrave-journals.com/thr The impact of employee behaviour on customers’ service quality perceptions and overall satisfaction Received (in revised form): 16th May, 2008 Hanan Saad Kattara is a professor at the Hotel Management Department at the Faculty of Tourism and Hotels, University of Alexandria. Her prime research area is in human resource management, applied to the hospitality and tourism sector. Particular work focuses on general hotel management , marketing, and hotel operations. She also has an excellent work exper ience with extensive practice knowledge and know-how. She has a relevant number of research publications in distinguished journals and is actively involved in collaborative research networks and projects with outstanding international educa- tion and research institutions. Dina Weheba is an assistant professor at the Faculty of T ourism and Hotels, Uni versity of Alexandria, Egypt. Her cur rent research inter- ests include the area of human resources, quality management in meetings, conferences and conventions, approaches to improve quality of human resources at work, as well as taking actual steps in providing the hospitality market with quality graduates. She co-authored a number of academic papers in these areas. She communi cates with her students to achieve better teaching and apply new ideas in hospitality teaching. Osman Ahmed El-Said is an assistant lecturer at the Faculty of T ourism and Hotels, Uni versity of Alexandria, Egypt. He prepared his Master Degree in the area of employe e behavior and was interested in studying its effects on customer perception of service quality and ov erall customer satisfaction. The author also contributes in organising various conferences, organis ed by the faculty of tourism and hotels. He will be starting his doctorate research soon, covering issues that are related to quality management in this career. ABSTRACT The present study is an attempt to investigate the relationship between employees’ positive and negative behaviours, customers ’ perception of service quality and overall customer satisfaction. Results of the current study revealed that all employees’ behaviours, either negative or positive, are highly correlated to the customers’ overall satisfaction. The study traced the impact of behaviours on customers ’ perceptions and overall satisfaction through studying the relevant literature and by gauging opinions on the impact of employees ’ behaviours on customers ’ perceptions of quality and overall satisfaction. Findings in this context confirmed the correlation between these variables and their consecutive and exchanging effect. It was also concluded that employees’ behaviours have great effect on overall customer satisfaction regardless of customers’ gender, nationality, and purpose of visit, number of visits and length of stay. Finally, the study ends up by offering suggestions and practical implications for hotel practitioners to think strategically and implement effective tools to motivate employees towards behaving positively with customers. T ourism and Hospitality Research (2008) 8, 309 – 323. doi: 10.1057/thr.2008.35 ; published online 13 October 2008 KEYWORDS contact employee behaviours, custo mer perception of service quality , customer satisfaction, Egypt Hanan Saad Kattara Faculty of Tourism and Hotels Hotel Management, Alexandria University 394 El Gueish St., Zizinia, Alexandia, Egypt Tel: + 20 123 1 11 226; Fax: + 203 583 5399; E-mail: hkattara2008@hotma il.com
-
Upload
marryam-khan -
Category
Documents
-
view
217 -
download
0
Transcript of 34995776
8/3/2019 34995776
http://slidepdf.com/reader/full/34995776 1/17
© 2008 PALGRAVE MACMILLAN. 1467-3584 Vol. 8, 4, 309–323 TOURISM AND HOSPITALITY RESEARCH 309
www.palgrave-journals.com/thr
The impact of employee behaviour on
customers’ service quality perceptions
and overall satisfactionReceived (in revised form): 16th May, 2008
Hanan Saad Kattarais a professor at the Hotel Management Department at the Faculty of Tourism and Hotels, University of Alexandria.
Her prime research area is in human resource management, applied to the hospitality and tourism sector. Particular
work focuses on general hotel management, marketing, and hotel operations. She also has an excellent work exper ience
with extensive practice knowledge and know-how. She has a relevant number of research publications in distinguished
journals and is actively involved in collaborative research networks and projects with outstanding international educa-
tion and research institutions.
Dina Weheba
is an assistant professor at the Faculty of Tourism and Hotels, University of Alexandria, Egypt. Her current research inter-ests include the area of human resources, quality management in meetings, conferences and conventions, approaches to
improve quality of human resources at work, as well as taking actual steps in providing the hospitality market with
quality graduates. She co-authored a number of academic papers in these areas. She communicates with her students
to achieve better teaching and apply new ideas in hospitality teaching.
Osman Ahmed El-Saidis an assistant lecturer at the Faculty of Tourism and Hotels, University of Alexandria, Egypt. He prepared his Master
Degree in the area of employee behavior and was interested in studying its effects on customer perception of service
quality and overall customer satisfaction. The author also contributes in organising various conferences, organised by
the faculty of tourism and hotels. He will be starting his doctorate research soon, covering issues that are related to
quality management in this career.
ABSTRACT The present study is an attempt to investigate the relationship between employees’ positive and negative behaviours, customers’ perception of service quality and overall customer satisfaction. Results of the current study revealed
that all employees’ behaviours, either negative or positive, are highly correlated to the customers’ overall satisfaction.
The study traced the impact of behaviours on customers’ perceptions and overall satisfaction through studying the
relevant literature and by gauging opinions on the impact of employees’ behaviours on customers’ perceptions of quality
and overall satisfaction. Findings in this context confirmed the correlation between these variables and their consecutive
and exchanging effect. It was also concluded that employees’ behaviours have great effect on overall customer satisfaction
regardless of customers’ gender, nationality, and purpose of visit, number of visits and length of stay. Finally, the study
ends up by offering suggestions and practical implications for hotel practitioners to think strategically and implement
effective tools to motivate employees towards behaving positively with customers.
Tourism and Hospitality Research (2008) 8, 309 – 323. doi:10.1057/thr.2008.35; published online 13 October 2008
KEYWORDS contact employee behaviours, customer perception of service quality, customer satisfaction, Egypt
Hanan Saad KattaraFaculty of Tourism and HotelsHotel Management, Alexandria University394 El Gueish St., Zizinia, Alexandia, EgyptTel: + 20 123 111 226; Fax: + 203 583 5399;E-mail: [email protected]

8/3/2019 34995776
http://slidepdf.com/reader/full/34995776 2/17
Impact of employee behaviour on customers’ service quality perceptions
TOURISM AND HOSPITALITY RESEARCH Vol. 8, 4, 309–323 © 2008 PALGRAVE MACMILLAN. 1467-3584310
INTRODUCTION
In any hospitality organisation, there is a wide
variety of employees’ behaviours that can occur
within the workplace. Employees’ behaviours
are defined as various sequences of actions
carried out by employees within the organisa-
tion (Hanna et al ., 2004). Some of these behav-
iours may be positive and refer to the
constructive actions of employees on behalf of
the organisation, employees and customers
(Bowen and Shoemaker, 1998), while further
behaviours may be negative and may destroy a
productive work environment. The occurrence
of negative behaviours can generate stress,
provoke minor illnesses and even cause depres-
sion among employees (Helen, 1993). The
threat is that these negative behaviours becomeepidemic and spread to others like the flu,
which is costly to the organisation’s produc-
tivity and eventually takes its toll on employees’
health and performance. King (2004) states that
negative employees’ behaviour has ruined many
businesses and cost employers millions of dollars
every day. It also has the consequence of dr iving
away customers, damaging employees’ morality
and increasing their turnover rates.
Employees’ behaviours are important in a
service company as they connect the organisa-tion with its customers and they represent a
critical factor in developing effective working
relationships with customers (Gr önroos, 1990;
Gwinner et al ., 1998). They can also maintain
customer satisfaction by fulfilling the promises
made to the customer. In 2007, Saad and Amy
suggested that the three most important vari-
ables that explain customer satisfaction are staff
behaviour, service quality and price. Therefore,
employees’ behaviours have influence on
customer perception of service quality and on
customer satisfaction.Customer perception is defined as ‘the
degree of concordance between expectations
and experience, where comparability is appa-
rent, the customer is deemed to be satisfied’
(Parasuraman et al ., 1994). Customer satisfac-
tion is viewed as the outcome of a comparison
process between perceived product/service
performance and previously held expectations,
when performance exceeds expectations; posi-
tive disconfirmation occurs leading to satisfac-
tion, while performance below expectations
results in negative disconfirmation and dissatis-
faction (Oliver, 1997). Bei and Chiao (2001)
looked at customer satisfaction as the function
perceived service quality, product quality and
price which is measured by a customer ’s overall
judgment. Dimitris et al . (2007) defined
customer satisfaction as a measure of how a
product or service performs, compared to
customer ’s expectations.
The employees of an organisation are there-
fore vital for ensuring success in customers’
perceptions and satisfactions, as they are the
persons ultimately responsible for providing aquality service that meets the expectations of
customers (Zeithaml et al ., 1996).
The present study is an attempt to investigate
the relationship between employees’ positive
and negative behaviours, customers’ perception
of service quality and overall customer satisfac-
tion. In essence, this involves determining
whether 5-star hotel properties in Egypt
consider their employees’ behaviours and their
impact on customer perception of service
quality and overall satisfaction; developingguidelines for improving the understanding of
employees’ behaviour and its relationship with
customer perception of service quality and
overall customer satisfaction; and lastly, offering
suggestions and practical implications for hotel
practitioners to think strategically and imple-
ment effective tools to motivate employees
towards behaving positively with customers.
BACKGROUND
In reviewing the literature, there were many
studies that tried to examine the idea of employees’ behaviour and its relation to
customer satisfaction. For instance, Jones and
Dent (1994) found that a smiling face has a
beneficial effect on customer satisfaction. In
addition, a number of studies have indicated
the importance of friendly type behaviours
(friendliness, familiarity, caring, politeness,

8/3/2019 34995776
http://slidepdf.com/reader/full/34995776 3/17
Kattara, Weheba and El-Said
© 2008 PALGRAVE MACMILLAN. 1467-3584 Vol. 8, 4, 309–323 TOURISM AND HOSPITALITY RESEARCH 311
responsiveness, trustworthiness, helpfulness and
understanding) of service staff to improved
service outcomes and long-term relationships
(Sparks, 1994). As well, Duboff and Heaton
(1999) revealed that customer satisfaction is
often at least somewhat dependent on a specific
relationship with a contact employee, thus the
cost of losing such an employee includes the
weakening of satisfaction, if not loss of key
customers as well.
An important study that linked friendly
employee behaviours to customer satisfaction
was the one developed by Lemmink and
Mattsson (1998). They demonstrated that the
degree of personal warmth displayed by service
employees toward customers was related signif-
icantly and positively to service qualityperceptions and customer satisfaction. In 2003,
Hansen et al . stated that customer commitment
towards a service company significantly relies
on customer commitment to the customer-
contact employee. Thus, it was agreed upon,
that a customer ’s intention to remain with
a particular service company is heavily
determined by customer-contact employee
behaviour.
One experimental study introduced by
Brown et al . (1996) investigated the effect of respectful employees’ behaviour on service
encounter satisfaction. Their research found
that positive employee behaviour increased
customer service encounter satisfaction. Simi-
larly, Mittal and Lassar (1996) developed a
‘personalization’ dimension that sought infor-
mation about the way a company’s employees
behave in general. The scale was found to be
strongly related to overall satisfaction healthcare
service but negatively related to overall satisfac-
tion for a car repair service. Again, this ‘person-
alization’ scale focused on employee behaviour rather than the customer ’s response.
Gremler et al . (2001) conducted a study to
test the proposition that interpersonal bonds or
relationships between employees and customers
can significantly influence positive word-
of-mouth communication. In this study, they
looked at four dimensions of interpersonal
bonds: trust, care, rapport and familiarity. They
contended that as a customer ’s trust increases
in specific employee/employees, positive word-
of-mouth communication is more likely to be
increased about the organisation, and such trust
is a consequence of three other interpersonal
relationship dimensions: a personal connection
between employees and customers, care
displayed by employees, and employee famili-
arity with customers. A key finding was that
the presence of interpersonal relationships
between employees and customers is signifi-
cantly correlated with customer word-
of-mouth behaviour. Tsai and Huang (2002)
have empirically examined mediating processes
underlying the relationship between employee
effective delivery and customer behaviouralintentions. Results showed that the influence
of employee effective delivery on customers’
willingness to return and pass positive comments
to friends was indirect through the mediating
processes of customer positive moods and
perceived friendliness.
According to Armando (2005), successful
service providers are able to meet and, when-
ever possible, exceed consumers’ needs and
wants in delivering services, due to certain
specific characteristics of services (eg intangi-bility, simultaneity, variability and perishability)
and to the human element, in particular the
‘face-to-face’ interaction with the customer.
In addition, Kong and Jogaratnam (2007)
confirmed the fact that employee personalisa-
tion and courtesy were significant predictors of
customer satisfaction.
Another study that cites the importance of
employee behaviours during service encoun-
ters was conducted by Bulgarella (2005) who
reviewed the relationship between financial
success and customer and employee variables(eg customer satisfaction, employee satisfaction,
etc) and found that, depending on market
segment and industry, between 40 and 80 per
cent of customer satisfaction and customer
loyalty was accounted for by the relationship
between employee attitudes and customer-
related variables.

8/3/2019 34995776
http://slidepdf.com/reader/full/34995776 4/17
Impact of employee behaviour on customers’ service quality perceptions
TOURISM AND HOSPITALITY RESEARCH Vol. 8, 4, 309–323 © 2008 PALGRAVE MACMILLAN. 1467-3584312
service quality, customer satisfaction and loyalty
are influenced considerably by the beliefs and
actions of hotel employees, and that by providing
outstanding service, hotel employees can
enhance the image of the hotel and the level
of perceived and actual service quality. Further-
more in a similar point of view, Mattsson and
Lemmink (2002) examined the notion that, as
a customer, every one has experienced positive
and negative emotions during service delivery.
They found that low-skilled contact staff may
not be able to cope with emotional situations
when the entire image of the service firm is at
stake. Because emotions are intangible, difficult
to control and instantaneous, they have both
short-term and long-term effects on customer
perceptions.
HYPOTHESES
Based on the review of literature and objectives
of the study, five hypotheses were formulated.
Figure 1 shows the hypothesised relationship
between the study variables.
H1 : Employees’ behaviours have an impact
on overall customers’ satisfaction.
H1a : Employees’ positive behaviours have apositive impact on overall customers’
satisfaction.
H1b : Employees’ negative behaviours have a
negative impact on overall customers’
satisfaction
Recent research also studied the relationship
between employees and customers during
service encounters. Subramony et al . (2004)
found a positive relationship between employees’
internal service effectiveness and customers’
service quality perceptions, while Nicolini and
Silvia (2006) stated that customer evaluation of
the service received is shaped by factors linked
to the psychological interaction established
during the exchange transaction, and by factors
connected to technical-specific characteristics
of the service. Paull (2008) conducted a study
in the airline industry and found that employees
and customers did not share the same point of
view when it came to defining a successful
interaction, as 92 per cent of employees stated
that they were exceeding customer expecta-tions, while only 26 per cent of customers
agreed with them.
Liljander (2000: 162 – 171) highlighted the
importance of contact employees’ behaviours
during service interactions in the hotel industry
when he indicated that a major focus in any
hotel should be the personal linkage between
the service provider and the customer. He
stated that more attention should be given to
the service providers on the front-line (desk
clerks, waiters, door and bell men, maids andstewards) interacting with the customer.
In addition, Arnette et al . (2002) mentioned
that in the hotel sector, because most hotels
rely on their employees to deliver superior
service, hotel employees can be a source of
competitive advantage. They further stated that
Customers' profiles
+
+
_
_
Customers' profiles
is related to
Positive employees'
behaviors
Negative employees'
behaviors
Customer perception
of service quality
Overall
Customer
Satisfaction
Figure 1 The study hypotheses

8/3/2019 34995776
http://slidepdf.com/reader/full/34995776 5/17
Kattara, Weheba and El-Said
© 2008 PALGRAVE MACMILLAN. 1467-3584 Vol. 8, 4, 309–323 TOURISM AND HOSPITALITY RESEARCH 313
H2 : Employees’ behaviours have an impact
on customer perception of service
quality.
H2a : Employees’ positive behaviours have a
positive impact on customer percep-tion of service quality.
H2b : Employees’ negative behaviours have a
negative impact on customer percep-
tion of service quality.
H3 : Customer perceptions of service
quality are related to overall customer
satisfaction.
H4 : The impact of employees’ behaviours
on overall customer satisfaction differs
according to the customers’ profiles.
H5 : The impact of employees’ behaviours
on overall customer satisfaction differs
based on visit’s characteristics.
METHODOLOGY
Study sample
The data were collected from 5-star hotelcustomers in Egypt. From a total number of
108 five-star hotels (EHG, 2006/2007), a
random sample of 33 five-star hotels was
selected, representing 30.5 per cent of the
population. Ten questionnaires were distributed
among customers in each hotel counting
for a total number of 330 distributed
questionnaires.
Questionnaire development
Based on the work of Walz and Niehoff (2000),Parasuraman et al . (1998, 1991, 1988), Smith
(1998), Aaker (1997), Mittal and Lassar (1996)
and a comprehensive review of relevant litera-
ture, a questionnaire was developed to investi-
gate the relationship between employees’
positive and negative behaviours, customers’
perception of service quality and overall
customer satisfaction. The SERVQUAL scale of
Parasuraman et al . (1998) was considered as a
base while developing the format of the study
questionnaire. Employees’ behaviours have
been grouped into five categories, based on
the SERVQUAL: reliability, responsiveness,
assurance, empathy and tangibility.
The first section of the questionnaire was
directed to collect data related to the profile of
customers and their stay, nationality, age, gender,
social status, purpose of visit, previous lodging
experiences, length of stay and number of visits.
The second section of the questionnaire
consisted of 40 statements identifying negative
and positive employee behaviours. These state-
ments were randomly mixed and listed in
the questionnaire. In this section, the impact of the stated employee’ behaviours on customer
satisfaction was measured through the use
of a five-point scale ranging from ( − 2) to
( + 2), where ( − 2) indicated, for positive behav-
iours, a low degree of impact on customer
satisfaction, and ( + 2) indicated a high degree
of impact on customers satisfaction, and (0)
denoted a neutral condition. The scale indi-
cated the reverse for the negative behaviours.
While tabulating the results, responses were
segregated in three categories, namely: Satisfied (included + 2 and + 1), Neutral (included 0)
and Unsatisfied (included − 2 and − 1).
The third section of the questionnaire included
two questions asking customers to rank the
impact of employee behaviours, either negative
or positive, on their perception of service
quality and overall satisfaction. Responses
were collected through a five-point Likert
scale, where (1) indicated a low impact, and (5)
indicated a high impact.
Questionnaire pre-testing and pilotstudy
Face validity of the questionnaire was applied
through the use of a panel of five experts
in the field of survey designs and academics.
They were asked to review a first draft of
the questionnaire and to provide feedback
based on the clarity, wording, flow, completion

8/3/2019 34995776
http://slidepdf.com/reader/full/34995776 6/17
Impact of employee behaviour on customers’ service quality perceptions
TOURISM AND HOSPITALITY RESEARCH Vol. 8, 4, 309–323 © 2008 PALGRAVE MACMILLAN. 1467-3584314
time and the extent to which they believe
the questionnaire measured what it was
purported to measure. Their comments indi-
cated the ambiguity of some statements and
suggested the inclusion of some different
employee behaviour statements. Appropriate
modification has been carried out.
The second draft was piloted to 20 customers
in order to identify questionnaire deficiencies
and problems with layout and design, to get
suggestions, to test the time proposed for
answering the questionnaire and to investigate
the level of comprehension of the constructed
questionnaire.
After a review of the pilot test results and
consultation with relevant experts, several
changes were made. Major changes were madein the second section of the questionnaire,
where the seven-point scale used to gauge the
impact of employees’ behaviours on customer
satisfaction was changed to an easier five-point
scale. To reduce the time taken to answer the
questionnaire, behaviours were filtered from 50
to 40 behaviours.
Questionnaire distribution and
administration
The final questionnaire form was distributed
in April 2007. Hotel customers were asked to
return completed questionnaires to the front
desk. Out of the 330 distr ibuted questionnaires,
217 questionnaires were collected, from which
201 were valid, counting for 61 per cent of the
total sample which represents a satisfactory
response rate.
RESULTS PRESENTATION AND
DISCUSSION
Respondents’ profile
The demographic profile of respondents and
the characteristics of their visit are shown inTable 1. The respondents were from different
nationalities: Arab (22.4 per cent), English (20
per cent), German (16.7 per cent), Italian (12.9
per cent) and other nationalities (23.8 per cent).
They were distributed among different age
categories, of which the category ranging from
30 to 40 years old presented the highest
Table 1: Respondents’ profiles and characteristics of the visit
Profile of respondents
Nationality % Age group (years) % Gender % Social status %
German 16.7 < 20 5.0 Male 55.2 Single 29.9
Italian 12.9 20 – 30 25.9 Female 44.8 Married 59.2
British 20.0 30 – 40 27.9 Other 10.9
Arabs 22.4 40 – 50 21.9
Others 23.8 50 – 60 13.4
60 or more 6.0
Characteristics of the visit
Purpose of
visit
% Number of visits % Length of
stay
%
Business 19.9 First time 41.8 1 night 8.0
Leisure 74.6 Second time 28.9 2 – 4 nights 33.8
Other 5.5 Third time 19.9 4 – 6 nights 36.8
More 9.5 More than a
week
21.4

8/3/2019 34995776
http://slidepdf.com/reader/full/34995776 7/17
Kattara, Weheba and El-Said
© 2008 PALGRAVE MACMILLAN. 1467-3584 Vol. 8, 4, 309–323 TOURISM AND HOSPITALITY RESEARCH 315
percentage (27.9 per cent), followed by that
ranging from 20 to 30 years old (25.9 per cent),
then that from 40 to 50 years old (21.9 per
cent), and that from 50 to 60 years old (13.4
per cent), followed by that of above 60 years
old (6 per cent) and finally under 20 years old
(5 per cent). Over half (55.2 per cent) of
the respondents were males, while females
represented (44.8 per cent). The majority of
customers (59.2 per cent) were married,
followed by single customers (29.9 per cent)
and other status such as engagement and
divorcement represented 10.9 per cent.
Regarding the characteristics of the visit,
the majority of customers (74.6 per cent) indi-
cated leisure as their primary purpose, while
19.9 per cent indicated that they were travellingfor business reasons and only 5.5 per cent
mentioned other motives such as visiting
relatives/friends or shopping. A large number
of customers (41.8 per cent) were on their first
visit to the hotel, 28.9 per cent were on their
second time, 19.9 per cent were on the third
visit and only 9.5 per cent were visiting the
hotel for more than three times. The length of
stay was ranging from four to six nights for
36.8 per cent of customers, from two to four
nights for 33.8 per cent and was one night for 8.0 per cent of them.
Results and discussion
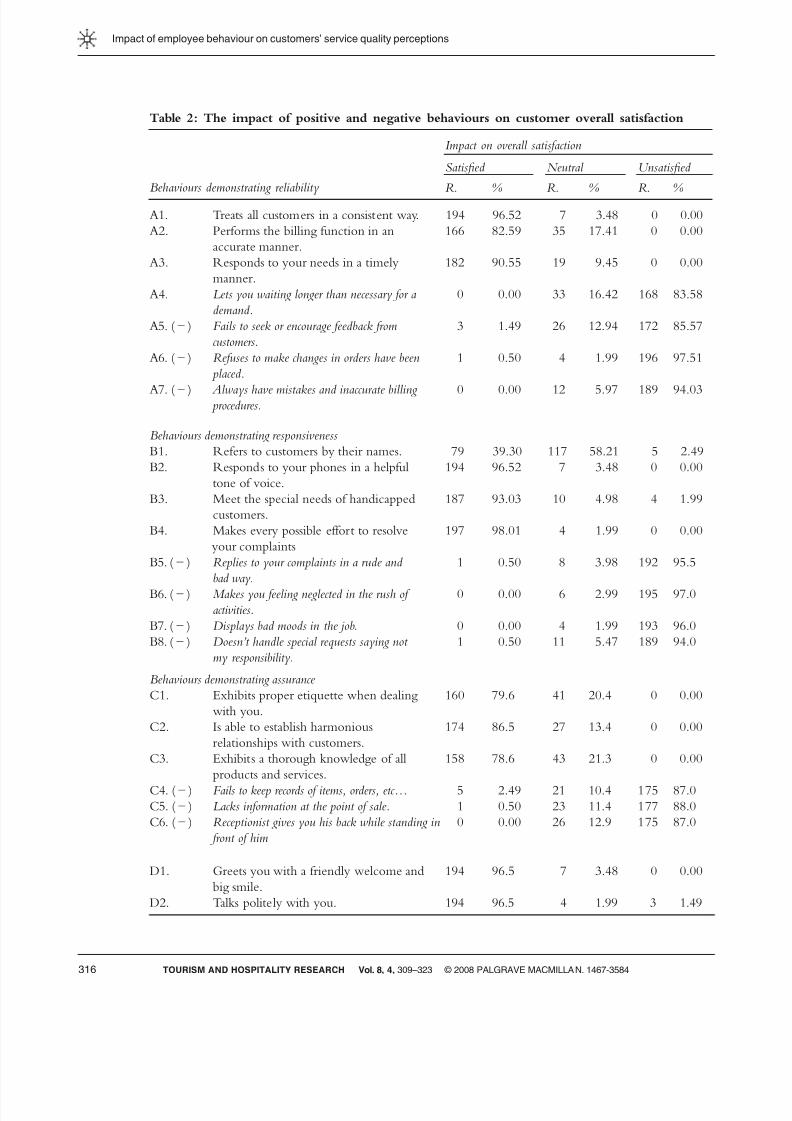
Results of the current study, illustrated in
Table 2, revealed that all negative behaviours
recorded a high negative effect on customers’
overall satisfaction. The lowest record was
calculated for behaviour (D10) in the empathy
category where 57.7 per cent of customers
indicated that the behaviour makes them
unsatisfied. Behaviour (A6) in the reliability
category, concerned with ‘employees’ refusal tomake changes to orders that have been placed ,
denoted the highest negative effect on custo-
mers’ overall satisfaction, as approximately all
customers (97.51 per cent) indicated a dissat-
isfaction effect. The high negative impact of
such behaviours can be attributed to the fact
that customers intend to stay in a hotel in
which they are spending their money, in return
they expect to obtain services equivalent to
their anticipations and dissatisfaction occurs
directly after a failure in the service delivery
process. In conclusion, as all negative behav-
iours indicated a high negative effect on
customers’ overall satisfaction, hypothesis H1a
is supported. This finding is reinforced by what
Berry (1999) indicated, namely that service
tends to fail, regardless of the quality associated,
in instances where the customer believes little
attention was given to him/her such as
rude behaviour of service staff, and this makes
the recovery from an unsatisfactory service
experience impossible.
On the other hand, results for the positive
behaviours illustrated in Table 2 also indicated ahigh positive effect on customers’ overall satis-
faction except for behaviour (B1) in the respon-
siveness category, as more than half of the
customers (58.21 per cent) indicated a neutral
effect of this behaviour. (D4) ‘Listening to
customers with empathy in responding to their
needs in a good manner ’ recorded the highest
score regarding the very positive impact on
customer satisfaction (99 per cent), followed
by (E1) ‘allowing check-in procedures to run
quickly’ (98.5 per cent) and (B4) ‘making everypossible effort to resolve customer complaints’
(98.01 per cent). Since approximately all posi-
tive behaviours indicated a high positive effect
on customers’ overall satisfaction, hypothesis
H1b is supported over in this study. Conse-
quently, it is then concluded that employees’
behaviours have an impact on overall customers’
satisfaction H1 .
This result is in agreement with the literature
and other empirical studies that have been
performed by other scholars. For example,
Gr önroos (1990) noticed that behaviours of employees within a service company connect
an organisation with its customers. Moreover,
Hansen et al . (2003) stated that when a customer
is satisfied with the contact employee within
the scope of a formal relationship, the customer
will likely maintain the relationship on the long
run. Additionally, Liao (2007) examined the
8/3/2019 34995776
http://slidepdf.com/reader/full/34995776 8/17
Impact of employee behaviour on customers’ service quality perceptions
TOURISM AND HOSPITALITY RESEARCH Vol. 8, 4, 309–323 © 2008 PALGRAVE MACMILLAN. 1467-3584316
Table 2: The impact of positive and negative behaviours on customer overall satisfaction
Impact on overall satisfaction
Satisfied Neutral Unsatisfied
Behaviours demonstrating reliability R. % R. % R. %
A1. Treats all customers in a consistent way. 194 96.52 7 3.48 0 0.00
A2. Performs the billing function in an
accurate manner.
166 82.59 35 17.41 0 0.00
A3. Responds to your needs in a timely
manner.
182 90.55 19 9.45 0 0.00
A4. Lets you waiting longer than necessary for a
demand.
0 0.00 33 16.42 168 83.58
A5. ( − ) Fails to seek or encourage feedback from
customers.
3 1.49 26 12.94 172 85.57
A6. ( − ) Refuses to make changes in orders have been
placed.
1 0.50 4 1.99 196 97.51
A7. ( − ) Always have mistakes and inaccurate billing procedures.
0 0.00 12 5.97 189 94.03
Behaviours demonstrating responsiveness
B1. Refers to customers by their names. 79 39.30 117 58.21 5 2.49
B2. Responds to your phones in a helpful
tone of voice.
194 96.52 7 3.48 0 0.00
B3. Meet the special needs of handicapped
customers.
187 93.03 10 4.98 4 1.99
B4. Makes every possible effort to resolve
your complaints
197 98.01 4 1.99 0 0.00
B5. ( − ) Replies to your complaints in a rude and
bad way.
1 0.50 8 3.98 192 95.5
B6. ( − ) Makes you feeling neglected in the rush of
activities.
0 0.00 6 2.99 195 97.0
B7. ( − ) Displays bad moods in the job. 0 0.00 4 1.99 193 96.0
B8. ( − ) Doesn’t handle special requests saying not
my responsibility.
1 0.50 11 5.47 189 94.0
Behaviours demonstrating assurance
C1. Exhibits proper etiquette when dealing
with you.
160 79.6 41 20.4 0 0.00
C2. Is able to establish harmonious
relationships with customers.
174 86.5 27 13.4 0 0.00
C3. Exhibits a thorough knowledge of all
products and services.
158 78.6 43 21.3 0 0.00
C4. ( − ) Fails to keep records of items, orders, etc … 5 2.49 21 10.4 175 87.0
C5. ( − ) Lacks information at the point of sale. 1 0.50 23 11.4 177 88.0
C6. ( − ) Receptionist gives you his back while standing in
front of him
0 0.00 26 12.9 175 87.0
D1. Greets you with a friendly welcome and
big smile.
194 96.5 7 3.48 0 0.00
D2. Talks politely with you. 194 96.5 4 1.99 3 1.49

8/3/2019 34995776
http://slidepdf.com/reader/full/34995776 9/17
Kattara, Weheba and El-Said
© 2008 PALGRAVE MACMILLAN. 1467-3584 Vol. 8, 4, 309–323 TOURISM AND HOSPITALITY RESEARCH 317
role of customer service employee behaviours
in handling customer complaints, or service
recovery performance in conveying an image
of service organisations and achieving desirable
customer outcomes. His results from a field
study and a laboratory study demonstrated that
the dimensions of service recovery perform-
ance, making an apology, problem solving,
being courteous and prompt handling, posi-
tively influenced customer satisfaction and then
Table 2: Continued
Impact on overall satisfaction
Satisfied Neutral Unsatisfied
Behaviours demonstrating empathy R. % R. % R. %
D3. Makes a good eye contact with
customers.
174 86.5 27 13.4 0 0.00
D4. Listens to you with empathy and responds
in a good manner.
199 99.0 2 1.00 0 0.00
D5. Allows you to feel special as you enter the
hotel.
192 95.5 9 4.48 0 0.00
D6. Able to deal with different nationalities
(Multi lingual).
173 86.0 28 13.9 0 0.00
D7. Avoids sitting down or reading at his
workstation.
140 69.6 60 29.8 1 0.50
D8. ( − ) Lacks basic verbal and customer relations
skills
3 1.49 20 9.95 178 88.5
D9. ( − ) Doesn’t make an eye contact when talking with
you.
2 1.00 28 13.9 171 85.0
D10. ( − ) Uses cool, brief handshakes with you. 7 3.48 78 38.8 116 57.7
D11. ( − ) Never stop talking when escorting you to your
room.
4 1.99 67 33.3 130 64.6
D12. ( − ) Allows the smile to lose in the shuffle of getting
things done.
2 1.00 37 18.4 162 80.6
D13. ( − ) Knocks your room’s door while the sign is ‘ don’t
disturb’.
6 2.99 5 2.49 190 94.5
Behaviours demonstrating tangibles
E1. Allows check-in procedures to run quickly. 198 98.5 3 1.49 0 0.00
E2. Avoids chewing gum and smoking. 125 62.1 74 36.8 2 1.00E3. Keeps hands, face, body clean and tidy. 165 82.0 34 16.9 2 1.00
E4. ( − ) Uses gestures such as pointed fingers. 2 1.00 18 8.96 181 90.0
E5. ( − ) The outside attire of the employee is dirty and
disorganised.
2 1.00 3 1.49 196 97.5
E6. ( − ) Always have problems during check-out. 0 0.00 10 4.98 191 95.0
Positive statements are in standard and negative ones are in italic and have the symbol of ( − ).
Satisfied includes the rating (+1) and (+2) of the scale, Unsatisfied includes the rating ( − 2) and ( − 1) of the scale
and Neutral includes (0).
R.=Repetitions.
8/3/2019 34995776
http://slidepdf.com/reader/full/34995776 10/17
Impact of employee behaviour on customers’ service quality perceptions
TOURISM AND HOSPITALITY RESEARCH Vol. 8, 4, 309–323 © 2008 PALGRAVE MACMILLAN. 1467-3584318
customer repurchase intent through the medi-
ation of customer-perceived justice.
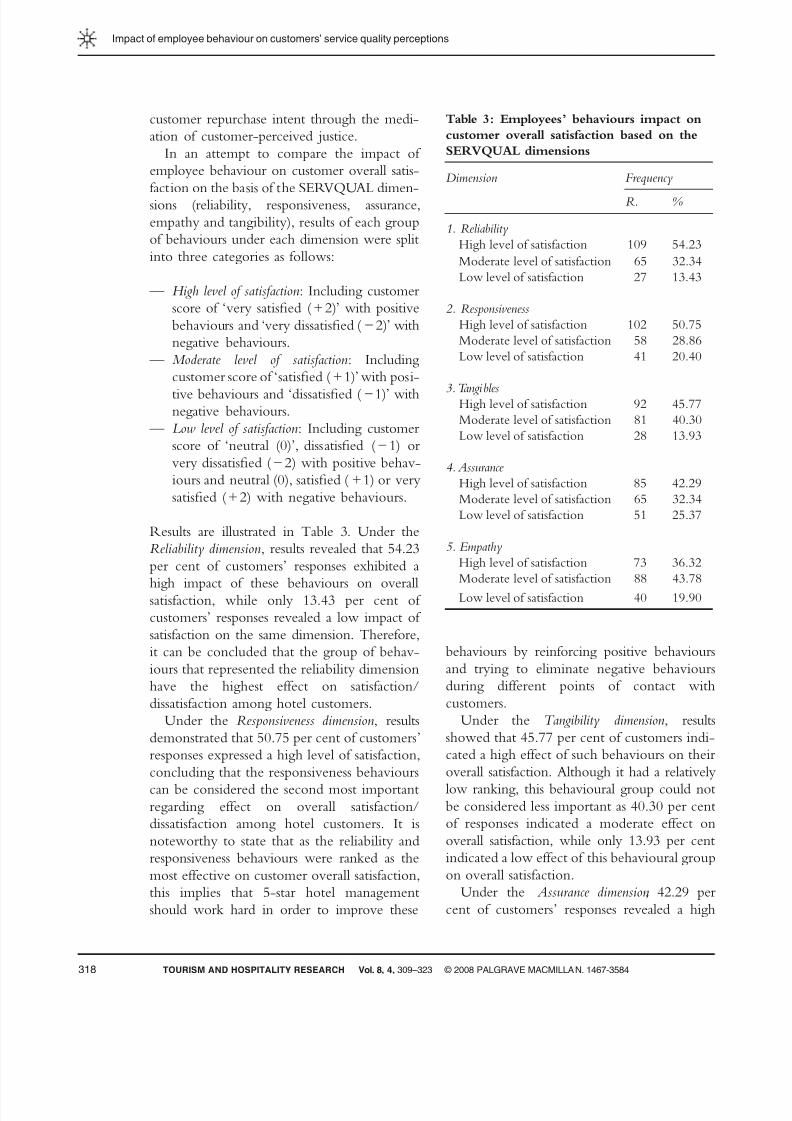
In an attempt to compare the impact of
employee behaviour on customer overall satis-
faction on the basis of the SERVQUAL dimen-
sions (reliability, responsiveness, assurance,
empathy and tangibility), results of each group
of behaviours under each dimension were split
into three categories as follows:
High level of satisfaction : Including customer
score of ‘very satisfied ( + 2)’ with positive
behaviours and ‘very dissatisfied ( − 2)’ with
negative behaviours.
Moderate level of satisfaction : Including
customer score of ‘satisfied ( + 1)’ with posi-
tive behaviours and ‘dissatisfied ( − 1)’ withnegative behaviours.
Low level of satisfaction : Including customer
score of ‘neutral (0)’, dissatisfied ( − 1) or
very dissatisfied ( − 2) with positive behav-
iours and neutral (0), satisfied ( + 1) or very
satisfied ( + 2) with negative behaviours.
Results are illustrated in Table 3. Under the
Reliability dimension , results revealed that 54.23
per cent of customers’ responses exhibited a
high impact of these behaviours on overallsatisfaction, while only 13.43 per cent of
customers’ responses revealed a low impact of
satisfaction on the same dimension. Therefore,
it can be concluded that the group of behav-
iours that represented the reliability dimension
have the highest effect on satisfaction/
dissatisfaction among hotel customers.
Under the Responsiveness dimension , results
demonstrated that 50.75 per cent of customers’
responses expressed a high level of satisfaction,
concluding that the responsiveness behaviours
can be considered the second most importantregarding effect on overall satisfaction/
dissatisfaction among hotel customers. It is
noteworthy to state that as the reliability and
responsiveness behaviours were ranked as the
most effective on customer overall satisfaction,
this implies that 5-star hotel management
should work hard in order to improve these
—
—
—
behaviours by reinforcing positive behaviours
and trying to eliminate negative behaviours
during different points of contact with
customers.
Under the Tangibility dimension , results
showed that 45.77 per cent of customers indi-
cated a high effect of such behaviours on their
overall satisfaction. Although it had a relatively
low ranking, this behavioural group could notbe considered less important as 40.30 per cent
of responses indicated a moderate effect on
overall satisfaction, while only 13.93 per cent
indicated a low effect of this behavioural group
on overall satisfaction.
Under the Assurance dimension , 42.29 per
cent of customers’ responses revealed a high
Table 3: Employees’ behaviours impact on
customer overall satisfaction based on the
SERVQUAL dimensions
Dimension Frequency
R. %
1. Reliability
High level of satisfaction 109 54.23
Moderate level of satisfaction 65 32.34
Low level of satisfaction 27 13.43
2. Responsiveness
High level of satisfaction 102 50.75
Moderate level of satisfaction 58 28.86
Low level of satisfaction 41 20.40
3. Tangibles High level of satisfaction 92 45.77
Moderate level of satisfaction 81 40.30
Low level of satisfaction 28 13.93
4. Assurance
High level of satisfaction 85 42.29
Moderate level of satisfaction 65 32.34
Low level of satisfaction 51 25.37
5. Empathy
High level of satisfaction 73 36.32
Moderate level of satisfaction 88 43.78
Low level of satisfaction 40 19.90
8/3/2019 34995776
http://slidepdf.com/reader/full/34995776 11/17
Kattara, Weheba and El-Said
© 2008 PALGRAVE MACMILLAN. 1467-3584 Vol. 8, 4, 309–323 TOURISM AND HOSPITALITY RESEARCH 319
effect on overall satisfaction, and a large
percentage (25.37 per cent) of responses indi-
cated a low impact of these behaviours on
overall satisfaction. Under the Empathy dimen-
sion , results indicated that empathy was ranked
as the least important dimension regarding its
effect on overall customer satisfaction. This was
based on only 36.32 per cent of responses
demonstrating a high effect on satisfaction and
about 43.78 per cent indicated a moderate
effect on satisfaction.
All in all, results discussed above reveal that
employees’ behaviours have an impact on
overall satisfaction, although the impact fluctu-
ates among various behavioural groups based
on SERVQUAL (reliability to responsiveness,
tangibility, assurance and empathy). Thatconfirms once again H1 .
Testing the second and the third hypotheses
of the study was more challenging. Tracing the
impact of behaviours on customer perceptions
and overall satisfaction needs a long time-span
to identify such impact. These hypotheses were
first, studied based on the review of literature,
and second by identifying customer responses
regarding their opinions on the impact of
employee behaviours on customer perceptions
of service and on overall satisfaction. The liter-ature confirmed the role of customer percep-
tions of service quality as an antecedent of
overall customer satisfaction, which has been
extensively researched and is widely accepted
in the services marketing literature (Anderson
et al ., 1994; Cronin and Taylor, 1992; Rust and
Oliver, 1994). More recently, evidence has
emerged supporting the existence of a causal
connection between service-quality percep-
tions and satisfaction judgments in the hospi-
tality industry (Collier and Coldstein, 2004)
and also Robert et al . (2006) found thatcustomer perception of quality has a significant
effect upon customer satisfaction. In 2007,
Hensley and Sulek examined the relationship
between customers’ perceptions of service
quality and overall customer satisfaction by
using three measures of customers’ perceptions
of service quality, namely: willingness to recom-
mend the service to friends, willingness to
bring friends to the service and repatronage
intentions, and results revealed a high signifi-
cant correlation between the two variables.
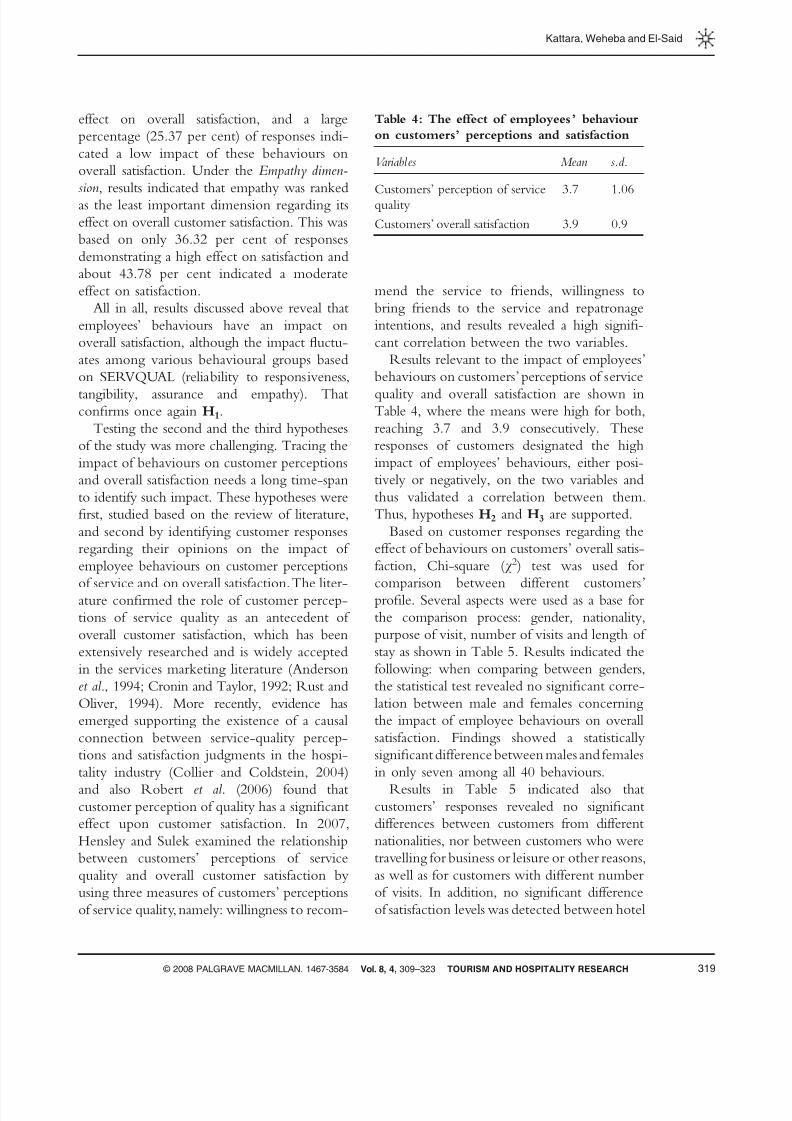
Results relevant to the impact of employees’
behaviours on customers’ perceptions of service
quality and overall satisfaction are shown inTable 4, where the means were high for both,
reaching 3.7 and 3.9 consecutively. These
responses of customers designated the high
impact of employees’ behaviours, either posi-
tively or negatively, on the two variables and
thus validated a correlation between them.
Thus, hypotheses H2 and H3 are supported.
Based on customer responses regarding the
effect of behaviours on customers’ overall satis-
faction, Chi-square ( 2 ) test was used for
comparison between different customers’profile. Several aspects were used as a base for
the comparison process: gender, nationality,
purpose of visit, number of visits and length of
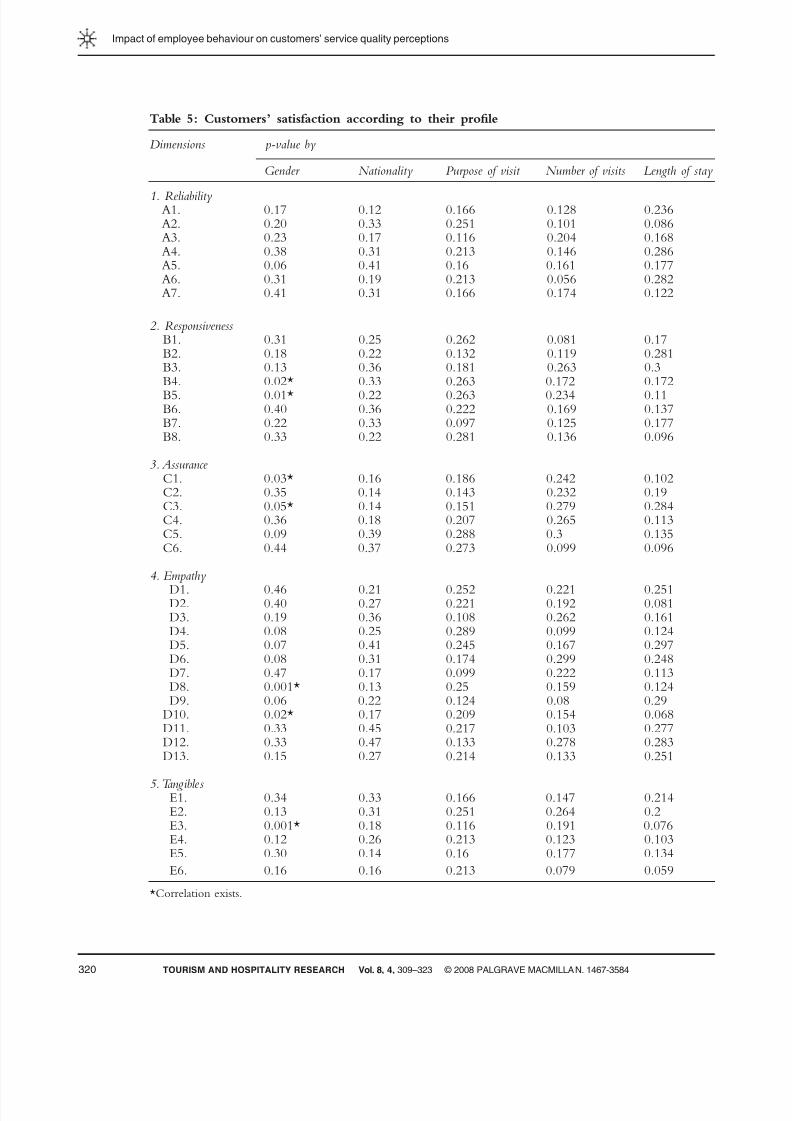
stay as shown in Table 5. Results indicated the
following: when comparing between genders,
the statistical test revealed no significant corre-
lation between male and females concerning
the impact of employee behaviours on overall
satisfaction. Findings showed a statistically
significant difference between males and females
in only seven among all 40 behaviours.
Results in Table 5 indicated also thatcustomers’ responses revealed no significant
differences between customers from different
nationalities, nor between customers who were
travelling for business or leisure or other reasons,
as well as for customers with different number
of visits. In addition, no significant difference
of satisfaction levels was detected between hotel
Table 4: The effect of employees’ behaviour
on customers’ perceptions and satisfaction
Variables Mean s.d.
Customers’ perception of service
quality
3.7 1.06
Customers’ overall satisfaction 3.9 0.9
8/3/2019 34995776
http://slidepdf.com/reader/full/34995776 12/17
Impact of employee behaviour on customers’ service quality perceptions
TOURISM AND HOSPITALITY RESEARCH Vol. 8, 4, 309–323 © 2008 PALGRAVE MACMILLAN. 1467-3584320
Table 5: Customers’ satisfaction according to their profile
Dimensions p-value by
Gender Nationality Purpose of visit Number of visits Length of stay
1. Reliability A1. 0.17 0.12 0.166 0.128 0.236A2. 0.20 0.33 0.251 0.101 0.086A3. 0.23 0.17 0.116 0.204 0.168A4. 0.38 0.31 0.213 0.146 0.286A5. 0.06 0.41 0.16 0.161 0.177A6. 0.31 0.19 0.213 0.056 0.282A7. 0.41 0.31 0.166 0.174 0.122
2. Responsiveness B1. 0.31 0.25 0.262 0.081 0.17B2. 0.18 0.22 0.132 0.119 0.281B3. 0.13 0.36 0.181 0.263 0.3B4. 0.02* 0.33 0.263 0.172 0.172
B5. 0.01* 0.22 0.263 0.234 0.11B6. 0.40 0.36 0.222 0.169 0.137B7. 0.22 0.33 0.097 0.125 0.177B8. 0.33 0.22 0.281 0.136 0.096
3. Assurance C1. 0.03* 0.16 0.186 0.242 0.102C2. 0.35 0.14 0.143 0.232 0.19C3. 0.05* 0.14 0.151 0.279 0.284C4. 0.36 0.18 0.207 0.265 0.113C5. 0.09 0.39 0.288 0.3 0.135C6. 0.44 0.37 0.273 0.099 0.096
4. Empathy
D1. 0.46 0.21 0.252 0.221 0.251D2. 0.40 0.27 0.221 0.192 0.081D3. 0.19 0.36 0.108 0.262 0.161D4. 0.08 0.25 0.289 0.099 0.124D5. 0.07 0.41 0.245 0.167 0.297D6. 0.08 0.31 0.174 0.299 0.248D7. 0.47 0.17 0.099 0.222 0.113D8. 0.001* 0.13 0.25 0.159 0.124D9. 0.06 0.22 0.124 0.08 0.29
D10. 0.02* 0.17 0.209 0.154 0.068D11. 0.33 0.45 0.217 0.103 0.277D12. 0.33 0.47 0.133 0.278 0.283D13. 0.15 0.27 0.214 0.133 0.251
5. Tangibles E1. 0.34 0.33 0.166 0.147 0.214E2. 0.13 0.31 0.251 0.264 0.2E3. 0.001* 0.18 0.116 0.191 0.076E4. 0.12 0.26 0.213 0.123 0.103E5. 0.30 0.14 0.16 0.177 0.134
E6. 0.16 0.16 0.213 0.079 0.059
*Correlation exists.
8/3/2019 34995776
http://slidepdf.com/reader/full/34995776 13/17
Kattara, Weheba and El-Said
© 2008 PALGRAVE MACMILLAN. 1467-3584 Vol. 8, 4, 309–323 TOURISM AND HOSPITALITY RESEARCH 321
quality and customer satisfaction are influenced
considerably by the values and actions of hotel
employees.
By providing exceptional service, hotel
employees can enhance the image of the hotel
and the level of perceived and actual service
quality. Hospitality managers could benefit
from these findings as well by adapting strate-
gies to engage and retain highly effective,
devoted and satisfied employees on one hand,
and to delight and satisfy their customers on
the other. The more managers allocate resources
towards employee development, in a similar
fashion as they do with customers, the higher
the probability of success the organisation will
have.
In brief, the results of the current studyconfirm the findings of Deborah and Wanda
(2008) who suggested that developing a method
to measure the agreeableness personality trait
of hospitality employees could assist hospitality
managers in selecting candidates that have a
greater likelihood of delivering quality customer
service and ensuring customer satisfaction.
Several limitations were encountered in the
current study. These included that the study
was limited to 5-star hotels in Egypt. Future
research should explore other categories of hotels as well as other types of service contexts
such as restaurants and motels. The present
study used only 40 of the most notable positive
and negative employee behaviours. Findings of
the study were, therefore, indicative rather than
conclusive. Field study was conducted at one
specific time, a longitudinal study would be
useful, and the participation of employees in
the field study would be very useful as well.
This study can be used to derive many ideas
for possible future research such as conducting
research that is exclusively dedicated to iden-tifying the factors that affects employee’ behav-
iours and attitudes toward the workplace, and
investigating the impact of management treat-
ment of employee performance in the work
place. Further research attempts should aim at
investigating the same research hypotheses but
from two points of view; customers and
customers with various length of stay. Based on
the previous results, it could be concluded that
employees’ behaviours have great effect on
overall customer satisfaction regardless of
customers’ gender, nationality and purpose of
visit, number of visits and length of stay. Thus,
hypotheses H4 and H5 are not supported.
Previous results can aid managers to deter-
mine most important positive and negative
behaviours that affect customer satisfaction
and then prioritise them according to their
importance.
CONCLUSIONS AND IMPLICATIONS
Results of the current study revealed that all
employees’ behaviours, either negative or posi-
tive, impact on customers’ overall satisfaction.This result is in agreement with the literature
and several empirical studies. Moreover, the
study traced the impact of behaviours on
customer perceptions and overall satisfaction
through gauging opinions on the impact of
employee behaviours on customer ’ perceptions
of quality and their overall satisfaction. Findings
in this context confirmed the correlation
between these variables and their consecutive
and exchanging effect.
When studying responses based on customer profiles and the characteristics of the visit, it
was concluded that employee behaviours have
great effect on overall customer satisfaction
regardless of customergender, nationality,
purpose of visit, number of visits and length of
stay.
In conclusion, it can be confirmed that
human contact is a critical determinant of
customer satisfaction, and when customers are
satisfied with the human interaction, they may
be forgiving other problems. The hospitality
industry relies heavily upon the provision of service to customers, and many of the product
offerings are highly intangible, dependent
primarily upon the creation of a positive
customer experience. In the hotel sector, as
hotel management relies on employees to
deliver superior service, thus employees can be
a foundation of competitive advantage. Service
8/3/2019 34995776
http://slidepdf.com/reader/full/34995776 14/17
Impact of employee behaviour on customers’ service quality perceptions
TOURISM AND HOSPITALITY RESEARCH Vol. 8, 4, 309–323 © 2008 PALGRAVE MACMILLAN. 1467-3584322
employees. This is very important to validate
the results of this research, and to verify whether
customers’ and staff members’ visions are the
same, or different. Moreover, further research
may develop a model for different types of
organisations examining employee – customer
relationships, introducing fruitful results to
research efforts in this area.
REFERENCES Aaker , L. (1997) ‘Dimensions of Brand Personality’,
Journal of Marketing Research , 34 , 347 – 356.
Anderson, E., Fornell, C. and Lehmann, R. (1994)
‘Customer Satisfaction, Market Share, and
Profitability: Findings from Sweden’, Journal of
Marketing , 58 , 53 – 66.
Armando, V. (2005) ‘Delivering Quality Service: All
for one?’ Journal of Quality Assurance in Hospi-
tality & Tourism , 6 , 1/2, 25 – 42.
Arnette, B., Laverie, A. and Mclane, C. (2002) ‘Using
Job Satisfaction and Pride as Internal Marketing
Tools’, Cornell Hotel and Restaurant Administra-
tion Quarterly , 34 , 2, 87 – 96.
Bei, L. and Chiao, Y. (2001) ‘An Integrated Model
for the Effects of Perceived Product, Perceived
Service Quality, and Perceived Price Fairness
on Customer Satisfaction and Loyalty’, Journal
of Customer Satisfaction/dissatisfaction and
Complaining Behavior , 14 , 1, 125 – 139.
Berry, L. (1999) ‘Relationship Marketing of Serv-ices’, Journal of Academy of Marketing Science , 23 ,
4, 236 – 245.
Bowen, J. and Shoemaker , S. (1998) ‘Loyalty:
A strategic commitment’, Cornell Hotel and
Restaurant Administration Quarterly , 35 , 3,
12 – 25.
Brown, S., Cowles, D. and Tuten, D. (1996) ‘Service
Recovery: Its value as a retail strategy’, Inter-
national Journal of Service Industry Management ,
7 , 5, 32 – 46.
Bulgarella, C. (2005) ‘Employee Satisfaction and
Customer Satisfaction: Is there a relationship?’,A White Paper from Guide Star Research.
Collier , D. and Coldstein, S. (2004) ‘The Role of
Clinical and Process Quality in Achieving
Patient Satisfaction in Hospitals’, Decision
Sciences , 35 , 3, 349 – 369.
Cronin, J. and Taylor , S. (1992) ‘Measuring Service
Quality: A re-examination and extension’,
Journal of Marketing , 56 , ( July), 55 – 68.
Deborah, B. and Wanda, C. (2008) ‘Getting Along
with Others: The relationship between agree-
ableness and customer satisfaction in the food-
service industry’, Journal of Human Resources in
Hospitality & Tourism , 7 , 1, 65 – 83.
Dimitris, Z., Nikolaos, K. and Petros, T. (2007) ‘ASimulation Model for Measuring Customer
Satisfaction through Employee Satisfaction’,
AIP Conference Proceedings , 963 , 2, 1086 –
1089.
Duboff , R. and Heaton, C. (1999) ‘Employee
Loyalty: A key link to value growth’, Journal of
strategy and leadership , 27 , 1, 8 – 12.
EHG. (2006/2007) ‘Egyptian Hotel Guide’, Egyp-
tian Hotel Association, Cairo.
Gremler , D., Gwinner , B. and Brown, S. (2001)
‘Generating Positive Word-of-mouth Commu-
nication through Customer – Employee Rela-tionships’, International Journal of Service Industry
Management , 12 , 1, 44 – 59.
Gr önroos, C. (1990) ‘Service Management and
Marketing in the Service Sector ’, in Bergman,
B. and Klefsjo, B. (eds), ‘Quality from Customer
Need to Customer Satisfaction’, McGraw-
Hill, Inc., London.
Gwinner , K., Gremler , D. and Bitner , M. (1998)
‘Relational Benefits in Services Industries: The
customer’s perspective’, Journal of the Academy
of Marketing Science , 26 , 2, 101 – 114.
Hanna, V., Backhouse, C. and Burns, N. (2004)‘Linking Employee Behavior to External
Customer Satisfaction using Quality Function
Deployment’, Journal of Engineering Manufacture ,
218 , 1167 – 1177.
Hansen, H., Sandvick, K. and Seines, F. (2003)
‘Direct and Indirect Effects of Commitment
to a Service Employee on the Intention to
Stay’, Journal of Service Research , 5 , 4,
356 – 368.
Helen, A. (1993) ‘Warning! Negative Influences at
Work’, Human Resource Focus Magazine , 70 , 9,
1 – 23.Hensley, L. and Sulek, J. (2007) ‘Customer
Satisfaction with Waits in Multi-stage
Services’, Managing Service Quality , 17 , 2,
152 – 173.
Jones, P. and Dent, M. (1994) ‘Improving Service:
Managing response time in hospitality opera-
tions’, International Journal of Operations and
Production Management , 14 , 5, 52 – 59.
8/3/2019 34995776
http://slidepdf.com/reader/full/34995776 15/17
Kattara, Weheba and El-Said
© 2008 PALGRAVE MACMILLAN. 1467-3584 Vol. 8, 4, 309–323 TOURISM AND HOSPITALITY RESEARCH 323
Parasuraman, A., Zeithaml, V. and Berry, L. (1998)
‘Understanding and Leveraging the Role of
Customer Service in External, Interactive and
Internal Marketing’, A Paper Presented at the
Frontiers in Services Conference, Nashville,
TN.Paull, A. (2008) ‘Flying High on Customer Service’,
Customer Relationship Management Magazine ,
January, 43 – 44.
Robert, G., Beatrice, V. and Xu, Y. (2006) ‘Customer
Perception, Customer Satisfaction, and
Customer Loyalty within Chinese Securities
Business: Towards a mediation model for
predicting customer behavior ’, Journal of Rela-
tionship Marketing , 5 , 4, 79 – 104.
Rust, R. and Oliver , R. (1994) ‘Service Quality:
New directions in theory and practice’,
Total Quality Management Journal , 12 , 7/8,920 – 925.
Saad, A. and Amy, C. (2007) ‘Satisfaction with Food
Services: Insights from a college cafeteria’,
Journal of Foodservice Business Research , 10 , 2,
51 – 65.
Smith, A. (1998) ‘A Model of Customer Satisfaction
with Service Encounters Involving Failure and
Recovery’, A published Doctoral Dissertation,
University of Maryland, Maryland.
Sparks, B. (1994) ‘Communicative Aspects of the
Service Encounter ’,Hospitality Research Journal ,
17 , 2, 39 – 50.
Subramony, M., Beehr , A. and Johnson, C. (2004)
‘Employee and Customer Perceptions of
Service Quality in an Indian Firm’, Applied
Psychology: An International Review , 53 , 2,
311 – 327.
Tsai, D. and Huang, C. (2002) ‘Mechanisms Linking
Employee Effective Delivery and Customer
Behavioral Intentions’, Journal of Applied
Psychology , 87 , 5, 179 – 187.
Walz, M. and Niehoff , P. (2000) ‘Organizational
Citizenship Behaviors: Their relationship to
organizational effectiveness’, Journal of Hospi-
tality & Tourism Research , 24 , 3, 301 – 319.Zeithaml, V., Berry, L. and Parasuraman, A. (1996)
‘The Behavioral Consequences of Service
Quality’, Journal of Marketing , 60 , 2, 3.
King, C. (2004) ‘Do-It-Yourself Business Plan Work-
book’, John Wiley and Sons, New York.
Kong, M. and Jogaratnam, G. (2007) ‘The Influence
of Culture on Perceptions of Service Employee
Behavior ’, Managing Service Quality , 17 , 3,
275 – 297.Lemmink, J. and Mattsson, J. (1998) ‘Warmth during
Non-productive Retail Encounters: The
hidden side of productivity’, International
Journal of Research in Marketing , 15 , 5, 505 – 517.
Liao, H. (2007) ‘Do It Right This Time: The role
of employee service recovery performance in
customer-perceived justice and customer
loyalty after service failures’, Journal of Applied
Psychology , 92 , 2, 475 – 489.
Liljander , V. (2000) ‘The Importance of Internal
Relationship Marketing for External Relation-
ship Success’, Springer Publishers, New York.Mattsson, J. and Lemmink, J. (2002) ‘Employee
Behavior, Feelings of Warmth and Customer
Perception in Service Encounters’, Interna-
tional Journal of Retail and Distribution Manage-
ment , 30 , 1, 18 – 33.
Mittal, B. and Lassar , W. (1996) ‘The Role of Person-
alization in Service Encounters’, Journal of
Retailing , 72 , 1, 95 – 109.
Nicolini, G. and Silvia, S. (2006) ‘Customer Satisfac-
tion in the Airline Industry: The case of British
Airways’, Quality and Reliability Engineering
International , 22 , 581 – 589.
Oliver , R. (1997) ‘Satisfaction: A behavioral perspec-
tive on the customer ’, McGraw-Hill, New
York.
Parasuraman, A., Zeithaml, V. and Berry, L. (1988)
‘SERVQUAL: A multiple-item scale for meas-
uring customer perceptions of service quality’,
Journal of Retailing , 64 , 1, 12 – 37.
Parasuraman, A., Zeithaml, V. and Berry, L. (1991)
‘Refinement and Reassessment of the
SERVQUAL Scale’, Journal of Retailing , 67 , 4,
420 – 451.
Parasuraman, A., Zeithaml, V. and Berry, L. (1994)
‘Reassessment of Expectations as a Compar-ison Standard in Measuring Service Quality:
Implications for further research’, Journal of
Marketing , 58 , 1, 111 – 124.

8/3/2019 34995776
http://slidepdf.com/reader/full/34995776 16/17

8/3/2019 34995776
http://slidepdf.com/reader/full/34995776 17/17


