3.2.6.2 TG18-KN Image - old.iss.itold.iss.it/binary/tesa/cont/teleradiologia_letteratura5c... · 62...
87
60 3.2.6.2 TG18-KN Image TG18-KN (Figure 36) is a lateral knee radiograph acquired with a selenium-based direct digital radiography system (DR-1000, Direct Ray Corp., the original image is the courtesy of K. Kohm, Eastman Kodak Company). The image has been processed according to the manu- facturer’s default processing for knee radiographs. The fine trabecular patterns in the femur, proximal tibia, and the cortical shell of the patella require good display resolution for proper visualization. Figure 36. The TG18-KN anatomical image.
Transcript of 3.2.6.2 TG18-KN Image - old.iss.itold.iss.it/binary/tesa/cont/teleradiologia_letteratura5c... · 62...

60
3.2.6.2 TG18-KN Image
TG18-KN (Figure 36) is a lateral knee radiograph acquired with a selenium-based directdigital radiography system (DR-1000, Direct Ray Corp., the original image is the courtesy of K. Kohm, Eastman Kodak Company). The image has been processed according to the manu-facturer’s default processing for knee radiographs. The fine trabecular patterns in the femur,proximal tibia, and the cortical shell of the patella require good display resolution for propervisualization.
Figure 36. The TG18-KN anatomical image.

61
3.2.6.3 TG18-MM1 and TG18-MM2 Images
For the purpose of TG18, two digital mammograms were selected to represent the wide vari-ation in the mammographic presentations. TG18-MM1 and TG18-MM2 (Figure 37) are 2kregions selected from two cranial caudal (CC) view digital mammograms acquired with a full-field digital mammography system (Selenia, Lorad, the original images are the courtesy of theLorad Division of Hologic, Inc.). The images were processed according to the manufacturer’sdefault processing for such exams. The following are the comments of a qualified mammogra-pher on the images:
TG18-MM1: “The breast parenchyma is heterogeneously dense. In the caudal andslightly medial breast, there is a cluster of pleomorphic calcifications extending linearlyinto the subareolar region indicative of invasive ductal carcinoma and DCIS. There arealso subtle architectural distortions. A biopsy marking clip is present in the centralbreast.”
TG18-MM2: “The mammogram is a predominantly fatty-replaced breast tissue with anapproximately 10 mm highly suspicious, irregularly-shaped mass with spiculated marginsin the medial left breast in the middle depth, indicative of invasive ductal carcinoma.”
Figure 37. The TG18-MM1 (a) and TG18-MM2 (b) anatomical images.
(a) (b)

62
3.3 Software
Though not essential, software tools can facilitate the performance assessment of displaydevices. They include software for semiautomated generation of test patterns, processing soft-ware for assessment of resolution and noise, and spreadsheets for recording and manipulating theevaluation results.
3.3.1 Pattern-Generator Software
Using the pattern descriptions given in appendix III, graphics software can be used to gen-erate the desired test patterns. An advantage of this approach is that a large number of variablepatterns can be easily generated. However, it is recommended that the patterns be viewed withthe clinical software that is used to display actual medical images. The assistance of the PACSvendor (or hospital information systems personnel) will be needed to permanently transfer theseimages into the PACS database, where they may be viewed by the clinical application.Otherwise, care must be exercised to assure that both the graphics software and the clinical soft-ware access the DDL buffer in the same way. In some instances, the medical display applicationmight apply luminance transformations that are different than those used for the graphic displayapplication. An advantage of the test patterns in DICOM format is that they can be viewed bymedical display software directly.
A number of public domain programs are available for display performance assessment,some of which are able to dynamically generate and display the TG18 test pattern on a displaydevice. DisplayTools6 is a program for Windows™ that provides separate graphic routines to pres-ent test patterns for evaluating luminance response, resolution, noise, veiling glare, and the con-trast transfer characteristics associated with various target objects. SofTrack7 is a UNIX-basedpublic domain program that can be used to quantify and track the performance of a soft-copydisplay system over time. There are also a number of public domain software packages for gen-eral display of test patterns (e.g., ImageJ,8 Osiris,9 and eFilm10).
3.3.2 Processing Software
Software tools are needed to process images captured by the digital camera for the MTF andnoise power spectrum (NPS) measurements. Programs can be developed based on the process-ing descriptions given in the assessment sections of this report. Otherwise, some commercialprograms for image quality assessment can be adapted for these tasks (e.g., RIT11).
3.3.3 Spreadsheets
Spreadsheets can be used for recording the results of the evaluation of a display device. Inaddition to recording, formatting, and reporting, the spreadsheets can contain macros for com-putation of luminance response, luminance uniformity, color uniformity, and spatial accuracy.
6Henry Ford Health System, Detroit, MI.7National Information Display Laboratory, Sarnoff Corp, Princeton, NJ.8http://rsbweb.nih.gov/ij/.9www.expasy.ch/UIN/.10www.efilm.ca.11RIT, Radiological Imaging Technology, Colorado Springs, CO, www.radimage.com.

63
3.4 Initial Steps for Display Assessment
3.4.1 Availability of Tools
Before starting the tests, the availability of the applicable tools and test patterns should beverified. Lists of desired tools for acceptance testing and quality control purposes are providedin sections 5 and 6. The TG18 test patterns should be stored on the display workstation duringinstallation or otherwise be accessible from a network archive. This approach ensures that thesame pattern will be utilized for all future testing. Network access to test patterns is especiallyuseful in this regard. For any medical display system, it would be the responsibility of the man-ufacturer to make the TG18 test patterns available on the system. If unable to locate these pat-terns, the user should consult with the manufacturer’s representative, as they are sometimesstored in service directories. If the patterns cannot be loaded and displayed, the user may utilizeother quality control test patterns that might be available on the system. Alternatively, digital testpatterns supplied via a laptop computer or a video test pattern generator may be utilized, withan understanding that the tests will not be evaluating the full display system, rather only its dis-play device compartment. In the case of a “closed” or legacy system, depending on the kind ofpatterns available on the system, some of the tests recommended in this report might not be pos-sible or might need major modifications. Therefore, it would be essential that the vendors of suchclosed display systems permanently install the TG18 test patterns on their systems. Appendix Iprovides some guidelines for evaluation of a closed display system.
3.4.2 Display Placement
Prior to testing, the proper placement of a display device should be verified and adjustmentsmade as appropriate. In the placement of a display device, the following should be considered:
1. Display devices should always be positioned to minimize specular reflection from directlight sources such as ceiling lights, film illuminators, or surgical lamps. The reflection ofsuch light sources should not be observed on the faceplate of the display in the com-monly used viewing orientations.
2. Many display devices, such as CRTs, are affected by magnetic fields; they should not beplaced in an area with strong magnetic fields (i.e., in vicinity of MRI scanners), unlessproperly shielded.
3. Displays should be placed ergonomically to avoid neck and back strain at reading level,with the center of the display slightly below eye level.
3.4.3 Start-up Procedures
Before testing a display device, the device should be warmed up for approximately 30 min-utes prior to evaluation so that the electronics can stabilize. In addition, the general system func-tionality should be verified by a quick review of the TG18-QC test pattern. The pattern shouldbe evaluated for distinct visibility of the 16 luminance steps, the continuity of the continuousluminance bars at the right and left of the pattern, the absence of gross artifacts (such as tearingor smearing of edges, excessive blur, or flickering), and the proper size and positioning of theactive display area. The pattern should be of proper size and centered in the active area of thedevice, and all borders of the pattern should be visible. Any adjustments to vertical and hori-zontal size must be made prior to performing the luminance measurements.

64
Dust and smudges on the face of the display will absorb, reflect, or refract emitted light,possibly resulting in erroneous test results. In addition, newly installed displays are sometimescovered with a protective plastic layer, which upon removal can leave residual marks on thefaceplate. Before testing a display device, the cleanliness of the faceplate should be verified. Ifthe faceplate is not clean, it should be cleaned following the manufacturer’s recommendations.In the absence of such recommendations, specialized display cleaning products and lint-freecloth can be used for this purpose. To avoid introducing cleaning solution into the displaycase, the cleaning solution should be sprayed on the towel instead of directly onto the face ofthe display device.
3.4.4 Ambient Lighting Level
The artifacts and loss of image quality associated with reflections from the display surfacedepend on the level of ambient lighting. As shown in Table 3, illumination of display device sur-faces in various locations of a medical facility varies by over two orders of magnitude.
Section 4.2 delineates a method to determine the maximum ambient light level (illumina-tion) appropriate for any given display device based on its reflection characteristics and the min-imum luminance. It is important to verify that the ambient lighting in the room is below thismaximum. The condition for the tests should be similar to those under normal use of the equip-ment. By recording ambient light levels at a reference point at the center of the faceplate and not-ing the location and orientation of the display devices at acceptance testing, it will be possible tooptimize repeatability of testing conditions in the future.
Some display devices are equipped with an optional photocell for ambient light detection,which allows the luminance response to be appropriately modified in response to changes inambient lighting. This feature should be utilized with extreme caution, as dynamic adjustingof the display’s luminance response could cause noncompliance with DICOM 3.14. Newerdevices allow for dynamic adjustment of the luminance response while maintaining compli-ance with DICOM. If the user chooses to use this feature, the manufacturer’s guidelinesshould be strictly followed and additional tests performed to validate the operation and accu-racy of the option. If an ambient light-measuring sensor is available, it is recommended that itbe used to warn the user when variation in ambient lighting from a predefined value makes thediagnosis unreliable.
Table 3. Typical ambient lighting levels.
Area Illumination (lux)
Operating rooms 300–400
Emergency medicine 150–300
Hospital clinical viewing stations 200–250
Staff offices 50–180
Diagnostic reading stations (CT/MR/NM) 15–60
Diagnostic reading stations (x-rays) 2–10

65
3.4.5 Minimum and Maximum Luminance Settings
Before the performance of a display system can be assessed, proper display area size shouldbe established, and the maximum luminance, Lmax , and the minimum luminance, Lmin , must bechecked to verify that the device is properly configured. The desired values should be deter-mined based on the desired luminance and contrast ratios, the reflection characteristics of thesystem, and the ambient lighting level (see sections 4.2.4.3 and 4.3.4.2.1). Using a luminancemeter, the luminance values should be recorded using the TG18-LN8-01 (or TG18-LN12-01)test pattern for Lmin and TG18-LN8-18 (or TG18-LN12-18) for Lmax , respectively (see sections3.2.2.2 and 4.3.4). For these measurements, ambient illumination should be reduced to negligi-ble levels using a dark cloth shroud if necessary.
If the measured values for Lmax and Lmin are not appropriate, the display device should beconfigured to establish proper values (see section 4.3.4.2) using the brightness and contrast con-trols. Typically the controls are either located on or under the back panel or are accessed usinga digital interface. The following procedure should be followed. First, display the TG18-QC pat-tern. Starting with both contrast and brightness controls turned down to their minimum,increase the brightness to establish the desired minimum luminance. Then increase the contrastcontrol until the maximum luminance is achieved without causing blooming, as judged by theappearance of Cx targets of the pattern or other artifacts. As the brightness and contrast settingstypically do not control the minimum and maximum luminance independently, multiple iterativeadjustments may be necessary to achieve the desired Lmin and Lmax values. Once those values arereached, the brightness and contrast controls as well as any luminance response settings shouldbe fixed, and those calibration controls should be made inaccessible to the general user. If themeasured values for Lmax and/or Lmin cannot be established within recommended limits, the dis-play device should be serviced before testing its performance.
3.4.6 DICOM Grayscale Calibration
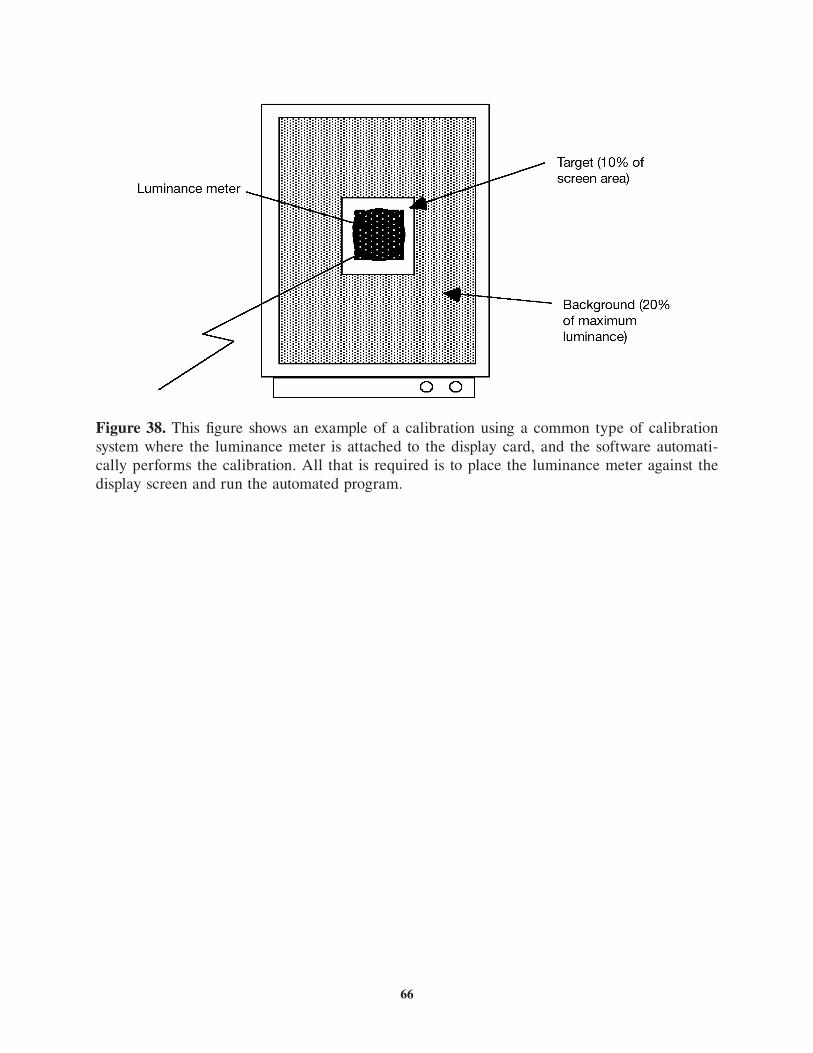
This report recommends compliance of medical display systems with the DICOM GrayscaleStandard Display Function (NEMA PS 3.14, see section 4.3 for details). Some medical imagingsystems allow calibration of the luminance response of the display unit. Such systems typicallyallow a luminance probe to be attached to the host computer and can automatically record themeasured luminance when test patterns similar to TG18-LN are displayed by the available soft-ware. The recorded data is then used to compute a lookup table for the display controller thatwill provide the desired (calibrated) luminance response.
For such systems, the response should be calibrated at installation and at intervals recom-mended by the manufacturer and this report (see section 6.2). Before testing a display device asdescribed in the following sections, the date of the last calibration should be checked, and if itis not current, a new calibration should be performed or requested. If a new calibration isrequired, Lmax and Lmin should always be verified first as described above. An example calibrationsetup is shown in Figure 38.
66
Figure 38. This figure shows an example of a calibration using a common type of calibrationsystem where the luminance meter is attached to the display card, and the software automati-cally performs the calibration. All that is required is to place the luminance meter against thedisplay screen and run the automated program.

67
4 ASSESSMENT OF DISPLAY PERFORMANCE
This section describes the assessment methods for the major performance characteristics ofan electronic display device. It is generally ideal to perform the tests in the order in which theyare discussed, as some of the later tests may be influenced by parameters that are addressed inthe earlier tests. The methods are organized, depending on their complexity, as visual, quantita-tive, and advanced methods. Based on the extent of the display evaluation, the purpose of theevaluation, and the availability of assessment tools, a combination of the recommended methodsshould be considered. For acceptance testing and quality control evaluation, a combination ofvisual and quantitative tests can be used, as outlined in sections 5 and 6. The advanced testsdescribed here are generally not for implementation in clinical settings, rather they are meant toprovide general guidelines for individuals who wish to more comprehensively evaluate the per-formance of a display system. The recommendations for the expected response are based on ourcurrent state of knowledge. Clinical experience is expected to refine these recommendations inthe future.
4.1 Geometric Distortions
4.1.1 Description of Geometric Distortions
Geometric distortions originate from aberrations that cause the displayed image to be geo-metrically dissimilar to the original image (Dwyer and Stewart 1993). The practical conse-quences of such distortions affect the relative sizes and shapes of image features, particularly forlarger displays or large deflection angles. Three kinds of distortions are commonly seen in CRTdisplays: departures from linearity in the form of pincushion (concave distortion), barrel (convexdistortion), and skew distortions; angulation and improper aspect ratio; and nonlinearity. Thefirst two types of distortions can be observed at the horizontal and vertical edges of the activedisplay area and are compensated by magnetic or electronic adjustments. The nonlinearity dis-tortions are distortions within the active display area, which cause local variation of imagegeometry and are directly related to the quality of the deflection coils and their driving elec-tronics. Commercial CRT displays intended for office use do not utilize the highest quality coils,while higher-quality medical displays for primary interpretation have more precise windings andbuilt-in correction circuits to control deflection to a higher degree of accuracy.
Some geometric distortions can be traced to improper setup of the display controller and/ora mismatch between the aspect ratio of the display device and the controller. Display controllershave settings for pixel formats that can be either factory installed or user defined under softwarecontrol. However, display devices often can only accommodate certain aspect ratios. For exam-ple, five-megapixel display devices often have a 5:4 aspect ratio while four-megapixel ones havea 4:3 ratio. An improper aspect ratio setting at the controller causes distortions, as squaresbecome rectangles or vice versa. In a digitally controlled display, a return to factory settings willusually correct the basic error. Image scaling is often an option if the user wishes to re-map thevideo image format to cover all or as large of an area of the screen as possible. Proper aspectratio is nearly guaranteed when one-to-one pixel mapping is chosen. Image scaling in fixed pixeldisplays (e.g., LCDs) can result in improper aspect ratio.
Magnetic fields may also cause geometric distortions in CRT devices. These are oftenencountered in display devices that are used in the vicinity of unshielded magnetic fields (e.g.,MRI scanners). In addition to geometric distortions, magnetic fields can degrade the resolution

68
of monochrome CRTs, and color purity in color CRTs. Electrical distribution conduits runningin close proximity to the workstation or steel columns used in the building structure can producelarge magnetic fields. A simple test to identify magnetic distortions is to rotate the display by 90°(e.g., from facing east to facing south) and see if the distortions change.
4.1.2 Quantification of Geometric Distortions
Geometric distortion can be quantified in terms of the amount of spatial angulation or two-dimensional displacement in a geometric test pattern, and be expressed in terms of pixels, spa-tial dimensions (i.e., millimeters), or percent differences in various directions or areas. Some ofthe quantification methods are detailed in the following section.
4.1.3 Visual Evaluation of Geometric Distortions
4.1.3.1 Assessment Method
The geometric distortion of a display system can be visually ascertained using either theTG18-QC or the TG18-LPV/LPH test pattern. The patterns should be maximized to fill theentire usable display area. For displays with rectangular display areas, the patterns should coverat least the narrower dimension of the display area and be placed at the center of the area usedfor image viewing. The pattern(s) should be examined from a viewing distance of 30 cm. Thelinearity of the pattern should be checked visually across the display area and at the edges. Somebezels, in conjunction with the curvature of the CRT faceplate, can create an illusion of nonlin-earity and should not be used as a visual reference for a straight edge.
4.1.3.2 Expected Response
The patterns should appear straight without significant geometric distortions and should beproperly scaled to the aspect ratio of the video source pixel format so that the grid structure ofthe TG18-QC test pattern appears square. The lines should appear straight, indicative of properlinearity, without any curvature or waviness. Some small barrel and pincushion distortions arenormal for CRT devices but should not be excessive. For the TG18-LPV and TG18-LPH pat-terns, in addition to straightness, the lines should appear equally spaced.
4.1.4 Quantitative Evaluation of Geometric Distortions
4.1.4.1 Assessment Method
Spatial accuracy for geometric distortions can be quantified using the TG18-QC test pattern.The pattern should be maximized to fill the entire display area. For displays with rectangulardisplay areas, the pattern should cover at least the narrower dimension of the display area and beplaced at the center of the area used for image viewing. Using a straight edge as a guide for abest fit and with the aid of a flexible plastic ruler, distances should be measured in square areasin the horizontal and vertical directions in each of the four quadrants of the pattern and withinthe whole pattern (Figure 39). It is important to assure the locations of the crosshatches beviewed perpendicular to the display’s faceplate. In each quadrant, between quadrants, andwithin the whole pattern, the maximum percent deviations between the measurements in eachdirection, and between the measurements in the horizontal and vertical directions should be

69
determined. The percentages should be calculated in relation to the smallest of the values beingcompared. For facilities that use a large number of displays of the same model, a transparenttemplate is useful and can be marked to delineate the maximum acceptable distortion.
4.1.4.2 Expected Response
For primary class devices, the maximum spatial deviations between orthogonal measure-ments should not exceed 2% within either direction and between directions, within each quad-rant and within the whole pattern. The percent deviation across quadrants should also not exceed2%. The corresponding criterion for secondary class devices is 5%. In evaluating the perform-ance of a CRT display, it should be considered that the control of horizontal deflection via phaseand linearity adjustments is different in the left and right sides of the display. Therefore, it ispossible for the distortion to be different on the two sides of the display.
If a display device does not meet the above criteria, adjustments should be made to the dis-tortion control of the device. Often, as the area of the display is increased or decreased, theluminance will also increase or decrease in a nonlinear fashion. Therefore, it is important tomake and finalize such adjustment prior to testing and adjustments of the display luminancecharacteristics. In addition, if a display workstation contains more than one display device, it isimportant to have the vertical and horizontal sizes of the active areas carefully matched within2%. This facilitates the subsequent matching of their luminance response characteristics.
Figure 39. The spatial measurements for the quantitative evaluation of geometric distortionsusing the TG18-QC test pattern. The small squares with dashed lines (- - -) define the four quad-rants of the pattern, and the large square at the center encompassing the luminance patches isthe one to be used for geometric distortion characterization within the whole image.
(a) (b)

70
4.1.5 Advanced Evaluation of Geometric Distortions
4.1.5.1 Assessment Method
Advanced measurements of a display’s response can be obtained with a precision digitalcamera using the methods for curvature and linearity distortion characterizations described in arecent VESA standard report (VESA 2001). These measurements are simple in principle butrequire a complex laboratory setting.
Vertical and horizontal lines are displayed along the edges of the addressable screen andalong both the vertical and horizontal centerlines (major and minor axes). A digital camera isused to measure the position of the centroid of each line luminance profile at 20 equally spacedpoints along each displayed line. A precise x-y positioner is needed to accurately center the cam-era on the display. Linear regression is applied to numerically fit a straight line through themeasured coordinates of each displayed line. If large-area pincushion distortions are being quan-tified, a second-order polynomial curve is also fitted to each line. The curvature of each line iscomputed as the peak-to-peak deviation of the measured coordinates from the correspondingpoints along the fitted line. For vertical lines, the curvature error is expressed as a percentage ofthe total width of the screen. Similarly, for horizontal lines, the curvature error is expressed as apercentage of the total height of the screen.
For nonlinearity distortions, the line-pair patterns of single-pixel horizontal lines and single-pixel vertical lines are used. Lines are equally spaced, and the spacing must be constant andequal to 5% of screen width or height, to the nearest addressable pixel. The digital camera isused to measure screen (x,y) coordinates of points where the vertical lines of the pattern inter-sect the horizontal centerline of the screen and where the horizontal lines intersect the verticalcenterline. The difference between the greatest and the least spacing measured between the linesis calculated as an indicator of nonlinearity. The vertical nonlinearity is quantified as a percent-age of total screen height, while that for the horizontal is quantified as a percentage of totalscreen width.
4.1.5.2 Expected Response
No standards are available at this time for advanced geometric distortion characteristics ofmedical display devices.
4.2 Display Reflection
4.2.1 Description of Display Reflection
Ideally, the luminance distribution on a display surface would only be associated with lightgenerated by the device, i.e., the image information. In practice, ambient room light reflects offthe surface of a device and adds luminance to the displayed image. The performance of a dis-play device is highly dependent on the reflection characteristics of the device. Therefore, it isimportant to evaluate this response at the outset and, based on that, to determine the maximumlevel of ambient illumination that can be used in the reading area without compromising the dis-play presentation. Control of ambient light conditions also allows more effective visual adapta-tion by the observer while interpreting medical images.

71
Broadly characterized, the reflections can have two general forms: specular and diffuse.Specular reflection is said to occur when the angle of the incident light rays equals that of theemerging rays as dictated by geometric optics. Such a reflection produces a virtual image of thesource, as would a mirror. In diffuse reflection, the light is randomly scattered out of the specu-lar direction and no virtual image of the source is produced. There are two types of diffusereflection. One occurs when the scattering angles of the emergent light are broadly distributedand poorly correlated with the angle of the incident light, such as with a Lambertian reflectorwhere the direction of the incident light has little effect on the observed reflected luminance(e.g., matte wall paint). The other type of diffuse reflection occurs when light is randomly scat-tered into a narrow distribution of angles in the vicinity of the specular direction. Some havecalled this a type of reflection haze. Haze requires evaluation of the emerging light distributionas a function of the incident light angle. Haze reflections are particularly notable in AMLCDflat-panel displays, especially those used for laptop computers. For further information andmeasurement methods for haze, consult the VESA standards (VESA 2001).
4.2.1.1 Specular Reflection Characteristics
Specular reflection produces a mirror image of the light source, although surface roughnessof the display that produces haze may blur the reflected image. Specular reflection of brightly litobjects or light sources adds structured, position-dependent patterns to the image, which caninterfere with the interpretation of features. Illuminated objects in a room will appear as areflection having a luminance proportional to the illumination of the object for purely specularreflections. Anti-glare (AG) treatments that produce random microstructure on the surfaces(e.g., a slight etching of the faceplate glass for CRTs) produce haze that can manifest itself as afuzzy ball of light surrounding the specular images of sources. For some applications the haze-blurring of the specular image assists in reducing the confusion produced from a specular reflec-tion (the mirrorlike image is no longer distinct). Anti-reflective (AR) glass coatings, darkeningof the faceplate glass, and the reduction of ambient light levels can also reduce the visibility ofthese reflections (Figure 40).
4.2.1.2 Diffuse Reflection Characteristics
Diffuse Lambertian reflection (to distinguish from diffuse haze reflection) produces a uni-form luminance on the display device with no visually detectable structured patterns. The addedluminance reduces contrast in the displayed image by altering the relative luminance changeassociated with specific features in the image. The contrast reduction is predominantly in thedark areas of an image since those areas are more prone to relative changes in luminance.Display devices that generate light within an emissive structure, such as CRTs, are designed topromote transport of light out of the structure. As a consequence, they typically have higherLambertian-like diffuse reflectance than transmissive displays, including film and LCDs. CRTdisplay devices extensively diffuse incident light in the phosphor layer and may have excessivediffuse reflection unless these are damped by light absorption in the glass faceplate or the phos-phor material (Figure 40), which, in turn, reduces the luminance of the device. The white phos-phor in a monochrome CRT device produces higher diffuse reflectance than color phosphors orblack matrix material used in color CRT devices (Figure 41).

72
Figure 40. Longitudinal cut through a high-contrast CRT with absorptive glass illustrating lightabsorption in the faceplate of a CRT.
Figure 41. Diffuse and specular reflections are illustrated for a color (left) and a monochrome(right) display device with the power off. Reduced diffuse reflections are seen in the color dis-play device due to the black matrix emissive structure. Reduced specular reflections are seen inthe monochrome display device due to an improved anti-reflective coating.

73
4.2.2 Quantification of Display Reflection
4.2.2.1 Specular Reflection Characteristics
Specular reflections can be described by a dimensionless specular reflection coefficient, Rs ,which is the ratio of the apparent luminance of a reflected light source to the actual luminanceof the source.12 Evaluation of Rs is done using an external light source shining on a displaydevice. A telescopic luminance meter is then directed at the display device. The display shouldbe in the power-save mode or turned off. Since medical images are observed with the viewermost often directly in front of the device, Rs is appropriately measured with the light source atabout 15° from the surface normal. The light source should be relatively small in diameter tominimize the illumination of the display device and consequent diffuse reflection yet largeenough to produce an image area larger than the response region of the telescopic luminancemeter. Ideally, the light source should subtend 15° from the center of the display and be placedat 15° from the normal (Kelley 2002).
4.2.2.2 Diffuse Reflection Characteristics
Diffuse reflections are described by the diffuse reflection coefficient Rd , which relates theinduced luminance to the ambient illumination of the display surface.13 The units of Rd are thusthose of luminance per illuminance (cd/m2 per lux) or sr–1. A telescopic luminance meter and anilluminance meter are used in conjunction with a display illuminator. For comparable measure-ments, the illumination conditions need to be standardized. Both the wavelength spectrum of theillumination source and the incident angular distribution need to be comparable to the clinicalsituation. Fluorescent lamps provide a spectrum similar to room lighting, and small fluorescentlamps may be placed in a box covering the display surface (Flynn and Badano 1999) (see Figure19). Note that this type of measurement may not be robust in the general case of a flat-panel dis-play with a strongly diffusing front surface.
To the extent that some diffuse luminance from ambient lighting is always present in readingareas, it is important that the luminance calibration of the display device boost the contrast indark regions to account for the effects of diffuse reflection. When properly calibrated, the con-trast of an object seen in a dark region should be the same as for an equivalent object seen in abright region when typical ambient illumination is present.
4.2.3 Visual Evaluation of Display Reflection
4.2.3.1 Assessment Method
4.2.3.1.1 Specular Reflection Characteristics. An effective and simple visual test is to observea display device, with the display in the power-save mode or turned off, from a position typicalof that for interpreting images. The ambient lighting in the room should be maintained at lev-els normally used. The display’s faceplate should be examined at a distance of about 30 to 60cm within an angular view of ±15° for the presence of specularly reflected light sources or illu-minated objects. Patterns of high contrast on the viewer’s clothing are common sources ofreflected features.
12Note that in CIE terminology, the specular reflection coefficient is referred to as the reflectance with a symbol of ρ (or ρs).13Note that in CIE terminology, the diffuse reflection coefficient is referred to as the luminance coefficient with a symbol of q.

74
4.2.3.1.2 Diffuse Reflection Characteristics. The effect of diffusely reflected light on imagecontrast may be observed by alternately viewing the low-contrast patterns in the TG18-AD testpattern in near total darkness and in normal ambient lighting, determining the threshold of visi-bility in each case. A dark cloth placed over both the display device and the viewer may be help-ful for establishing near total darkness. The pattern should be examined from a viewing distanceof 30 cm.
4.2.3.2 Expected Response
4.2.3.2.1 Specular Reflection Characteristics. In examining the display’s faceplate under nor-mal ambient light conditions, no specularly reflected patterns of high-contrast objects should beseen. If light sources such as that from a film illuminator or window are seen, the position of thedisplay device in the room is not appropriate. If high-contrast patterns such as an identificationbadge on a white shirt or a picture frame on a light wall are seen, the ambient illumination inthe room should be reduced.
4.2.3.2.2 Diffuse Reflection Characteristics. The threshold of visibility for low-contrast pat-terns in the TG18-AD test pattern should not be different when viewed in total darkness andwhen viewed in ambient lighting conditions. If the ambient lighting renders the “dark-threshold”not observable, the ambient illuminance on the display surface is causing excess contrast reduc-tion, and the room ambient lighting needs to be reduced.
4.2.4 Quantitative Evaluation of Display Reflection
4.2.4.1 Assessment Method
4.2.4.1.1 Specular Reflection Characteristics. The specular reflection coefficient for a displaydevice can be measured with a small diameter source of diffuse white light as described in sec-tion 3.1.3. The display should be in the power-save mode or turned off. The light source, sub-tending 15° from the center of the display, should be positioned d1 cm from the center of thedisplay and be pointed toward the center at an angle of 15° from the surface normal. Thereflected luminance of the light source should then be measured with a telescopic luminancemeter from a distance of d2 cm from the center of the display and similarly angled at 15° to thenormal. Finally, the directly viewed luminance of the light source should be measured with thesame luminance meter from a distance of d1 + d2 cm. The specular reflection coefficient Rs is theratio of the reflected spot luminance to the directly viewed spot luminance. All measurementsshould be made in a dark room.
It should be noted that due to curvature of the display surface, the Rs values measured for adisplay device may be different from that expected for the surface coating material, which isnormally quoted for a flat surface measurement. This can magnify the apparent size of thereflected test illuminator and reduce the observed luminance. Since the effects of the curvatureare relevant to the final image quality, it is recommended that no correction of measurementresults be made to account for surface curvature.
4.2.4.1.2 Diffuse Reflection Characteristics. The diffuse reflection coefficient may be measuredusing standardized illumination of the display with the illuminator device described in section3.1.3 (Figure 19). The display should be in the power-save mode or turned off. The lamps should

75
only indirectly illuminate the faceplate, ideally by placing them on the sides behind the faceplateplane in a semihemispherical illumination geometry (Figure 19b–c). The illuminance shouldthen be measured in the center of the display device using a probe placed on the center of thedisplay surface. The sensitive area of the meter should be held vertically to measure the illumi-nance incident on the display faceplate. The induced luminance at the center of the display sur-face should then be measured with a telescopic luminance meter. The luminance measurementshould be made through the small aperture at the back of the containment device so as to notperturb the reflective characteristics of the containment structure. The viewing aperture must belocated from 8° to 12° off to the side from the normal so as to not interfere with the measure-ment result. The diffuse reflection coefficient, Rd , is computed as the ratio of the luminance tothe illuminance in units of sr–1.
4.2.4.2 Expected Response
4.2.4.2.1 Specular Reflection Characteristics. The artifacts associated with specular reflectionsand the potential loss of contrast associated with diffuse reflections both depend on the ambientlighting. Whereas ideally one would like to have Rs = Rd = 0, the measured values can be relatedto the maximum ambient room lighting that is appropriate for viewing a display device with aspecified minimum inherent luminance. Suppose an illuminated white object with 90% diffuse(Lambertian) reflectance is found to be in a specular direction when the display surface isobserved, e.g., a white wall that is behind the observer. The luminance of that object is L0 = 0.9E/π , where E is the illumination in lux and L0 is the observed luminance in cd/m2. The specu-larly reflected luminance of this object should thus be less than the just noticeable change ofluminance in dark regions of the display,
Rs L0 ≤ Ct Lmin ;
and therefore,
E ≤ (π Ct Lmin) / (0.9 Rs ) ,
where the contrast threshold, Ct = ∆L/L (see section 4.3.1), corresponds to its value at the min-imum luminance, Lmin . Contrast threshold ranges from 0.032 and 0.021 for Lmin values between0.5 and 1.5 cd/m2 (as illustrated in Figure 43 later in this report). For convenience, this relation-ship is tabulated (Table 4) so that the maximum room lighting can be identified if Rs and Lmin areknown.
Uncoated glass faceplates have Rs values of about 0.04. Devices with uncoated glass face-plates should only be used in very dark rooms (2 to 5 lux). High-quality multilayer anti-reflec-tive (AR) coatings can achieve Rs values of about 0.005. A relatively bright display device (2 to500 cd/m2) with such coatings can be used in a room of modest lighting (25 lux). By compari-son, transilluminated film (10 to 2500 cd/m2) has a substantially higher Rs value of about 0.013in high-density regions. However, the high Lmin value permits viewing without specular reflections
(2)
(3)

76
with twice the ambient lighting (54 lux). For a typical CRT with AR coating (Rs = 0.004) oper-ated at minimum luminance values of 0.5, 1, 1.5, and 2.0 cd/m2, the ambient lighting based onspecular reflection consideration should be less than approximately 14, 21, 28, and 31 lux,respectively. Note that in the adjustment and measurement of the appropriate level of ambientlighting, illuminance in the room should be measured with the illuminance meter placed at thecenter of the display and facing outward, so the proper amount of light incident on the faceplatecan be assessed.
4.2.4.2.2 Diffuse Reflection Characteristics. The luminance from diffuse reflections adds tothat produced by the display device. The ambient illumination produces a luminance of Lamb = Rd
E, where E is ambient illuminance on the display surface, and Rd is the diffuse reflection coeffi-cient in units of cd/m2 per lux or sr–1. In the dark areas of a low-contrast image, the change inluminance, ∆Lt , will produce a relative contrast of ∆Lt /(Lmin + Lamb). For some devices, the lumi-nance response can be calibrated to account for the presence of a known amount of luminancefrom ambient lighting, Lamb , and produce equivalent contrast transfer in both dark and brightregions. However, if Lamb is sufficiently large in relation to Lmin , even if the device has a high con-trast ratio, the overall luminance ratio of the device is compromised. For primary class displaydevices, it is recommended that Lamb be maintained at less than 0.25 of Lmin , Lamb < 0.25 Lmin , orthat the illuminance E be restricted to
E ≤ (0.25 Lmin)/Rd .
This ensures that the contrast in dark regions observed with ambient illumination will be atleast 80% of the contrast observed in near total darkness. Table 5 identifies the ambient lightingfor which Lamb is 0.25 of Lmin as a function of Rd and Lmin . For a typical CRT with AR coating (Rd
= 0.02 sr–1) operated at minimum luminance values of 0.5, 1, 1.5, and 2.0 cd/m2, the ambientlighting based on diffuse reflection consideration should be less than approximately 7, 12, 19,and 25 lux, respectively. Note that in situations in which the level of ambient lighting can bestrictly controlled and taken into account in the luminance calibration of the display device, a
Table 4. Maximum allowable ambient illuminance, based on specular reflection.
Lmax – Lmin Ct
Maximum Room Illuminance (lux)(cd/m2) Rs = 0.002 Rs = 0.004 Rs = 0.008 Rs = 0.020 Rs = 0.040
5000 – 20 0.010 349 175 87 35 17
2500 – 10 0.011 192 96 48 19 10
1000 – 4 0.015 105 52 26 10 5
500 – 2 0.018 63 31 16 6 3
250 – 1 0.024 42 21 10 4 2
For a display device with a specific minimum luminance, Lmin, and a specific specular reflection coefficient, Rs, theambient illumination that maintains specular reflections from high-contrast objects below the visual contrastthreshold (Ct) is tabulated.
(4)

77
larger Lamb can be tolerated (Lamb < Lmin/1.5) as noted in section 4.3.4.2. Note that in the adjust-ment and measurement of the appropriate level of ambient lighting, illuminance in the roomshould be measured with the illuminance meter placed at the center of the display facing out-ward, so the proper amount of light incident on the faceplate can be assessed.
4.2.5 Advanced Evaluation of Display Reflection
4.2.5.1 Assessment Method
4.2.5.1.1 Specular Reflection Characteristics. The specular reflection coefficient of a displaydevice with AR coatings will often vary significantly with wavelength, and specular reflection ofwhite light will have a characteristic color determined by this filtering effect. To best describethe specular reflection characteristics of a display device, Rs should be measured as a functionof wavelength over the full visible range. Measurement of Rs at 6 wavelengths in the visible rangeis adequate to report the wavelength dependence. The same light source and telescopic lumi-nance meter as described above can be used for these measurements. The specific wavelengthband for a measurement can be established by using thin-film, optical band-pass filters. Sincethese filters are designed for filtering light that is perpendicularly incident on the filter surface,they should be placed near the luminance meter and not in front of the light source. If the pho-topic filter on the telescopic luminance meter can be removed, some increase in sensitivity canbe achieved with no impact on the value of measured Rs . Alternatively, advanced measurementscan be performed using a spectrometer.
4.2.5.1.2 Diffuse Reflection Characteristics. While the quantitative test method described insection 4.2.4.1.2 is adequate for most field measurements, intercomparison of different devicesrequires more standardized illumination. The angular distribution of the incident light can affectthe diffuse reflection coefficient, particularly for flat-panel devices. For advanced measurements,which can probably only be performed in laboratory settings, the illumination method advocatedby NIST is recommended (Kelley 2001). For devices having complex angular distributions fordiffusely reflected light, measurement of the bidirectional reflectance distribution function pro-vides a more complete description of diffuse reflection. Methods to measure this function aredescribed by VESA (VESA 2001, section A217).
Table 5. Maximum room lighting based on diffuse reflection.
Lmax – LminMaximum Room Illuminance (lux)
(cd/m2) Rd = 0.005 Rd = 0.010 Rd = 0.020 Rd = 0.040 Rd = 0.060
5000 – 20 1000 500 250 125 83
2500 – 10 500 250 125 62 42
1000 – 4 200 100 50 25 17
500 – 2 100 50 25 12 8
250 – 1 50 25 12 6 4
For a display device with a specific minimum luminance, Lmin, and a specific diffuse reflection coefficient, Rd, inunits of cd/m2 per lux or sr–1, the ambient illumination which maintains 80% contrast in dark regions is tabulated.The maximum room illuminance is calculated as 0.25 Lmin / Rd .

78
4.2.5.2 Expected Response
The criteria for the quantitative evaluations described above with respect to the relationsbetween reflection coefficients and luminance apply also to the advanced measurement methods.In the case of specular reflections, the advanced methods provide an understanding of possiblewavelength dependence, which is seen as a color shift in the reflected patterns. Good multilayerAR coatings achieve Rs values of less than 0.005 for wavelengths from 450 to 680 nm, and sub-stantially lower values from 500 to 600 nm. In the case of diffuse reflections, the advancedmethods provide a more accurate measure of Rd , which permits valid intercomparison of resultsobtained at different centers.
4.3 Luminance Response
4.3.1 Description of Luminance Response
The luminance response of a display device refers to the relationship between displayedluminance and the input values of a standardized display system (section 1.2.2). The displayedluminance consists of light produced by the display device that varies between Lmin and Lmax ,along with a fixed contribution from diffusely reflected ambient light (section 4.2), Lamb .(Specular contribution is neglected here as it varies significantly as a function of geometry.) Inthis report, Lmin , Lmax , and the intermediate luminance values, L(p), refer only to light producedby the display device as measured with negligible ambient illumination. Actual luminance val-ues associated with specific ambient lighting are denoted using a primed variable name:
L'min = Lmin + Lamb
L'max = Lmax + Lamb
L'(p) = L(p) + Lamb
The function L'(p) is the display function that relates luminance to input values over therange from L'min to L'max . The term “luminance ratio” specifically refers to the ratio of the maxi-mum luminance to the minimum luminance in the presence of an ambient luminance compo-nent, L'max/ L'min . The term contrast ratio is used to characterize a display device and refers toL'max/ L'min as measured with low ambient lighting.
In order to have similar image appearance with respect to contrast, all display devices shouldhave the same luminance ratio and the same display function. Appendix II further discusses howimage presentation may be adjusted to achieve equivalent appearance when the luminance ratiois not the same. Because the human visual system adapts to overall brightness, two displaydevices can have similar appearance with different Lmax values as long as L'max/ L'min and L'(p) arethe same. L'(p) is typically set to a display function.
DICOM working group 11 considered a variety of alternatives for a standard display func-tion. The final recommendation for the DICOM Grayscale Standard Display Function (GSDF)was based on the Barten model for the contrast threshold of the human visual system (Barten1992, 1993, 1999) when measured using specific experimental conditions. For a small test tar-get with sinusoidal luminance modulation, (∆L/2)sin(ω), placed on a uniform background, the
(5)

79
Barten model predicts the threshold contrast, ∆L/2L, that is just visible. The threshold contrastis defined as the Michelson contrast, (Lhigh – Llow)/(Lhigh – Llow) or ∆L/2L for sinusoidal modulationbetween +∆L/2 and –∆L/2. The GSDF is specifically based on a target size of 2° relative to theobserver’s eyes with a modulation of ω = 4 cycles/degree. The GSDF is defined as a table ofluminance values such that the luminance change between any two sequential values corre-sponds to the peak-to-peak relative luminance difference, ∆L/L, predicted by the Barten model.The index values to the series of luminance values are known as JND indices since a unit changeof the table index corresponds to a just noticeable difference in luminance. The DICOM standardalso provides a continuous fit for the GSDF as
,
which can be used to compute luminance values at any index level. In this equation, j is theindex (1 to 1023) of the luminance levels Lj of the JNDs, and
a = –1.3011877,b = –2.584019 × 10⁻²,c = 8.0242636 × 10⁻²,d = –1.0320229 × 10⁻¹,e = 1.3646699 × 10⁻¹,f = 2.8745620 × 10⁻²,g = –2.5468404 × 10⁻²,h = –3.1978977 × 10⁻³,k = 1.2992634 × 10⁻⁴, andm = 1.3635334 × 10⁻³.
In Europe, the CIELAB function suggested by the International Illumination Commissionhas been used in some centers. The CIELAB proposes a modified cube root between the lumi-nance L' and a perceived brightness variable, L*, as
L* = 116 (L'/L'max)1/3 – 16 for L'/L'max > 0.008856,L* = 903.3 L'/L'max otherwise.
In this scale, L* varies between 0 and 100. A perceptually linear display curve L'(p) will beobtained if the above function is inverted and L* is identified with the DDL p-values (0 ≤ p ≤pmax), where p is the presentation value. As an example, for pmax = 255,
L'(p) = [(100 p/pmax + 16)/116]3 L'max for p/pmax > 0.08,L'(p) = 1/903.3 (100 p/pmax) L'max otherwise.
By specifying a range between 0 and 100 for L*, the CIE standard forces a zero L'min valuefor p = 0. Considering the fact that L'min is always larger than zero due to a nonzero Lmin value andthe presence of ambient lighting, the ambiguous requirement of the CIE may need to be modi-fied to accommodate a non-zero minimum L'min value as suggested in a recent publication(Roehrig et al. 2003).
LogLog Log Log Log
10
2 3
La c j e j g j m
j
e e e=+ + + +( ) ( ) ( )
ee
e e e e
j
b j d j f j h j
( )( ) ( ) ( )+ + + +
4
2 3
1 Log Log Log Log(( ) ( )+4 5
k je
Log(6)
(7)
(8)

80
As shown in Figure 42, the CIELAB function has more contrast in low-luminance regionsthan the DICOM GSDF. For consistency among all centers, TG18 specifically recommends thatthe DICOM GSDF be used to define L'(p) for all display devices.
In the DICOM conceptual model of a standard display device (see section 1.2.2, Figures 1and 2), image values produced by an acquisition device are transformed to a range of presenta-tion values, p. The p-values are then scaled to match the input range of the display controller(e.g., 256, 1024, etc.) and mapped to DDLs based on a previously established LUT. While DDLvalues are typically scalar numbers, some devices may use red, green, and blue color values thatare converted in the monitor to gray. DICOM calibration of a device is done by measuring lumi-nance versus DDL and computing an LUT that makes L'(p) follow the DICOM GSDF betweenL'min and L'max . Within this range of luminance, p-values are linearly proportional to the JNDindices, with a constant number of JND indices for each p-value change. Devices that store thecalibration LUT in the display controller or its device driver are advantageous in that the desiredluminance response can be obtained by any application.
It is important to recognize certain limitations of the DICOM standard response. Whenviewing the varied brightness of a medical image, the human visual system adapts to the averagequantity of light falling on the retina. This is referred to as fixed adaptation. However, theDICOM 3.14 luminance response is based on contrast threshold data that is derived from exper-iments where the background luminance is changed to equal the luminance of the target pattern,and the observer fully adapts to the new background. The contrast threshold associated with theGSDF thus reflects variable adaptation. When the eye is adapted to the mixed bright and darkregions of a medical image, the contrast threshold as a function of luminance differs signifi-cantly from that associated with variable adaptation (Samei 2004). The difference is illustrated
Figure 42. The DICOM 3.14 GSDF tabulates the desired luminance in relation to an index thatcorresponds to a just noticeable difference (JND) in brightness. For comparison, the CIELABdisplay function is shown for the case where Lmax equals 300 cd/m2.

81
in Figure 43, where visual contrast response under fixed adaptation conditions is seen to beworse in the bright and dark regions of an image (Flynn et al. 1999). Additionally, the GSDFreflects visual performance for a specific spatial frequency under threshold detection conditions.The performance of the human visual system for features of interest in a medical image will bedifferent if the features have different size, spatial frequencies, and (noisy) background, or havesuprathreshold contrast. For these reasons, the GSDF does not represent the luminance responsethat would be optimal for observing the features of a particular image. Rather, the GSDF allowsan application to render an image with a specific grayscale transformation (modality LUT) withthe expectation that the resulting p-values will produce similar appearance on all display sys-tems that are both GSDF-calibrated and have the same luminance ratio.
It is worth noting that the characteristic curve of a display device (i.e., the DDL to lumi-nance transformation) is technology and monitor dependent. Flat-panel display systems can havea complex luminance response with discontinuous changes. CRT display devices have a contin-uous response with luminance proportional to the input drive signal raised to a fractional power,
(L – Lmin)/(Lmax – Lmin) = [(v – vmin)/(vmax – vmin)]γ ,
where L is luminance, v is the video signal voltage, and γ is the dimensionless “display gamma”(Muka et al. 1995). The subscripts “max” and “min” refer to the maximum and minimumluminance or video voltage states, respectively. This intrinsic power response is primarily due
Figure 43. Contrast threshold for varied (A) and fixed (B, Flynn et al. 1999) visual adaptation.The contrast threshold, ∆L/L, for a just noticeable difference (JND) depends on whether theobserver has fixed (B) or varied (A) adaptation to the light and dark regions of an overall scene.∆L/L is the peak-to-peak modulation of a small sinusoidal test pattern.
(9)

82
to the drive response of the electron gun in the CRT (Moss 1968). The gamma value, γ, asso-ciated with CRT devices is typically about 2.2 but can range from 1.5 to 3.0. For a particulardevice, care must be taken to ensure that appropriate calibration methods are used. Flat-panelsystems may require that calibration data be measured for all DDL states. CRT systems withextreme gamma values may be difficult to calibrate, particularly if the number of DDL statesis low (e.g., 256).
4.3.2 Quantification of Luminance Response
Visual assessment of the luminance response is done using a test pattern that has a sequenceof regions with systematically varied luminance. The perceived contrast associated with theluminance change for each adjacent region will vary due to the contrast transfer characteristicsof both the display device and the adapted human visual system. Test patterns that include low-contrast features within each region in the sequence can be used to provide a more sensitive indi-cation of contrast transfer. Luminance response is evaluated by confirming the expectedperceived contrast in regions of varying luminance.
Quantitative assessment of the luminance response is done using defined test patterns andluminance meters to measure the luminance response of the display device at a limited numberof values. The protocol for making measurements, described in the following sections, is similarto that described in the DICOM standard (NEMA 2000, annex C). The results are then evalu-ated to determine the average contrast transfer characteristics based on the luminance differencebetween two measurements.
Complete characterization of the luminance response can be accomplished by measuring thedisplay luminance for all possible values associated with the display controller. ∆L/L is thenevaluated in relation to the desired values of DICOM 3.14. For a system supporting 1024 or4096 DDLs, complete characterization requires that a large amount of data be acquired withvery small luminance differences between each sequential data point. This is generally doneautomatically using a specialized software application and a luminance meter having a computerinterface. If only a subset of the available levels (32–64 values) is acquired, local anomalies inthe luminance response may not be revealed.
The veiling-glare characteristics of a display significantly affect the assessment of minimumluminance. This complicates the evaluation of luminance response at low luminance and of thecontrast ratios. In Figure 44, the display device was first adjusted to Lmin = 1 cd/m2 using a fullblack image. The minimum luminance was then measured as a function of the percent area ofthe black region within which the luminance was measured, and as a function of the pixel valuein the remainder of the display area. All measurements were made in a darkened room using aluminance probe (Figure 16). Figure 43 illustrates the dependence of Lmin on veiling glare forboth a CRT device and an LCD device. For the methods recommended in this report, luminanceis measured using DICOM standard test patterns that have specified target size and backgroundluminance (i.e., TG18-LN test patterns, 10% central area, surround at ~0.2 Lmax). This providesreproducible measurements of minimum luminance and contrast ratio that have similar condi-tions for veiling glare.
4.3.3 Visual Evaluation of Luminance Response
Visual evaluation methods can be used if a luminance meter is not available. However, it ishighly recommended that the luminance response be verified using the quantitative evaluationmethod described in section 4.3.4.

83
4.3.3.1 Assessment Method
The luminance response of a display device is visually inspected using the TG18-CT testpattern (see section 3.2.2.1). The TG18-CT pattern should be evaluated for visibility of the cen-tral half-moon targets and the four low-contrast objects at the corners of each of the 16 differ-ent luminance regions. In addition, the bit-depth resolution of the display should be evaluatedusing the TG18-MP test pattern. The evaluation includes ascertaining the horizontal contouringbands, their relative locations, and grayscale reversals. Both patterns should be examined from aviewing distance of 30 cm.
4.3.3.2 Expected Response
The appearance of the TG18-CT test pattern should clearly demonstrate the low-contrast tar-get in each of the 16 regions. Since this pattern is viewed in one state of visual adaptation, it isexpected that the contrast transfer will be better at the overall brightness for which the visual sys-tem is adapted as opposed to the darkest or the brightest regions. Nevertheless, the low-contrasttargets should be seen in all regions. With experience, the visual characteristics of this test pat-tern can be recognized for a system with quantitatively correct luminance response. A commonfailure is not to be able to see the targets in one or two of the dark regions. In the evaluation ofthe TG18-MP pattern, the relative location of contouring bands and any luminance levels shouldnot be farther than the distance between the 8-bit markers (long markers). No contrast reversalshould be visible.
Figure 44. The dependence of minimum luminance on the size of the area within which theluminance is measured and the surround pixel value (PV) in a monochrome CRT (left) and anAMLCD (right).
84
4.3.4 Quantitative Evaluation of Luminance Response
4.3.4.1 Assessment Method
Using a calibrated luminance-meter and the TG18-LN test patterns, the luminance in the testregion should be recorded for the 18 DDLs as described in section 3.2.2.2. The measurement ofL(p) using patterns other than the TG18-LN patterns may result in different values due to theinfluence of veiling glare. The effect of ambient illumination should be reduced to negligible lev-els, by using a dark cloth if necessary. To enable the evaluation of luminance differences, meas-urements should be made with a precision of at least 10–2 and ideally 10–3. If a telescopicluminance meter is used, in order to minimize the influence of meter’s flare on the low-lumi-nance measurements, the measurements may need to be made through a cone or baffle to shieldthe instrument from the surrounding light, as described in sections 3.1.1.1 and 3.1.3. For dis-play devices with non-Lambertian light distribution, such as an LCD, if the measurements aremade with a near range luminance meter, the meter should either have an aperture angle smallerthan 5° or display-specific correction factors should be applied (Blume et al. 2001) (see section3.1.1.1).
After all luminance values have been recorded, the ambient luminance on the display face-plate (Lamb) should either be estimated from the measured Rd values as Lamb = ERd or measureddirectly. In the case of direct measurement, the display device should be put in the power-saveor blank screen-save mode (otherwise turned off). A telescopic luminance meter normal to thedisplay surface is used with a light-absorbing mask placed behind the meter to minimize specu-lar reflection from the display. Otherwise, the room lighting should be set to the conditionsestablished for the normal use of the equipment (see section 4.3.4.2 below). The values for L'max
and L'min should be computed by the addition of Lamb to the measured Lmax and Lmin values.
4.3.4.2 Expected Response
Acceptable responses are delineated for different aspects of the luminance response. Thefailure of the display device to meet these criteria should prompt repair, replacement, or recali-bration of the device.
4.3.4.2.1 L'max, L'min and Lamb. The recommended value for L'max is typically specified by the ven-dor as the highest value that can be used without compromising other performance characteris-tics, such as lifetime or resolution. For primary displays, that value should be greater than 171cd/m2 (ACR 1999). In cases where this criterion is not achievable (e.g. color CRTs used for USor nuclear medicine primary diagnosis), the primary class requirements for luminance ratio andambient luminance (i.e., LR' = L'max/ L'min ≥ 250 and Lmin ≥1.5 Lamb or L'min ≥ 2.5 Lamb , as describedbelow) should be maintained. The secondary class devices should have a maximum luminanceof at least 100 cd/m2. L'max should be within 10% of the desired value for both classes of display.Furthermore, for workstations with multiple monitors, L'max should not differ by more than 10%among monitors.
L'min should be such that the desired luminance ratio, LR' = L'max/L'min , is obtained. If the man-ufacturer’s recommendations are not available, it is recommended that the luminance ratio of adisplay device be set equal to or greater than 250 for all primary class devices. As a compari-son, this corresponds to a film density range between 0.1 and 2.5, which is a typical range offilm densities that are interpretable without the aid of a high-brightness illuminator. This ratio

85
maintains all contrast information in an image within a luminance ratio where the eye has rea-sonably good response (Flynn et al. 1999). For secondary class devices, LR' should be no lessthan 100. In general L'min should be within 10% of the nominally desired values for both classesof display.
As discussed in section 4.2, ambient lighting can impact the low luminance response of adisplay device and reduce the device’s effective luminance ratio. A limit on the measured Lamb
is, therefore, necessary to prevent fluctuations in room lighting from altering the contrast in darkregions of a displayed image. For both classes of display devices, Lamb should ideally be less than0.25 Lmin (or 0.2 L'min). In situations where the level of ambient lighting can be strictly controlledand taken into account in the luminance calibration of the display device, a larger Lamb can betolerated, but Lamb should always be less than Lmin /1.5 (or L'min /2.5). If necessary, arrangementsshould be made to reduce the room lighting in order to achieve a sufficiently small Lamb .
4.3.4.2.2 Luminance Response. In order to relate measured luminance values to the DICOM3.14 standard luminance response, the gray levels (p-values) used in the 18 measurements ofluminance should be transformed to JND indices. Using the DICOM’s table of JND indices ver-sus luminance, the JND indices for the measured L'min and L'max , Jmin and Jmax , should first be iden-tified. The JND indices for the intermediate values should then be evenly spaced within the JNDrange and linearly related to the actual p-values used, P, as
,
where J indicates the JND indices. Note that in this methodology, Ji values are not thosedirectly related to the measured luminance values per the Barten model. Figure 45 illustratesthe measured luminance response for a display system that was calibrated using 256 p-values.The p-values have been converted to JND indices and the results are plotted in relation to theGSDF. As described above, the luminance response is measured in near total darkness anddoes not include the effects of ambient luminance. Therefore, Lamb should be added to all meas-ured luminance values before comparing to the GSDF.
The expected response of quantitative measurements should be evaluated in terms of thecontrast response rather than the luminance response; i.e., the slope of the measured responseshould agree with the slope of the standard response. Thus, the luminance difference betweeneach measured value should agree with the expected difference associated with the GSDF. Themeasured data should be expressed as the observed contrast, δi , at each luminance step, L'n , asa function of mean JND index value associated with that step.
J JP
Pi
iJ J
= +−( )
min
max min
∆(10)

86
.
The expected response according to GSDF, δdi , should be similarly computed as the following:
Figure 46 shows the contrast response associated with the data shown in Figure 45. As aquantitative criterion for primary class devices, the measured contrast response at any givenpoint, kδ = Max(|δi – δd
i |), should fall within 10% of the standard. This criterion applies specif-ically to contrast evaluated from the 18 measurements of luminance made at uniformly spacedp-value intervals. In Figure 46, the measured contrast response is slightly high at JND = 138.This is related to high luminance values seen in Figure 45 in the lower portion of the luminanceresponse. Secondary class devices may not have a mechanism for calibrating the luminanceresponse and thus may exhibit more deviation from the standard response. It is recommendedthat secondary class devices be used that can be adjusted to have a contrast response (i.e., slope)that agrees with the standard to within 20%.
Figure 45. An example of the measured luminance for 18 display levels is plotted in relation tothe GSDF. The p-values used to measure luminance have been linearly scaled to JND indices,with the values at L'max and L'min set to be equal to the JND corresponding indices.
δi
i i
i i i i
i
L L
L L J JJ J=
−
+ −+−
− −
( )( )( )
20 51
1 1
' '
' '@ .
ii −( )1
δi
d i
d
i
d
i
d
i
d
i i
i
L L
L L J JJ=
−
+ −+−
− −
( )( )( )
20 5
1
1 1
@ . JJi −( )
1
(11)
. (12)

87
4.3.5 Advanced Evaluation of Luminance Response
4.3.5.1 Assessment Method
A complete evaluation of the luminance response requires that the luminance be recordedfor all possible luminance values that a system can use. Measurements should be made using dis-played patterns similar to the TG18-LN patterns in conditions that minimize the effect of ambi-ent illumination. The central region of the pattern should be systematically set to all possiblep-values of the display controller and the displayed luminance values measured. Since the num-ber of values can be large, these measurements will typically be performed using graphics soft-ware that can change the test region’s p-value and automatically record luminance from a meterwith a computer interface. Because of the need to evaluate the change in luminance for each p-value change, a luminance meter with a precision of at least 10–4, and ideally 10–5, should beused. To further improve measurement precision, some signal averaging may be used for eachrecorded value.
4.3.5.2 Expected Response
The expected response for advanced evaluations should be considered in terms of the con-trast response using methods similar to those described for quantitative evaluations. The meas-ured contrast associated with the luminance difference between each sequential gray levelavailable from the display controller, dL'p /L'p , should be compared to the expected contrast perJND associated with the DICOM GSDF. The average JND indices per p-value, Jp , should first becomputed by dividing the JND index difference between L'max and L'min by the total number ofdisplayed luminance steps as
Figure 46. An example of the contrast response computed from 18 gray levels is related to theexpected contrast response associated with the GSDF with 10% tolerance limits indicated.

88
.
The observed contrast per p-value increment should then be normalized by dividing dL'p /L'pby Jp . The result is the observed contrast per JND, dL'j /L'j . This can then be compared directlyto the contrast per JND defined by the DICOM standard, dLd
i /Ldi . Figure 47 illustrates the
measured and expected contrast per JND for a calibrated device with 256 input gray levels(i.e., p-values).
Because the contrast per p-value is generally very small, significant noise can be associatedwith the accuracy of digital-to-analog conversion, the digital precision of the controller DAC,and other sources of electronic noise. This can be evaluated by considering the ratio of the meas-ured contrast per JND to the GSDF contrast per JND, (dL'j /L'j )/(dLd
i /Ldi). The product of this
ratio and Jp is referred to as the JNDs per luminance interval. The JNDs per luminance intervalshould be computed for each p-value and a linear regression performed as described in DICOM3.14 annex C. The data should be fitted well by a line of constant JNDs per luminance intervalequal to Jp . The contrast noise can then be described by the maximum deviation and the rootmean squared error of the observed JNDs per luminance interval values. It should be noted that
JJ J
P Pp
=−
−max min
max min
Figure 47. An example of the measured contrast, dL/L, associated with the luminance differencebetween each of 256 gray levels. The measured contrast has been reduced by the mean numberof JND indices per gray level (p-value) and compared to the contrast per JND associated with theDICOM gray scale display function. The results characterize a monochrome LCD display havinga luminance calibration derived from a set of 766 possible luminance values.
(13)

89
systems with few luminance values (e.g., 256) tend to have a higher contrast per p-value thansystems with more luminance values (e.g., 1024 or 4096) and therefore tend to have lower noisefor (dL'j /L'j )/(dLd
i /Ldi). The visual performance is not better but the noise in the relative contrast
is less because it is evaluated for a larger luminance change. Evaluating the contrast noise interms of the error associated with the JNDs per luminance value removes this bias and moreaccurately reflects display quality.
All the criteria recommended for quantitative method above are also applicable for theadvanced test. For primary class display devices, Jp should not be greater than 3.0 to prevent vis-ible discontinuities in luminance from appearing in regions with slowly varying image values.The maximum deviation of the observed JNDs per luminance interval should not differ from Jp
by more than 2.0. The root mean square deviation relative to Jp should not be larger than 1.0. Noadvanced criteria are specified for secondary class display devices.
4.4 Luminance Spatial and Angular Dependencies
The luminance response evaluations described in section 4.3 only relate to the luminancecharacteristics of a display device at one location on the display faceplate viewed perpendicu-larly. However, display devices often exhibit spatial luminance non-uniformities and variation incontrast as a function of viewing angle, both of which should be characterized as a part of dis-play evaluation protocol.
4.4.1 Description of Luminance Dependencies
4.4.1.1 Non-uniformity
Luminance non-uniformity refers to the maximum variation in luminance across the displayarea when a uniform pattern is displayed. Luminance non-uniformity is a common characteris-tic of CRT displays, with the luminance typically decreasing from the center to the edges andcorners of the display. Various factors cause this behavior including electron beam path lengthand landing angle as well as the faceplate glass transmission characteristics.
In LCDs, contributions to luminance non-uniformity include backlight non-uniformity, mura(visible non-uniformity due to imperfections in the display pixel matrix surface), latent image(i.e., image retention from previous frames), spatial constancy of color coordinates, and thethickness of the liquid crystal elements. However, luminance non-uniformities in LCDs may beless pronounced than in CRTs.
The human visual system is generally not sensitive to very low spatial frequencies.Therefore, gradual non-uniformity extending over the full display surface is not a problem,unless the variation is very pronounced. Smaller scale non-uniformities that have dimensions onthe order of 1 cm are of more significance and should not be visible when viewing a uniform testpattern. Non-uniformities of smaller dimension are classified as noise and are considered in sec-tion 4.6.
4.4.1.2 Angular Dependence
The light emission from a display is ideally Lambertian, for which the luminance is inde-pendent of viewing angle. AMLCD devices are attractive as bright transilluminated devices butcan suffer from severe variations in luminance as a function of viewing angle, including contrastreversal. The viewing angle problem with conventional LCD devices results from the perturba-

90
tion of the orientation of the LC molecules by the electric field in the surface normal direction.At intermediate gray levels, the direction of the LC molecules (director) is tilted obliquely in thedisplay plane and the intensity of light transmitted becomes a function of the incident angle rel-ative to the director orientation. For higher electric fields, the director becomes predominantlynormal to the surface, and the light deflection is reduced. Figure 48 illustrates the contrast ratioassociated with a conventional AMLCD measured at off-axis horizontal and vertical orienta-tions. In addition to reduction of contrast ratio with viewing angle, note that in some cases, theblack luminance level for certain viewing angles can also be at a higher luminance level than themaximum luminance level due to luminance-inversion artifacts.
Three notable approaches have recently been introduced to reduce the viewing angle artifact:
1. Retardation films: Negative birefringence films may be placed at the entrance or at theexit (or both) of the LC structure. These films tend to compensate for the asymmetries inmolecular orientation within the LC layer responsible for the angular dependencies(Hoke et al. 1997).
2. Multidomain LCDs: For each pixel, 2, 4, or more subpixels, each with a different orien-tation, may be used in the alignment layers. A multidomain design with 2 or 4 cells pro-vides averaging of the artifact and is being widely used in the current generation of wideviewing angle AMLCD devices (Nam et al. 1997).
Figure 48. Maximum-to-minimum-luminance contrast ratio of the AMLCD in horizontal andvertical directions. The dashed vertical lines indicate a 90° viewing range (±45° off-axis) withinwhich the contrast ratio average of the horizontal and vertical directions is always greater than200 (Blume et al. 2001) (used with permission).

91
3. In-plane switching (IPS): Electrode pairs can be used on one side of the LC structuresuch that the electric field rotates the director in the plane of the display. IPS is particu-larly attractive in that it resolves the artifact problem at its source by maintaining thedirector orientations in the display plane. Electric fields are commonly provided by inter-digitized electrodes formed on the entrance side of the structure (Wakemoto et al. 1997).
A multitude of combinations or variations of these approaches is now being considered andimplemented into products. While the IPS method is relatively old, it is now recognized to pro-vide excellent viewing angle performance. However, a reduced transmission of about 70% isencountered with this approach which is problematic for portable display applications.
4.4.2 Quantification of Luminance Dependencies
4.4.2.1 Non-uniformity
Luminance uniformity is determined by measuring luminance at various locations over theface of the display device while displaying a uniform pattern. Non-uniformity is quantified asthe maximum relative luminance deviation between any pair of luminance measurements. Anindex of spatial non-uniformity may also be calculated as the standard deviation of luminancemeasurements within 1 × 1 cm regions across the faceplate divided by the mean. This regionalsize approximates the foveal area at a typical viewing distance. Non-uniformities in CRTs andLCDs may vary significantly with luminance level, so a sampling of several luminance levels isusually necessary to characterize luminance uniformity.
4.4.2.2 Angular Dependence
The angular response of a display is usually quantified in terms of variation in the luminanceresponse of the display as a function of polar and azimuthal viewing angles. The values may beused to determine the variation in luminance ratio as a function of viewing angle, as well as thedeviation of the luminance response from the desired on-axis response as a function of viewingorientation. The viewing angle limitation for medical use of the device should be clearly labeledon the device for optimum viewing. If multiple devices of the same design are used, it is suffi-cient to assess the viewing angle limits on one device. For such systems, the acceptable viewingangle cone should be used to arrange the monitors for minimum contrast reduction due to theangular dependencies of luminance.
4.4.3 Visual Evaluation of Luminance Dependencies
4.4.3.1 Assessment Method
4.4.3.1.1 Non-uniformity. The visual method for assessing display luminance uniformityinvolves the TG18-UN10 and TG18-UN80 test patterns. The patterns are displayed and the uni-formity across the displayed pattern is visually assessed. The patterns should be examined froma viewing distance of 30 cm.
4.4.3.1.2 Angular Dependence. Angular response may be evaluated visually using the TG18-CT test pattern. The pattern should first be viewed on-axis to determine the visibility of all half-moon targets. The viewing angle at which any of the on-axis contrast thresholds are renderedinvisible should then be determined by changing the viewing orientation in polar and azimuthal

92
changes. Alternatively, a uniform test pattern with uniformly embedded test targets may be used.The viewer distance at which all targets along the axial or diagonal axes are visible may be usedas an indication of the angular response performance of the display.
4.4.3.2 Expected Response
4.4.3.2.1 Non-uniformity. The patterns should be free of gross non-uniformities from the cen-ter to the edges. CRTs typically exhibit symmetrical non-uniformities, while LCD displaysexhibit nonsymmetrical non-uniformities. No luminance variations with dimensions on the orderof 1 cm or larger should be observed.
4.4.3.2.2 Angular Dependence. The viewing angle cone within which the TG18-CT test targetsremain visible is the cone within which the device may be used clinically. The established view-ing angle limits should be clearly labeled on the front of the display device. For multiple-moni-tor workstations, the LCDs should be adjusted such that the displays optimally face the user.
4.4.4 Quantitative Evaluation of Luminance Dependencies
4.4.4.1 Assessment Method
4.4.4.1.1 Non-uniformity. Using the TG18-UNL10 and TG18-UNL80 test patterns, luminanceis measured at five locations over the faceplate of the display device (center and four corners)using a calibrated luminance meter. If a telescopic luminance meter is used, it may need to besupplemented with a cone or baffle, as described in sections 3.1.1.1 and 3.1.3. For display deviceswith non-Lambertian light distribution, such as an LCD, if the measurements are made with anear-range luminance meter, the meter should have a narrow aperture angle, otherwise certain cor-rection factors should be applied (Blume et al. 2001) (see section 3.1.1.1). The maximum lumi-nance deviation for each display pattern is calculated as the percent difference between themaximum and minimum luminance values relative to their average value, 200*(Lmax – Lmin)/(Lmax +Lmin).
4.4.4.1.2 Angular Dependence. The luminance of an LCD display may be quantitatively evalu-ated as a function of viewing angle. This can be done with two basic approaches: the conoscopicand the gonioscopic methods. In the conoscopic method, a cone of light coming from the displayis analyzed with special transform lenses (Fourier optics) and two-dimensional array detectors.This method provides a fast and complete description of the angular variations of the luminanceand chromaticity levels, but the measuring equipment is usually expensive and more useful indevelopment laboratories. In the gonioscopic approach, a focused luminance probe with a smallacceptance angle is oriented toward the display to reproduce a given viewing direction. Themethod is flexible and versatile and can be easily implemented in a clinical environment.
A basic test should include the evaluation of luminance ratio as a function of viewing angleusing the TG18-LN test patterns. For this measurement, it is useful to have a subjective under-standing of the viewing angle dependence, as illustrated in Figure 48, to determine the specifichorizontal and vertical angles at which quantitative measurements should be made. If the neededinstrumentation for angular measurements is readily available, it is best to determine the angu-lar luminance variations of a display at 18 luminance levels using a conoscopic device or equiv-alent and TG18-LN test patterns.

93
4.4.4.2 Expected Response
4.4.4.2.1 Non-uniformity. The maximum luminance deviation for an individual display deviceshould be less than 30%. This large tolerance limit is recommended based on the current stateof display technology. For CRTs, imposing a restricted criterion necessitates an increased beamcurrent at off-center locations, which further increases the spot size and consequently degradesthe resolution toward the edges of the display. For LCDs, non-uniformities arise from non-uni-formity of the backlight, as well as that associated with the LC array. However, it should be rec-ognized that in a display device with up to 30% luminance non-uniformity, the luminanceresponse over some areas of the image might not comply with GSDF. Measured responses out-side the acceptable range should prompt corrective actions, repair, replacement, or readjustmentof the display device.
4.4.4.2.2 Angular Dependence. Ideally, the angular response of a display should not reduce theluminance ratio by more than 30%. Thus, an acceptable viewing angle cone can be definedwithin which LR' is greater than 175 (250 × 0.7) for primary displays and 70 (100 × 0.7) for sec-ondary displays (Samei and Wright 2004). If the luminance in midluminance values is meas-ured, the angular luminance results should be evaluated the same way they are processed foron-axis measurements, described in section 4.3, to evaluate conformance to the GSDF. Figure49 shows examples of luminance plots and corresponding contrast response for typical CRT andAMLCD displays as a function of viewing angle. The contrast response for any viewing angleshould not be greater than three times the expected limits on axis (kδ ≤ 3 × 10% = 30% for pri-mary displays, kδ ≤ 3 × 20% = 60% for secondary displays) (section 4.3.4.2). For a displaydevice, both LR' and kδ requirements should be met. The established viewing angle limits (ascer-tained either visually or quantitatively) within which the contrast response is acceptable shouldbe clearly labeled on the front of the display device. For multiple-monitor workstations, theLCDs should be adjusted such that the displays optimally face the user.
4.4.5 Advanced Evaluation of Luminance Dependencies
4.4.5.1 Assessment Method
4.4.5.1.1 Non-uniformity. In the advanced method, the index of spatial non-uniformity is deter-mined from a digital image of the faceplate captured using a digital camera. The image is dividedinto 1 × 1 cm regions. The mean of the luminance value within each block is computed and themaximum luminance deviation computed as described above using the maximum and minimumvalues. Next, a low order two-dimensional fit is applied to the 1 × 1 cm luminance values to esti-mate the broad trend within the data. The deviation of the luminance values from this trend is thencomputed. The intermediate-scale non-uniformities are described as the maximum deviation fromthe broad trend. The measured data should be corrected for the non-uniformity associated with thecamera itself and angular luminance characteristics of the display, notably for LCD devices.
4.4.5.1.2 Angular Dependence. If the needed instrumentation for angular measurements isreadily available, it is best to analyze the angular luminance variations of displays to determinethe available contrast at all luminance levels. To achieve this, one approach is to measure theluminance emission from the displays using a rotating arm with the rotation axis lying in theplane of the display surface. The luminance probe used must have a small acceptance angle and

94
must be shielded from light coming from other angular directions, since as the probe rotates itcomes closer to the display and can be sensitive to light coming from outside the desired spot.Alternatively, the measurements may be made using a conoscopic device.
4.4.5.2 Expected Response
4.4.5.2.1 Non-uniformity. The contrast threshold of the human visual system is about 0.03 forfrequencies of 0.5 cycles per cm at a close viewing distance of 30 cm (~0.3 cycles/degree) attypical display luminance levels. The requirements for the maximum deviation of the interme-
Figure 49. Measurement setup for assessing angular dependency (a). An example of luminanceplots and corresponding contrast (expressed as dL/L per JND) response along the horizontaldirection for a medical imaging 5-megapixels CRT monitor at three different angles (0°, 30°, and50°) (b), and for a monochrome high-resolution AMLCD monitor along the horizontal (c) andvertical (d) directions. Thin lines indicating the 10% tolerance based on the DICOM GSDF lim-its (thick lines) specified for normal viewing have been added for comparison. For the CRT, theresults for negative angles along the horizontal, and for all vertical angles are essentially similardue to the rotational symmetry of the CRT phosphor emission. That is not the case for theAMLCD.

95
diate-scale non-uniformities are derived by requiring that the index be less than half of this con-trast. Thus, the maximum relative deviation should be less than 0.015.
4.4.5.2.2 Angular Dependence. No advanced requirements have been established for angulardependencies of medical displays.
4.5 Display Resolution
4.5.1 Description of Display Resolution
Spatial resolution is the quantitative measure of the ability of a display system to produceseparable images of different points of an object with high fidelity. Systems designed with ade-quate spatial resolution characteristics are necessary to assure that spatial details of interest arepreserved when a medical image is displayed. Portraying image data on a display with insuffi-cient resolution will compromise the accuracy of the radiological interpretation.
The resolution limitation imposed by the limited bandwidth of the video amplifiers in CRTs isprimarily evident in the horizontal direction; in the vertical direction, the resolution is primarilygoverned by electron optics. The described mechanisms significantly contribute to the anisotropicresolution properties of CRT display devices: the magnitude of the modulation transfer function(MTF) in the horizontal direction is typically lower than in the vertical direction. Consequently,a vertical line is often rendered with lower luminance compared to the respective horizontal line.The more the signal magnitude after the video amplifier is reduced, the higher becomes theenergy reduction and, thus, display luminance. Even in properly designed high-resolution displaysystems, the directional dependence of resolution is noticeable. Because of the typically largedifference in modulation transfer function between vertical and horizontal directions, someCRTs utilize resolution restorations using anisotropic filtering. In testing a CRT display, it is use-ful to know the resolution restoration methodology of the device before hand.
4.5.2 Quantification of Display Resolution
Limiting resolution and maximum perceivable contrast at the limiting resolution are twoways that the spatial resolution response of a display system can be characterized. Resolution ismore formally quantified by the MTF of the display. The MTF is defined as
MTF( fx, fy) = |P( fx, fy)|/P(0,0) ,
where |P( fx, fy)| is the modulus of the Fourier Transform of the imaging system’s point spreadfunction, P(x,y) (Gaskill 1978, Barrett and Swindell 1981). Note that MTF( fx, fy) is normalizedto unity at the spatial frequencies of fx = fy = 0 lp/mm. Most commonly the user quotes the MTFresponse at the Nyquist frequency. For a CRT with a pixel size of dx in x-direction and dy in y-direction, the respective Nyquist frequencies are fNy,x = 1/(2*dx) and fNy,y = 1/(2*dy).
The MTF is applicable only to linear or quasi-linear imaging systems. Most display devices,including CRT displays, have a nonlinear luminance response and a nonlinear relationshipbetween resolution and luminance. To correctly apply the use of the MTF in testing, the displaysystem response must be made linear, or the measurements must be made using small-signal
(14)

96
modulations such that a linear assumption is reasonable for the range being used. The former isdifficult, since the luminance response of a display system is often dependent on the spatial fre-quency content of the image being displayed. Thus, the MTF measurement should rely on thelatter approach.
The MTF of a display system can be obtained using different methods based on the abilityof the system to display square wave patterns, a line, an edge, a single pixel, or white noise input(broadband response) (Weibrecht et al. 1997). The methods vary in their level of difficulty toimplement and generate slightly different results. The method of broadband response is perhapsthe most labor intensive one in which the noise power spectra (NPS) of a displayed white noisepattern are measured and averaged many times. The line response is perhaps the easiest andmost intuitive method. Research on the advantages of any one method over others is still inprogress. The line method provides a simple and fairly accepted method for the assessment ofthe MTF of display systems and, thus, is recommended in this report. However, other methodscan be considered in advanced evaluations.
4.5.3 Visual Evaluation of Display Resolution
4.5.3.1 Assessment Method
Display resolution can be evaluated by visually assessing the appearance of the Cx patternsin the TG18-QC or the TG18-CX test patterns. In displaying these patterns, it is important toverify that that the patterns are displayed as one display pixel per image pixel, as any digitalmagnification will hide the actual response. Most image viewers have function to accomplish thisdisplay mode. In order not to be limited by the MTF of the eye, use of a magnifying glass is rec-ommended. Using the TG18-QC pattern and a magnifier, the examiner should inspect the dis-played Cx patterns at the center and four corners of the display area and score the appearanceusing the provided scoring scale. The line-pair patterns at Nyquist and half-Nyquist frequenciesin the horizontal and vertical directions should also be evaluated in terms of visibility of thelines. The average brightness of the patterns should also be evaluated using the grayscale steppattern as a reference. The difference in visibility of test patterns between horizontal and verti-cal patterns should be noted. The relative width of the black and white lines in these patchesshould also be examined using a magnifier. The resolution uniformity may be ascertained acrossthe display area using the TG18-CX test pattern and a magnifier in the same way that the Cx ele-ments in the TG18-QC pattern are evaluated.
Alternatively, the resolution response can be visually assessed using the TG18-PX test pat-tern. The pattern should be displayed so that each image pixel is mapped to one display pixel.Using a magnifier with a reticule, the physical shape and size of a few pixels in different areas ofthe pattern at the center and the corners are evaluated. The size of the maximum-brightness pix-els should be measured at approximately 50% and 5% of luminance profile (Figure 4c). The res-olution-addressability ratio (RAR) is assessed as the ratio of the 50% size (FWHM) and thenominal display pixel size. If notable astigmatism is present at the corners of the active displayarea, the astigmatism ratio, or the ratio of the large versus short axis of the spot ellipse shouldbe measured. It should be noted that this method of resolution measurement requires experienceto achieve consistent results.

97
4.5.3.2 Expected Response
In the visual inspection of the TG18-QC and TG18-CX patterns on primary class displaysystems, the Cx elements should be scored between 0 and 4 at all locations. This limit coincideswith RAR ≤ 1.15 (Table III.9). For secondary class displays, the Cx scores should be between 0and 6 (RAR ≤ 1.47). For both classes, the horizontal and vertical line-pair patterns at Nyquistfrequency should be discernable at all locations and for all directions.
In CRTs, it is normal for the performance at the center to be better than that at any cornerdue to natural deflection distortions. Also, the horizontal line-pair patterns at Nyquist frequencyusually appear overall slightly brighter than the vertical patterns because the vertical patternscontain a higher percentage of rise/fall time per pixel, delivering less beam energy to the phos-phor screen. At the Nyquist frequency, the difference in the average luminance should be lessthan 30%. A difference more than 50% indicates a slow video amplifier not well suited for thematrix size. The vertical and horizontal line-pair patterns at half-Nyquist frequency should showless of a luminance difference since the vertical patterns contain two pixels per line, providingmore dwell time for the electronic beam. A significant difference between the thicknesses of theblack and white lines is also indicative of a poorly shaped pixel with excessive spread of thepixel, which diminishes the black content.
In evaluating the display resolution using the TG18-PX test pattern on CRTs, the pixel shapesshould be nearly round, indicating a close match of the optics and video bandwidth. The pixelshould show a near-Gaussian distribution of luminance, indicating symmetrical rise and falltimes. Improper damping of the video amplifier or overshoot phenomena cause distortions thatcan be described as crescent-shaped echoes and/or comet tails following the intended pixel. Thesize of the pixel profile at 50% of the maximum should compare closely to manufacturer’s spec-ification. The 5% size should be about twice the 50% size (Figure 4). Larger 5% sizes causenotable display resolution loss due to the increase in pixel overlap. The RAR should be between0.9 and 1.1 for primary class displays (Muka et al. 1997). This range provides a balancebetween a structured appearance (e.g., raster lines visible) and an excessive resolution loss. Themaximum astigmatism ratio should be less than 1.5 over the display area for primary class dis-plays. For LCDs, the pixel intensity should not extend beyond the nominal pixel area.
4.5.4 Quantitative Evaluation of Display Resolution
4.5.4.1 Assessment Method
4.5.4.1.1 MTF Method. Quantification of the MTF requires the use of a displayed-image digi-tizing system, such as a digital camera, to digitally capture a portion of the display and to ana-lyze the resulting images, as described in section 3.1.2. The lens of the camera should be set toa high f-number in order to reduce the flare of the camera lens. The flare should also be furtherreduced with the aid of a cone or funnel device. The magnification of the lens should result inoversampling of the display. At least 64 camera pixels should cover one display pixel (i.e., 8 × 8recorded pixels per displayed pixel). The camera needs to be well focused on the screen of thedisplay under test. This is best done when the lens aperture is opened to its maximum level. Inthis position, the depth of focus is small and the line width is very sensitive to the focus control.Afterward, the lens aperture is set to its smallest level in order to achieve a large depth of focusand minimum flare. Large depth of focus is particularly important in view of the thickness non-uniformities of the CRT’s faceplate.

98
The TG18-RV, TG18-RH, and TG18-NS patterns provide line inputs as target patterns for theMTF measurements. These patterns allow the assessment of MTF in the horizontal and verticaldirections at three luminance levels and five locations on the display area. At each location, thecamera should be securely positioned in the normal direction in front of the target area of the dis-play and focused on the line. The magnification should be determined in accordance with the dis-play pixel size, camera matrix size, and the desired oversampling. The camera field of viewshould include the pixel markers in the pattern. While the camera should be placed in a normaldirection with respect to the faceplate, it needs to be rotated parallel to the faceplate such that thecamera pixel array is angled at 2° to 5° with respect to the displayed image, in order to provideappropriate oversampling. After the camera is properly positioned and focused, images from allsix patterns should be captured before moving the camera to the next location. The exposure timeshould be selected such that the digital signal of the camera exceeds the dark signal by a factor of100. Furthermore, the exposure time should be long enough to permit integration over multipledisplay frames, but short enough with respect to instabilities of the scanning and deflection cir-cuits. Ultimately the integration time should be appropriate with respect to the integration time ofthe human eye, for which the experiments are conducted. Integration times between 0.2 s and 1s are appropriate to use. The measurements should be made in a darkened room.
The 30 images should be acquired without any image compression. The data should be trans-ferred to a computer for data processing. The captured line patterns should be reduced to orthog-onal MTFs using Fourier analysis. There are several processing steps in the calculations, and theresults are expected to vary slightly with the methods. For standardization and simplicity the fol-lowing steps are suggested:
1 1. Determine the size that the image pixels represent in terms of the spatial dimension onthe display using the known physical distance of the pixel markers on the patterns andthe measured pixel distance of the markers in the captured images.
1 2. Linearize the image data with respect to display luminance using the luminanceresponse of the display (characterized in section 4.3).
1 3. Add the mean value of the image from the TG18-NS to that of the TG18-RV (or TG18-RH) pattern, and subtract the TG18-NS image pixel by pixel from the TG18-RV (orTG18-RH) image in order to remove display pixel structure. Averages of multipleimages may be used for more complete removal of structured noise. The subtractedimage is used for further processing.
1 4. Identify a rectangular square region of interest (ROI) extending along the image of the line.1 5. Determine the angle of the line. 1 6. Reproject the two-dimensional data within the ROI along the direction of the line into
subpixel bins to obtain the composite line spread function (LSF).1 7. Smooth the LSF if it expresses excessive noise.1 8. Find the Fourier transform of the LSF, and normalize the resulting MTF.
9. Divide the MTF by the sinc function associated with the width of the LSF subpixelbins, and correct for the previously characterized MTF of the camera system (see sec-tion 3.1.2).
Note that in some cases the LSF might be asymmetric. In those cases, each side of the LSFis used to form two symmetric LSFs. The resultant MTFs are reported along with their averageas representative of the display resolution.

99
4.5.4.1.2 Luminance Method. Particular to CRTs, another more limited but simpler method toquantitatively characterize the resolution of a display system is based on luminance measurementsperformed on the line-pair patterns of the TG18-QC test pattern. The method does not provideabsolute measures of luminance; rather it provides the resolution differences in the orthogonaldirections. Using a telescopic luminance meter focusing on the entire central patch with the 100%modulation horizontal line-pair pattern, measure the average luminance of the patch. Repeat themeasurement on the adjacent vertical line-pair patch, and calculate the percent differencebetween the two luminance values relative to the maximum measured luminance value. Repeatthe procedure for all four corners. The values are indicative of the CRT’s resolution characteris-tics, i.e., inadequacy of the rise and fall times that define the pixels in the horizontal direction.
4.5.4.2 Expected Response
Acceptable responses are delineated for each one of the quantitative methods describedabove. Measured responses outside the acceptable range should prompt corrective actions in theform of focus adjustments, repair, or replacement of the device.
4.5.4.2.1 MTF Method. Values of the measured MTF at the Nyquist frequency should be atleast 35% for primary display devices and 25% for secondary devices. More comprehensivequantitative criteria for the MTF are expected to be determined from future clinical experience.
4.5.4.2.1 Luminance Method. In assessing the resolution of a display device using the lumi-nance method, the percent luminance difference at the center should be less than 30% for pri-mary class display systems and 50% for secondary class systems. The corners always yield lowervalues than the center, as the extent of the corner pixels are influenced by the spread in the elec-tron energy due to a nonperpendicular beam-landing angle.
4.5.5 Advanced Evaluation of Display Resolution
4.5.5.1 Assessment Method
As an advanced method, the MTF of a display system can be assessed using the other meas-urement methods mentioned in section 4.5.2. The following is a brief summary of these methods.The interested readers should consult the stated references.
In the square-wave response method, small-amplitude square waves of different spatial fre-quencies are displayed in the horizontal and vertical directions and their responses are recorded.The MTF or sine-wave response is found from the square-wave response by Fourier seriesanalysis. Finding the MTF from the square wave is practically like finding it point by point, fre-quency by frequency from the ratio of the output modulation (peak-to-peak amplitude) to theinput modulation. The advantage of using square-waves comes from the fact that (1) it is diffi-cult to make good sine waves digitally, and (2) square waves are composed of a multitude of sinewaves, so one can take advantage of the multitude of harmonics.
The line response method is described above for positive single-line profiles, where a singleline is displayed on an otherwise darker background. The same method can be applied to nega-tive single-line profiles, where a single line is displayed at a low luminance value on an other-wise uniformly bright background (Weibrecht et al. 1997). The small signal requirement shouldstill be met. The profiles of single lines are determined and the MTF is found from the one-dimensional Fourier transform of the line profiles.

100
The MTF can also be determined from the edge-spread function (ESF) of the system. TheESF is not spatially limited and truncation errors occur if the discrete Fourier transform (DFT)is directly applied to it. To make the ESF spatially limited, it is typically differentiated to obtainthe LSF and the MTF, deduced by Fourier transform methods. Unlike the line response method,which provides the average MTF of the system, the edge response method can quantify theMTFs for asymmetrical LSF. However, the edge response method requires a spatial-derivativeoperation, which accentuates noise in the analysis. This noise may be reduced if the MTF isobtained using multiple edge images. The small signal requirement should still be met.
In the single-pixel response method, images of single positive (or negative) pixel profilesagainst otherwise dark (or bright) backgrounds are captured via a digital camera (Weibrecht etal. 1997). The MTF is found from the two-dimensional Fourier transform of captured pixel pro-files. Note that for the case of single-line and single-pixel profiles, the results are differentdepending on the polarity of the signal contrast applied because of the differing relative contri-bution of multiple pixels as well as the display’s veiling glare.
In the broadband response method, the display system’s response to white stochastic signalsis assessed. This method can be implemented only under conditions of a linear approximation,i.e., small signal amplitudes, since the energy of the stochastic signals can be spread over largemeasurement areas. Furthermore, stochastic signals may be a convenient close representation ofreal medical images. The basic idea of the stochastic approach makes use of the fact that the sig-nal power spectrum (SPS) found at the output of a linear, noise-free system, Φout( f ), is the signalpower spectrum of the input signal, Φin( f ), weighted by the squared magnitude of the transferfunction, |H( f )2| (Gaskill 1978) as
Φout( f ) = |H( f )|2 Φin( f ) .
Thus, the MTF is given by the normalized square root of the ratio of the output SPS and the inputSPS. This ratio is also called the broadband response. The broadband response technique is perhapsthe most cumbersome, yet precise method for measuring the spatial resolution of a display system.
4.5.5.2 Expected Response
The expected requirements for the advanced measurements of display resolution characteris-tics have not yet been established.
4.6 Display Noise
4.6.1 Description of Display Noise
The detectability of small objects and objects of low contrast in medical images depends notonly on their size and contrast but also on the superimposed noise and noise in the immediatesurroundings. Noise in the context of this report is defined as any high-frequency fluctua-tions/patterns (< 1 cm) that interfere with the detection of the true signal. Note that not only dothe frequency components of the noise that occur below the display’s Nyquist frequency deteri-orate the image quality, but higher frequency components up to the human visual system resolu-tion limit also contribute to the noise impression. In this definition of noise, very low frequency
(15)

101
fluctuations (> 1 cm) are excluded, as they are usually perceived as non-uniformity rather thanas noise and are classified under luminance non-uniformity, discussed in section 4.4.
CRT displays have several noise sources such as electronic noise, stochastic noise in the con-version of the video signal to photons, and structured noise. Thus, CRT display system noise hasboth temporal and spatial components. The temporal component behaves similar to quantumnoise and appears to be determined by random fluctuations in the number of luminescence pho-tons detected by the human eye (Roehrig et al. 1990). Spatial noise is a fixed-pattern noise thatstems from the granular structure of the CRT phosphor screen. Typically, temporal noise is smallcompared to spatial noise, except at the lowest luminance levels. The signal-to-noise ratio (SNR)of spatial noise is usually independent of the luminance level. P45 screens usually add less noiseto a displayed image than P4 or P104 screens as discussed in sections 2.3.1.1 and 2.4.8.
Noise also exists in flat-panel displays. Noise in flat-panel AMLCDs, both temporal and spa-tial, can arise from variations in luminance within the active area of the pixel. Such variationscan be from non-uniformities in the applied electrical field due to electrode fabrication method-ology and physical placement, and from unwanted variations in the input signal due to voltagefluctuations and electronic noise. They can also be caused by the intentional specification ofsubpixels driven at slightly different luminance levels to achieve a greater number of gray val-ues. Three subpixels are commonly used and individually addressable, so three regions of lumi-nance differences may exist within one full pixel’s active area. Furthermore, in order to achievea uniform thickness of LC material with AMLCD (needed in order to ensure consistent opticalproperties), inert glass beads are often, but not always, placed between the front and back glasspanels. These beads normally transmit light and generate small spots of light in a dark screenfor normally black displays. Their impact is small and may be generally discounted.
Noise can also be caused by variations in uniformity of luminance, taking into account thepixel structure. Each AMLCD pixel has a surrounding inactive area, which causes a structuredpattern in the active display. The pattern can take many forms depending on the size, shape, andarchitecture of the pixels. Regardless of the source of noise in flat panels, the specification of itspresence and assessments of its impact are similar to those for CRT devices.
4.6.2 Quantification of Display Noise
Spatial noise of a display system can be described by the normalized noise power spectrum(NPS) of the system. The noise power is derived from the discrete Fourier transform of dis-played uniform images, I(i,k),
,
where j and k are pixel indices, m and n are the number of samples representing the image inhorizontal and vertical directions, and n(u,v) is the noise amplitude for the frequency compo-nents u and v. The noise power spectrum is defined as
,
n u v I j k e ei ju m i kv n
k
n
j
m
( , ) ( , ) / /= ⋅ ⋅=
−
=
−
∑ 2 2
0
1
0
π π11
∑
NPS u vmn
E n u v( , ) ( , ) =1 2
(16)
(17)

102
where E|n(u,v)|2 is the expectation value of the function |n(u,v)|2, determined by averaging thenoise spectra from different areas of the screen image (Gaskill 1978, Dainty and Shaw 1974).The NPS is normalized by the respective signal power. Noise power is presented by a two-dimensional graph or a plot of one-dimensional slices of the two-dimensional data along a par-ticular direction. Noise power is often expressed in square millimeters by multiplying thenormalized NPS by the area of individual samples.
While temporal noise can be characterized with the aid of a photomultiplier or a detectorwith a time response relevant to the human visual system (i.e., 8 Hz) (Roehrig et al. 1990b,1993), it has not been shown to be of great concern in medical display devices and, thus, is notaddressed in this report.
4.6.3 Visual Evaluation of Display Noise
4.6.3.1 Assessment Method
The visual method to quantify the spatial noise of a display system is based on the methodto determine just noticeable luminance differences as a function of size using the TG18-AFCtest pattern. Each quadrant of the test pattern contains a large number of regions with varyingtarget position. In each quadrant, the contrast and size of the target are constant. The contrast-size values for the four quadrants are 20-2, 30-3, 40-4, and 60-6. The observer views the pat-terns from a viewing distance of 30 cm. The quadrants can be subjectively evaluated to establishthe contrast-size relationships for which the observer can confidently place the position of alltargets. The target visibility in each of the target regions may also be quantified by counting thenumber of targets readily visible in each of the quadrants and computing the percent correct.
4.6.3.2 Expected Response
The visual evaluation should render all the targets except the smallest one visible for primaryclass displays and the two largest sizes visible for secondary class displays. Since the mean valueand the standard deviation of the background are each linearly dependent on the luminance,their ratio (i.e., SNR) remains independent of luminance (Roehrig et al. 1990b, 1993).Therefore, the results of the noise evaluation are independent of the absolute luminance value ofthe pattern’s background. However, the failure of a device in this test can also be an indicationof an improper luminance response, the possibility of which can be eliminated by first verifyingthe proper luminance response of the device.
4.6.4 Quantitative Evaluation of Display Noise
4.6.4.1 Assessment Method
Spatial noise of a display system can be quantified by either single-pixel signal-to-noise ratiosor by the normalized NPS. Both methods require the use of a scientific-grade digital camera (seesection 3.1.2.1) to capture an image of a uniform pattern displayed on the device. The cameralens should be set to a high f-number in order to reduce veiling glare in the camera. Also, themagnification of the lens should result in oversampling of the display in a way that allows sam-pling of spatial frequencies up to 40 cycles per degree, which is the resolution limit of the humanvisual system at the maximum luminance of most electronic displays (Rose 1974). As an exam-ple, when evaluating a 21-in. display with a matrix size of 1726 × 2304 at 250 mm distance, the

103
Nyquist frequency corresponds to about 12.4 cycles/deg. Evaluation of noise up to this limitrequires sampling frequencies to at least 40/12.4 = 3.2 times the Nyquist frequency of the dis-play. To achieve this, at least 16 camera pixels should cover one display pixel. The cameraimages should also be flat-field corrected, compensated for gain variations, and restored for thedegradation of the MTF of the camera optics based on the prior performance evaluation of thecamera system, noted earlier.
The central region of the TG18-NS test patterns can be used as the target uniform patternfor both measurements at three luminance levels. The camera should be securely positioned infront of the target area of the display and focused. The field of view should include the pixelmarkers in the pattern. The magnification should be determined in accordance with the displaypixel size, the camera matrix size, and the desired oversampling. After the camera is properlypositioned and focused, images from all three TG18-NS patterns will be captured. To eliminatethe effects of temporal fluctuations in the luminance output, images should be captured with anintegration time of about 1 s. The measurements should be performed in a darkened room. Theimages should be transferred uncompressed to a computer for data processing.
4.6.4.1.1 Single-Pixel SNR. The quantification of the display noise by the single-pixel SNR fol-lows the concepts of information theory (Roehrig et al. 1990b). The quantity is determined byprocessing each captured image using the following steps:
1. Determine the size that the image pixels represent in terms of the spatial dimension onthe display using the known physical distance of the pixel markers on the pattern and themeasured pixel distance of the markers in the captured image.
2. Linearize the image data with respect to display luminance.3. Utilizing only the central 1/4 area of the image, apply a sampling aperture of n × n cam-
era pixels, where n is the number of camera pixels representing one display pixel.4. Calculate the SNR as the ratio of the mean to standard deviation in the sampled image.5. Correct for the camera noise. Based on the assumption that the camera noise and the dis-
play spatial noise are uncorrelated, the SNR based on the mean and standard deviationof sampled camera images without exposure using the same integration time may be sub-tracted from the SNR value computed in step 4 to determine the SNR independent of thecamera.
4.6.4.1.2 Noise Power Spectrum. The captured uniform patterns are processed to acquire theNPS at three luminance levels using Fourier analysis. Multiple processing steps are involved, andthe methods can vary the results slightly. For standardization and simplicity, the following stepsare suggested for processing each captured image:
1. Determine the size that the image pixels represent in terms of the spatial dimension onthe display using the known physical distance of the pixel markers on the pattern and themeasured pixel distance of the markers in the captured image.
2. Linearize the image data with respect to display luminance.3. Divide the central 1/4 region of the captured image into multiple, nonoverlapping
regions, 128 × 128 or 256 × 256 in size. The size of these regions determine the sam-pling interval of the resulting NPS. Depending on the exact level of magnification (over-sampling) and the matrix size of the camera, between 9 to 64 regions may be identified.It is recommended that at least 20 regions be used for the assessment of the NPS. To

104
achieve this, it might be necessary to acquire multiple images from the central patch ofthe TG18-NS pattern by orienting the camera toward another, nonoverlapping area of thecentral area of the displayed pattern.
4. Apply a two-dimensional fast Fourier transform on each region to yield the two-dimen-sional NPS.
5. Average the two-dimensional NPS from all regions.6. Correct for the camera noise. Based on the assumption that the camera noise and the dis-
play spatial noise are uncorrelated, the NPS based on sampled camera images withoutexposure using the same integration time may be subtracted from the results.
7. Derive the orthogonal NPS from the calculated two-dimensional NPS by band averaging,excluding the data on the orthogonal axes.
It should be pointed out that the NPS measurements could also be performed first by defo-cusing of the electron beams, thus removing the raster lines. This method is not recommended, asit will measure system performance in a condition that is not used clinically. The two approachesgenerate different results. Depending on whether the raster lines are visible or have been defo-cused and are not visible, the measured noise is different by almost a factor of 2 (Figure 50).
4.6.4.2 Expected Response
Since there are only a few examples of actual SNR and NPS measurements at this point,and since no correlation of the measurements and diagnostic accuracy is ascertained, no fixed
Figure 50. Examples of noise power spectra (NPS) in the vertical direction due to phosphornoise for a luminance value resulting from an 8-bit command level (pixel value) of 127 for thetwo situations in which the raster lines are visible, and the other in which they have been defo-cused and are not visible.

105
criteria are recommended at this time. However, noise values associated with the display deviceshould not exceed those of typical radiological images that are viewed with the system.
4.6.5 Advanced Evaluation of Display Noise
4.6.5.1 Assessment Method
As an advanced evaluation, the spatial noise characteristics of display, SNR and NPS, can beascertained at five locations on the display using the center and corner areas of the TG18-NStest patterns. Additionally, the temporal noise characteristics of the display can be ascertained.The measurements can be performed by assessing the noise characteristics across an ensembleof images acquired at 8 Hz, corresponding to the integration time of the human eye.
4.6.5.2 Expected Response
The expected requirements for the advanced measurements of display noise characteristicshave not yet been established.
4.7 Veiling Glare
4.7.1 Description of Veiling Glare
Light scattering in display devices induces a diffuse luminance that veils the intended image.In this report, the term flare is used to describe diffuse scattering of light in a photographic lens,while the term glare is used for display devices. Veiling glare is also different from reflection,covered in section 4.2, in that reflection refers to the response of a display device to incidentambient lighting conditions, while glare is an internal display property.
In monochrome CRT display devices, three physical attributes contribute to veiling glare.They are internal reflections of the electrons from the aluminum layer inside the CRT (Figure51), generation of secondary electrons in the phosphor and aluminum layer of the CRT, and lightscattering in the glass faceplate. The last attribute, which is dominant, is due to scattering of thelight in the thick glass plate of the emissive structure by specular reflections from the exit sur-face and diffuse reflections from the phosphor layer (Badano and Flynn 2000). The amount ofveiling glare can be reduced by using darkened glass.
In color CRT devices, the veiling glare has a substantial electronic component caused bybackscattering of the electrons from the edges of the shadow mask or aperture grill openings.These backscattered electrons reenter the mask or the grill opening at different locations caus-ing a low-frequency spread of displayed luminance. The electronic component of veiling glarehas different spatial extent for shadow mask and aperture grill designs. The shadow maskdesigns typically have more electron backscattering than grill designs (Oekel 1995).
For most flat-panel devices, no light is reflected internally, nor are secondary electrons cre-ated, and light is attenuated in short distances such that the diffuse component of veiling glareis minimal. However, short-range scattering can still cause local glare, which is noticed aroundbright characters on a black background.
The luminance distribution of an image scene acts as a source for the production of veilingglare. Since light transport is typically a linear process, the veiling-glare component of an imagecan be determined by convolving the image with the point spread function describing the veilingglare (Badano and Flynn 2000). The displayed image is then the linear sum of the primary

106
image and the diffuse secondary image associated with veiling glare. The addition of this dif-fuse secondary component has the overall effect of reducing contrast in a manner similar to con-trast reduction from scattered x-rays in radiography. This contrast reduction is most severe in thedark regions of the primary image.
The human eye has flare characteristics better than most optical lens recording systems andis capable of perceiving low-contrast objects in dark regions surrounded by bright image scenes.Display devices with very low veiling glare are thus needed to present images with good contrastin these dark regions. Conventional trans-illuminated film has essentially no veiling glare.Conventional color CRTs have substantial veiling glare which make them unsuitable as primaryclass medical display devices.
4.7.2 Quantification of Veiling Glare
Veiling glare is measured using a test pattern with a dark region surrounded by a bright field.For image intensifiers, a central dark circle with a diameter equal to 10% of the diameter of therecorded field is specified by NEMA. There have been only a few published standards for thetest pattern and method to be used for the measurement of veiling glare in display devices. NISThas reported results using black squares of varying size on a white background (Boynton andKelley 1997). However, a radially symmetric pattern consisting of a circular dark spot sur-rounded by a circular bright area can provide experimental results that can be related to ringresponse functions and point response functions (Badano and Flynn 2000, Badano et al. 1999).
Figure 51. Electronic and optical components of veiling glare in CRTs. A white area on theCRT’s surface causes reflections of electrons on its internal aluminum layer and scattering ofoptical photons in its thick faceplate, increasing the luminance of the black areas.

107
For a particular test pattern, the veiling glare can be quantified by the ratio of the maximumluminance to the minimum luminance, referred to as the glare ratio. The glare luminance meas-urements require the observation of a dark region surrounded by a very bright field. Thus, a low-flare luminance meter device that shields the observation from the bright region is required. Themeasurements can be performed using either a custom-made or a telescopic luminance meterwith a baffled funnel at one end, as described in sections 3.1.1.1 and 3.1.3.
It is recommended that veiling glare be assessed using a test pattern with a black backgroundand a central white region 20 cm in diameter. In the center of the bright circle should be a blackregion 1 cm in diameter. A set of glare test patterns in a standard image format can be used toestablish a variety of conditions needed to complete a glare test. Alternatively, graphics softwarefor generating test patterns can be used to generate the patterns on demand (see section 3.1.3).
4.7.3 Visual Evaluation of Veiling Glare
4.7.3.1 Assessment Method
The visual assessment of veiling glare can be accomplished using the TG18-GV and TG18-GVN test patterns. The display size must be adjusted so that the diameter of the white region is20 cm. The observer should discern the visibility of the low-contrast objects in sequential view-ing of the TG18-GVN and TG18-GV patterns with the bright region masked from view.Alternatively, a test pattern generator of the type described in section 3.3.1 may be used. Thisgives one the ability to adjust the contrast (via pattern modification) of a single target at the cen-ter of a 1-cm-diameter dark circle until the target is just visible under the conditions of presenceand absence of a 20-cm-diameter 100% bright surround. Because the human visual system willchange adaptation if it views the bright field, it is imperative that the bright field is fully blockedfrom view and that no reflected light from the bright field be observable. This may be accom-plished by the use of a mask or cone, which shields the human eye from the surround luminanceof the pattern.
4.7.3.2 Expected Response
No significant reduction in the contrast of the target objects should be observed between thetwo patterns, one with and one without the bright field. This test is sensitive to the perceivedcontrast of the target with a black surrounding region. If this is exactly at the just noticeablethreshold, then any reduction in contrast due to the presence of the bright field will render thetargets not visible. A target contrast of about 4 times the just noticeable ∆L/L is appropriate forthis test in primary class display devices. For a system with 1024 DDLs and a calibrated displaydevice with a luminance range of 1 to 250 cd/m2, this target contrast corresponds to a change offour DDLs, which produces a ∆L/L of 0.03. Thus, at least three objects should be readily visiblein either pattern for primary class display devices. The corresponding object for secondary classdisplay devices is at least one target.
4.7.4 Quantitative Evaluation of Veiling Glare
4.7.4.1 Assessment Method
The quantitative evaluation of veiling glare is accomplished using a highly collimated lumi-nance meter and the TG18-GQ, TG18-GQB, and TG18-GQN test patterns. It is important to

108
assure that the patterns are displayed at the specified size. The display size must be adjusted sothat the diameter of the white region is 20 cm. Furthermore, as described in section 3.1.3, thebright luminance surrounding the central measurement point at the center of the test patternsshould be blocked, using either a baffled luminance meter or a telescopic luminance meter witha light-blocking baffled funnel or cone. Using either of these devices, the luminance in the cen-ter of the central dark region of the TG18-GQ pattern, L, the white luminance in the center ofthe white region of the TG18-GQB pattern, LB, and the background luminance value in the cen-ter of the TG18-GQN pattern, LN, are recorded. The glare ratio for the display is then computedas
GR = (LB – LN)/(L – LN) .
4.7.4.2 Expected Response
The veiling glare for a high-fidelity display system should not change the contrast of a targetpattern by more than 20% with and without a bright surrounding. Thus, the luminance fromveiling glare should not be more than 25% of the minimum luminance for the normal operatingsettings of the display. Since the ratio of the maximum luminance to the minimum luminanceshould be about 250 (Flynn and Badano 1999), this implies a glare ratio of 1000, which is typ-ical of measurements made for transilluminated film. However, the recommended test patternpresents a scene with significantly more veiling glare in the target region than is encountered inmedical imaging scenes. Though not as strict criteria, which may not be achievable by certaindisplay technologies, this report recommends that the primary class displays have a glare ratioof greater than 400 and secondary class displays have a glare ratio greater than 400 (Flynn et al.1999). Glare ratio results for specific medical imaging systems are reported in the literature(Badano et al. 2002).
4.7.5 Advanced Evaluation of Veiling Glare
4.7.5.1 Assessment Method
Using the quantitative test method described above, a more complete characterization of veil-ing glare can be made by measuring the glare ratio as a function of the black region diameter. Itis important to assure that the patterns are displayed at the specified size. The display size mustbe adjusted so that the diameter of the white region is 20 cm. If the veiling glare point responsefunction is shift invariant and radially symmetric, the glare ratio data, Gi , at various radii, ri , canbe reduced as an estimate of the veiling glare ring response function, R(r) (Badano and Flynn2000, Badano et al. 1999) using
. 1 1
1
1
1
/ / ( )
( ) ( / ) /
G G R r dr
R r G r
i i r
r
i
i
i
i− =
=
+
+∫∆ ∆
(18)
(19)

109
Typically, measurements are made of radii from 5 to 30 mm, with finer spacing at smaller radii,using the TG18-GA test patterns.
4.7.5.2 Expected Response
Measurement of the veiling-glare ring response function provides information regarding thespatial extent of the luminance spread. The shape of this curve is different for monochrome CRTdevices, color CRT devices, and flat-panel devices (Badano et al. 1999). Anti-reflective (AR)coatings alter the shape of the ring response function. The ring response function is particularlyuseful for comparing and understanding differences among display devices. However, this infor-mation would typically not be used to establish display requirements.
4.8 Display Chromaticity
4.8.1 Description of Display Chromaticity
Measurement of display color tint is important as it pertains to matching the color of multi-ple grayscale displays that might be used in a single workstation. In inherently color displays, thecolor tint is affected by the balance of the three primary colors forming a grayscale image. Inmonochrome displays, the color tint is either affected by the phosphor type, in the case of CRTs,or the spectrum of the backlight, in the case of AMLCDs. In LCDs, color tint is further affectedby the viewing angle. Display color matching has been found to be an important factor in PACSworkstation acceptability, and the ability to measure color has proven beneficial during accept-ance testing of new multihead display systems (Fetterly et al. 1998). To date, no significant clin-ical impacts of color mismatching have been observed.
4.8.2 Quantification of Display Chromaticity
The recommended color measurement system is the 1976 CIE (Commission Internationalede l’Eclairage), CIELUV, uniform chromaticity scale. The 1976 CIELUV system was developedto address limitations in a CIE chromaticity system that was initially published in 1931 (IEC1986, Keller 1997). The 1931 system allowed any color visible to a human observer to be spec-ified by a pair of coordinates in a two-dimensional color space. The coordinates were dubbed xand y. All visible colors occupy a horseshoe-shaped region in the x-y plane. The 1931 colorspace could be used, for example, to determine what color would result from mixing differentproportions of two colors by drawing a line between the source colors and moving proportion-ally along the line. Because of the nonlinear nature of the human visual system (HVS), equaldistances in the 1931 color space did not represent equally perceivable color changes. This wasa principal drawback addressed in the 1976 CIELUV color system. In the CIELUV system, the1931 color space was linearly warped so that equal distances anywhere in the new color spacerepresented equal perceived color differences. This modification did, however, introduce a limi-tation for color mixture analysis, such as mentioned above. The CIELUV system is based on twonew coordinates, u' and v', that can be related back to the original 1931 coordinates x and y viafractional linear transformation.
To quantify color uniformity, a colorimeter is used to measure the system coordinates u' andv' for all display devices attached to a workstation. The distance between pairs of (u',v') points islinearly proportional to the perceived color difference expressed in terms of just-noticeable-difference (JND) index. Once (u',v') are measured for each display device, a color uniformity

110
parameter is computed as the maximum distance between any possible pair of (u',v') points.Distance (D) between two points (u1',v1') and (u2',v2') is calculated using D = [(u1' – u2')2 + (v1' – v2')2 ]1/2. The distance represented by the color uniformity parameter is equivalent to thediameter of the smallest circle in the color space that can encompass all of the (u',v') points.
In this report, color uniformity is specified by the ∆(u',v') metric and not by other metrics fora number of reasons. First, ∆(u',v') is part of the ISO, VESA, and IEC standards. Secondly, itoffers a luminance-independent metric for screen uniformity. Finally, it is proven to be an effec-tive measure of color uniformity and is much less complicated than other metrics.
4.8.3 Visual Evaluation of Display Chromaticity
4.8.3.1 Assessment Method
The visual assessment of color uniformity is performed using the TG18-UN80 test pattern.The pattern is displayed on all the display devices associated with a workstation. The relativecolor uniformity of the displayed pattern across the display area of each display device andacross different display devices is then discerned.
4.8.3.2 Expected Response
No significantly perceivable color differences should be present among display devices andacross the display area of each device for primary class devices. No requirements are specifiedfor secondary class displays.
4.8.4 Quantitative Evaluation of Display Chromaticity
4.8.4.1 Assessment Method
The TG18-UNL80 test pattern is displayed on all the display devices associated with a work-station. A colorimeter is then used to measure the (u',v') color coordinates at the center and atthe four corners of the display area of each display device, and these coordinates averaged toproduce a mean (u',v') chromaticity measurement for the display device. The measurements onall display devices are used to compute the color uniformity index as the maximum distance inu'-v' space between any possible pair of average (u',v') points using D = [(u1' – u2')2 + (v1' –v2')2]1/2. If the colorimeter used outputs the color coordinate in the older (x,y) space, the valuescan be converted to (u',v') space using the following transformations:
u' = 4x / (–2x + 12y + 3), v' = 9y / (–2x + 12y + 3) ;
x = 27u' / (18u' – 48v' + 36), y = 12v' / (18u' – 48v' + 36) .
4.8.4.2 Expected Response
Based on clinical experience, a color uniformity parameter of 0.01 or less is necessary toassure acceptable color matching of primary class grayscale display devices of a workstation(Fetterly et al. 1998). The distance between any pair of color coordinates across the display area
(20)

111
of each device should also not exceed this limit. No quantitative requirements are specified forsecondary class displays.
4.8.5 Advanced Evaluation of Display Chromaticity
4.8.5.1 Assessment Method
Some display devices may demonstrate a color shift as a function of viewing angle, particu-larly for certain types of flat-panel devices. Advanced tests may be used to evaluate the chro-maticity as a function of viewing angle. This can be done with collimated or focused colorimeterprobes or CCD test devices specifically equipped to measure color over the full field of animage. For these advanced tests, color coordinates should be measured for uniform fields withlow, medium and high luminance.
4.8.5.2 Expected Response
For advanced measurements, the color uniformity parameter for primary class displaysshould not exceed 0.01 for all viewing angles within the useable viewing angle range and for allluminance values tested. No advanced requirements are specified for secondary class displays.
4.9 Miscellaneous Tests
In addition to the primary display attributes described above, there are a number of second-ary attributes that may need to be addressed in a full display performance evaluation. Briefdescriptions and assessment methods for these characteristics are outlined below.
4.9.1 CRT Displays
4.9.1.1 Artifacts
4.9.1.1.1 Description. CRT devices are prone to a number of video artifacts. Ghosting or shad-owing appears as a sort of shadow or mirror image around structures, particularly characters. Itis usually caused by an impedance mismatch, often in the video cable or in the terminationwithin the display device itself. When multiple display devices are configured into a workstation,such a mismatch can also be induced by using cables of varying lengths or inadequate shielding.Smearing is a bright to dim shadow easily seen trailing to the right from a bright area, such asthe test patches on the TG18-QC pattern. Like ghosting, the cause can be either an internal orexternal (i.e., video cable connection) impedance mismatch, or a defective cable or controllercard. Jitter and swim are two other artifacts that can appear at fixed or random locations. Theyare most visible at the edge of the display area and are due to instability in the video card syncoutput or the display itself.
Yoke ringing, or simply ringing, is the term used to describe a number of vertical white linesat the left edge of the screen. They are typically visible in the first few centimeters of a newraster line. The source of this artifact is a cross talk between the deflection yoke’s horizontal andvertical windings, inductance resulting from the fields collapsing during retrace. From the timeof the horizontal synchronization pulse until the next video line starts, there needs to be adesign-dependent damping period that permits the cross talk to be fully damped. Fixed-fre-quency displays will normally state specific timing capabilities that provide for the damping.

112
Multifrequency displays covering a broad range of horizontal timings also have a minimum timeperiod. Low cost, commercial video controllers using lower cost DACs do not always providesufficient damping periods, resulting in instabilities and horizontal jitter. This problem alsocauses an inability to center the video signal within the display area. In a system with a sufficientdamping period, there are overscans, i.e., the raster is larger than the usable display area. If theactive video drifts into this blanked area, ringing artifacts may appear, which would require areadjustment of the device. Such readjustments are often made by a service engineers.
Breathing or pulsing of the video is caused by poor or failing high-voltage regulation. Theappearance can be deceiving to the observer. The video area is actually expanding in size as thehigh-voltage is lowered during a transition from a dark screen to a bright screen. The oppositeoccurs when the transition is from a bright screen to a dark screen. Non-regulated high-voltagecircuits are more typical of commercial color displays. Medical displays should have either a reg-ulated high-voltage supply independent of the horizontal circuits, or a regulated fly-back. Inextreme cases, a high-voltage supply that cannot recover during horizontal retrace, but does onvertical retrace, will have a luminance non-uniformity with the upper left corner being thebrightest and values falling as the scan progresses to the bottom.
4.9.1.1.2 Evaluation Method. Examine the white-to-black and black-to-white signal changes inthe appropriate portions of the TG18-QC test pattern. The pattern should be examined from aviewing distance of 30 cm. The transitions should be abrupt, with little to no evidence of a slowtransition or “tail,” overshoot, shadowing, or ghosting. The pattern overall should be free of anyartifacts.
4.9.1.2 Moiré Patterns
4.9.1.2.1 Description. Color displays exhibit moiré patterns when the addressable pixel format isnot matched with the shadow mask or aperture grill dot pitch. The aliasing is a periodic patternseen as a rainbow of colors floating in the glass. Most commercial color displays have adjust-ments for both vertical and horizontal moiré. The approaches taken by the manufacturers havebeen either to adjust the phase of both axes or modify the focus values to diminish moiré.
Monochrome displays can also exhibit moiré caused by invisible artifacts in the glass thatbeat with the scan rate. In this case, selecting a slower or faster refresh rate on the video cardwill usually remove the problem.
4.9.1.2.2 Evaluation Method. Moiré patterns are most noticeable when the displayed pixel sizeapproaches the spacing or pitch of the color phosphor trio. Regular patterns of alternating on-off-on-off pixels such as checkerboards or grilles tend to enhance the visibility of moiré patterns.Alternating pixel patterns displayed at low luminance levels may exhibit increased moiré if thepixel size decreases with beam current, as is typically the case for CRTs. It is usually sufficientto use alternating pixel patterns to visually inspect for the presence of objectionable moiré andto evaluate the effectiveness of moiré cancellation circuits. Moiré cancellation methods oftenintroduce negative side effects such as defocused spots and/or jitter. It is important to determinewhether such side effects noticeably degrade the image.

113
4.9.1.3 Color Artifacts
4.9.1.3.1 Description. Color convergence in color CRTs is a factory setting performed in the align-ment procedures for the yoke and guns that must function as a matched set. Color CRTs are pur-chased by display manufacturers as pre-aligned assemblies and may not be adjustable in the field.In medical applications using color display devices to display grayscale images, color misconver-gence often appears as a colored ghost or shadow, usually around sharp edges and characters.
Poor color purity also occurs because of poor color registration, whereby a percentage of onegun is landing on another color phosphor. Degaussing circuits automatically activate when theCRT display device is powered on to demagnetize the shadow mask so as to negate any ambientmagnetic field which may otherwise disrupt the registration between the individual beams andtheir respective red, green, and blue phosphors on the screen.
Another potential cause of color errors is mismatched video amplifiers, in that the rise andfall time on one does not track with the other two. Again, ghosting of one color will be noticedon either the leading or trailing edge (or both) of characters. In addition, when one or more ofthe video amplifiers is overdriven, it may become saturated, causing a visible horizontal streak(sometimes called bleed) from the trailing edge of a displayed object or character. This condi-tion is often avoided by reducing Lmax using the contrast control.
It should be noted that color purity can be mistaken with misconvergence if it is not local-ized. Misconvergence refers to any separation between individual beams at the screen. Somedisplays provide a dynamic adjustment for convergence and are user correctable.
4.9.1.3.2 Evaluation Method. Convergence is evaluated by inspecting a crosshatch pattern con-sisting of two or more primary colors. Handheld optical devices (e.g., Klein gauge) provide aquantitative measure of the misconvergence. Advanced photometric measurements require theuse of a digital camera to locate the centroids of individual red, green, and blue spots.
Color registration errors are assessed the same as luminance uniformity on monochrome dis-plays, except individual red, green, and blue primaries are evaluated. For full-screen white, theCIE color coordinates are recorded in addition to the luminance. Color bleeding (streaking) isassessed for white and individual red, green, and blue primaries in the same way as are videoartifacts in monochrome displays.
4.9.1.4 Physical Defects
4.9.1.4.1 Description. Defects in the screen of a CRT can be categorized as either glass or phos-phor blemishes. Manufacturers screen for phosphor defects such as voids and particle contami-nation and reject the display device according to the size and position of the defect(s). On-sitephysical damage to the phosphor is rare but not impossible. Phosphor burn is still a real possi-bility in spite of the universal use of screen savers. Hours of use reading one type of image ordisplaying a menu bar will ultimately affect the phosphor.
Glass defects occur when the faceplate is formed. Very small particles in the glass mayappear as dark specks but may also disappear when the display is turned on. Occlusions arecaused by trapped gas during forming and are voids in the glass. Visually they appear likecracks because of the opposing surfaces reflecting light.
4.9.1.4.2 Evaluation Method. Display artifacts can be evaluated using a uniform test pattern,TG18-UN80. The pattern should appear uniform without any of the defects described above.

114
4.9.1.5 Flicker
4.9.1.5.1 Description. While not an artifact per se, flicker is one of the more distracting and dis-turbing characteristics of a soft-copy display. Flicker is a description of the human perception ofthe vertical refresh as well as the interference of the refresh rate with other periodic sources ofillumination. We see flicker more at high luminance levels and lower refresh rates under 65 Hz.Peripheral vision is also more sensitive to flicker.
Interference from fluorescent lights is the most common cause of the perception of flicker. Atrefresh rates above 72 Hz most people will not be significantly bothered, and at rates over 80 Hzvery few people will perceive any flicker. CRT displays operating at or near 60-Hz refresh ratesshould be avoided. LCD displays typically exhibit no flicker even at refresh rates as low as 20 Hz.
Phosphor decay is the performance characteristic that causes flicker. The proper matching ofrefresh rates and phosphor will minimize flicker. The two dominant medical phosphors, P104and P45, at or above a 72-Hz refresh rate will satisfy a majority of the general population.
4.9.1.5.2 Evaluation Method. The presence of flicker can be visually ascertained using theTG18-UN80 test pattern at a viewing distance of 30 cm. The flicker should be evaluated for bothfoveal and peripheral visions. For quantitative assessment of flicker, VESA standards can beconsulted (VESA 2001).
4.9.2 Liquid Crystal Displays
The image quality of flat-panel LCDs is affected by the specific way these devices generatethe image for the viewer. The significant differences with respect to the CRT merit a separatediscussion introducing the factors that have to be considered when assessing the performance ofa LCD, and the artifacts that can be found in displaying medical images. In this section, wedescribe two factors that affect the image quality of flat-panel displays in displaying staticimages, electronic cross talk, and pixel defects. Other aspects that are not covered here are angu-lar variations in the luminance (covered in section 4.4), temperature effect (particularly impor-tant in LCDs), and mura patterns (visible non-uniformity due to imperfections in the displaypixel matrix surface).
4.9.2.1 Electronic Cross Talk
4.9.2.1.1 Description. Of particular importance to high-resolution display devices with largenumbers of gray levels is the scene-dependent, undesired artifact caused by cross talk in theactive matrix array circuitry. Cross talk is primarily an electronic term designating unwantedcoupling between adjacent or nearby circuits. In AMLCDs, cross talk is associated with themodification of the intended voltage across the LC cell that results in an undesired alteration ofthe pixel luminance. The artifact is caused by incomplete pixel charging, by currents through thethin-film transistor, and by displacement currents determined by parasitic capacitive coupling.Display cross talk is more important for large-sized panels having higher resolution andgrayscales (Libsch and Lien 1998). Although having different origins, cross-talk artifacts havealso been studied for passive-matrix polymer light-emitting displays. Even for medium-resolu-tion display devices, cross talk can affect the level of a centrally located small target by as muchas 1% (Badano and Flynn 2000).

115
Careful material selection, improved driving schema, precision in the fabrication process,and device design optimization have been used to reduce cross-talk artifacts. The use of low-capacitance design and the selection of higher-conductivity metals, such as copper, for the scanlines reduce occurrences of incomplete pixel charging. In addition, integrating a black matrixacting as a light shield for the a-Si:H TFT reduces photo-generated leakage currents.
Measurements of cross talk involve the use of bar patterns where a small target within thebar is at a different luminance level than the rest of the bar. Patterns with horizontal and verti-cal bars are useful since cross talk can be present along both directions, depending on the dis-play device architecture. The variations of target gray level when the background level changescan be recorded with a luminance meter. An advanced test should use a luminance meter thatrecords target luminance without contamination from the background gray level, as described insection 3.1.1.1 (Badano and Flynn 2000, Wright et al. 1999, VESA 2001).
As a visual test, the cross talk element of the TG18-QC test pattern may be used. Whenexamined with the surround regions masked from view, the central low contrast vertical targetof the element should exhibit constant contrast along its length. Significant variations are indica-tive of objectionable cross talk in the horizontal direction. The pattern should also be examinedwith 90° rotation for evaluating the presence of cross talk in the vertical direction.
4.9.2.2 Pixel Defects
4.9.2.2.1 Description. Defective pixels are pixels that operate improperly when addressed with aproper signal. Pixel defects can be classified as stuck pixel (never change state), intermittentpixel (change state independently of addressing signal), and defective pixel (state does not cor-respond with addressing signal). Off pixels are pixels that remain black for all signals, while par-tial pixels are pixels that have defective subpixels. Most frequently for LCDs with subpixels, thepixels are only partially defective.
4.9.2.2.2 Evaluation Methods. The number of pixel defects in a matrix-addressed displayshould be assessed visually on a frequent basis and compared with a given tolerance. Theyshould also be characterized in terms of proximity or clustering in the display area. Quantitativemethods have been proposed both in ISO standards (ISO 13406-2) and in the Flat Panel DisplayMeasurements Standard (VESA 2001) for such measurements.
4.10 Overall Evaluations
In addition to the testing a display device for a specific performance characteristic, the over-all quality of a system can be assessed using a comprehensive visual/quantitative approach.Overall assessment can be based on any of the TG18-recommended multipurpose test patterns.Each pattern should be displayed with one display pixel representing each image pixel and exam-ined from a viewing distance of 30 cm. The findings can be correlated with the results of morefocused testing methods specified above and serve as a basis for quality control assessments. Thefrequency of such an evaluation is discussed in section 6.
4.10.1 Evaluations Using TG18-QC Pattern
The appearance of the elements in the TG18-QC test pattern can be used to assess the over-all performance of display systems. The following are recommended:

116
1. General image quality and artifacts: Evaluate the overall appearance of the pattern. Noteany non-uniformities or artifacts, especially at black-to-white and white-to-black transi-tions. Verify that the ramp bars appear continuous without any contour lines.
2. Geometric distortion: Verify that the borders and lines of the pattern are visible andstraight and that the pattern appears to be centered in the active area of the displaydevice. If desired, measure any distortions (see section 4.1.3.2).
3. Luminance, reflection, noise, and glare: Verify that all 16 luminance patches are dis-tinctly visible. Measure their luminance using a luminance meter, if desired, and evalu-ate the results in comparison to GSDF (section 4.3.3.2). Verify that the 5% and 95%patches are visible. Evaluate the appearance of low-contrast letters and the targets at thecorners of all luminance patches with and without ambient lighting.
4. Resolution: Evaluate the Cx patterns at the center and corners of the pattern and gradethem compared to the reference score (see section 4.5.3.1). Also verify the visibility ofthe line-pair patterns at the Nyquist frequency at the center and corners of the pattern,and if desired, measure the luminance difference between the vertical and horizontalhigh-modulation patterns (see section 4.5.3.1).
4.10.2 Evaluations Using TG18-BR Pattern
In using the TG18-BR pattern the viewer assesses the checkerboard patterns to discern thesmallest checkerboard that can be distinguished in each panel of a quadrant. Quadrants are readclockwise from upper left to lower left. Within each quadrant, the panels are also read clockwise.A magnifier can be used for reading the smallest checkerboards. Refer to section 3.2.1.4 for spe-cific details on checker/checkerboard sizes and scoring.
A display with sufficient bandwidth and proper setup will have a balanced response from thedarkest to the brightest panel with equal perception of the checkerboards. On primary class dis-play systems, the B-60 checkerboard should be easily observed in all panels and quadrants.Displays with balanced response characteristics can be read up to B-90 in the third and fourthquadrants, B-80 in the second quadrant, and B-60 in the first quadrant. Performance above thislevel is exceptional. This level of performance is indicative of a high-quality 1600 × 1200, 21 in.,monochrome CRT.
4.10.3 Evaluations Using TG18-PQC Pattern
While this report is intended for the assessment of electronic display devices, the images dis-played on such devices are often printed on transparent film for interpretation on an illuminator.The TG18-PQC is a multipurpose test pattern primarily designed to insure that the appearanceof printed images is similar to that of electronic display devices. Using the central column of thepattern, the film optical density of the 18 marked regions should be recorded. Secondly, theaverage luminance of the illuminator used for viewing films should be measured. The luminanceof the 18 regions should then be computed from the optical density and illuminator luminancemeasurements. These luminance values should be evaluated to establish that the print device isproperly set up to yield a luminance response consistent with the grayscale display standard. Asdescribed in section 4.3.4.2.2, this is best done by evaluating the contrast response.
Modern film printers that are properly maintained will generally not exhibit problems withresolution, distortion, or noise. A quick visual test of resolution can be done using the bar pat-terns at the top and bottom of the TG18-PQC test pattern. For this, the size of the test pattern

117
should be matched to the size of the print matrix for the printer being used so that there is a one-to-one correspondence between image pixels and printer pixels. At each luminance step, a set oflow contrast bars of varying size and contrast can be examined to determine whether the printshave aberrant noise. Finally, the ramp pattern at the right and left of the TG18-PQC patternshould be examined to determine whether any contrast artifacts are present.
4.10.4 Evaluations Using TG18-LP Patterns
The TG18-LP test patterns can be used to visually establish whether the resolution of a dis-play device is acceptable. The low-luminance test pattern should be displayed first for both thehorizontal and vertical bar patterns. Using a consistent viewing condition, the patterns should beexamined to establish that the pattern of one line pair for every two pixels can be seen in allregions of the display. Any region where the pattern is not visible is indicative of a device withaberrant resolution at that position. Since high-performance devices have very small pixels, alarge field of view magnifying glass in convenient for evaluating this test pattern.
If the performance at low brightness is satisfactory, the performance should be similarlyevaluated with the mid- and the high-luminance horizontal and vertical test patterns. Again, anyindication that the line-pair pattern is not visible in all regions is an indication of improper res-olution performance.
4.10.5 Evaluations Using Anatomical Images
A radiologist should evaluate the overall clinical image quality of the display using patientimages. The TG18 report suggests four specific anatomical images for this purpose: TG18-CH,TG18-KN, TG18-MM1, and TG18-MM2. These correspond to a chest radiograph, a knee radi-ograph, and two digital mammograms. Clinical criteria for evaluating these images are given inTable 6. The images may be scored according to these criteria corresponding to the differentimage features. The radiologist who wishes to evaluate his/her display should independently ratethe image features according to the criteria in Table 6, and then compare their ratings to thoseobtained with a high-quality transilluminated film print of the patterns. Significant discrepanciesneed to be brought to the attention of the responsible medical physicist or service engineer.

118
Table 6. Criteria for evaluating the TG18 anatomical images.
Test Pattern Evaluation Criteria
TG18-CH Degree of difficulty for examOverall contrastOverall sharpnessSymmetrical reproduction of the thorax, as shown by the central position of a spinous
process between the medial ends of the claviclesMedial border of the scapulae Reproduction of the whole rib cage above the diaphragmVisually sharp reproduction of the vascular pattern of the lungs, particularly the peripheral
vesselsSharp reproduction of the trachea and proximal bronchiSharp reproduction of the borders of the heart and the aortaSharp reproduction of the diaphragmVisibility of the retrocardiac lung and the mediastinumVisibility of the subdiaphragmatic featuresVisibility of the spine through the heart shadowVisibility of small details in the whole lung, including the retrocardiac areasVisibility of linear and reticular details out to the lung periphery
TG18-KN Degree of difficulty for examOverall contrastOverall sharpnessReproduction of trabecular detailReproduction of bony and soft tissue
TG18-MM1 Degree of difficulty for examand Overall contrast and brightness
TG18-MM2 Overall sharpness (no blur)Sharp appearance of Cooper’s ligamentsStructure of the clip and the presence of the gap at its apex (TG18-MM1 only)Appearance and visibility of subtle microcalcifications (TG18-MM1 only)Visibility of structures at the margins of the breast (TG18-MM1 only)

119
5 ACCEPTANCE TESTING OF A DISPLAY SYSTEM
Previous sections described the methods for assessing the performance of a display system.In this section, we specifically outline the recommended tests to be performed as a part of anacceptance testing procedure with references back to detailed tests and equipment in sections 3and 4.
5.1 Prerequisites for Acceptance Testing
As in any acceptance testing initiative, the display acceptance testing is justified and mean-ingful only if it is directly linked to the contract between the user and the vendor, commonly inthe form of a Request for Proposal (RFP) or Request for Quotation (RFQ). In the contract, theuser must specifically delineate the engineering specification for the display device, acceptancetesting procedures, definitive acceptance criteria, and the actions to be taken should noncom-pliance be identified. Other prerequisites for acceptance testing of a display device aredescribed below.
5.1.1 Personnel
The acceptance testing of a display system must be performed by an individual(s) havingappropriate technical and clinical competencies. Even though the vendor is expected to performsome testing before turning a display system over to the user, the user must independently testthe system(s). Medical physicists trained in display performance assessments should perform thetests. Other staff including biomedical engineers, in-house service electronic technicians, ortrained x-ray technologists can perform most of the tests described herein; however, the medicalphysicist should accept oversight responsibilities, both for the training of support staff and forfinal approval of the results.
5.1.2 Preliminary Communications
Preliminary communication with the vendor is essential for understanding how the system isintended to be operated and how the test patterns of interest can be loaded on the system. Somesystems come with dedicated QC utilities. The details and usage of these utilities must be fullydocumented and understood beforehand. Any recommended service and/or calibration sched-ule, including the services provided, tests performed, and the service/calibration intervals, mustbe obtained from the manufacturer, ideally as part of the purchasing process.
5.1.3 Component Inventory
Prior to acceptance testing, the characteristics of the display systems delivered should be ver-ified against those specified in the purchase agreement. A database should be established whichincludes information such as display type, size, resolution, manufacturer, model, serial number,manufacture date, room number, display ID (if applicable), associated display hardware (e.g.,display controller), and test patterns available on the systems.

120
5.1.4 Initial Steps
The following procedures are recommended prior to acceptance testing of the display device:
1. Review all delivered documentation from the vendor. Especially note the quality testingresults performed in the factory.
2. Verify the availability of desired tools (see sections 3.4.1 and 5.2 and Table 7).3. Check display placement (see section 3.4.2).4. Follow the start-up procedures (see section 3.4.3).5. Document the ambient lighting level (see section 3.4.4).6. Calibrate/verify the Lmax and Lmin , and brightness and contrast settings (see section 3.4.5).7. If applicable, verify/perform a DICOM luminance calibration (see section 3.4.6).
5.2 Tests and Criteria
Table 7 provides a list of the tests to be performed at acceptance testing, the required tools,and the expected performance. In addition to the tests specified in Table 7, other miscellaneoustests as described in section 4.9 and some of the overall assessment tests as specified in section4.10 can be used to establish baseline performance for future quality control tests. Depending onthe interest and resources, additional advanced tests are further encouraged as a part of accept-ance testing. The use of worksheets and checklists will help in recording the results and per-forming the desired calculations. Note that all the visual tests should be performed from aviewing distance in the range of 30 cm unless otherwise noted in the testing procedures.

121
Table 7. Tests, tools, and acceptance criteria for acceptance testing of electronic display systems.
Acceptance CriteriaSuggested Action
Test Major Required Tools Procedure (for two classes(if unacceptable)
of displays)
Equipment Patterns Primary Secondary
Geometric Flexible ruler or TG18-QC See Deviation Deviation Readjustment, distortions transparent section 4.1.4 ≤ 2% ≤ 5% repair or
template replacement forrepeated failures
Reflectiona Measuring ruler, TG18-AD See sections Lmin ≥ 1.5 Lamb Lmin ≥ 1.5 Lamb Results are used to light sources, 4.2.3 and (ideally (ideally adjust the level of luminance and 4.2.4 ≥ 4 Lamb) ≥ 4 Lamb) ambient lightingilluminance meters, illuminator
Luminance Luminance and TG18-LN See sections L'max ≥ 170 L'max ≥ 100 Readjustment, response illuminance meters TG18-CT 4.3.4 and cd/m2 cd/m2 recalibration, repair
TG18-MP 4.3.3 LR' ≥ 250 LR' ≥ 100 or replacement for ∆L'max ≤ 10% ∆Lmax ≤ 10% repeated failureskδ ≤ 10% kδ ≤ 20%
Luminance luminance-meter, TG18-UNL See sections Non-unif. Non-unif. Readjustment, dependencies Luminance TG18-LN 4.4.3 and ≤30% ≤30% repair or
angular response TG18-CT 4.4.4 LR'δ ,θ ≥ 175 LR'δ ,θ ≥ 70 replacement for measurement tool kδ ,θ ≤ 30% kδ ,θ ≤ 60% repeated failures;
Angular results used to defineacceptable viewingangle cone
Resolutionb luminance-meter TG18-QC See sections 0 ≤ Cx ≤ 4 0 ≤ Cx ≤ 6 Focus adjustment, Magnifier TG18-CX 4.5.3 and ∆L ≤ 30% ∆L ≤ 50% repair or
TG18-PX 4.5.4.1.2 RAR=0.9–1.1 replacement for AR ≤ 1.5 repeated failures
Noiseb None TG18-AFC See section All targets Two largest Reverification of 4.6.3 visible except sizes visible Luminance
the smallest response, otherwisereplacement
Veiling glare Baffled funnel, TG18-GV See sections ≥ 3 targets ≥ 1 target Reverification of telescopic TG18-GVN 4.7.3 and visible, visible, Luminance photometer TG18-GQs 4.7.4 GR ≥ 400 GR ≥ 150 response, otherwise
replacement
Chromaticity Colorimeter TG18- See section ∆(u',v') None ReplacementUNL80 4.8.4 ≤ 0.01
a In the absence of illumination devices, this acceptance testing can be performed only visually, using TG18-AD and themethod described in section 4.2.3.1.
b More objective resolution and noise measurements can be performed as described in sections 4.5.4 and 4.6.4, using a digitalcamera.

122
6 QUALITY CONTROL OF A DISPLAY SYSTEM
Previous sections described in detail the methods for assessing the performance of a displaysystem. In this section, we specifically outline the recommended tests to be performed as a partof a QC program with references back to sections 3 and 4 for detailed description of the testsand equipment.
6.1 Prerequisites for Quality Control
The performance of electronic display systems needs to be tested on a periodic basis as out-lined below. There is some flexibility is the required periodicity of the QC tests, as hardware fea-tures and reproducible performance can reduce the need for very frequent testing. It isrecommended that initial testing be done more frequently and an assessment made on theresults. If stability is maintained, a determination can be made to decrease the frequency of test-ing, based on validated results. Additionally, some manufacturers offer automated software toolsthat facilitate the QC tests. These software tools are acceptable for use, as long as they are vali-dated against standard methods described in this report.
6.1.1 Personnel
The QC procedures must be performed by individuals with appropriate technical and clin-ical competencies. The daily QC of a display system should be performed by the operator/userof the system. Radiology staff using electronic displays should be familiar with the daily testingprocedure and expected results. For less frequent tests, designation of responsible personnelwill ensure that these individuals develop and maintain familiarity with the tests, reducing vari-ability in the QC data and in the interpretation of the results. These individuals should be underthe supervision of a medical physicist. The annual QC evaluation should be performed by aqualified medical physicist or by a QC technologist working under the close supervision of aqualified medical physicist. All personnel responsible for performing QC tests will require ini-tial training specific to their level of responsibility, and periodic retraining and mentoring bymedical physics staff.
6.1.2 Availability of Prior Evaluations
The initial acceptance testing data are used to establish and maintain expected performance.Data acquired during routine QC testing must be compared to the limits established around thebaseline values. It is also essential to utilize the same pattern for repeat evaluations of a given dis-play device. The use of worksheets and checklists will help in establishing and monitoring thebaselines. It is strongly recommended to record and maintain this information in electronic data-bases. Most commercial calibration packages support automated recording, tracking, and analysis.
6.1.3 Initial Steps
The following procedure should be followed before performing any QC tests except fordaily QC.
1. Review the results of previous QC tests.2. Verify the availability of desired tools (see sections 3.4.1 and 6.2 and Table 8).

123
3. Check display placement (see section 3.4.2).4. Follow the start-up procedures (see section 3.4.3).5. Document the ambient lighting level (see section 3.4.4).6. Calibrate/verify the Lmax and Lmin , and brightness and contrast settings (see section 3.4.5).7. If applicable, verify/perform a DICOM GSDF luminance calibration (see section 3.4.6).
6.2 Tests and Criteria
Table 8a–c provides an outline of the tests to be performed as a part of a routine QC pro-gram, the required tools, and the expected performance. In addition to the stated tests, otheroverall assessment tests as specified in section 4.10 can be used as a part of a routine QC pro-gram. Note that all the visual tests should be performed from a viewing distance in the range of30 cm unless otherwise noted in the testing procedures.
Table 8a. Tests for daily QC of electronic display system, performed by the display user.
Acceptance CriteriaSuggested Action
Test Major Required Tools Procedure (for two classes(if unacceptable)
of displays)
Equipment Patterns Primary Secondary
Overall None TG18-QC See sections See sections See sections Further/closer visual or anat. 4.10.1 or 4.10.1/ 4.10.1/ evaluationassessment images 4.10.6 4.10.6 4.10.6
Table 8b. Tests for monthly/quarterly QC of electronic display systems performed by a medical physicist, or by a QC technologist under the supervision of a medical physicist.
Acceptance CriteriaSuggested Action
Test Major Required Tools Procedure (for two classes(if unacceptable)
of displays)
Equipment Patterns Primary Secondary
Geometric None TG18-QC See section See section See section Further/closer distortions 4.1.3.1 4.1.3.2 4.1.3.2 evaluation
Reflection Luminance and TG18-AD See sections Lmin ≥ 1.5 Lamb Lmin ≥ 1.5 Lamb Readjust the level illuminance 4.2.3 and (ideally (ideally of ambient lightingmeters 4.2.4 ≥ 4 Lamb) ≥ 4 Lamb)
Luminance Luminance and TG18-LN See sections L'max ≥ 170 L'max ≥ 100 Readjustment, response illuminance TG18-CT 4.3.4 and cd/m2 cd/m2 recalibration,
meters TG18-MP 4.3.3 LR' ≥ 250 LR' ≥ 100 repair, or ∆L'max ≤ 10% ∆L'max ≤ 10% replacement for kδ ≤ 10% kδ ≤ 20% repeated failures
Luminance Luminance TG18-UN See sections Non-unif. Non-unif. Readjustment, dependencies meter TG18-UNL 4.4.3 and ≤ 30% ≤ 30% repair, or
4.4.4 replacement forrepeated failures
Resolution Magnifier TG18-QC See sections 0 ≤ Cx ≤ 4 0 ≤ Cx ≤ 6 Focus adjustment, TG18-CX 4.5.3 repair, or
replacement forrepeated failures

124
Table 8c. Tests for annual quality control of electronic display systems performed by a medical physicist.
Acceptance CriteriaSuggested Action
Test Major Required Tools Procedure (for two classes(if unacceptable)
of displays)
Equipment Patterns Primary Secondary
Geometric Flexible ruler TG18-QC See section Deviation Deviation Readjustment, distortions 4.1.4 ≤ 2% ≤ 5% repair, or
replacement forrepeated failures
Reflection Luminance and TG18-AD See sections Lmin ≥ 1.5 Lamb Lmin ≥ 1.5 Lamb Readjust the level illuminance 4.2.3 and (ideally (ideally of ambient lightingmeters 4.2.4 ≥ 4 Lamb) ≥ 4 Lamb)
Luminance Luminance and TG18-LN See sections L'max ≥ 170 L'max ≥ 100 Readjustment, response illuminance TG18-CT 4.3.4 and cd/m2 cd/m2 recalibration,
meters TG18-MP 4.3.3 LR' ≥ 250 LR' ≥ 100 repair, or ∆Lmax ≤ 10% ∆Lmax ≤ 10% replacement for kδ ≤ 10% kδ ≤ 20% repeated failures
Luminance Luminance TG18-UNL See section Non-unif. Non-unif. Readjustment, dependencies meter 4.4.4 ≤ 30% ≤ 30% repair, or
replacement forrepeated failures
Resolutiona Luminance TG18-QC See sections 0 ≤ Cx ≤ 4 0 ≤ Cx ≤ 6 Focus adjustment, meter, magnifier TG18-CX 4.5.3 and ∆L ≤ 30% ∆L ≤ 50% repair, or
TG18-PX 4.5.4.1.2 RAR=0.9-1.1 replacement for AR ≤ 1.5 repeated failures
Noise None TG18-AFC See section All targets Two largest Reverification 4.6.3 visible except sizes visible of luminance
the smallest response, otherwise replacement
Veiling Baffled funnel, TG18-GV See sections ≥3 targets ≥1 target Reverification glare telescopic TG18-GVN 4.7.3 and visible, visible, of luminance
photometer TG18-GQs 4.7.4 GR ≥ 400 GR ≥ 150 response, otherwise replacement
Chromaticity Colorimeter TG18- See section ∆(u',v') None ReplacementUNL80 4.8.4 ≤ 0.01
aMore objective resolution measurements can be performed as described in section 4.5.4, using a digital camera.

125
APPENDIX I. EVALUATION OF “CLOSED” DISPLAY SYSTEMS
This report focuses primarily on “open” systems. An open system is one that allows user-introduced digital test patterns to be retrieved from a PACS or local archive and displayed for thepurposes of monitor evaluation and calibration. These monitors are primarily used for display ofdiagnostic images residing in a PACS.
In diagnostic imaging today, the some clinical display systems are not open systems. Thosemay include display devices dedicated to one system intended to display only images obtainedon that system (e.g., a fluoroscopy system or a CT scanner). Typically, the only controls avail-able to the operator of such systems are contrast and brightness. There may be no way to cali-brate the grayscale display function, no way to display a TG18 test pattern, and no tools presentfor image manipulation. The manufacturers of these systems may provide test patterns of theirown design, but in most cases these are inadequate to meet the display assessment requirementsof this report. These systems are referred to as closed systems.
Because the capabilities of closed systems vary considerably among manufacturers, recom-mendations for QC on closed systems cannot be uniformly established. This appendix estab-lishes general QC methodology, which should be adapted wherever feasible. Manufacturers arestrongly encouraged to migrate toward open systems for all of their displays in order to facilitateclear specification and fair evaluation in a standardized environment. This will include the devel-opment of systems that allow the introduction of user-defined DICOM-compliant images into thelocal image database. This is most easily accomplished with systems that are capable of per-forming DICOM Query/Retrieve from any DICOM-compliant PACS.
I.1 General Considerations
I.1.1 Preliminary Communications
Prior to purchase, it is important to include specifications of the size of the active area, theresolution or number of scan lines, color/spectral luminance, monochrome vs. color display,dynamic range, and magnetic shielding. These requirements will vary depending upon theintended use of the system, such as fluoroscopy, CT, US, MRI, digital spot imaging, etc. A serv-ice and/or calibration schedule including the services to be provided, tests to be performed, andthe service/calibration intervals will need to be agreed upon prior to purchase.
I.1.2 Component Inventory
At acceptance testing, verify the characteristics of the monitors delivered against those spec-ified in the purchase agreement. Keep a log of the monitors and display devices in use. Recordinformation such as monitor type, size, resolution, manufacturer, model, serial number, manu-facture date, room number, monitor ID (if applicable), type of test pattern used, etc. It may notbe possible to use the same test pattern source for all monitors in the department. However, it isessential to utilize the same pattern for repeat evaluations of a given monitor.

126
I.2 Preparation for Evaluation
I.2.1 Instrumentation Needed
A variety of special tools are needed for acceptance and QC testing of monitors. The fol-lowing instrumentation is recommended:
1. Digital test pattern images from the system, or from digital distribution media. Short ofavailability of TG18 test patterns, SMPTE or other multipurpose test patterns stored onthe imaging system may be used. The same pattern(s) should be utilized whenever a testis initiated. In the absence of any suitable test pattern on the system, a video test-patterngenerator (equipped with TG18-QC, SMPTE, or other multipurpose test patterns) willneed to be utilized. The video signal from the pattern generator should have the samepeak voltage, refresh rate, and line rate as that from the image source.
2. Calibrated luminance-meter (see section 3.1.1.1).3. Calibrated illuminance meter (see section 3.1.1.2).4. Calibrated colorimeter (see section 3.1.1.3).5. Glass-cleaning solution and lint-free cloth or paper.6. Flexible ruler or small tape measure.7. Screwdriver (for accessing rear panel).8. Mask (for accurate positioning of instruments), if desired. If a mask is used, it must be
used in every subsequent evaluation of the display device.
I.2.2 Initial Steps
Follow the initial steps as outlined in section 5.1.4, keeping in mind that DICOM calibrationmay not be applicable to many closed systems.
I.2.2.1 Special Considerations for Operator Console Displays
Console display devices are used in one of two ways: without and with operator adjustmentof brightness and contrast settings. The QC procedures for these devices vary, depending uponwhich of these operations is used.
As an example of the first kind, many CT departments utilize preprogrammed brightness andcontrast settings for hard-copy production. This is possible because the CT number associatedwith a particular type of tissue varies insignificantly assuming correct CT calibration and the useof consistent kV. The operator makes no adjustments to the image density or contrast. In thiscase, the QC program should guarantee that, for a given data set with window width (WW) andlevel (WL) set in a prescribed manner, the contrast and brightness of the hard-copy image areconstant from copy to copy over time. If multiple CT devices are in use, the same dataset fromany scanner, having WW and WL set in the prescribed manner, should also result in the samehard-copy image density and contrast from scanner to scanner. The appearance of the CT imageon the control console monitor has no bearing on the contrast and density of the final hard-copyimage. This is an example of a system operated without adjustment of the image by the operator.Calibration of these monitors may be performed without reference to the corresponding hard-copy image. For such systems, the maximum and minimum luminance values are adjustedaccording to the guidelines provided in section 4.2 or to the manufacturer’s recommendations.A test pattern (SMPTE or preferably TG18-QC) containing luminance patches that are larger

127
than the luminance meter’s detector head (electronic magnification may be used, if necessary)may be used for this purpose.
Other modalities do not lend themselves to the use of prescribed WW and WL settings. Forexample, in MRI the signal strength associated with a glioma may not be reproducible from scanto scan even on the same patient. In order to properly record the pathology of interest, operatoradjustment of WW and WL is essential. These adjustments are made by viewing the data set ata video monitor with the expectation that the resulting hard copy will match the image on themonitor. Therefore, it is essential that the contrast and brightness settings on the monitor beadjusted such that the contrast transfer function (CTF) of the monitor closely approximates thatof the printer. For such systems, the brightness and contrast settings should be adjusted to matchthe appearance of images on the operator consoles and hard-copy prints. This is a challengingtask, as equivalent appearance depends on factors such as the ambient light level at the consoleand the response of the operator’s visual system, which will vary among individuals. Initially,the calibration of the hard-copy printer should be verified. The adjustment of the console is bestperformed by setting up the display with several operators present. Generate a print of a test pat-tern (SMPTE or preferably TG18-QC). With the test pattern displayed on the monitor, adjust thebrightness and contrast settings on the monitor to match the hard copy as closely as possible.When all observers agree that the monitor accurately reflects (or resembles as closely as possi-ble) the contrast seen in the hard-copy image, the monitor is considered calibrated. Measure theluminance levels of the maximum, minimum, and two or three intermediary brightness patchesof the displayed test pattern, and record these for future reference.
I.3 Display Evaluation Procedures
Ideally, as many as possible of the tests outlined in sections 5 and 6 should be performed on“closed” systems. Displays used for diagnosis of medical images (exam room monitors) shouldconform to primary specifications. Operator’s console displays should conform to secondaryspecifications (see Tables 7 and 8). As a minimum, the display visual evaluation procedures con-tained in section 4.10.1 or 4.10.2 should be followed using the TG18-QC or SMPTE test pat-terns. The test pattern from a video test pattern generator can be simultaneously displayed ontwo or more monitors by attaching an RG59U video cable from the output of the first monitor tothe input of the second (daisy-chain). Check to ensure that both monitors are properly termi-nated (75 Ω total impedance) and that the test-pattern generator is set to the appropriate peakvoltage, refresh rate, and line rate.
The QC procedure should be repeated on a monthly basis for the first quarter of operationand then quarterly thereafter, if the system is proved to be stable enough over time. The testsshould also be repeated after any change to the monitor’s brightness and contrast settings tomaintain constancy. The image appearance should also be compared to that of the hard copy ona quarterly or annual basis. Furthermore, for display systems with more than one display moni-tor, the performance of various monitors should be benchmarked with respect to each other.

128
APPENDIX II. EQUIVALENT APPEARANCE IN MONOCHROME IMAGE DISPLAY
Throughout a single institution, the same image data is often presented on multiple displaydevices. These devices may be laser-printed films, diagnostic workstation monitors, or referringphysician workstation monitors. This appendix considers how equivalent appearance of the sameimage can be achieved on different displays.
Section 4.3 describes two requirements for obtaining equivalent image appearance on multi-ple display devices. The first requirement is that the devices be calibrated using the same lumi-nance response standard. The DICOM Grayscale Display Function (GSDF), specified in DICOM3.14 (NEMA 2000), is the model selected for the standardized luminance response. The GSDFprovides a well-defined rendering aim so that acquisition modalities can produce image codevalues with the expectation that the intrinsic response of display workstations and laser-filmprinters has been calibrated to render image code values to the standard. The second require-ment is that the devices have the same luminance ratio, L'max/L'min . When viewing an image, thehuman visual system adapts to contrast within a limited range of luminance. After adaptation tothe overall brightness of an image, the visual system has reduced contrast in brighter and darkerregions (see Figure 43, section 4.3). An image viewed on a device with a large luminance ratio(i.e., a film with an optical density range of 0.15 to 3.0 and LR = 708) will have poor contrastin bright and dark regions when compared with the same image display on a device with a smallluminance ratio (e.g., a secondary class display with LR = 100). Thus, equivalent appearancerequires that images be displayed on GSDF-calibrated devices with the same luminance ratio.
It is notable that equivalent appearance can be achieved with devices having different L'max.While visual perception has poor sensitivity in dark regions, the GSDF increases the contrastbetween display controller input states, p-values, at low luminance levels. The value of a brightdisplay device is that L'min is large for the same luminance ratio, and therefore higher values ofLamb can be tolerated. Bright displays can thus be used in clinical locations where it is impracti-cal to reduce ambient light levels.
Most modern film printers and primary class display devices can be calibrated to theDICOM GSDF. Secondary class display devices can usually be set up to approximate the GSDF.Significant differences in appearance are thus often due to differences in luminance ratio. Thisis particularly true in medical centers for which imaging systems were originally set up with theexpectation that interpretations would be made on printed films. In these circumstances, appli-cation grayscale transformations and presentation window and level values are often set up forfilms printed with high maximum film density (i.e., 2.80 to 3.10), and image values of interestare set to appear in a well visualized range of film densities (i.e., 0.10 to 2.10). For radiographicimages, image values printed at higher film densities are then viewed with high brightness spotilluminators. Electronic display devices typically have a lower L’max than film, and ambientlighting restricts the luminance ratio to about 250. This luminance ratio provides good contrastvisualization over the full range of image values. However, an image with an applicationgrayscale transformation and presentation window and level intended for film viewing willappear significantly different when viewed on an electronic display with a lower luminance ratio.
When an image needs to be presented on a display with a different luminance ratio, anadjustment in window and level can provide equivalent contrast appearance. The adjustmentrequires knowledge of the intended L'max and L'max /L'min and the alternative L'max and L'max /L'min . Foran alternative luminance ratio that is less than an intended luminance ratio, a reduced p-value

129
range for presentation of the image is computed by considering the DICOM calibration curve ofthe intended device and the calibration curve for the alternative device. As illustrated in FigureII.1, the ratio of the JND indices associated with the alternative L'max /L'min to JND indices asso-ciated with the intended L'max /L'min (i.e., the ratio of A to B in Figure II.1) is used to narrow thewindow width. The window level is otherwise set to place the upper level at the maximum p-value. Similar methods are applied when the alternative luminance range is larger than theintended and the window width needs to be adjusted to a larger value. In either case, knowledgeof the intended and alternative L'max is required only to properly compute the JNDs associatedwith both devices (i.e., the length of the lines labeled “A” and “B” in Figure II.1). This can bedone using the polynomial expressions or tables published in DICOM 3.14.
Ideally, the intended Lmax and Lmax /Lmin should be included in an appropriate data element ofthe image object. When a remote display device displays this image, the window width and levelmay be automatically adjusted to account for differences in Lmax /Lmin relative to the intendedvalue stored in the image object. If the luminance range of the alternative device is the same asthe intended device, the full range of p-values is displayed even if the Lmax of the alternativedevice is different. If the luminance range is different, then a change in the range of displayed p-values is required. It should be noted that there is no standard method for communicating theintended Lmax and Lmax /Lmin for an image. However, this is presently being considered as an addi-tion to the DICOM standards for image presentation. In the absence of an automated implemen-tation, present window and level settings for different image object types can be used to makethe needed adjustment.
Figure II.1. The window width and level of an alternative display is adjusted to reflect thereduced range of JND indices associated with a reduced luminance range. This is illustrated bycomparing the length A to the length B. The upper display level remains the same but the lowerdisplay level is increased.

130
Factors other than contrast may cause the appearance of images displayed on various devicesto be different. The size of the presented images will affect the perceived spatial frequency ofimage features in cycles per millimeter. Since the human visual contrast sensitivity is stronglydependant on perceived spatial frequency, a difference in the size of presented images will causea difference in contrast perception. Resolution, noise, and ambient reflection may otherwisecause a difference in appearance not related to image contrast.

131
APPENDIX III. DESCRIPTION OF TG18 TEST PATTERNS
Medical physicists, investigators, vendors, or other users can utilize the authentic copyrightedTG18 patterns supplied in conjunction with this report for any professional, investigational, edu-cational, or commercial purposes. However, the patterns may not be altered in any form or fash-ion, and their labels may not be removed. Alternatively, with the aid of the descriptions providedin section 3 and appendix III and with the exception of anatomical test patterns, the users maygenerate patterns similar to the TG18 patterns. To do so, four requirements should be observed:
1. The original reference should be acknowledged.2. The generated pattern may not duplicate the original TG18 label.3. The generated pattern should include a label indicating that it is a synthetic pattern based
on the description provided in the TG18 report.4. If the pattern is scaled (e.g., a new 1.5k × 2k pattern versus the original 1k and 2k pat-
terns), all the specified elements of the original pattern should be present, and the labelshould indicate that it is a scaled pattern.
In using the patterns, for most patterns, it is essential to have a one-on-one relationshipbetween the image pixels and the display pixels, unless indicated otherwise in the test proce-dures in section 4. Patterns in DICOM and 16-bit TIFF formats should be displayed with a win-dow and level set to cover the range from 0 to 4095 (WW = 4096, WL = 2048), except for theTG18-PQC, TG18-LN, and TG18-AFC patterns, where a WW of 4080 and WL of 2040should be used. For 8-bit patterns, the displayed range should be from 0 to 255 (WW = 256,WL = 128).

132
Table III.1. Description of multipurpose test patterns.
Test Pattern/Features Pixel Dimensions and Location Pixel Values(1k [2k] size) (8-bit [12-bit])
TG18-QC
Background 1024 × 1024 [2048 × 2048] 128 [2048]
Crosshatch Spacing: 102 × 102 [204 × 204] 191 [3071]Width: 1 [1]; 3 [3] around central region.
Luminance patches: 102 × 102 [204 × 204]; clockwise 8, 24, …, 248 [128, 384, …, 3968]- 16 levels, equally spaced increasing luminance in central region
(see Table III.8).
- Low contrast corners 10 × 10 [20 × 20]; in corners of +4 [64] in upper left-lower right16 uniform patches. –4 [64] in lower left-upper right
- Min/Max levels 102 × 102 [204 × 204]; lower central 0 [0] and 255 [4095]region.
- Contrast at Min/Max levels 51 × 51 [102 × 102]; centered in Min: 0/13 [0/205]Min/Max patches. Max: 242/255 [3890/4095]
Line pairs (horizontal and vertical 46 × 46 [92 × 92]; Nyquist (1 on, 1 High contrast: 0,255 [0,4095]grilles) off) and half-Nyquist (2 on, 2 off) Low contrast: 128,130 [2048,2088]
frequencies; at center and four corners of pattern.
Cx patterns: Background: 0 [0]- Measurement set 46 × 46 [92 × 92]; at center and four Cx: 255, 191, 128, 64 [4095, 3071,
corners of pattern. 2048, 1024]
- Fiducial marker set, 12 levels 95 × 95 [190 × 190]; clockwise Maximum contrast input; defocus of defocus increasing underfocus; numbered determined by Kohm et al. (2001)
–2, –1, 0, 1, …, 9 (see Tables III.8 and III.9).
Luminance ramps 512 × 64 [1024 × 128] aligned 1k: 0, 1, …, 255 [0, 8, …, 4088]vertically on left/right sides of the 2k: 0, 1, …, 255 [0, 4, …, 4092]pattern. Number of lines at constant pixel value: 2 [4] for 8-bit, 1 [1] for 12-bit.
White/Black windows 815 × 25 [1629 × 50]; above central - Outer windows region.- Inner windows 407 × 25 [813 × 50]; above central
region.
Cross talk bars 576 × 86 [1152 × 172]; along top of 13/242 [205/3890]pattern.Bar lengths: 256, 128, …, 1 [512, 256, …, 1]Bar height: 3 [6]Central vertical bar 6 × 86[12 × 172]

133
Table III.1. (continued)
Test Pattern/Features Pixel Dimensions and Location Pixel Values(1k [2k] size) (8-bit [12-bit])
Low-contrast letters: Bold capital letters, 23 [46] pixels Maximum contrast: 0/255 [0/4095]“QUALITY CONTROL” high; in uniform background areas
below central region. –6 [–96] and +6 [+96] at the upperand lower portions.Backgrounds: 0, 128, 255 [0, 2048,4095]. Letters at +1 to +14 [16 to224] above background.
Border Width: 3 [3]. Inset: 10 [20]. 191 [3071]
TG18-BR
Test Pattern #4 See references (Briggs 1979, 1987).
TG18-PQC
Right luminance ramp 87 × 1024 [174 × 2048] 255-0 [4080-0] ramp, last 7 rows Center 29 [58] columns. at 0 [0] modulated by 0 [0], 0 [+8],
0 [+12], 0 [+8], 0 [0], 0 [-8], 0 [-12],0 [-8], … cyclically for sequentialrows.
Left luminance ramp 87 × 1024 [174 × 2048] 0-255 [0-4080] ramp, last 7 rows Center 29 [58] columns. at 255 [4080] modulated by 0 [0],
0 [+8], 0 [+12], 0 [+8], 0 [0],0 [-8], 0 [-12], 0 [-8], … cyclically for sequential rows.
Top section 850 × 62 [1700 × 124] Alternating rows changing between 0 [0] and 255 [4080]
Bottom section 850 × 62 [1700 × 124] Alternating rows changing between 0 [0] and 255 [4080]
18 horizontal steps of 850 × 50 Mean values of 0 [0], 15 [240], [1700 × 100]. 30 [480], … 255 [4080]Each horizontal step modulated differently for each of 17 50 × 50 [100 × 100] squares.
Mid section Central squares have constant value The inner 4 squares are modulated with the borders marked with high by ±1 [16] (0.4%) except for the first contrast. and last steps with the max and min
values that have modulation of +2 [32] or –2 [32].
Left 8 squares have horizontal square The outer 4 squares are modulated wave modulation with two groups by ±5 [80] (2%) except for the first having line widths of 2, 3, 5, and and last steps with the max and min 8 pixels. values that have modulation of +10
[160] or –10 [160]
Right 8 squares identical to the left Same as above.ones except for orientation of patterns (vertical)

134
Table III.2. Description of luminance test patterns.
Test Pattern/Features Pixel Dimensions and Location Pixel Values(8-bit [12-bit])
TG18-CT
Background 1024 × 1024 128 [2048]
Luminance patches: 102 × 102, separated by 51; ordered 8, 24, …, 248 [128, 384, …, 3968]- 16 levels, equally spaced in 4 × 4 matrix, diagonal zigzag
increment, centered in pattern.
- Low contrast corners 10 × 10; in four corners of each +4 [64] in upper left-lower rightluminance patch. –4 [64] in lower left-upper right
- Low contrast central disk Diameter: 34 ±2 [32](half moon) + on right half, – on left half
TG18-LN8,12-nn
Background 1024 × 1024 153 [2457](~20% of peak luminance)
Luminance measurement areas: 324 × 324 (10% of full area); centered 0, 15, … , 255 [0, 240, … , 4080]nn = 01 to 18 in background.
TG18-UN10,80
Background 1024 × 1024 26 [410] or 204 [3276]
TG18-UNL10,80
Background 1024 × 1024 26 [410] or 204 [3276]
Borders of measurement areas 324 × 324 (10% of full area), 1 pixel 128 [2048]wide; at center and four corners of pattern.
TG18-AD
Background 1024 × 1024 0 [0]
Horizontal line pairs 60 × 60 blocks; half-Nyquist frequency Bright lines at pixel value = C+7R, (2 on, 2 off); in 7 × 7 block array, where C is column number (1 to 7) centered in pattern. and R is row number (0 to 6). For
12-bit, multiply pixel values by 4.
Grid Spacing: 60 × 60. Width: 2. 50 [200]
TG18-MP
Background 1024 × 1024 16 [256]
Vertical ramps 16 768 × 48 ramps Each ramp:48 [3] horizontal lines per pixel value.
Border 770 × 770, pixel-wide bordering the Pixel value = 32 [512]ramp area.
Markers 1 × 3 and 1 × 5 markers for various 4 1 × 3 markers per 8 bit transition bit transitions. [1 × 3 markers for 10 bit and 1 × 5
markers for 8 bit transitions].
Pixel value = pixel value of the adja-cent lines +16 [256] (left half) and–16 [256] (right half).

135
Table III.3. Description of resolution test patterns.
Test Pattern/Features Pixel Dimensions and Location Pixel Values(8-bit [12-bit])
TG18-RH,V10,50,89
Background 1024 × 1024 [2048 × 2048] 51 [819]
Measurement areas 324 × 324 [648 × 648] (10% of full 26, 128, 228 [410, 2048, 3656]area); at center and four corners of pattern.
Horizontal or vertical line Length: 324 [648]. Width: 1 [1]. +12% pixel value contrast:Centered in each measurement area. 29, 143, 255 [459, 2293, 4095]
Position markers Four single pixels at corners of square, 128, 26, 128 [2048, 410, 2048]60 [120] pixels wide, centered in each measurement area.
TG18-PX
Background 1024 × 1024 [2048 × 2048] 0 [0]
Array of single pixels Single pixels on 100 × 100 [200 × 200] 255, 191, 128, 64 grid; reduced contrast arrays offset [4095, 3071, 2048, 1024]by 25 [50].
TG18-CX
Background 1024 × 1024 [2048 × 2048] 0 [0]
Cx patterns: 7 × 7 Cx repeated with 90° rotations 255, 191, 128, 64- Measurement set over entire pattern. [4095, 3071, 2048, 1024]
- Fiducial marker set, 12 levels of 95 × 95 [190 × 190] patches; clockwise Maximum contrast input; defocus defocus increasing underfocus around central determined by Kohm et al. (2001).
region; numbered -2, -1, 0, 1, … , 9(see Tables III.8 and III.9).
TG18-LPH,V10,50,89
Background 1024 × 1024 [2048 × 2048] 26, 128, 228 [410, 2048, 3656]
Line pairs: Horizontal or vertical Nyquist frequency (1 on, 1 off) over +12% contrast:entire pattern. 29, 143, 255 [459, 2293, 4095]

136
Table III.4. Description of noise test patterns.
Test Pattern/Features Pixel Dimensions and Location Pixel Values(8-bit [12-bit])
TG18-AFC
Background 1024 × 1024 size 128 [2040]Divided into quadrants with 4 pixel Line values = 143 [2280]wide lines.Each quadrant divided into an 8 × 8 set of square boxes by 2 pixel wide lines.
Center and four quadrants 128 × 128 regions containing 16 small Objects values from left to right, square low contrast object arranged in background plus 2, 3, 4, and 6 [32, a 4 × 4 pattern. Size of the objects from 48, 64, and 96] (contrasts 0.8%, top to bottom with square dimensions, 1.2%, 1.6%, 2.4%).of 2, 3, 4, and 6 pixels.
In each small box filling the quadrants, Values = background +a small square low contrast object upper left quadrant, 2 [32]randomly placed in one of four upper right quadrant, 3 [48]subquadrants of the box. upper left lower left quadrant, 4 [64]quadrant: size = 2 lower right quadrant, 6 [96]
upper right quadrant: size = 3lower left quadrant: size = 4lower right quadrant: size = 6
TG18-NS10,50,89
Background 1024 × 1024 51 [819]
Measurement areas 324 × 324 (10% of full area); at center 26, 128, 228 [410, 2048, 3656]and four corners of pattern.
Position markers Four single pixels at corners of 60-pixel 128, 26, 128 [2048, 410, 2048]square, centered in each measurement area.

137
Table III.5. Description of glare test patterns.
Test Pattern/Features Pixel Dimensions and Location Pixel Values(8-bit [12-bit])
TG18-GV
Background 1024 × 1024 0 [0]
White annulus Inner, outer radii: 15, 300. Centered 255 [4095]in pattern.
Low-contrast disks Diameter: 9. Five disks, equally spaced 2, 4, 6, 8, 10 [32, 64, 96, 128, 160]inside inner radius of white annulus.
TG18-GVN
Same as TG18-GV but withoutwhite annulus.
TG18-GQ
Background 1024 × 1024 0 [0]
White annulus Inner, outer radii: 15, 300. Centered 255 [4095]in pattern.
TG18-GQN
Same as TG18-GQ but withoutwhite annulus.
TG18-GQB
Same as TG18-GQ but with white Radius: 300. Centered in pattern. 255 [4095]disk replacing annulus
TG18-GAr
Background 1024 × 1024 0 [0]
White annulus Outer radius: 300. Centered in pattern. 255 [4095]Inner radius, r: 3, 5, 8, 10, 15, 20, 25, or 30.
Table III.6. Description of anatomical test patterns.
Test Pattern/Features Pixel Dimensions and Location Pixel Values(8-bit [12-bit])
TG18-CH PA chest test pattern (see 3.2.6.1). 12-bit range: 8 to 39442048 × 2048
TG18-KN Knee test pattern (see 3.2.6.2) 12-bit range: 2 to 39022048 × 2048
TG18-MM1 Mammogram test pattern 1 (see 3.2.6.4). 12-bit range: 0 to 40952048 × 2048
TG18-MM2 Mammogram test pattern 1 (see 3.2.6.4). 12-bit range: 0 to 40952048 × 2048
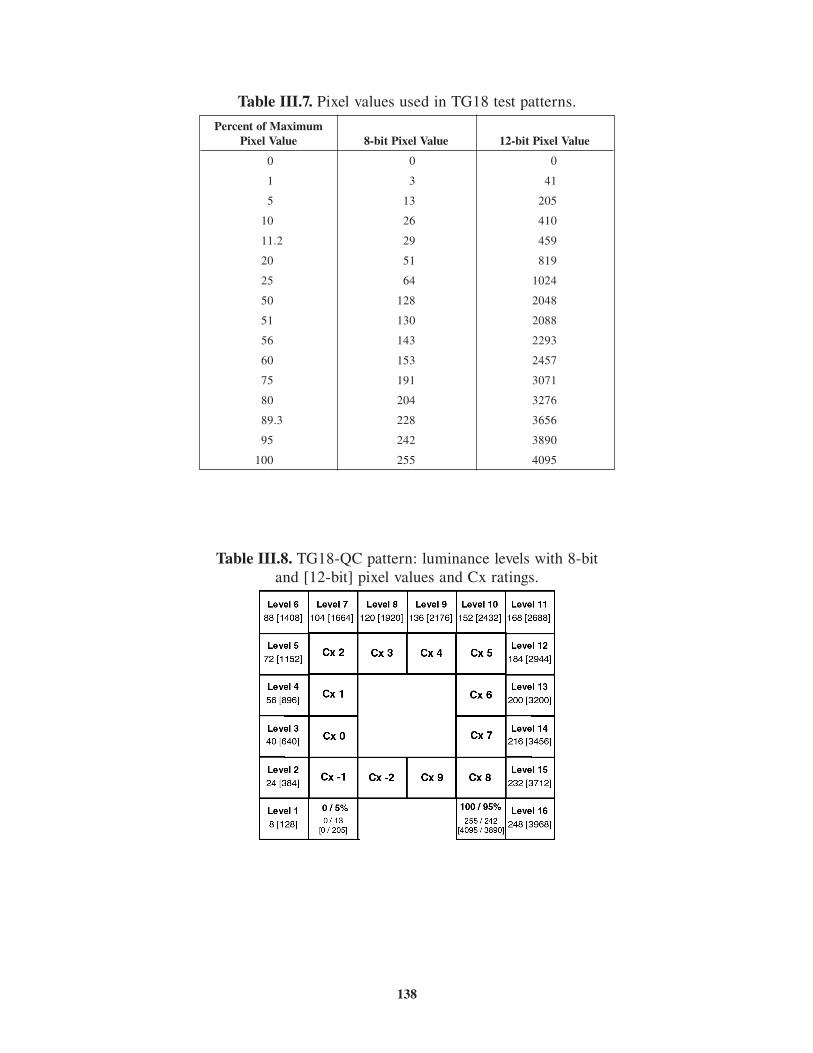
138
Table III.7. Pixel values used in TG18 test patterns.
Table III.8. TG18-QC pattern: luminance levels with 8-bitand [12-bit] pixel values and Cx ratings.
Percent of Maximum Pixel Value 8-bit Pixel Value 12-bit Pixel Value
0 0 0
1 3 41
5 13 205
10 26 410
11.2 29 459
20 51 819
25 64 1024
50 128 2048
51 130 2088
56 143 2293
60 153 2457
75 191 3071
80 204 3276
89.3 228 3656
95 242 3890
100 255 4095

139
Table III.9. The blurring characteristics of the Cx reference set utilizedin TG18-QC and TG18-CX test patterns (Kohm et al. 2001).
Ref No. Standard Deviation of blurring in pixels Corresponding RAR
–2 0.35σ1, 0.875σ2* NA
–1 0.3σ1, 0.99σ2* NA
0 0 1 (perfect)
1 0.339 0.80
2 0.383 0.90
3 0.432 1.02
4 0.488 1.15
5 0.551 1.30
6 0.622 1.47
7 0.703 1.65
8 0.794 1.87
9 0.896 2.11
*Profile = 0.85 N(σ1) + 0.15 N(σ2), where N is Gaussian distribution.

140
REFERENCES
AAPM Report No. 42. The Role of the Clinical Medical Physicist in Diagnostic Radiology,Report of the AAPM Task Group No. 2. Woodbury, NY: American Institute of Physics, 1994.
Ackerman SJ, Gitlin JN, Gayler RW, Flagle CD, Bryan RN. (1993). “Receiver operating charac-teristic analysis of fracture and pneumonia detection: Comparison of laser-digitized work-station images and conventional analog radiographs.” Radiology 186:263–268.
American College of Radiology (ACR). ACR Standard for Teleradiology. Reston, VA: AmericanCollege of Radiology, 1999. http://www.acr.org/.
Badano A, Flynn MJ. (2000). “A method for measuring veiling glare in high performance dis-play devices.” Appl Optics 39:2059–2066.
Badano A, Flynn MJ, Kanicki J. (2002). “Accurate small-spot luminance measurements indisplay devices.” Displays 23:177–182.
Badano A, Flynn MJ, Muka E, Compton K, Monsees T. (1999). “The veiling glare point-spreadfunction of medical imaging monitors.” Proc SPIE 3658:458–467.
Badano A, Kanicki J. (2001). “Monte carlo analysis of the spectral photon emission and extrac-tion efficiency of organic light-emitting devices.” J Appl Phys 90:1827–1830.
Barrett HH, Swindell W. Radiological Imaging: The Theory of image Formation, Detectionand Processing. New York: Academic Press, 1981.
Barten PGJ. Contrast Sensitivity of the Human Eye and Its Effects on Image Quality. Bellingham,WA: SPIE Press, 1999.
Barten PGJ. (1993). “Spatio-temporal model for the contrast sensitivity of the human eye and itstemporal aspects.” Proc SPIE 1913:1, 1993.
Barten PGJ. (1992). “Physical model for the contrast sensitivity of the human eye.” Proc SPIE1666:57–72.
Blume H, Ho AMK, Stevens F, Steven PM. (2001). “Practical aspects of gray-scale calibrationof display systems.” Proc SPIE 4323:28–41.
Boynton PA, Kelley EF. “Accurate contrast-ratio measurements using a cone mask.” 1997Society for Information Display (SID) Symposium, Digest of Technical Papers, May 11–16,1997 Boston, MA, Sec. 32.1, pp. 823–826, 1997.
Briggs SJ. (1987). “Soft-copy display of electro-optical imagery.” Proc SPIE 762:153–169.Briggs SJ. Report D180-25066-1, Manual Digital Test Target BTP #4. Boeing Aerospace
Company, Seattle, Washington, January 1979.Dainty JC, Shaw R. Image Science: Principles, Analysis and Evaluation of Photographic-Type
Imaging Processes. London: Academic Press, 1974.DIN 6868-57-2001, Image quality assurance in x-ray diagnostics, Acceptance testing for image
display devices. The German Standards Institution, Deutsches Institut für Normung e.V.,February 2001.
Dwyer SJ, Stewart BK. “Clinical Uses of Grayscale Workstations” in Digital Imaging. WRHendee and JH Trueblood (eds.). AAPM Medical Physics Monograph No. 22. Madison, WI:Medical Physics Publishing, pp. 241–264, 1993.
Eckert MP, Chakraborty DP. (1995). “Video display quality control measurements for PACS.”Proc SPIE 2431:328–340.
Fetterly KA, Bernatz SN, Groth DS, Hangiandreou NJ. (1998). “Quantitative color measurementfor the characterization of grayscale PACS CRTs.” Radiology 209(P):320.
Flynn MJ, Badano A. (1999). “Image quality degradation by light scattering in display devices.”J Digit Imaging 12:50–59.

141
Flynn MJ, Couwenhoven M, Eyler WR, Whiting BR, Samei E, Foss DH, Slone R, Marom E.(2001). “Optimal image processing for digital radiography.” Proc SPIE 4319:298–305.
Flynn MJ, Kanicki J, Badano A, Eyler WR. (1999). “High fidelity electronic display of digitalradiographs.” Radiographics 19:1653–1669.
Gaskill JD. Linear Systems, Fourier Transforms and Optics. New York: John Wiley & Sons, 1978.Gray JE. (1992). Use of SMPTE test pattern in picture archiving and communication systems.”
J Digit Imaging 5:54–58. Gray HF, Sune CT, Jones GW. (1993). “Silicon field-emitter arraysfor cathodoluminescent flat-panel displays.” J Soc Inform Displays 1:143–146.
Hangiandreou NJ, Fetterly KA, Flemlee JP. (1999). “Optimization of a contrast-detail-basedmethod for electronic image display quality evaluation.” J Digit Imaging 12:60–67.
He Y, Kanicki J. (2000). “High-efficiency organic polymer light-emitting heterostructure deviceson flexible plastic substrates.” Appl Phys Letters 76:661–663.
He Y, Gong S, Hattori R, Kanicki J. (1999). “High performance organic polymer light-emittingheterostructures.” Appl Phys Letters 16:661–663.
Hemminger BM, Johnston RE, Rolland JR, Muller KE. (1994). “Perceptual linearization ofvideo display monitors for medical image presentation.” Proc SPIE 2164:222–240.
Hoke CD, Mori H, Bos PJ. “An ultra-wide-viewing angle STN-LCD with a negative-birefrin-gence compensation film.” Proc International Display Research Conference (IDRC), pp.21–24, 1997.
Holloway P, Sebastian J, Trottier T. (1995). “Production and control of vacuum in field emissionflat panel displays.” Solid State Tech. pp. 47–54.
Horowitz P, Hill W. The Art of Electronics. Cambridge, MA: Cambridge University Press, 1980.IEC 61223-2-5:1994. Evaluation and routine testing in medical imaging departments—Part 2–5:
Constancy tests—Image display devices. Vienna, Austria: International Commission onIllumination, Commission Internationale de l’Eclairage (CIE), 1994. http://www.cie.co.at/cie/.
IEC/CIE, Publication No. 15.2, Colorimetry. 2nd Edition. Vienna, Austria: InternationalCommission on Illumination, Commission Internationale de l’Eclairage (CIE), 1986.http://www.cie.co.at/cie/.
ISO 13406-2:2001, Ergonomic Requirements for the Use of Flat-Panel Displays. Geneva:International Organization for Standardization, 2001. http://www.iso.org/.
ISO 9241-3:1992, Ergonomic Requirements for Office Work with Visual Display Terminals(VDTs)—Part 3: Visual Display Requirements. Geneva: International Organization forStandardization, 1992. http://www.iso.org/.
Kato H. Hard- and Soft-Copy Image Quality. RSNA Categorical Course in Physics. Oak Brook,IL: Radiological Society of North America, pp. 243–258, 1995.
Keller PA. Electronic Display Measurement: Concepts, Techniques and Instrumentation. NewYork: John Wiley & Sons, Inc, 1997.
Kelley EF. (2002). “Sensitivity of display reflection measurements to apparatus geometry.” 2002SID Digest of Technical Papers 11.3.
Kelley EF. Proposed Diffuse Ambient Lighting Contrast Measurement Methods for Flat PanelDisplays. NISTIR 6738. Gaithersburg, MD: National Institute of Standards and Technology,2001.
Kelley EF, Jones GR, Boynton PA, Grote MD, Bechis DJ. “A survey of the components of dis-play measurement standards” 1995 SID International Symposium Digest of TechnicalPapers, May 23–25, 1995, Orlando, FL, XXVI, pp. 637–640, 1995.
Kohm KS, Cameron AW, Van Metter RL. (2001). “Visual CRT sharpness estimation using afiducial marker set.” Proc SPIE 4319:286–297.

142
Libsch FR, Lien A. (1998). “Understanding crosstalk in high-resolution color thin-film-transis-tor liquid crystal displays.” IBM J Res Devel 42:467–479.
Lippincott H. (ed.). The CRT Book, The ABCs of CRTs. Rockford, IL: Clinton ElectronicsCorp., 1988.
Mertelmeier T, Kocher T. (1996). “Monitor simulations for the optimization of medical softcopies.” Proc SPIE 2707:322–333.
Moss H. Narrow Angle Electron Guns and Cathode Ray Tubes. San Diego: CA: AcademicPress, 1968.
Muka E, Mertelmeier T, Slone RM, Senol E. (1997). “Impact of phosphor luminescence noise onthe specification of high-resolution CRT displays for medical imaging.” Proc SPIE3031:210–221.
Muka E, Blume H, Daly S. (1995). “Display of medical images on CRT soft-copy displays: Atutorial.” Proc SPIE 2431:341–359.
Nam MS, Wu JW, Choi YJ. “Wide-viewing-angle TFT-LCD with photo-aligned four-domain TNmode.” 1997 Society for Information Display (SID) Symposium, Digest of Technical Papers,May 11–16, 1997 Boston, MA, Sec. 32.1, pp. 933–936, 1997.
Nawfel RD, Chan KH, Wagenaar DJ, Judy PF. (1992). “Evaluation of video gray-scale display”Med Phys 19:561–567.
NEMA PS 3.14-2000. Digital Imaging and Communications in Medicine (DICOM) Part 14:Grayscale Display Standard Function. Rosslyn, VA: National Electrical ManufacturersAssociation (NEMA), 2000. http://www.nema.org/. Draft viewable at http://medical.nema.org/dicom/2000/draft/00_14DR.PDF, Available for purchase in whole or in parts from GlobalSales, Global Engineering Documents, 15 Inverness Way East Englewood, COLORADO,80112 USA; http://global.ihs.com/.
Nier MC. (ed.). (1996). “Standards for electronic imaging technologies, devices, and systems.”Proc SPIE CR61.
Nier MC, Courtot ME. (eds.). (1991). “Standards for electronic imaging systems.” Proc SPIECR37.
Oekel JJv. “Improving the contrast of CRTs under low ambient illumination with a graphite coat-ing.” 1995 SID International Symposium Digest of Technical Papers, May 23–25, 1995,Orlando, FL, XXVI, pp. 427–430, 1995.
Paszkowski B. Electron Optics. London: Life Books Inc, 1968.Reimann DA, Flynn MJ, Ciarelli JJ. (1995). “A system to maintain perceptually linear net-
worked display devices.” Proc SPIE 2431:316–326. Roehrig H, Chawla A, Krupinski A, FanJ, Gandhi K. (2003). “Why should you calibrate your display?” Proc SPIE 5199:181–192.
Roehrig H, Willis CE, Damento MA. (1999). “Characterization of monochome CRT displaysystems in the field.” J Digit Imaging 12:152–165.
Roehrig H, Blume H, Ji TL, Sundareshan MK. (1993). “Noise of CRT display systems.” ProcSPIE 1897:232–245.
Roehrig H, Blume H, Ji TL, Browne M. (1990a). “Performance tests and quality control of cath-ode ray tube displays.” J Digit Imaging 3:134–145.
Roehrig H, Ji TL, Browne M, Dallas WJ, Blume H. (1990b). “Signal-to-noise ratio and maxi-mum information content of images displayed by a CRT.” Proc SPIE 1232:115–133.
Rose A. Vision, Human and Electronic. New York: Plenum Press, 1974.Ryer AD. Light Measurement Handbook. Newburyport, MA: International Light, 1998.

143
Samei E. “Digital Mammography Displays” in Advances in Breast Imaging: Physics,Technology, and Clinical Applications. A Karellas and ML Giger (eds). RSNA CategoricalCourse Syllabus. Oak Brook, IL: Radiological Society of North America (RSNA), pp.135–143, 2004.
Samei E, Wright SL. (2004). “The effect of viewing angle response on DICOM compliance ofLCD displays.” Proc SPIE Med Imag 5371:170–177.
Samei E, Flynn MJ. (2001). “A method for in-field evaluation of the modulation transfer func-tion of electronic display devices.” Proc SPIE 4319:599–607.
Scott WW, Bluemke DA, Mysko WK, Weller GER, Kelen GD, Reichle RL, Weller JC, Gitlin JN.(1995). “Interpretation of emergency department radiographs by radiologists and emergency med-icine physicians: Teleradiology workstation versus radiograph readings.” Radiology 195:223–229.
Scott WW, Rosenbaum JE, Ackerman SJ, Reichle RL, Magid D, Weller JC, Gitlin JN. (1993).“Subtle orthopedic fractures: Teleradiology workstation versus film interpretation.”Radiology 187:811–815.
Senol E, Muka E. (1995). “Spatial frequency characteristics of CRT soft-copy displays. ProcSPIE 2431:302–315.
Sheats JR, Roitman DB. (1998). “Failure modes in polymer-based light-emitting diodes.”Synthetic Metals 95:85–79.
SMPTE RP133, Specifications for Medical Diagnostic Imaging Test Pattern for TelevisionMonitors and Hard-copy Recording Cameras. White Plains, NY: Society of Motion Picture& Television Engineers (SMPTE), 1991.
Spekowius G. (1999). “Characterization of color CRT display systems for monochrome applica-tions.” J Digit Imaging 12:102–113.
Tang CM, Swyden TA. “Beam collimation from field-emitter arrays with linear planar lenses.”1997 Society for Information Display (SID) Symposium, Digest of Technical Papers, May11–16, 1997 Boston, MA, Sec. 32.1, pp. 115–118, 1997.
Tang CW, Van Slyke SA. (1987). “Organic electroluminescent diodes.” Appl Phys Letters51:913–915.
Tirard-Gatel N, Perrin A, Levy F. (1999). “Charging and reliability effects associated with FEDspacers.” 1997 Society for Information Display (SID) Symposium, Digest of TechnicalPapers, 1999, San Jose, CA, pp. 1134–1137. VESA, Flat Panel Display MeasurementsStandard (FPDM), Version 2.0. Milpitas, CA: Video Electronics Standards Association(VESA), June 2001. www.vesa.org.
VESA, Video Signal Standard (VSIS), Version 1, Rev. 1, Draft 4. Milpitas, CA: VideoElectronics Standards Association (VESA), February 14, 2000. www.vesa.org.
VESA; Flat Panel Display Measurements Standard (FPDM), Version 1.0. Milpitas, CA: VideoElectronics Standards Association (VESA), May 1998. www.vesa.org.
Wakemoto H, Asada S, Kato N. (1997). “An advanced in-plane switching mode TFT-LCD.”1997 Society for Information Display (SID) Symposium, Digest of Technical Papers, May11–16, 1997 Boston, MA, Sec. 32.1, pp. 929–932.
Weibrecht M, Spekowius G, Quadflieg P, Blume H. (1997). “Image quality assessment of mono-chrome monitors for medical soft-copy display. Proc SPIE 3031:232–244.
Wright SL, Millman S, Kodate M. (1999). “Measurement and digital compensation of crosstalkand photoleakage in high-resolution TFT-LCDs.” Proc SPIE 3636:200–211.
Xie C, Kumar N, Collins CB, Lee T, Schmidt H, Wagal S. (1993). “Electron field emission fromamorphic diamond thin films.” Proc 6th IEEE International Vacuum MicroelectronicsConference, Newport, RI, July 12–15, 1993, p. 162–163.

144
SELECTED BIBLIOGRAPHY
Anrijs H. (1997). “Digital imaging: The Agfa experience.” J Belge Radiol 80:196–198. BadanoA, Flynn MJ. (1997). “Image degradation by glare in radiologic display devices.” Proc SPIE3031:222–231.
Blume H. (1999). “Image processing strategies in picture archiving and communication sys-tems.” J Digit Imaging 12:43–47.
Blume H, Hemminger BM. (1997). “Image presentation in digital radiology: Perspectives on theemerging DICOM display function standard and its application.” Radiographics17:769–777.
Blume H, Daly S, Muka E. (1993). “Presentation of medical images on CRT displays: Arenewed proposal for a display function standard.” Proc SPIE 1897:215–231.
Brill MH. (2000). “LCD color reversal at a glance.” Information Display 16:36–37.Brill MH. (1999). “Seeing through screen reflection.” Information Display 14:28–31.Cook LT, Cox GG, Insana MF, McFadden MA, Hall TJ, Gaborski RS, Lure FY. (1998).
“Comparison of a cathode-ray-tube and film for display of computed radiographic images.”Med Phys 25:1132–1138. Droege RT. (1983). “A practical method to routinely monitor res-olution in digital images.” Med Phys 10:337–343.
DIN 6868-57-2001. Image quality assurance in x-ray diagnostics. Acceptance testing for imagedisplay devices. The German Standards Institution, Deutsches Institut für Normung e.V.Berlin: Beuth Verlag, February 2001.
Dwyer SJ, III. “Soft-copy Displays and Digitizers” in The Expanding Role of Medical Physicsin Diagnostic Imaging. G Frey and P Sprawls P (eds.). AAPM Medical Physics MonographNo, 23. Madison, WI: Advanced Medical Publishing, pp. 381–392, 1997.
Dwyer SJ, Stewart BK, Sayre JW, Aberle DR, Boechat MI, Honeyman JC, Boehme JM, RoehrigH, Ji TL, Blaine GJ. (1992). “Performance characteristics and image fidelity of gray-scalemonitors.” Radiographics 12:765–772.
Enstrom RE, Grote MD, Brill MH. (2000). “Display performance assessment at NIDL.” ProcSPIE 4022:358–368. Golden WE. (1990). “Entering the quality assurance decade.” Am JMed Sci 300:178–180.
Gray JE, Lisk KG, Haddick DH, Harschbarger JH, Oosterhof A, Schwenker R.(1985). “Test pat-tern for video displays and hard-copy cameras.” Radiology 152:519–527.
Hall JA. (1954). “Evaluation of signal-generating image tubes.” Photoelectronic ImagingDevices 2:468–471.
Hangiandreou NJ, Fetterly KA, Bernatz SN, Cesar LJ, Groth DS, Felmlee JP. (1998).“Quantitative evaluation of overall electronic display quality.” J Digit Imaging 11:180–186.
Hangiandreou NJ, O’Connor TJ, Felmlee JP. (1998). “An evaluation of the signal and noisecharacteristics of four CCD-based film digitizers.” Med Phys 25:2020–2026.
Hemminger BM, Johnston RE, Rolland JP, Muller KE. (1995). “Introduction to perceptual lin-earization of video display systems for medical image presentation.” J Digit Imaging8:21–34.
Horii SC. (1995). “Quality assurance for picture archiving and communication systems (PACS)and PACS technology applications in radiology.” J Digit Imaging 8:1–2.
Hsieh M, Hsu K, Paek E, Wilson C. “Modulation transfer function of a liquid crystal spatiallight modulator.” Optics Communications 170:221–227.
Infante C. “CRT display measurements and quality.” Society for Information DisplayInternational Symposium Conference Seminar Notes M-3, pp. 1–54, 1997.

145
ISO 9241-7:1997, Ergonomic Requirements for Office Work with Visual Display Terminals.Geneva: International Organization for Standardization, 1992. http://www.iso.org/.
Lie A. (1994). “Coordination of quality assurance” [in Norwegian]. Tidsskr Nor Laegeforen114:613–615.
Leclet H. (1997). “About the importance of building quality assurance programs in medicalimaging” [in French]. J Radiol 78:479–480. Ludlow JB, Abreu M Jr. (1999). “Performanceof film, desktop monitor and laptop displays in caries detection.” Dentomaxillofac Radiol28:26–30.
Mertelmeier T. (1999). “Why and how is soft-copy reading possible?” J Digit Imaging 12:3–11.NIDL Publication No. 0201099-091, Request for Evaluation Monitors for the National Imagery
& Mapping Agency (NIMA) Integrated Exploitation Capability (IEC). Princeton, NJ:National Information Display Laboratory (NIDL), August 25, 1999.
NIDL Publication 171795-036, Display Monitor Measurement Methods under discussion byEIA (Electronic Industries Association) Committee JT-20 Part 1: Monochrome CRTMonitor Performance. Princeton, NJ: National Information Display Laboratory (NIDL), July12, 1995.
NIDL Publication, Test Procedures for Evaluation of CRT Display Monitors, Version 3.1.Princeton, NJ: National Information Display Laboratory (NIDL), June 15, 1992.
Pavlicek W, Liu P. (2001). “Computed radiographic examinations of subtle bone pathology;implications for liquid crystal displays in radiology. Proc SPIE 4295:164–175.
Pavlicek W, Owen J, Peter MB. (2000). “Active matrix liquid crystal displays for clinical imag-ing: Comparison with cathode ray tube displays.” J Digit Imaging 134:155–161.
Peli E, Arend L, Labianca AT. (1996). “Contrast perception across changes in luminance andspatial frequency.” J Opt Soc Am A 13:1953–1959.
Pilgram TK, Slone RM, Muka E, Cox JR, Blaine GJ. (1998). “Perceived fidelity of compressedand reconstructed radiological images: a preliminary exploration of compression, luminance,and viewing distance.” J Digit Imaging 11:168–175.
Pizer SM. (1981). “Intensity Mapping to linearize display devices.” Proc. Computer GraphicsImage Processing 17:262–268.
Rao GN. (1994). “Relevance of quality assurance.” Indian J Ophthalmol 42:49. Reiker GG,Gohel N, Muka E, Blaine GJ. (1992). “Quality monitoring of soft-copy displays for medicalradiography.” J Digit Imaging 5:161–167.
Roehrig H. “The Monochrome Cathode Ray Tube Display and Its Performance” in Handbookof Medical Imaging, Vol 3, Ch 4. J Beutel, HL Kundel, and RLVan Metter (eds.).Bellingham, WA: SPIE Press, 2000.
Roehrig H. (1999). “Image quality assurance for CRT display systems [editorial].” J DigitImaging 12:1–2.
Roehrig H. (1999). “Image quality assurance for CRT display systems—Part II [editorial].” J Digit Imaging 12:49.
Roehrig H, Dallas WJ, Blume H, Sivarudrappa M. (2000). “Software for CRT image qualityevaluation.” Proc SPIE 3976:442–453.
Roehrig H, Krupinski E. (1998). “Image Quality of CRT displays and the effect of brightness ofdiagnosis of mammograms.” J Digit Imaging 11:187–188.

146
Rowlands JA. “Television Camera Design and Specification” in Specification, AcceptanceTesting and Quality Control of Diagnostic X-ray Imaging Equipment. JA Seibert, G Barnes,and R Gould (eds.) 1991 AAPM Summer School Proceedings, AAPM Medical PhysicsMonograph No. 20, New York: American Institute of Physics, pp. 461–481, 1994.
Suzuki J, Furukawa I, Ono S, Kitamura M, Ando Y. (1997). “Contrast mapping and evaluation forelectronic X-ray images on CRT display monitor.” IEEE Trans Med Imaging 16:772–784.
Umezu N, Nakamo Y, Sakai T, Yoshitake R, Herlitschke W, Kubota S. (1998). “Specular anddiffuse reflection measurement feasibility study of ISO 9241 part 7 method.” Displays19:17–25.
Van Metter R, Binsheng Z, Kohm K. (1999). “The sensitivity of visual targets for display qual-ity assessment.” Proc SPIE 3658:254–268.
Wang J, Langer S. (1997). “A brief review of human perception factors in digital displays forpicture archiving and communications systems.” J Digit Imaging 10:158–168.
Wang HK, Cho PPS. “Multimodality Image Viewing” in Digital Imaging. WR Hendee and JHTrueblood (eds.). AAPM Medical Physics Monograph No. 22. Madison, WI: MedicalPhysics Publishing, pp. 267–279, 1993.
Weiser JC, Drummond KT, Evans BD, Shock DJ, Frick MP. (1997). “Quality assurance for dig-ital imaging.” J Digit Imaging 10:7–8.