32 TRV - European Securities and Markets Authority · ESMA Report on Trends, Risks and...
87
32 TRV ESMA Report on Trends, Risks and Vulnerabilities No. 2, 2017
-
Upload
nguyennhan -
Category
Documents
-
view
218 -
download
2
Transcript of 32 TRV - European Securities and Markets Authority · ESMA Report on Trends, Risks and...

32
TRV
ESMA Report on Trends, Risks and Vulnerabilities No. 2, 2017

ESMA Report on Trends, Risks and Vulnerabilities No. 2, 2017 2
ESMA Report on Trends, Risks and Vulnerabilities No. 2, 2017
© European Securities and Markets Authority, Paris, 2017. All rights reserved. Brief excerpts may be reproduced or translated provided the source is cited adequately. The reporting period of this Report is 1 January 2017 to 30 June 2017, unless indicated otherwise. The reporting quarter of the Risk Dashboard in the Risk Section is 2Q17. Legal reference of this Report: Regulation (EU) No 1095/2010 of the European Parliament and of the Council of 24 November 2010 establishing a European Supervisory Authority (European Securities and Markets Authority), amending Decision No 716/2009/EC and repealing Commission Decision 2009/77/EC, Article 32 “Assessment of market developments”, 1. “The Authority shall monitor and assess market developments in the area of its competence and, where necessary, inform the European Supervisory Authority (European Banking Authority), and the European Supervisory Authority (European Insurance and Occupational Pensions Authority), the ESRB and the European Parliament, the Council and the Commission about the relevant micro-prudential trends, potential risks and vulnerabilities. The Authority shall include in its assessments an economic analysis of the markets in which financial market participants operate, and an assessment of the impact of potential market developments on such financial market participants.” The charts and analyses in this report are, fully or in parts, based on data not proprietary to ESMA, including from commercial data providers and public authorities. ESMA uses these data in good faith and does not take responsibility for their accuracy or completeness. ESMA is committed to constantly improving its data sources and reserves the right to alter data sources at any time. The third-party data used in this publication may be subject to provider-specific disclaimers, especially regarding its ownership, its reuse by non-customers and, in particular, the accuracy, completeness or timeliness of the data provided and the provider’s liability related to those. Please consult the websites of the individual data providers, whose names are detailed throughout this report, for more details on these disclaimers. Please note that for charts related to issuance and outstanding, ESMA has changed the source of commercial data across asset classes. In addition, charts on credit quality and CRAs are now constructed on the basis of more refined ESMA proprietary data based on the RADAR reporting tool. For more detailed information on RADAR please see “ESMA’s supervision of credit rating agencies, trade repositories and monitoring of third country central counterparties. 2016 annual report and 2017 work programme”, published in February 2017. Where data sources have been changed, data differ compared to previous editions of the TRV. These differences generally pertain to the levels of activity, and not to market trends and directions. Our findings and risk analysis are not materially affected by the change in data sources.
European Securities and Markets Authority (ESMA) Risk Analysis and Economics Department 103, Rue de Grenelle FR–75007 Paris [email protected]

ESMA Report on Trends, Risks and Vulnerabilities No. 2, 2017 3
Table of contents Executive summary 4
Trends 6
Market environment 7
Securities markets 9
Investors 13
Infrastructures and services 19
Risks 24
ESMA Risk Dashboard 25
Securities markets 28
Investors 31
Infrastructures and services 33
Vulnerabilities 35
Investor protection 36
The impact of charges on mutual fund returns 36
Orderly markets 45
DLT – key implementation challenges 45
Financial stability 51
EU derivatives markets ─ a first overview 51
Annexes 59
Statistics 60
Securities markets 60
Investors 73
Infrastructures and services 82
List of abbreviations 86

ESMA Report on Trends, Risks and Vulnerabilities No. 2, 2017 4
Executive summary Trends and risks
ESMA risk assessment
Risk segments Risk categories Risk sources
Risk Outlook Risk Outlook
Outlook
Overall ESMA remit Liquidity
Macroeconomic environment
Systemic stress Market
Low interest rate environment
Securities markets Contagion
EU sovereign debt markets
Investors Credit
Market functioning
Infrastructures and services Operational
Political and event risks
Note: Assessment of main risks by risk segments for markets under ESMA remit since last assessment, and outlook for forthcoming quarter. Assessment of main risks by risk categories and sources for markets under ESMA remit since last assessment, and outlook for forthcoming quarter. Risk assessment based on categorisation of the ESA Joint Committee. Colours indicate current risk intensity. Coding: green=potential risk, yellow=elevated risk, orange=high risk, red=very high risk. Upward arrows indicate an increase in risk intensities, downward arrows a decrease, horizontal arrows no change. Change is measured with respect to the previous quarter; the outlook refers to the forthcoming quarter. ESMA risk assessment based on quantitative indicators and analyst judgement.
Risk summary: Overall, ESMA’s 2Q17 risk assessment remained unchanged from 1Q17. Market and
credit risks were very high, while liquidity and contagion risks stayed high. Operational risk remained
elevated, but risk is expected to increase, as shown by the risk oulook, reflecting heightened concerns
around cyber security. Our outlook for market, liquidity, credit and contagion risks, was stable. Market
performance reflected increasing market confidence and improved expectations on the future economic
outlook in EU and globally. This is echoed in increased capital flows into strategies yielding higher
returns. Substantive risk sources include: economic growth in the EU and elsewhere that needs to prove
resilient; structural problems in many EU member states continuing to be addressed; internationally,
rising public and private debt levels of increasing concern; persistence of high asset price valuations;
and prevailing geo-political and political uncertainties. Brexit-related uncertainties remain among the
most important political sources of risk.
Securities markets: In 1H17, equity markets continued to gain across countries, related to the economic
recovery in EU and supportive monetary policy, notwithstanding risks at EU and global level. Developments
in corporate and sovereign bond yields were mixed, with liquidity measures suggesting a benign trading
environment, albeit worsening slightly for sovereigns. Volumes in EA repo transactions grew and net short
positions on EA sovereign debt increased in 1Q17. Persisting low spreads in EU corporate and covered
bond markets suggest that search-for-yield strategies may be continuing, raising concerns of excessive risk
taking. Moreover, securities financing markets have been more volatile since the beginning of the year,
reflecting a potential scarcity of high-quality collateral in the EU financial system.
Investors: Mirroring the trend on EU financial markets, notably rising valuations in equity markets,
investment fund returns rebounded in 1H17. Investments in bond funds and other fixed income funds
constituted the bulk of the inflows, which amounted to EUR 241bn. Investors preferred EM securities
and corporate bond funds, documenting the persistent search-for-yield. The EA investment fund sector
represented EUR 12tn AuM in the EA, an increase of 6% compared to end-2016. In the reporting period,
the funds’ cash buffers dropped under 1%, below their four-year average, while fund leverage remained
in line with previous quarters. ETF AuM continued to grow in 1H17. Additionally, the development of
products such as strategic beta ETFs makes those funds a potential alternative for actively managed
funds.

ESMA Report on Trends, Risks and Vulnerabilities No. 2, 2017 5
Infrastructures and services: In 1H17, the bulk of trading was executed via electronic order books while the
amount conducted via dark pools and off-order books remained limited. With respect to central clearing,
ESMA added seven CCPs to its list of third-country central counterparties recognised to offer services and
activities in the EU. Moreover, the second delegated regulation requiring mandatory clearing of certain index
CDSs took effect for CCP clearing members. Financial benchmarks remained stable in the reporting period,
including the Euribor panel with twenty banks as contributors. Finally, ESMA monitors the rapid growth of
FinTech and related effects on the financial sector.
Vulnerabilities
The impact of charges on mutual fund returns: This article provides metrics to analyse the impact of ongoing
fees and one-off charges and inflation on mutual fund returns. Preliminary evidence for the EU fund industry
suggests that on average ongoing fees and one-off charges and inflation reduced returns available to
investors by 29% of gross returns between 2013 and 2015. These reductions apply to all market segments,
while varying across jurisdictions, asset classes and client types. Relative return reductions range from 11%
for passive equity fund shares to 44% for retail fund shares in bond mutual funds. Relative and absolute
return reductions for actively managed and retail fund shares tend to exceed those of passively managed
and institutional fund shares. The PRIIPs/MiFID framework will provide for additional cost information,
including distribution fees, to be taken into account, especially considering the impact such costs could have
on reductions in return. Furthermore, the analysis investigates whether investors take the presence of fund
charges and net returns into account when making investment decisions. Despite the impact of fees and
charges on the net outcome to investors, these do not seem to be reflected in investor choices, with
preliminary results showing that aggregate net flows to EU fund shares react hardly at all to management
fees, and even less to cost-adjusted net returns.
DLT key implementation challenges: A common view in the financial industry today is that Distributed Ledger
Technology (DLT) has the potential to bring a number of benefits to financial markets, notably more efficient
post-trade processes, enhanced transparency, greater resiliency and reduced costs. These benefits,
however, will not materialise unless important challenges are addressed. This article first discusses some of
the technical aspects of the technology with important implications for its application to financial markets. It
then explores three key implementation challenges, namely governance, privacy and interoperability, and
some of the solutions that market participants are considering to address these issues. The article does not
aim to provide an exhaustive overview of the issues raised by the technology nor to discuss possible
legal/regulatory challenges.
EU derivative markets ─ a first-time overview: The article provides first-time data on the EU interest rate,
credit, equity, commodity and foreign exchange derivatives markets in the EU, based on weekly
available EMIR data. We present, for the first time, an overview of the size and structure of EU
derivatives markets by aggregating data across all six trade repositories authorised in the EU,
complementing existing work and taking a broad approach by comprehensively considering the different
markets. Trade repositories are an extensive source of information about derivatives, including bank
and non-bank entities. Information on the size of the different derivative markets, both in terms of the
number of transactions and gross notional amount outstanding, is reported and measures of market
concentration by market participants are computed. Finally, this article shows the shares of derivative
transactions that occur within the EEA, as opposed to cross-border transactions with non-EEA
counterparts, as well as breaking down over-the-counter and exchange-traded derivatives.

ESMA Report on Trends, Risks and Vulnerabilities No. 2, 2017 6
Trends

ESMA Report on Trends, Risks and Vulnerabilities No. 2, 2017 7
Market environmentMarket performance reflected increasing market confidence and improved expectations on the
economic outlook in the EU and globally. In this context, capital flows in strategies yielding higher
returns increased. These market developments, however, have to be seen in a context of lingering
structural problems, uncertainties related to developments in the cost of debt, and significant political
and event risk. From an EU perspective, Brexit-related risks and uncertainties remain among the most
important political risks and are carefully monitored by ESMA. The contribution of capital market
financing continued to improve but remained limited. To increase its potential, a series of initiatives have
been taken at EU level.
Global and EU economic growth continued on an
upward path. The European Commission (EC)
forecasts GDP to be up by 1.9% in 2017 and 2018,
seeing signs of recovery in all EU member states.1
EA inflation is projected higher than previously
expected, at 1.7% in 2017 and 1.6% in 2018.2
Questions around the resilience of the recent
recovery in global growth, and high and, in some
cases, rising corporate and public debt levels
across the world remain a cause of concern for
markets, while fiscal discipline in Europe is starting
to bear fruit.3
The brighter economic outlook stands in contrast to
significant sources of uncertainty in the market
environment. In EU, political and policy risks
remain (T.3), with Brexit among the most important
sources of uncertainty. Recently, markets
discussed the possibility of cliff effects in the wake
of negotiation outcomes. This and other potential
Brexit impacts should be carefully monitored.
Market participants need to assess potential
business implications and prepare accordingly.
Globally, geo-political developments and the rise
of nationally-oriented policy agendas may affect
the commitment to international financial market
policy cooperation. Concerning monetary policy
developments, the consistency of international
monetary stances, the timing of monetary
decisions, and their possible repercussions on the
cost of debt are key topics. In the EU, evidence
shows how high levels of corporate debt and non-
performing bank loans have reduced investment
and a balanced capital allocation.4 Finally, concerns
over the profitability of the EU banking sector and
high non-performing loans in selected member
states continued to shape market sentiment.
1 European Commission, “European Economic Forecast,
Spring 2017”. 2 European Central Bank, "March 2017 ECB staff
macroeconomic projections for the euro area". 3 International Monetary Fund, "Fiscal Monitor April 2017". 4 IMF, “World Economic Outlook”, April 2017. 5 European Commission, “Communication from the
Commission to the European Parliament, the Council, the
EU market performance echoed the positive news
flow. Valuations remained solid and historical
volatilities subdued across asset classes (T.1, T.2),
as presented in greater detail in the Trend section
of this publication. Market confidence increased in
the financial sector (T.4), sustained by market
response to the results of the French presidential
and legislative elections, whose outcome was met
with benign equity and bond market reaction.
Sustained market confidence has been mirrored in
increasing fund inflows, focusing on North
America and EMs (A.114). Search for higher
returns is also revealed in portfolio investment
flows. There has been rebalancing towards non-
EA securities (especially debt) by EA and non-EA
area investors, although less so than in 4Q16 (T.5).
Favourable financing conditions prevailed, as
shown by the increase in non-financial corporation
(NFC) loan and market financing: debt securities
financing grew by 5% between 1Q16 and 1Q17,
against 1% in loan financing (T.8). Nevertheless,
capital markets continue to play a limited role
compared to loan financing. Against this
background the EC has been launching a series of
initiatives5 to increase investment opportunities and
accessibility to funding, including the:
— Capital Markets Union aiming at increasing
capital market liquidity and diversifying the
financing base for the EU economy;6
— European Fund for Strategic Investments
supporting risk finance for SMEs and mid-cap
companies;
— Pan-European Venture Capital Fund aimed at
enlarging VC investments.
European Economic and Social Committee and the Committee of the Regions”, November 2016.
6 European Commission, “Communication from the Commission to the European Parliament, the Council, the European Economic and Social Committees and the Committee of the Regions on the Mid-Term Review of the Capital Markets Union Action Plan”, June 2017.

ESMA Report on Trends, Risks and Vulnerabilities No. 2, 2017 8
T.1 T.2 Market performance Market volatilities
Equity prices sustained, commodities decreased Volatility at low levels
T.3 T.4
Economic policy uncertainty Market confidence
Uncertainty in EU Uneven but above 5Y moving average
T.5 T.6
Portfolio investment flows Equity investment flows
Net outflows Increased MFI investment flows
T.7 T.8
Institutional investment flows Market financing
Strong bond fund outflows in 4Q16 Positive annual growth
50
60
70
80
90
100
110
Jun-15 Oct-15 Feb-16 Jun-16 Oct-16 Feb-17 Jun-17Equities CommoditiesCorporate bonds Sovere ign bonds
Note: Return i ndices on EU equities (Datastream regional index), gl obalcommodities (S&P GSCI) converted to EUR, EA corporate and sovereign bonds(Iboxx Euro, all maturities). 01/06/2015=100.
Sources: Thomson Reuters Datastream, ESMA.
0
10
20
30
40
Jun-15 Oct-15 Feb-16 Jun-16 Oct-16 Feb-17 Jun-17Equities CommoditiesCorporate bonds Sovere ign bonds
Note: Annualised 40D volatility of return indices on EU equities (Datastreamregional index), global commodities (S&P GSCI) converted to EUR, EA corporateand sovereign bonds (Iboxx Euro all maturities), in %.
Sources: Thomson Reuters Datastream, ESMA.
0
10
20
30
40
0
100
200
300
400
500
Jun-15 Oct-15 Feb-16 Jun-16 Oct-16 Feb-17 Jun-17
EU US Global VSTOXX (rhs)Note: Economic Policy Uncertainty Index (EPU), devel oped by Baker et al.(www.policyuncertai nty.com), based on the frequency of articles in EUnewspapers that contain the followi ng triple: "economic" or "economy",
"uncertain" or "uncertainty" and one or more policy rel evant terms. Gl obalaggregation based on PPP-adjusted GDP wei ghts . Implied volatility of EuroStoxx50 (VSTOXX), monthly average, on the right-hand side.Sources: Baker, Bloom, and Davis 2015; Bloomberg, ESMA.
0
10
20
30
40
Jun-15 Oct-15 Feb-16 Jun-16 Oct-16 Feb-17 Jun-17
Financial intermediation Insurance and pensionAuxiliary activities Overall financial sector5Y-MA overall
Note: Eur opean Commission survey of EU financial services sector andsubsec tors (NACE Rev.2 64, 65, 66). C onfidence indicators are averages of thenet balance of responses to ques tions on development of the busi ness situati on
over the past three months , evol ution of demand over the past thr ee months andexpectation of demand over the next three months, in % of answers received.Sources: European Commission, ESMA.
-150
-100
-50
0
50
100
150
Apr-15 Aug-15 Dec-15 Apr-16 Aug-16 Dec-16 Apr-17Equity assets Long term debt liabilitiesEquity l iabili ties Short term debt assetsLong term debt assets Short term debt liabili tiesTota l net flows
Note: Bal ance of Payments statistics, financial accounts, portfolio inves tments byasset class . Assets=net purchases (net sales) of non-EA securities by EAinvestors. Liabilities=net sales (net purchases) of EA securities by non-EA
investors. Total net flows=net outflows (inflows) from (into) the EA. EUR bn.Sources: ECB, ESMA.
-250
0
250
500
750
1Q12 1Q13 1Q14 1Q15 1Q16 1Q17Govt. and househ. Other financeInsurance and pensions MFIsNFC 1Y-MA
Note: Quarterly Sector Accounts . Investment flows by resi dent sec tor i n equity(excluding investment fund shares) and debt securities, EUR bn. 1Y-MA=one-year moving average of all investment flows.
Sources: ECB, ESMA.
-200
-100
0
100
200
300
400
1Q12 1Q13 1Q14 1Q15 1Q16 1Q17Bond funds Equity fundsHedge funds Real estate fundsInsurance and pensions Other1Y-MA
Note: EA i nstitutional investment flows by type of investor, EUR bn.Other=financial vehicle corporations, mixed funds, other funds. 1Y-MA=one-yearmoving average of all investment flows.
Sources: ECB, ESMA.
-15
-5
5
15
25
0
25
50
75
100
1Q12 1Q13 1Q14 1Q15 1Q16 1Q17Debt securities Equity, IF sharesLoans Unlisted sharesOthers Market financing growth (rhs)
Note: Quarterly Sector Accounts . Liabilities of non-financial corporations (NFC),closing balance sheet positions , all original maturities, by debt type as share oftotal liabilities. Others include: fi nancial derivatives and employee stock opti ons;
insurance, pensions and standar dised guarantee schemes; trade credits andadvances of NFC; other accounts r eceivable/payable. Market financing growth:annual growth in debt securities and equity and investment fund (IFs) liabilities.Sources: ECB, ESMA.

ESMA Report on Trends, Risks and Vulnerabilities No. 2, 2017 9
Securities marketsIn 1H17, equity markets continued to gain across member states amid generally subdued volatility.
Economic conditions ameliorated in the EU, monetary policy remained supportive, and concerns around
the political environment in some EU member states abated, yet remaining prominent. Developments
in corporate and sovereign bond yields were mixed, although funding costs remained historically very
low. Net short positions on EA sovereign debt increased in 1Q17, which was mirrored by strong growth
in EA repo transaction volumes. Liquidity indicators signalled a benign trading environment, despite a
slight deterioration in sovereign bond market liquidity conditions. Persistently low spreads in EU
corporate and covered bond markets suggest that search-for-yield strategies continue. Conditions on
securities financing markets have been volatile since the beginning of the year, reflecting signs of a
potential scarcity of high-quality collateral in the EU financial system.
Equity: positive sentiment prevails
In 1H17 EU equity prices continued to increase,
rising around 5% from the end of 2016 and taking
cumulative gains to 20% since June 2016. Similar
developments could be observed across
individual EU equity markets (T.9). The improved
outlook for economic growth and reduced
deflation risk contributed to this trend, together
with monetary policy support for asset prices.
T.9 Price performance of national indices
Broad-based increase
Financial shares performed particularly well,
gaining 11%. Within financial shares, financial
services equities outperformed other sub-sectors
of the system, up 16.5% compared to 11.5% for
banks and 6% for insurance companies (A.17).
Equity price volatility remained stable during the
analysis period and low by historical standards.
In June short-term implied volatility in EA equity
markets was around 15%, well below its long-
term average of 21%, while in the US it stood at
10% (A.2, A.20).
EU equity market liquidity also improved, with
the composite ESMA equity illiquidity indicator
remaining below its long-term average during
most of the period (A.23).
In contrast with the decline observed in 2016, the
total value of EU equity issuance picked up,
driven by follow-on issuance rather than IPOs.
Issuance in 1H17 amounted to EUR 87bn,
compared to EUR 60bn in 1H16 (A.14). Together
with improved valuations, this recovery seems to
reflect the positive sentiment that has prevailed in
EU equity markets so far in 2017. Issuance was
particularly strong in the financial sector, which
amounted to EUR 40bn in 1H17, up from EUR
14bn in 1H16 (T.10). The industry and services
sector also experienced strong growth, with
equity issuance increasing by 28%.
T.10 Equity markets
Rising financial sector issuance in 1H17
In securities lending markets, the average
balance of EU equities on loan remained broadly
stable in 1H17 compared to 1H16, with
EUR 198bn on loan, above the five-year average
of EUR 168bn (A.74). Equity lending activity
picked up sharply in 2Q17, reflecting seasonal
activity around dividend payments and reportedly
due to short-selling activities in the French stock
market ahead of the presidential elections.
However, aggregate net short positions on EU
blue chip equities remained broadly stable until
the end of 1Q17 (A.83).
60
70
80
90
100
110
120
Jun-15 Oct-15 Feb-16 Jun-16 Oct-16 Feb-17 Jun-17
EuroStoxx 50 CAC 40 DAX
FTSE 100 FTSE MIB IBEXNote: National equity i ndices , selec ted EU members, indexed with01/06/2015=100.Sources: Thomson Reuters Datastream, ESMA.
0
20
40
60
80
100
120
2Q12 4Q12 2Q13 4Q13 2Q14 4Q14 2Q15 4Q15 2Q16 4Q16 2Q17
Finance Industry and services
Real estate Util ities, mining and energyNote: EU equity issuance by sector, EUR bn. Finance includes: Banki ng andinvestment services; insurance; investment trusts.Sources: Thomson Reuters Eikon, ESMA.

ESMA Report on Trends, Risks and Vulnerabilities No. 2, 2017 10
Bonds: yield developments mixed
EU sovereign bond issuance declined to
EUR 376bn in 1H17, down significantly from EUR
699bn in 1H16. This was driven mainly by a 60%
fall in EU issuance during 2Q17 year-on-year
(A.25). The average quality of bonds issued
remained stable (A.26) and the quality of
outstanding bonds ceased deteriorating, with
AAA-rated bonds amounting to around 50% of all
EU government bonds outstanding (A.27).
Developments in EU sovereign bond yields
were mixed (T.11). During the first quarter of
2017, 10Y sovereign yields increased across EU
markets, by more than 20bps for the largest EA
countries. However, bonds traded sideways
during the second quarter, with yields up sharply
again in DE and NL, but down in FR, IE and PT.
As a result, 10Y sovereign bond spreads to DE
Bund tightened in 2Q17, with PT experiencing the
steepest decrease (A.31), and yield dispersion
declining (A.32).
T.11 Sovereign bond markets
Yield increases
Market liquidity conditions in the EA sovereign
bond market segment deteriorated in 1H17,
reflected in a higher ESMA illiquidity indicator
(A.38), slightly higher bid-ask spreads (A.37) and
lower turnover ratios.
Corporate bond issuance remained strong in
1H17, with EUR 571bn issued, compared to
532bn in 1H16. This was driven almost entirely
by a 26% increase in high-yield bond issuance, to
EUR 101bn (A.41). By sector, the volume of debt
issued by utilities and energy companies saw the
steepest increase (+54%) to 47bn, while
issuance by industrial and services companies
rose 23% to EUR 173bn, signalling robust
economic activity in the non-financial sector
(A.42). Hybrid capital issuance totalled
EUR 50bn, on a par with 1H16 (A.45).
The credit quality of corporate bonds
outstanding continued to deteriorate, with the
share of corporate bonds rated AA or higher
slipping to 22% in 2Q17 from 26% in 2Q16, and
the share of BBB-rated bonds increasing from
22% to 25% over the same period (A.44).
Yields in corporate bond markets were mixed,
with increases in triple to single-A rated bonds
ranging from 3 to 18bps (A.47), but tighter credit
risk premia on BBB-rated bonds, where yields
were down 6bps, suggesting that search-for-yield
behaviour may continue to prevail in certain
segments of the market (A.48). EU central banks’
asset purchases (with EUR 92bn held by the ECB
as of June 2017, i.e. around 5% of outstanding
EU corporate bonds) continued to shore up
corporate bond valuations.
In contrast to sovereign bond markets, EA
corporate bond market liquidity improved in
1H17, as reflected in narrower bid-ask spreads
(below 0.4% in June 2017 compared to 0.5% at
the end of 2016) and a low Amihud coefficient
(A.49).
Repo: increased repo market volumes
Net short positions on EU sovereign debt
reported by market participants (i.e. including
positions above certain thresholds) increased
sharply (A.85). This mainly reflected a sharp
increase in duration-adjusted short positions on
Euro Area government debt in the fourth quarter
of 2016.
T.12 Euro Area repo markets
Trading volumes are growing
This trend in short positions on sovereign debt
markets was also evidenced by strong growth in
repo market volumes (T.12). Average daily
trading volumes in EA centrally-cleared
government bond repos rose to EUR 189bn in
1H17, up from EUR 157bn in 2H16, primarily
reflecting a 17% increase in the volume of
transactions collateralised with French
government bonds. This was against the
backdrop of volatile repo market activity towards
the end of 2016 (A.71 and Box T.13).
-1
0
1
2
3
Jun-15 Oct-15 Feb-16 Jun-16 Oct-16 Feb-17 Jun-17
DE BE ESFR IT SEGB 5Y-MA
Note: Yiel ds on 10Y sovereign bonds, selec ted EU members, in %. 5Y-MA=five-year moving average of EA 10Y bond indices computed by Datastream.Sources: Thomson Reuters Datastream, ESMA.
80
100
120
140
160
180
200
220
Aug-15 Dec-15 Apr-16 Aug-16 Dec-16 Apr-17 Aug-17
Volume 1M-MANote: 1M-MA of specific and general collateral transaction volum es executedthrough CCPs in seven sovereign EUR repo markets (AT, BE, DE, FI, FR, IT andNL), EUR bn. Index volumes filter out atypical transactions.
Sources: RepoFunds Rate, ESMA.

ESMA Report on Trends, Risks and Vulnerabilities No. 2, 2017 11
T.13 Securities financing markets
High-quality collateral scarcity
At the end of 2016, the euro repo market experienced a sharp
increase in volatility. The interest rate charged on government
bond repo collateral from DE, FR and NL fell sharply to almost
-6%, with repo rates on so-called special collateral (i.e.
securities with specific characteristics that are in high
demand) falling as low as -15% on occasion. Euro area repo
markets experienced a new bout of volatility at the end of
1Q17, although the price movements were smaller in scale
(T.14).
T.14 Euro Area special collateral repo rates
Strong volatility in euro repo markets
According to market intelligence, the seasonal effect in repo
markets at the turn of the year was reinforced by three main
factors that combined with thin liquidity from reduced year-end
activity:
— a significant increase in dealers’ and leveraged funds’
short positions;
— a reduced supply of collateral in the market due to ECB
government bond purchases;
— banks hoarding high-quality collateral to fulfil their
Liquidity Coverage Ratio (LCR) requirements.
T.15 Repo specialness in EA government bonds
Increase in collateral scarcity premia
These events took place in a context of rising Euro Area
collateral scarcity premia7, already flagged by ESMA in recent
publications. Indeed, the difference between general
collateral and special collateral repo rates increased
significantly in 2H16 and remained at comparatively high
levels in 1H17, in particular for bonds in very high demand
(the highest percentiles of the distribution; T.15).
7 For a detailed analysis of collateral scarcity premia, see
ESMA Working Paper No. 1, 2017, “Collateral scarcity premia in Euro Area repo markets”.
In addition to the cost they impose on repo market
participants, repo market price dislocations of this kind can
lead to financial instability as they contribute to liquidity risk
(including rollover transactions), volatile funding costs, and
reduced market confidence.
While the bilateral repo market is essentially interdealer, the
fungibility of collateral securities implies that market
participants were also impacted in other securities financing
markets. For example, the fees paid for borrowing German
government bonds in securities lending markets, where asset
managers tend to be much more active, also jumped to
unprecedented highs at the end of 2016, and to a lesser
extent at the end of 1Q17 (T.16).
T.16 German government bond lending fees
Jump in cash-collateralised Bund lending fees
The spike in fees was particularly pronounced for open-term
Bund loans collateralised with cash. This may seem
surprising, as high-quality liquid assets borrowed against
lower-quality securities (so-called “collateral upgrades”) can
only be eligible under the LCR requirement when borrowed
on a fixed-term basis. While this may suggest that the LCR
was not the primary driver of the spike, the larger jump in fees
for cash collateralised trades can also be explained by the
existence of bank or balance-sheet levies on cash holdings in
a tight collateral environment.8
In contrast to cash sovereign bond markets, EU
sovereign CDS spreads tightened by 10bps
since the beginning of the year, remaining well
below their 5Y average (A.35). The decline was
particularly pronounced for countries with higher
spreads, such as Portugal (-95bps) and Italy
(-32bps). The notional value of outstanding CDS
on EU sovereigns also fell in 1H17 by around 9%
in USD terms (to USD 49bn), partially driven by
currency valuation effects (A.36).
Notwithstanding this decline in one segment of
derivatives markets, the global notional amount
of exchange-traded derivatives (ETDs)
outstanding increased to around USD 84tn in
1Q17, up from USD 73tn a year ago (+15%).
ETDs mainly comprise short-term interest rate
derivatives in the form of options (60% of the
total) and futures. Daily average turnover on EU
exchanges increased to USD 2.7tn in March
8 For more details, see ICMA Quarterly Report, April 2017.
-6
-5
-4
-3
-2
-1
0
Jun-16 Aug-16 Oct-16 Dec-16 Feb-17 Apr-17 Jun-17
Netherlands France Germany Italy
Note: Special collateral rates on centrally-clear ed bilateral r epos ,collateralised with government bonds from DE, FR, NL and IT, in %.Sources: RepoFunds Rate , ESMA.
0
5
10
15
20
25
Jun-15 Oct-15 Feb-16 Jun-16 Oct-16 Feb-17 Jun-17Median 75th perc 90th perc
Note: Median, 75th and 90th percentil e of w eekly special ness, measured as thedifference between general collateral and special collateral repo rates ongovernment bonds in selected countries.
Sources: RepoFunds Rate, ESMA.
0
20
40
60
80
100
120
140
160
180
Jun-15 Oct-15 Feb-16 Jun-16 Oct-16 Feb-17 Jun-17
Non-cash CashNote: Securities l endi ng fees on German governm ent bond loans, by type ofcollateral, in basis points.Sources: Markit Securities Finance, ESMA.

ESMA Report on Trends, Risks and Vulnerabilities No. 2, 2017 12
2017, from 1.5tn in March 2016, still significantly
below the average USD 7tn traded daily on US
exchanges (T.17).
T.17 Quarterly turnover in exchange-traded derivatives
USD appreciation increases turnover in the US
The volume of OTC derivatives outstanding
shrank in 2H16, measured either by gross
notional or market value, reflecting a fall in the
volume of interest rate derivatives (A.95, A.96).
This could be related partly to the progressive
introduction of mandatory clearing for some of the
main IRS products in EU.9 The BIS estimates that
the global share of interest rate derivatives
contracts centrally-cleared as of December 2016
stood at 76% of notional outstanding. 10
Securitised product and issuance in 1Q17
remained subdued, with EUR 16bn issued, on a
par with 1Q16 and despite a partial recovery in
2H16 (A.81). The share of issuance placed
remained high relative to previous years, at
around 44%.
Covered bond issuance was equally subdued in
1H17, with EUR 128bn issued in total, down from
168bn in 1H16 (A.82). After rising at the end of
last year, covered bond spreads declined slightly
in 1H17 across rating categories, particularly so
for BBB-rated securities (A.54).
In EU money markets, the EONIA and the three-
month Euribor have remained broadly stable
since the beginning of the year while the declining
trend in money market activity seemed to
stabilise (A.87). The Euribor-OIS spread
remained very low, under 3 basis points,
reflecting benign conditions and limited EA
banking sector counterparty risk perception
(A.88).
9 ESMA, 2017, Infrastructures, TRV No.1 and TRV No.2
2017.
10 BIS, 2017, OTC Derivatives statistics at end-December 2016.
0
2
4
6
8
2001 2003 2005 2007 2009 2011 2013 2015 2017
North America EuropeAsia/Pacific Other1Y-MA Europe
Note: Global aver age daily turnover in exchange-traded derivatives by exchangelocation, in USD tn. "Europe" as defined by BIS.Sources: Bank for International Settlements, ESMA.

ESMA Report on Trends, Risks and Vulnerabilities No. 2, 2017 13
Investors Investment fund returns rebounded in 1H17, especially for equity funds, mirroring the development in
EU equity markets amid a brightening economic outlook. Investor sentiment improved among both
institutional and retail investors. Despite stronger returns for equity funds, investors in general focused
their investments on bond funds and other fixed income funds, which attracted the majority of the
EUR 241bn of inflows. MMFs also recorded positive flows but faced a seven-year high for outflows in
June. Within the bond fund category, search-for-yield behaviour was apparent as funds focusing on EM
securities recorded inflows. Overall in 1H17, investment funds had AuM worth EUR 11.8tn, an increase
of 6% since December 2016. Corporate bond funds experienced positive flows. However, the
percentage of their cash holdings temporarily dropped 0.8 percentage points below their four-year
average, subsequently recovering in June. ETF AuM grew again by 13% in 1H17.
Investment funds: equity funds
outperform, flows into FI
Investment fund returns rebounded in 1H17,
mirroring developments in the underlying asset
markets. Equity funds, ETFs and commodity
funds were prominent. In 1H17 equity fund
returns increased by 0.8 percentage points (pps)
to 1.4%, outperforming the rest of the fund
industry. Similarly, ETFs’ performance rose 0.4
pps to an average monthly return of 0.9%
calculated over a one-year period. Commodity
funds exhibited a monthly return of -0.5%,
receding by 1.4 pps since 4Q16. Oil prices in
particular softened at the end of 1Q17 before
rebounding amid uncertainty over OPEC
production cuts. Other asset classes delivered
slightly increasing or stable returns in 2017, e.g.
mixed (0.5%), bond (0.2%) alternative (0.3%) and
real estate funds (0.2%) (T.18).
T.18 Fund performance
Equity funds outperform
Fund fees and charges play a significant role in
determining the net returns to investors, and their
levels are a concern to regulators and
supervisors. We provide initial evidence from our
analyses in this area in the article on investor
11 ESMA, 2017, The impact of charges on mutual fund
returns, TRV No. 2 2017, page 38.
protection in the Vulnerabilities section of this
Report. 11
Fund flows were concentrated into FI funds in
1H17, with bond funds (EUR 118bn) and mixed
funds (EUR 68bn) attracting the bulk of the new
investment (EUR 241bn in total). Despite their
positive performance, investment in equity funds
was relatively lower (EUR 39bn of inflows) (T.19).
This compares to outflows observed in 2016.
Within the bond fund category, investors in
search-for-yield focused on EMs (EUR 23.5bn),
and to a lesser extent on HY funds (EUR 10bn)
(A.114, A.117). In contrast, funds investing
mainly in government bonds continued to
experience outflows (EUR 7bn).
T.19 Fund flows
Flows concentrated in FI funds
Having faced strong outflows at the end of 2016,
corporate bond funds experienced positive
reversals. However, the proportion of their cash
holdings temporarily declined in 1Q17 by 0.8
pps, remaining below its four-year average
before recovering in June. This trend will need to
be monitored, as lower cash holdings potentially
reduce the redemption capacity during stress
events, especially if faced with a combination of
-2
-1
0
1
2
3
Jun-15 Dec-15 Jun-16 Dec-16 Jun-17
Alternatives Equity
Bond Commodity
Mixed Assets Real Estate
Note: EU-domiciled investment funds' annual average monthly returns, asset weighted, in %.Sources:Thomson Reuters Lipper, ESMA.
-40
0
40
80
120
160
Jun-15 Oct-15 Feb-16 Jun-16 Oct-16 Feb-17 Jun-17
Tota l EU Equity Bond Mixed
Note: EU-domiciled funds' 2M cumulative net flows, EUR bn.Sources: Thomson Reuters Lipper, ESMA.

ESMA Report on Trends, Risks and Vulnerabilities No. 2, 2017 14
high outflows and liquidity dry-up in the corporate
bond market (T.20).
T.20 Cash holdings in corporate BF portfolio
Cash holdings improved end-1H17
The sector’s AuM in the EA stood at EUR 11.8tn
in April 2017, increasing by 6% since December
2016. Equity funds (+7% with AuM of EUR 3.2tn)
drove this development. The AuM of hedge funds
and real estate funds rose by 4%, while mixed
and bond funds grew by 5% to EUR 3.0tn and
EUR 3.5tn respectively (A.109). The fund sector’s
NAV increased by 5% in April 2017 from
December 2016 to EUR 10.6tn, implying stable
leverage (A.111).
MMFs: regulation expected to
strengthen the sector
T.21 MMF flows by domicile
Outflows at the end of 1H17
The average return for EU MMFs increased
temporarily, before receding due to the
persistently low interest rate environment. The
lowest performing funds posted average monthly
returns below -0.4% (A.123). The 0.7
percentage-point improvement was driven in
particular by the rebound in returns for MMFs
denominated in JPY in 1Q17, which have been
volatile during the last year in a context of
negative interest rates.
12 Regulation (EU) 2017/1131 of the European Parliament
and of the Council on money market funds.
MMFs recorded positive flows in both EU and US
funds (EUR 23bn) (T.21) over the reporting
period, despite a marked decline in June
(EUR 37bn). Of note are the structural
developments characterising the MMF segment
with the implementation of new regulation.
The EU MMF Regulation was adopted on
14 June 2017.12 Standard MMFs will continue to
use variable net asset value (VNAV), while only
short term government funds will be allowed to
use a constant net asset value (CNAV). The
Regulation also creates a new category called
low volatility net asset value (LVNAV) meant to
be more resilient to runs by investors. It will make
tools such as liquidity fees, gates and suspension
of redemption available to the fund manager in
order to address liquidity issues and redemption
pressures. The Regulation also strengthens the
requirements on eligible assets, liquidity, credit
assessment and transparency. Finally, MMFs will
be obliged to conduct stress tests regularly (at
least bi-annually), on the basis of ESMA
guidelines. Potential vulnerabilities will be
reported to NCAs and ESMA.
Alternative funds: positive returns
T.22 Hedge funds’ performance by strategy
Positive performance for most strategies
The EU alternative fund industry reported positive
returns for most strategies in 1Q17 (T.22).
Distressed debt (7.4%), EMs (6.3%),
fundamental (6.2%) and equity (3.2%) stood out,
benefitting from the growth in EU equity markets
as well as the improving economic outlook. CTA
(-1.4%) and volatility (-0.6%) were the only
strategies to post negative returns. CTA funds
holding long positions in energy were penalised
in 1Q17 by the initial decline in oil prices.
EA hedge funds’ AuM augmented 2% to EUR
427bn from December 2016 to March 2017. Their
NAV increased by 3%, to EUR 344bn. As a result
0
2
4
6
Jun-15 Oct-15 Feb-16 Jun-16 Oct-16 Feb-17 Jun-17
Cash 4Y-AVGNote: Cash held by EU corporate bond funds, in % of portfolio holdings. Short positions can have a negative value.Sources: Thomson Reuters Lipper, ESMA.
-100
-50
0
50
100
Jun-15 Dec-15 Jun-16 Dec-16 Jun-17
EU USNote: MMF 2M cumulative net flows by domicile, EUR bn.Sources: Thomson Reuters Lipper, ESMA.
-4
0
4
8
Arb
itra
ge
CT
A
Dis
tre
ss
ed
EM
Eq
uity
Ev
en
t
Fix
ed
In
co
me
Fo
Fs
Fu
nd
am
en
tal
Glo
ba
l M
acr
o
Mu
lti
Oth
ers
RV
Vo
latil
ity
3Q16 4Q16 1Q17 2Q17Note: Quarterly mean sector returns of EU hedge fund by strategy, in %.Sources: BarclayHedge, Eurekahedge, TASS, HFR, ESMA.

ESMA Report on Trends, Risks and Vulnerabilities No. 2, 2017 15
financial leverage, measured as the AuM/NAV
ratio, declined to 1.24 in March 2017 from 1.25 in
December 2016 (A.137).
ETFs: growing competition
In 1H17, EU ETF performance was characterised
by positive returns, persistently low volatility
(down by 38% year-on-year) and decreasing
tracking error. EU ETF NAV stood at EUR 568bn
in 1H17, having risen by 13% since December
2016 and 29% year-on-year (T.23).
T.23 NAV by asset type
ETFs continue to grow rapidly
This reflects both valuation effects and positive
flows: EU ETFs received inflows of EUR 53.5bn
in 1H17, the highest half-yearly score since 2010.
The EU ETF market is still far smaller than its US
counterpart (NAV of EUR 2.6tn). US ETFs
received inflows of EUR 226bn during 1H17, up
from EUR 56bn during 1H16 (A.141).
Equity funds represent the bulk of the ETF
industry with 70% of the assets, followed by bond
funds (25%). Commodity ETFs grew by 25% in
the first quarter (59% year-on-year) but still
represented only 3% of the industry. In general
terms, the growth in ETFs whose underlying
assets are not very liquid could generate
liquidity mismatches. ETF shares themselves
are deemed liquid, as they are traded on
secondary markets. So-called Authorized
Participants, as defined by IOSCO13, ensure that
ETF shares are traded close to their NAV price
by arbitraging on ETF share prices between the
primary and secondary markets. However, this
arbitrage mechanism does not increase liquidity
in the underlying market, especially not during
periods of market stress.14 In extreme situations,
ETF management companies find it impossible to
13 IOSCO, June 2013, “Principles for the Regulation of
Exchange Traded Funds”.
14 ESMA, 2014, “Performance and risks of exchange-traded funds”, TRV No. 2 2014.
trade the underlying assets and consequently
refuse to redeem units, as was the case after the
Greek stock exchange closure in July 2015.15
Similarly, there are some concerns around
Authorized Participants’ capacity to absorb
excessive liquidity demand during periods of
stress. In an extreme situation, the Authorized
Participants could withdraw from the market and
thus pass on the stress to the underlying assets.
The Authorized Participants would then act as the
channel through which liquidity risk is transmitted
between the ETF and the underlying instruments.
T.24 Average beta values for EU ETFs
Beta of leveraged ETFs twice unleveraged ETFs
Since leveraged funds can enhance returns at
the cost of potentially higher losses, they can rank
among the best or worst-performing funds. This
was the case during the reporting period for
leveraged funds exposed to commodity markets
and leveraged equity funds exposed to energy,
with some outperforming the rest of the EU ETF
industry, while others underperformed. However,
since most ETFs are UCITS, their ability to use
leverage is restricted. On average, leveraged
ETFs had a beta of 2.3, making them more than
twice as volatile as the market (T.24)
There are indications that investors, both
institutional and retail, are increasingly focusing
on passive managed strategies and ETFs. For
retail investors this happens in a context of retail
investor fees remaining higher than the charges
paid by institutional investors. For details on fund
charges and costs, the analysis in the Investor
Protection article of the Vulnerabilities section in
this Report provides initial quantitative evidence
for the EU.16 The growth of strategic beta ETFs
(or “smart beta”) is contributing to the trend. To
some extent, strategic beta ETFs are passive
15 AMF, February 2017, “ETFs: characteristics, overview and risk analysis – the case of the French market”.
16 ESMA, 2017, The impact of charges on mutual fund returns, TRV No. 2 2017, page 38.
0
150
300
450
600
Jun-15 Dec-15 Jun-16 Dec-16 Jun-17
Mixed Assets Alternatives Money Market Commodity
Other Bond Equity
Note: NAV of EU ETFs by asset type, EUR bn.Sources: Thomson Reuters Lipper, ESMA.
-3
-1.5
0
1.5
3
Jun-15 Oct-15 Feb-16 Jun-16 Oct-16 Feb-17 Jun-17
Unleveraged (short) Unleveraged (long)
Leveraged (short) Leveraged (long)
Note: Leveraged ETFs are self-reported. The annual average monthly beta ismeasured as the volatility of a fund return i n comparison to its benchmark. Anunleveraged ETF replicating its benchmark will typically have a beta close to 1.0.
Sources: Thomson Reuters Lipper, ESMA.

ESMA Report on Trends, Risks and Vulnerabilities No. 2, 2017 16
funds seeking to achieve objectives similar to
active management but at a lower cost, thus
intensifying competition in the asset management
sector. Strategic beta ETFs track a benchmark
like most ETFs, the only difference being that the
components are weighted by some different
criteria. The strategy allows the manager to
increase (or reduce) the exposure to various risk
factors such as volatility.
T.25 Strategic beta ETFs
ETFs competing with actively managed funds
EU strategic beta ETFs represented EUR 40bn of
AuM in 1H17, up from EUR 29.9bn in 1H16, with
50% following a dividend-screened (or weighted)
strategy (T.25). They seek to deliver equity
income by weighting stocks based on the
characteristics of their dividend payments, for
example. Other strategies include value
strategies, selecting stocks characterised by
some form of undervaluation, and low volatility
strategies, selecting and weighting their
constituents on the basis of historical volatility.
Retail investors: improving sentiment
T.26 Retail portfolio returns
Returns higher than the 5Y average
Retail investor portfolio returns were at a
monthly average rate of 0.4% in 1H17, having
been below zero for most of 2016 (T.26). This
trend was largely driven by equity performance,
with the equity component of collective
investment schemes in the representative
portfolio growing at 1% per month on average in
1H17.
In 1H17, investor sentiment among retail
investors improved significantly, with the
measure of current sentiment reaching its highest
level since 2011 (T.27), consistent with the
increase in portfolio returns. Expectations of
future performance, even if somewhat lower – in
line with perceived political uncertainty in major
EA economies – were nonetheless at their
highest level since 2015.
T.27 Investor sentiment
Continuing rise in confidence
Disposable income growth among EA
countries remained solid in 4Q16 at 2.0% on an
annualised basis, though falling from 2.6% in
3Q16, a five-year high (A.151). The continued
firm growth in household disposable incomes
may have supported investor confidence.
T.28 Asset growth
Growth in real assets higher than in financial
For financial and non-financial assets held by
EA households annualised real asset growth
remained robust at a level of 4.4% in 4Q16,
comfortably above its near-zero five-year
average (T.28). Real assets grew faster than
financial assets throughout 2016, with the latter
growing at 3% in 4Q16, down from a five-year
high of 3.9% in 2Q16 but markedly up from a
near-zero level in 1Q16 and beyond its five-year
average. In the four years to end-2015, in
0
15
30
45
Jun-15 Dec-15 Jun-16 Dec-16 Jun-17
Value Other Multi-Factor Low volati lity Dividend
Note: AuM of strategic beta ETFs, EUR bnSources: Morningstar, ESMA
-0.5
0.0
0.5
1.0
Jun-15 Oct-15 Feb-16 Jun-16 Oct-16 Feb-17 Jun-17Returns 5Y-MA
Note: Annual average monthly returns for a representative portfolio forhouseholds, in %. Asset weights, computed using ECB Financial Accountsby Institutional Sectors, are 37% for collective investment schemes (ofwhich 12% mutual funds and 25% insurance and pension funds), 31% fordeposits, 22% for equity, 7% debt securities and 3% for other assets.
-10
0
10
20
30
40
50
Jun-15 Oct-15 Feb-16 Jun-16 Oct-16 Feb-17 Jun-17
EA institutional current EA private current
EA institutional future EA private futureNote: Sentix Sentiment Indicators for Euro Area private and current ins tituti onalinvestors on a 10Y horizon. The zero benchmark is a risk-neutral position.Sources: Thomson Reuters Datastream, ESMA.
-4
-2
0
2
4
6
8
1Q12 1Q13 1Q14 1Q15 1Q16 1Q17Financial assets Real assets5Y-MA financial assets 5Y-MA real assets
Note: Annualised growth rate of EA-19 households' real and financial assets, in%. 5Y-MA=five-year moving average of the growth rate.Sources: ECB, ESMA.

ESMA Report on Trends, Risks and Vulnerabilities No. 2, 2017 17
contrast, financial asset growth had outstripped
that of real assets, though the gap had been
narrowing for some time against a backdrop of
loosening monetary policy and cheaper
mortgages to finance real estate purchases.
Growth rates across asset classes of household
financial assets ameliorated in 1Q17 compared
to 1Q16, especially for shares (+11pps) and debt
securities (+5pps). In contrast the growth rate on
loans was negative over last year, -18 pps
(A.154). This decline is probably also related to
investors seeking higher returns.
T.29 Household assets to liabilities ratio
Increasing since 1H16
EU households held around EUR 34tn of financial
assets in 1Q17 versus EUR 10tn of financial
liabilities (T.29). The household asset-to-
liability ratio reached a five-year high,
underpinned by asset growth, having previously
peaked in 1Q15 following several quarters of
roughly constant deleveraging in the sector. The
rate of growth in both household financial assets
and loans remained fairly flat, however, in the
face of low yields and limited availability of credit
to households.
The market for structured retail products, at
around EUR 600bn of AuM, is a relatively small
segment of retail investments, representing
around 2% of total financial savings in the EU and
under a tenth of the AuM in UCITS funds.
However, these typically complex products may
expose investors to underlying upside and
downside risks, and market trends can reveal
changes in investor behaviour. 17
Total outstanding volumes of structured products
issued to retail investors in the EU over the five
year period from 2011 to 2016 contracted. In
1H17, in terms of volumes, the outstanding was
almost at 2016 levels while in terms of numbers
of contracts, levels were already higher (A.163).
17 Sources: ECB and Morningstar. 18 For further details on the evolution of the EU regulatory
framework, see ESMA Opinion, 2014, “Structured Retail
The decline in volumes over the last five years
may be related to the supply side, also in the light
of changes in market practices, and the
regulatory environment. An increasing number of
products have been listed on exchanges. On-
exchange products tend to be issued in smaller
volumes than OTC products, the latter typically
being sold through large distribution networks.
Several regulatory changes have characterised
this market in recent years, both country-specific
and also EU-wide, aimed at enhancing consumer
and investor protection.18
Growth products, which offer a potential capital
return, represent more than half of this market,
peaking in 2015 with a share of 61% against
income products and products mixed between
growth and income. This suggests that the
majority of retail investors who buy structured
products do not have pressing liquidity needs.
Nevertheless, pure income products gained
share in 2016 to 39% of volumes sold, up from
33% in the previous year (A.170).
Structured products can be classified by the level
of capital protection they offer the investor,
ranging from products with a capital guarantee of
greater than 100% (i.e. a guaranteed return) to
those with no capital protection (i.e. the capital is
at risk if underlying assets fall in value). In the six
years to end-2016, the share of 100% capital-
protected products declined whereas that of
capital-at-risk products increased (A.168). This
trend is likely to be at least in part attributable to
the low interest rate environment and the
consequent search for yield by investors.
While the vast majority of structured retail
products (in terms of the number of products
issued) are short-term (i.e. less than two years’
duration), as regards volumes there is a more
even split between short-term, medium-term (two
to five years’ duration) and long-term (greater
than five years’ duration) structured retail
products. For the first time in five years, in 2016
short-term products registered higher sales than
long- and medium-term. One explanatory factor
is that investors appear to be more optimistic
about the near-term market outlook than over
longer time horizons (T.30). Moreover, the higher
returns offered by short-term products have
become more attractive for savers and investors
in a low-interest-rate environment and may reflect
search-for-yield behaviour.
Products – Good practices for product governance arrangements”.
300
310
320
330
340
0
5
10
15
20
25
30
35
1Q14 3Q14 1Q15 3Q15 1Q16 3Q16 1Q17
Assets Liabilities Assets/Liabil ities ratio ( rhs)
Note: EU households' financial assets and liabilities, EUR tn. Assets/Li abilitiesratio in %.Sources: ECB, ESMA.

ESMA Report on Trends, Risks and Vulnerabilities No. 2, 2017 18
T.30 Investment term
Shorter-term products in demand
The incidence of detrimental outcomes as
measured by the overall volume of consumer
complaints made directly to NCAs fell in 2H16,
marking a three-year low, compared with the
previous six months (A.159). 1H16 saw a spike in
aggregate complaints, attributable to underlying
issues in relation to contracts for difference
(CFDs) in 2015, complaints being a lagging
indicator, and issues around bank resolutions
and the provision of CFDs.
The two leading causes of complaints filed with
NCAs in 2H16 were the execution of orders
(34%) and the quality or lack of information (26%)
(T.31). The share of complaints relating to the
execution of orders was broadly unchanged
versus the first half of 2016 and explained chiefly
by an ongoing issue in one Member State in
relation to resolution measures involving several
banks. The share of complaints relating to the
quality or lack of information, on the other hand,
was up around five percentage points, though
this in fact represented a decrease in absolute
number (-30% decrease in reported complaints
relating to quality or lack of information in 2H16
compared to 1H16).
T.31 Complaints by cause
Main cause is execution of orders
Regarding the type of financial instrument
cited in complaints filed in 2H16, the share of
complaints referring to debt securities rose from
around 20% to 26%, its highest proportion since
the first half of 2014 (A.162). This trend related to
resolution measures in two member states and to
company failures.
Finally, compared to 2H15 when the bulk of
complaints related to non-bank institutions
(mainly issues linked to CFD providers), in 2016
the majority of complaints referred to banks
(74%), the largest share in the previous three
years (A.160).
0
40
80
120
160
2011 2012 2013 2014 2015 2016
Long Term (>6 years) Medium Term (>2 and <=6 years)
Short Term (<=2 years)
Note: Annual volumes of struc tured products sold to retail inves tors by i nvestmentterm, EURbn.Sources: Structured Retail Products, ESMA.
0
20
40
60
80
100
1H14 2H14 1H15 2H15 1H16 2H16
Execution of orders Investment advicePor tfolio management Quality/lack of informationFees/charges General adminUnauthorised business Other causes
Note: C omplaints reported directly to NCAs by financi al instrum ent, % of total. Datacollected by NCAs.Sources: ESMA complaints database.

ESMA Report on Trends, Risks and Vulnerabilities No. 2, 2017 19
Infrastructures and services In 1H17, equity trading activity increased slightly, hovering around its long-term average. The
composition of trading remained broadly stable, with the majority of transactions occurring via electronic
order books and activity conducted through dark pools and off-order books remaining limited. On trading
venues, unlike 2H16 no market events led to spikes in circuit breaker occurrences. With respect to
central clearing, the rate of centrally cleared products remained broadly stable. In 1H17, ESMA added
seven CCPs to its list of third-country central counterparties recognised to offer services and activities
in the EU. In addition, the second delegated regulation requiring mandatory clearing of certain index
CDSs took effect for CCP clearing members in February 2017. With regard to financial benchmarks,
the number of Euribor panel contributors remained stable at 20 banks and no significant irregularities
in Euribor quote submission and calculation were observed.
Trading venues: increased turnover
Equity turnover on EU trading venues increased
slightly in 1H17, now being above its long-term
average. The turnover conducted via electronic
order books (53%) continued to decline, standing
at a lower level than end-2016 (58%). The share
conducted via trade reporting facilities (TRF)
increased slightly, reaching 31% (from 28.9% in
December). Off-order book continued to increase
their share, climbing to 13.4% from 10.4% at the
end of 2016 (T.32).
Even if the majority remains electronic order
book, an increasing amount of transactions were
conducted via dark pools. Dark pools offer
benefits to institutional investors wishing to buy
and sell large blocks of instruments while
avoiding any significant market impact. However,
some other market participants are
disadvantaged by the lack of transparency and
availability of information. ESMA continues to
monitor these dynamics, also with a view to
guaranteeing transparency and market efficiency
in its role of ensuring orderly markets, investor
protection and financial stability.
T.32 Equity turnover by transaction type
Above long-term average
Meanwhile, the proportion of trading on
multilateral trading facilities (MTFs) declined in
the reporting period from 7.5% in December 2016
to 6.0% in May 2017. Most of the trading
continued to take place on regulated markets
(A.175). Trading turnover on exchanges
remained dominated by equity trading, which
accounted for 74% of the total turnover in May
2017. Around 25% of transactions involved bond
trading, while ETFs and UCITS amounted to 1%
and 0.2% respectively (T.33).
T.33 Equity turnover by type of asset
Increase in 2Q17
Over the reporting period, there were no major
market events leading to spikes in circuit
breaker occurrences, although a significant
number of circuit breakers were triggered on EU
equity markets on days of high-market activity
such as the day following the first round of the
French presidential elections. Circuit breakers
are trading-venue-based mechanisms designed
to manage periods of high volatility by halting
trading whenever the price of a security falls out
of a predetermined price range; trading resumes
after the securities affected are put into auction.
Based on commercial data on a sample of 10,000
financial instruments traded on EU venues,
throughout 1H17 more than 100 circuit breakers
were triggered per week on average (A.179).
According to ESMA registers on suspensions
and removals, at the end of 1H17 18 financial
instruments were suspended from trading on
EEA trading venues. These ongoing suspensions
0
500
1,000
1,500
2,000
Jun-15 Oct-15 Feb-16 Jun-16 Oct-16 Feb-17 Jun-17Dark pools EOBOff-order book TRFAll trading 2Y-AVG
Note: Monthly equity turnover on EU tradi ng venues by transacti on type. EUR bn.2Y-AVG=two-year average of all trading, EOB=Electronic Order Book,TRF=Trade Reporting Facilities.
Sources: FESE, ESMA.
0
10
20
30
40
0
500
1,000
1,500
2,000
2,500
Jun-15 Oct-15 Feb-16 Jun-16 Oct-16 Feb-17 Jun-17
Bonds Equities ETFs (rhs) UCITS ( rhs)Note: Monthly turnover on EU trading venues by type of assets, in EUR bn. D atafor Aquis Exchange, BATS Chi-x Eur ope, Equiduct, London Stock Exchange,TOM MTF and Turquoise are not reported for bonds, ETFs and UCITS.
Sources: FESE, ESMA.

ESMA Report on Trends, Risks and Vulnerabilities No. 2, 2017 20
are mostly due to undisclosed price-sensitive
information awaiting public release (A.171). In
1H17 68 financial instruments were removed
from trading (A.172).
CCPs: stable central clearing
In 1Q17, seven CCPs were added to the list of
third-country central counterparties recognised to
offer services and activities in the EU.19 This
brings the number of third-country CCPs
recognised in the EU to 29 institutions. In
February 2017, the second delegated regulation
requiring mandatory clearing of certain index
CDS took effect for clearing members.20 Clearing
members are now required to clear two index
CDSs (five-year untranched iTraxx Main Index
CDS and five-year untranched iTraxx Crossover
Index CDS).
T.34 IRS CCP clearing
OIS and swaps back to pre-March-drop levels
Central clearing of IRSs dropped in mid-
February for all instrument types but picked up
again in May. OIS clearing increased to 90% in
June 2017 from 88% at the end of 2016, while the
share of cleared basis swaps fell to 77%, from
80% at the end of 2016. The proportion of
centrally cleared regular swaps climbed from
77% at the end of 2016 to 79% end-2H17. Levels
of central clearing at the end of 1H17 were on a
par with 2H16 (95%, see T.34). Movements for
FRAs, however, were characterised by a small
drop in February, probably also related to
concerns over market participants’ capacity to
meet the 1 March 2017 deadline for posting
variation margin on their non-cleared derivatives.
While the first phase of the clearing obligation for
certain index CDSs entered into force overall
CDS central clearing was stable. Based on daily
trading volumes, the share of centrally cleared
19 These CCPs are established in The United Arab
Emirates, India, Japan, Brazil and in the US. 20 Commission Delegated Regulation (EU) 2016/592 of 1
March 2016 supplementing Regulation (EU) No 648/2012 of the European Parliament and of the Council with regard
CDSs remained around 80%, only slightly below
its one-year moving average (A.188).
CSDs: increased settlement activity
for sovereign bonds
Continuing its regulatory effort, in 1H17 ESMA
issued two sets of guidelines on implementation
of the Central Securities Depositories
Regulation (CSDR). These deal with access by
a CSD to the transaction feeds of a CCP or
trading venue and with the identification of
relevant currencies and the substantial
importance of a CSD for a host Member State.
Settlement activity and settlement fail rates
increased following the T2S migration of one
large Member State’s market in February.
However, activity exhibited diverse dynamics.
Settlements in government bonds increased
strongly in the opening months of 2017,
subsequently dropping in April and then
increasing again in May and June (A.189).21 This
may be linked to heightened activity on
government bond markets in early 2017 related
to the EU political calendar. Instead, settlements
in equities were broadly stable over 1Q17 but
then rose sharply in May due to increased activity
by one Member State.
T.35 Settlement fails
Volatile for equity, increase for government bonds
Across markets, the percentage of settlement
fails was, as usual, higher for equities. The fail
rate increased significantly above its average for
equities, again driven by one Member State,
while remaining around the average for
government and corporate bonds (T.35).
to regulatory technical standards on the clearing obligation.
21 The downward spike at the end of the year for government bonds is seasonal.
60
70
80
90
100
Jun-15 Oct-15 Feb-16 Jun-16 Oct-16 Feb-17 Jun-17
Swap Basis Swap OIS FRA
Note: OTC interest rate derivatives cleared by CCPs captured by Dealer vs. CCPpositions, in % of total noti onal amount. Spikes due to short-term movements innon-cleared positions.
Sources: DTCC, ESMA.
0
2
4
6
8
10
Jun-15 Oct-15 Feb-16 Jun-16 Oct-16 Feb-17 Jun-17
Corporate bonds 6M-MA corpEquities 6M-MA equitiesGovernment bonds 6M-MA gov
Note: Share of fail ed settlement instruc tions in the EU, in % of value, one-weekmoving averages. 6M-MA=six-month moving average. Free-of-paymenttransactions not considered.
Sources: National Competent Authorities, ESMA.

ESMA Report on Trends, Risks and Vulnerabilities No. 2, 2017 21
CRAs: increased coverage for smaller
players and smooth rating changes
T.36 Number of EU countries in which CRAs operate
Broad EU coverage for the top three CRAs
The CRA industry in the EU remains
concentrated around three large players (S&P,
Moody’s and Fitch), issuing 80% of all
outstanding ratings, while smaller CRAs look to
generate more revenue by enlarging their
coverage or expanding into new markets.22 The
number of outstanding ratings from the three
largest CRAs has been declining on average
since 2015 across all rating products. Meanwhile,
the number of outstanding ratings issued by the
rest of EU-registered CRAs has increased. This
trend is particularly pronounced for covered
bonds, structured finance and sovereign and sub-
sovereign instruments, whose ratings issued by
EU CRAs other than the three largest have
increased since 1H15 by about 300%, 200% and
37%, respectively (A.193, A.194).
In terms of geographical coverage, of 26 EU-
registered CRAs only the three largest have EU-
wide coverage, issuing ratings for entities located
22 ESMA, ESMA’s supervision of credit rating agencies,
trade repositories and monitoring of third-country central counterparties, 2017.
23 According to Article 5(2) of the Commission Delegated Regulation (EU) 2015/2 of 30 September 2014 supplementing Regulation (EC) No 1060/2009, an asset-backed security includes auto loans, boat loans, airplane loans, student loans, consumer loans, small and medium-
and/or instruments traded in all the 28 EU
member states (T.36). Only three other CRAs
cover more than 20 member states. At the other
end of the spectrum, eight CRAs operated within
national borders as of the end of 2016.
T.37 Distribution of issuer credit rating changes
Concentrated in the range -1/+1 notches
In 1H17, 88% of issuers’ credit rating changes
were in the range of +1/-1 notches and occurred
on average across all sectors. However, the
frequency distribution is not uniform among
different sectors. About 60% of financials’ rating
changes referred to upgrades, while ratings on
sovereign issuers registered slightly more
upgrades than downgrades, 58% versus 42%,
occurring solely in the range of -1/+1 notches.
The frequency distribution of rating changes for
non-financials issuers is broadly symmetric,
ranging from -6 notches to +5 notches (T.37).
Recent trends in rating changes at asset class
level showed structured finance products
continuing their positive trend in terms of positive
rating drift in 2017 (more upgrades than
downgrades, see A.63), despite varying
significantly between different sub-categories of
structured products. 76% of rating changes for
asset-backed securities in 2017 were upgrades,
while downgrades occurred mainly in commercial
and residential-mortgage backed securities,
which also registered more frequent multi-notch
rating changes (T.38).23
sized enterprise loans, healthcare loans, manufactured housing loans, film loans, utility loans, equipment leases, credit card receivables, tax liens, non-performing loans, recreational vehicle loans, leases to individuals, leases to businesses, and trade receivables.
0 4 8 12 16 20 24 28
F
M
SP
FE
EUI
DBRS
C
AM
S
CIR
D
EH
ARC
GBB
BCRA
CRIF
RA
ASS
AX
CE
ERA
E
ICAP
INC
MF
2015 2016
Note: Number of EU countries in or in respect of which EU regis tered CRAs issued creditratings. F = Fitch, M = Moody's, SP = Standard and Poor's, FE = Feri Eurorati ng, EUI = T heEconomist Intelligence Unit , C = Creditreform, AM = A.M. Best Eur ope, S = Scope Rating,
CIR = Capital Intelligence Ratings , D = Dagong, EH = Euler Hermes, ARC = ARC Ratings,GBB = GBB-Rating, RA = Rating Agentur, ASS = ASSEKURATA Assekuranz Rating, CE =CERVED, ERA = European Rating Agency, E = EuroRating, MF = ModeFinance.Sources: RADAR, ESMA.
0
10
20
30
40
50
60
70
-7 -6 -5 -4 -3 -2 -1 1 2 3 4 5 6 7
Non-Financia ls Financials Insurance Sovereign
Note: Distributi on of rating changes on issuers (i. e. upgrades and downgrades)in notches. Long-term ratings only. Both forei gn currency and local currency.Data for 2017 year-to-date.
Sources: RADAR, ESMA.

ESMA Report on Trends, Risks and Vulnerabilities No. 2, 2017 22
T.38 Frequency distribution of securitised products
Mostly upgrades for ABS
Financial benchmarks: stable Euribor
panel
On 30 June 2016 the Benchmarks Regulation
(BMR) entered into force to be fully applicable as
of January 2018 (for details see T.41).24 In August
2016 the EC designated Euribor as a critical
benchmark,25 with a total estimated value of
instruments referenced on it of at least
EUR 500bn on the basis of the full range of
maturities and tenors as required by the
Regulation. For critical benchmarks, the BMR
provides for the formation of a college of national
supervisors and ESMA to take key decisions. As
of June 2017, Euribor and EONIA are the only
benchmarks designated as critical by the EC.26
The BMR stipulates that input data for the
benchmark calculation should be transaction
data, if available and appropriate. Strengthening
the transactions base of major interbank offered
rates in the EU has proved more difficult than
anticipated, raising important questions as to the
long-term strategy in this market.
The Euribor panel composition remained
stable in 1H17 at 20 banks (A.195). Our risk
indicators do not identify any significant
irregularity in submission and calculation during
the reporting period.27 The dispersion of quotes
submitted for the Euribor calculation increased
slightly in early 1H17 before stabilising and
declining in late 1H17, probably related to
improved EU economic forecasts. In the reporting
period the maximum difference between the
quotes submitted and Euribor was observed in
24 Regulation (EU) 2016/1011 of the European Parliament
and of the Council of 8 June 2016.
25 On 28 June 2017, EONIA was designated as a critical benchmark by the Commission Implementing Regulation (EU) 2017/1147 of 28 June 2017.
26 ESMA, 2013, ESMA-EBA Principles for Benchmark-Setting Processes in the EU, ESMA/2013/659. IOSCO, 2013, Principles for Financial Benchmarks, Final Report.
the six-month tenor (T.39). Lower dispersion may
reflect improved market confidence and reduced
divergences in the banks’ credit risk assessment.
T.39 Euribor contributions
Decline in 1H17
The gap between the actual Euribor28 and the
non-trimmed average for the three-month tenor
narrowed end-1H17, as the top 15% of submitted
quotes was markedly reduced (T.40).
In 1H17, the three-month Euribor rate was
broadly stable, with 3% of banks lowering the
previous-day submission, 2% raising their quotes
and 95% keeping them unchanged (A.198).
Finally, in 2017 the three-month Euribor
remained below the ECB interest rate for the
main refinancing operations.
T.40 Dispersion of submission levels
Decrease in the top 15%
In the UK, the Bank of England (BoE) recently
published a feedback consultation paper on the
reform of SONIA, the widely used sterling
unsecured overnight interest rate benchmark.29
The key change to SONIA is that it will in future
27 Our risk indicators are based on the data publicly available on the EMMI website.
28 The current Euribor calculation builds on a quote-based methodology, where the highest and lowest 15% of submitted quotes are eliminated in order to prevent any individual contributors from influencing the rate. The remaining quotes are then averaged.
29 Bank of England, “The Reform of SONIA”, 2017.
0
10
20
30
40
50
-9 -8 -7 -6 -5 -4 -3 -2 -1 1 2 3 4 5 6 7 8 9
ABS CDO CMBS RMBS
Note: Distribution of rating changes on structured fi nance products (i.e. upgradesand downgrades) in notches. Long-term ratings only. Asset-backed securitiesrefers to securities backed by assets other than debt obbligations , residential
and commercial mortgages. Data for 2017 YTD.Sources: RADAR, ESMA.
0
0.1
0.2
0.3
Jun-15 Oct-15 Feb-16 Jun-16 Oct-16 Feb-17 Jun-17Note: N ormalised differ ence in percentage points between the highestcontribution submitted by panel banks and the correspondi ng Euribor rate. Thechart shows the maximum difference across the 8 Euribor tenors.
Sources: European Money Markets Institute, ESMA.
-0.5
-0.4
-0.3
-0.2
-0.1
0.0
0.1
0.2
Jun-15 Oct-15 Feb-16 Jun-16 Oct-16 Feb-17 Jun-17Top 15% Core 70%Bottom 15% Raw 3M Euribor3M Euribor ECB refinancing rate
Note: Dispersion of 3M Euribor submissions, in %. T he "Raw 3M Euribor" rate iscalculated without trimming the top and bottom submissions of the panel for the3M Euribor.
Sources: European Money Markets Institute, ESMA.

ESMA Report on Trends, Risks and Vulnerabilities No. 2, 2017 23
capture a broader range of unsecured overnight
deposits by including bilaterally negotiated
alongside brokered transactions.
T.41 EU financial benchmarks
EU Benchmarks Regulation
In September 2013, in the wake of the manipulation of various
benchmarks, the European Commission issued a draft
Regulation on indices used as benchmarks in financial
instruments and financial contracts (Benchmarks Regulation).
The Benchmarks Regulation (Regulation (EU) 2016/1011)
was published in the Official Journal of the EU on 29 June
2016 and entered into force on 30 June 2016 to apply from 1
January 2018. ESMA is mandated by the European
Commission to develop more than 10 regulatory and
implementing technical standards by April 2017.
On 11 February 2016, ESMA received a request from the
European Commission for technical advice on possible
delegated acts. The ESMA Technical advice under the
Benchmarks Regulation was delivered on 10 November 2016.
On 15 February 2016, ESMA published a Discussion Paper
(DP) on the Benchmarks Regulation. The DP included
ESMA’s policy orientations and initial proposals on both the
technical advice to the Commission and the draft technical
standards under the Benchmarks Regulation.
On 29 September 2016, ESMA published a Consultation
Paper on the draft technical standards under the Benchmarks
Regulation, including that on oversight function, code of
conduct for contributors and authorisation/registration of
administrators. The consultation period ended on 2 December
2016.
On 30 March 2017 ESMA published its final report containing
the draft regulatory and implementing technical standards
(RTS/ITS) under the Benchmarks Regulation and submitted
them to the European Commission.
On 2 June 2017, ESMA published a methodological
framework on the selection of supervised entities for
mandatory contribution under Article 23(7) BMR. The aim of
the methodological framework is to promote convergence in
relation to the supervision of critical benchmarks. ESMA has
developed the framework to assist national competent
authorities in their selection of supervised entities to be
compelled to contribute input data on a critical benchmark,
should its representativeness become at risk at some point in
the future. The methodological framework applies to all
Interbank Offered Rates (IBORs) and to the Euro OverNight
Index Average (EONIA).

ESMA Report on Trends, Risks and Vulnerabilities No. 2, 2017 24
Risks

ESMA Report on Trends, Risks and Vulnerabilities No. 2, 2017 25
ESMA Risk Dashboard
R.1
Main risks
Risk segments Risk categories Risk sources
Risk Outlook Risk Outlook
Outlook
Overall ESMA remit Liquidity
Macroeconomic environment
Systemic stress Market
Low interest rate environment
Securities markets Contagion
EU sovereign debt markets
Investors Credit
Market functioning
Infrastructures and services Operational
Political and event risks Note: Assessment of main risks by risk segments for markets under ESMA remit since last assessment, and outlook for forthcoming quarter. Assessment of main risks by risk categories and sources for markets under ESMA remit since last assessment, and outlook for forthcoming quarter. Risk assessment based on categorisation of the ESA Joint Committee. Colours indicate current risk intensity. Coding: green=potential risk, yellow=elevated risk, orange=high risk, red=very high risk. Upward arrows indicate an increase in risk intensities, downward arrows a decrease, horizontal arrows no change. Change is measured with respect to the previous quarter; the outlook refers to the forthcoming quarter. ESMA risk assessment based on quantitative indicators and analyst judgement.
Overall, ESMA’s 2Q17 risk assessment remained unchanged from 1Q17. EU financial markets were relatively calm, with stable volatility and increasing equity market prices. EU sovereign bond yields hovered around the higher levels reached in 1Q17. Concerns linked to the potential reactivity to political and geo-political events, excessive risk taking in a low interest rate environment and potential market liquidity shortage linked to event-related risk reversals persisted. Therefore, market and credit risks were kept very high, while liquidity and contagion risks remained high. All previously mentioned risks maintained a stable outlook. Operational risk continued to be elevated, but with an increasing outlook due to Brexit-related operational risk issues and the potential for cyber-attacks. Going forward, we expect the political calendar of the EU including Brexit negotiations, policy developments in the US, and geo-political developments to remain the major risk drivers for 2017.
Risk summary
Risks in the markets under ESMA remit remained
at high levels, reflecting very high risk in
securities markets and elevated risk for investors,
infrastructures and services. Our assessment of
the individual risk categories did not change from
1Q17, with market and credit risk very high due
to the persistently low interest rate environment,
continued weaknesses in the EU banking sector
and uncertainty over future geopolitical
developments. Liquidity risk in 2Q17 held its
high level, as liquidity pressures were observed
in segments of the fund industry and in repo
markets. Contagion risk remained high, driven
by potential for increasing interconnectedness
between different segments of financial markets
amplified by the low interest rate environment
and associated incentives for high risk-taking.
Operational risk remained elevated, but with a
heightened risk outlook reflecting prominent
cyber risks, among others. For all other risk
categories the risk outlook remained stable,
reflecting both an improved macroeconomic
environment and the non-materialisation of risk
premia reversals following recent monetary policy
actions in the US.
Systemic stress eased slightly at the beginning
of the reporting period (R.2), with bond markets
as the main risk contributor. Risks linked to the
macroeconomic environment (GDP, inflation)
stabilised, although market uncertainty
surrounding potential changes in the European
monetary policy stance prevailed. Political events
could bring additional uncertainty to financial
markets (Brexit negotiations, elections in EU
member states, US policy agenda).
R.2 ESMA composite systemic stress indicator
Systemic risk broadly stable
-0.4
-0.2
0
0.2
0.4
0.6
Jun-13 Jun-14 Jun-15 Jun-16 Jun-17
Money market contribution Bond market contribution
Equity market contribution ESMA CISS
Correlation contribution
Note: ESMA version of the ECB-CISS indicator measuring systemic stress i n securitiesmarkets. It focuses on three fi nancial market segments: equity , bond and money markets,aggregated thr ough standard portfolio theory. It is based on securities market indicators
such as volatilities and risk spreads.Sources: ECB, ESMA.

ESMA Report on Trends, Risks and Vulnerabilities No. 2, 2017 26
Risk sources
Macroeconomic environment: EU economic
recovery continued in 2Q17, with GDP growth
expected across all EU member states. Private
consumption, the main growth driver in recent
years, is nevertheless set to cool as inflation picks
up. Inflation in the EA recently increased and will
probably hit higher levels in 2017, mainly due to
oil price rises. Investment is expected to
continue, growing moderately as wages are
climbing only gradually and uncertainties around
future policies remain elevated. Significant
downside risks for the EU economic growth
outlook persist. These risks are linked to global
geopolitical events, including the future US policy
stance and Brexit negotiations.
Low interest rate environment: ECB and BoE
monetary policies remained highly
accommodative, not least to mitigate the impact
of the UK EU referendum on financial markets. In
this context, despite the general increase in
sovereign yields since 2H16, which continued in
2Q17, the low interest rate environment and
related search-for-yield strategies represented a
source of concern. The search for higher returns
by EU funds is mirrored in increasing inflows into
bond funds with a focus on EMs (EUR 23.5bn) as
well as North America (EUR 28.4bn) (R.25). On the
other hand, funds investing in government bonds
registered net outflows in 2Q17 (R.26). Excessive
risk taking and capital misallocation thus remain
relevant risk sources in the medium-term outlook.
EU sovereign debt markets: In 2Q17 ten-year EU
sovereign bond yields floated around the higher
levels reached in 1Q17, yet with significant
differences across countries. Ten-year sovereign
bond spreads versus DE Bund narrowed slightly
in 2Q17, with one peripheral country seeing a
significant reduction from 3.6% end-1Q17 to
2.5% at the end of the reporting period. Market
liquidity improved on 2H16, but signs of
uncertainty remained. These were reflected in
bid-ask spreads and developments in the ESMA
composite liquidity index (R.10, R.11), which
were seen to increase a little in May.
Market functioning: No significant disruptions
were observed in the functioning of EU markets.
Central clearing remained at a high level
following entry into force of the first clearing
obligation on G4 currency IRS in 2016 and on
Index Credit Default Swaps on 9 February 2017.
Both settlement activity and settlement fail rates
increased following the T2S migration of one big
Member State’s market in February. The
approach to the final migration wave to T2S in
September 2017 is related to expectations of an
increase in the volumes on this settlement
platform, which contributes to the integration of
post-trade processes across participating EU
markets. Finally, cyber risk is increasingly
becoming a key concern for financial markets
institutions, both with respect to their business
continuity and the integrity of proprietary data, as
illustrated by recent global ransomware attacks.
Financial market infrastructures (FMIs) such as
trading venues, CSDs, TRs and CCPs are
becoming ever more central to the financial
system. But their size and centrality, as well as
their exposure to information technology, render
these infrastructures particularly vulnerable to
cyber attacks.
Political and event risk: Conclusion of the French
presidential elections, a source of significant
market nervousness in the run-up, triggered
benign equity and bond market reactions.
Similarly, immediate market impacts of the British
parliamentary elections were limited and
concentrated on UK equity markets and the GBP
exchange rate. Brexit negotiations are among the
most prominent sources of political risk to the EU
single market. They create substantial
uncertainty over the future economic outlook and
EU institutional arrangements, with key aspects
to be negotiated over the coming months and
possibly years. News flows and announcements
may continue to intensify political and event risk,
increasing uncertainty and sparking greater asset
price volatility in EU markets. This was reinforced
by the uncertainty over the US political agenda in
key policy areas, including potential fiscal stimuli
and financial regulation, and broader geopolitical
developments.
Risk categories
Market risk – very high, outlook stable: In 2Q17
EU equity market prices continued to increase,
e.g. for banks (+3.9%), financials excl. banks
(+5.6%) and insurance (+2.8%). Nevertheless,
these developments were less pronounced than
in the US, as mirrored by the dynamics of the P/E
ratios (R.5). Implied volatilities remained at a low
level. The GBP exchange rate implied volatility
decreased throughout 2Q17 following a peak in
January, notwithstanding the significant drop in
the GBP exchange rate on April 9 (1.5% on
average against EUR and USD). In an
environment of high political uncertainty, with
past elections and their unclear consequences as
well as elections in some EU member states in
2017, markets are still prone to strong reactions
and are expected to remain so during the coming
months.

ESMA Report on Trends, Risks and Vulnerabilities No. 2, 2017 27
Liquidity risk – high, outlook stable: Liquidity in
equity markets remained around its long-term
average levels, with the ESMA composite equity
illiquidity indicator deteriorating in May but
reverting in June (R.4). On corporate bond
markets an improvement in market liquidity was
observed as the bid-ask spread and the Amihud
indicator30 edged down slightly compared to end-
1Q17 (R.16). The sharp drop in repo rates
observed at the end of 2016, documented by
ESMA in earlier publications31, resulted in greater
dispersion between the scarcity premia on bonds
in very high demand (the highest percentiles of
the distribution) and the median premium. This
dispersion was then reduced in 2Q17, though
remaining at comparatively high levels (R.14). In
addition to the cost they impose on repo market
participants, repo market price dislocations can
also lead to financial instability. They contribute
to liquidity risk, volatile funding costs, and
reduced market confidence. High dispersion
levels reflect potential shortages of high-quality
collateral and may endanger financial stability by
increasing liquidity risk and volatility in funding
costs and reducing overall market confidence.32
In 2Q17, sovereign bond market liquidity picked
up from 4Q16 but was slightly less than 1Q17, as
illustrated by the increase in bid-ask spreads
(R.10) and in the ESMA composite sovereign
bond liquidity index (R.11).
Contagion risk – high, stable outlook: In
sovereign bond markets the correlation between
German and other EU countries’ ten-year bond
yields decreased further in 2Q17. Dispersion
increased across member states versus end-
1Q17 levels, with uneven behaviour within the
same group, namely core and peripheral
countries. One peripheral country’s sovereign
bond market drove the bottom 25% dispersion
(R.19). Intra-sectoral fund interconnectedness for
MMFs and HFs decreased in 1Q17 (R.29, R.32).
However, concerns over banking sector balance
sheet issues and their potential contagion for
other sectors, such as insurances and pensions
or funds, are still present.
Credit risk – very high, outlook stable: In 2Q17,
EU corporate bond spreads remained around
their 4Q16 levels. Covered bond spreads, having
30 The Amihud illiquidity ratio is a widely used measure of
stock market illiquidity and evaluates the price impact of trading. It is calculated as the daily ratio of absolute stock returns to its volume, averaged over the chosen period. A smaller value of the coefficient means lower price impact and thus higher liquidity.
31 For example see ESMA TRV No. 1 2017.
also ticked up at the end of 2016, reversed slowly
toward lower levels and remained stable
throughout the reporting period (R.18). The
significant net inflows for EU bond funds whose
assets concentrate on emerging, corporate, high-
yields or mixed strategies seemed to confirm
search for higher returns within the persistently low
interest rate environment. Flows into funds focusing
on emerging economies approximated EUR 24bn
while HY funds’ flows stood at around EUR 10bn
(R.26). In contrast, flows into funds focusing mainly
on government bonds continued to decline. The
credit quality of outstanding corporate bond debt
deteriorated, with the share of corporate bonds
rated AA or higher declined to 22%, in 2Q17,
while the share of BBB-rated bonds increased
from 22% to 25% (R.17). Refinancing
requirements for financials over the medium to long
run (from 3Q17 to 3Q18) were lower than last year
(R.23). Concerns remain at a more global level, also
in relation to high corporate and public debt levels.33
Operational risk – elevated, negative outlook:
Technology and conduct risks remained a key
concern both within and outside the EU. No major
trading disruptions were observed on EU
financial markets in 2017, though a significant
number of circuit breakers were triggered on EU
equity markets on days of high market activity,
such as the day following the first round of the
French elections. The absence of spikes in
quotes submission confirms the improved
reliability and quality of Euribor, underlining the
importance of sound and well-managed financial
benchmarks (R.39). Even though the operational
risk assessment remained unchanged, the risk
outlook is negative. Concerns are deepening
against the background of rising cyber-risk,
uncertainty related to Brexit negotiations and
unexpected difficulties in strengthening the
transactions base of major interbank offered
rates. Moreover, the rapid growth of FinTech and
related effects on the financial sector are
monitored by regulators.34 In effect, FinTech
influences changes in business models and
opens new business opportunities, yet it may also
raise concerns related to data privacy issues,
vulnerability to cyber-crime and associated legal
issues.
32 For more details on high-quality collateral scarcity, see Box 12 in ESMA TRV No. 2 2017, Securities.
33 International Monetary Fund, "Fiscal Monitor April 2017". 34 ESMA response to Commission Consultation on Fintech",
June 2017.

ESMA Report on Trends, Risks and Vulnerabilities No. 2, 2017 28
Securities markets R.3
Risk summary Risk drivers
Risk level – Asset re-valuation and risk re-assessment
– Low interest rate environment and excessive risk taking
– Geo-political and event risks
– Potential scarcity of collateral
Risk change from 1Q17
Outlook for 3Q17
Note: Assessment of main risk categories for markets under ESMA remit since past quarter, and outlook for forthcoming quarter. Systemic risk assessment based on categorisation of the ESA Joint Committee. Colours indicate current risk intensity. Coding: green=potential risk, yellow=elevated risk, orange=high risk, red=very high risk. Upward arrows indicate a risk increase, downward arrows a risk decrease. ESMA risk assessment based on quantitative indicators and analyst judgement.
R.4 R.5 ESMA composite liquidity index Equity valuation
Increased liquidity in June Long-term average in the EA reached
R.6 R.7 Equity prices Financial instruments volatilities
Slight decrease end-2Q17 Stable volatility
R.8 R.9 Exchange rate volatilities Sovereign risk premia
EUR weaker than long-term average Slight decline across countries
0.49
0.50
0.51
0.52
0.53
0.54
0.55
Jun-15 Oct-15 Feb-16 Jun-16 Oct-16 Feb-17 Jun-17
Illiquid ity index 2Y-MA
Note: Composite i ndicator of illiquidity in the equity market for the currentEurostoxx 200 constituents, com puted by applying the principal componentmethodology to six input liquidity measures (Amihud illiquidity coefficient, bid-ask
spread, Hui-Heubel ratio, turnover value, inverse turnover ratio, MEC). Theindicator range is between 0 (higher liquidity) and 1 (lower liquidity).Sources: Thomson Reuters Datastream, ESMA.
0.00
1.00
2.00
3.00
4.00
May-15 Sep-15 Jan-16 May-16 Sep-16 Jan-17 May-17Adjusted P/E EA Average EA
Adjusted P/E US Average US
Note: Monthly ear nings adj usted for trends and cyclical fac tors via Kalman filtermethodology based on OECD l eading indicators; units of standard deviation;averages computed from 8Y. Data available until the end of May 2017.
Sources: Thomson Reuters Datastream, ESMA.
50
60
70
80
90
100
110
120
Jun-15 Oct-15 Feb-16 Jun-16 Oct-16 Feb-17 Jun-17
Non-financia ls BanksInsurance Financial services
Note: STOXX Europe 600 equity total return indices. 01/06/2015=100.Sources: Thomson Reuters Datastream, ESMA.
0
25
50
Jun-15 Oct-15 Feb-16 Jun-16 Oct-16 Feb-17 Jun-17VSTOXX 1M VSTOXX 3MVSTOXX 12M VSTOXX 24M
Note: T op panel: implied volatilities on 1M forward ICAP Euro vs . 6M Euriborswaptions based on the Normal volatility model, i n bp; low panel: Euro Stoxx 50implied volatilities, measured as price indices, in %.
Sources: Bloomberg, Thomson Reuters Datastream, ESMA.
0
40
80
120
Jun-15 Oct-15 Feb-16 Jun-16 Oct-16 Feb-17 Jun-17
2Y 5Y 10Y
0
5
10
15
20
Jun-15 Oct-15 Feb-16 Jun-16 Oct-16 Feb-17 Jun-17
EUR-GBP EUR-USD
GBP-USD 5Y-MA EURNote: Implied vol atilities for 3M options on exchange rates. 5Y-MA EUR is thefive-year movi ng average of the implied vol atility for 3M options on EUR-USDexchange rate.
Sources: Bloomberg, ESMA.
0
4
8
12
16
20
0
1
2
3
4
5
Jun-15 Oct-15 Feb-16 Jun-16 Oct-16 Feb-17 Jun-17
PT IE IT ES GR ( rhs)Note: Selected 10Y EA sovereign bond risk premia (vs. DE Bunds), in %.Sources: Thomson Reuters Datastream, ESMA.

ESMA Report on Trends, Risks and Vulnerabilities No. 2, 2017 29
R.10 R.11 Sovereign bond liquidity – bid-ask spreads ESMA composite sovereign bond liquidity index
Better since end-2016 Improved for domestic MTS
R.12 R.13 Sovereign CDS volumes
Sovereign repo volumes
Stable or decreasing Elevated volumes
R.14 R.15 Repo markets specialness Corporate bond spreads
Reduced dispersion, though still at high levels Broadly stable in 2Q17
R.16 R.17 Corporate bond bid-ask spreads and Amihud indicator Outstanding long term corporate debt
Enhanced corporate bond liquidity Increased share of BBB and lower
0.06
0.08
0.10
0.12
Jun-15 Oct-15 Feb-16 Jun-16 Oct-16 Feb-17 Jun-17
Bid-ask EuroMTS Bid-ask Domestic MTS
1Y MA EuroMTS 1Y MA Domestic
Note: Bid-ask spread as average bi d-ask spread over one month across ten EUmarkets, Domestic and Euro MTS, in %. 1Y MA = one-year moving average.Sources: MTS, ESMA.
0
0.2
0.4
0.6
Jun-15 Oct-15 Feb-16 Jun-16 Oct-16 Feb-17 Jun-17EuroMTS Domestic MTS1Y MA Domestic 1Y MA EuroMTS
Note:Composite indicator of market liquidity i n the soverei gn bond m arket for thedomestic and Euro MTS platforms, computed by applying the principalcomponent methodology to four input liquidity m easur es (Amihud illiquidity
coefficient, Bid-ask spread, Roll illiqui dity measure and T urnover). 1Y MA = one-year moving average. The i ndicator range is between 0 (higher liqui dity) and 1(lower liquidity).Sources: MTS, ESMA.
0
5
10
15
20
Jun-15 Oct-15 Feb-16 Jun-16 Oct-16 Feb-17 Jun-17
DE ES FR IE IT PTNote: Value of outstanding net notional sovereign CDS for sel ected countries;USD bn.Sources: DTCC, ESMA.
80
100
120
140
160
180
200
220
Jun-15 Oct-15 Feb-16 Jun-16 Oct-16 Feb-17 Jun-17
Volume 20D-MANote: 20D-MA of specific and general collateral transaction volumes executedthrough CCPs in eight sovereign EUR repo markets (AT, BE, DE, FI, FR, IT andNL), EUR bn. Index volumes filter out atypical transactions.
Sources: RepoFunds Rate, ESMA.
0
5
10
15
20
25
Jun-15 Oct-15 Feb-16 Jun-16 Oct-16 Feb-17 Jun-17Median 75th perc 90th perc
Note: Medi an, 75th and 90th percentile of w eekly specialness, measured as thedifference between general collateral and special collateral repo rates ongovernment bonds in selected countries.
Sources: RepoFunds Rate (BrokerTec, MTS, ICAP), ESMA.
0
50
100
150
200
250
Jun-15 Oct-15 Feb-16 Jun-16 Oct-16 Feb-17 Jun-17
AAA AA A BBBNote: EA non-financial corporate bond spreads by rating between iBoxx non-financi al corporate yiel ds and ICAP Euro Euribor sw ap r ates for maturities from 5to 7 years, basis points.
Sources: Thomson Reuters Datastream, ESMA.
0.0
0.1
0.2
0.3
0.4
0.5
0.6
0.0
0.1
0.2
0.3
0.4
0.5
0.6
Jun-15 Oct-15 Feb-16 Jun-16 Oct-16 Feb-17 Jun-17
Bid-Ask 1Y-MA Amihud (rhs)
Note: EUR Markit iBoxx corporate bond index bi d-ask spread, in %, computedas a one-month moving average of the iBoxx components in the currentcomposition. 1Y-MA=one-year moving average of the bid-ask spread. Amihud
liquidity coefficient i ndex between 0 and 1. Highest value indicates lessliquidity.Sources: IHS Markit, ESMA.
0.00
0.25
0.50
0.75
1.00
2Q12 2Q13 2Q14 2Q15 2Q16 2Q17
AAA AA A BBB BB and lowerNote: Outstandi ng amount of corporate bonds as of issuance date by ratingcategory, in % of the total.Sources: Thomson Reuters Eikon, ESMA.

ESMA Report on Trends, Risks and Vulnerabilities No. 2, 2017 30
R.18 R.19 Covered bond spreads
Dispersion in sovereign yield correlation
Decrease in 2017 Increased dispersion, lower correlation
R.20 R.21 Sectoral equity indices correlation Debt issuance growth
Lower correlation for banking sector Issuance growth negative for sovereigns
R.22 R.23 Net sovereign debt issuance Debt redemption profile
Negative net issuance in the EU Lower short-term financing needs for financials
0
25
50
75
100
125
150
Jun-15 Oct-15 Feb-16 Jun-16 Oct-16 Feb-17 Jun-17
All AAA AA A 5Y-MA
Note: Asset swap spreads based on iBoxx covered bond i ndices, basis points.5Y-MA=five-year moving average of all bonds.Sources: Thomson Reuters Datastream, ESMA.
-1.0
-0.5
0.0
0.5
1.0
Jun-15 Oct-15 Feb-16 Jun-16 Oct-16 Feb-17 Jun-17
Top 25% Core 50%
Note: Dispersion of correlations between 10Y DE Bunds and other EU countries'sovereign bond redemption yields over 60D rolling windows.Sources: Thomson Reuters Datastream, ESMA.
0.6
0.7
0.8
0.9
1.0
Jun-15 Oct-15 Feb-16 Jun-16 Oct-16 Feb-17 Jun-17Banks Financial ServicesInsurance Non-Financia l Corporation
Note: Correlati ons between daily returns of the STOXX Eur ope 600 and STOXXEurope 600 sectoral indices. Calculated over 60D rolling windowsSources: Thomson Reuters Datastream, ESMA.
-2-10123
SE
C 1
5Q
2
SE
C 1
6Q
2
SE
C 1
7Q
2
HY
15Q
2
HY
16Q
2
HY
17Q
2
IG 1
5Q
2
IG 1
6Q
2
IG 1
7Q
2
CB
15Q
2
CB
16Q
2
CB
17Q
2
MM
15Q
2
MM
16Q
2
MM
17Q
2
SO
V 1
5Q
2
SO
V 1
6Q
2
SO
V 1
7Q
2
90% 10% Current Median
Note: Growth rates of issuance volume, in %, normalised by standard devi ationfor the following bond classes, following Eikon classification: securitised (SEC);high-yield (HY); inves tment grade (IG); covered bonds (CB); money market
(MM); sovereign (SOV). Percentiles computed from 12Q r olling window. All datainclude securities with a maturity higher than 18M, except for MM (maturity l essthan 12M). Bars denote the range of values between the 10th and90th percentiles. Missing diamond indicates no issuance for previous quarter.Sources: Thomsons Reuters Eikon, ESMA.
-200
-150
-100
-50
0
-75
-50
-25
0
25
AT
BE
BG
CY
CZ
DE
DK
EE
ES FI
FR
GB
GR
HR
HU IE IT LT
LU
LV
MT
NL
PL
PT
RO
SE SI
SK
EU
1Y high 1Y low 2Q17
Note: Quarterly net issuance of EU sovereign debt by country, EUR bn. Netissuance calculated as the difference between new issuance over the quarterand outstandi ng debt maturing over the quarter. Highest and l owest quarterly net
issuance in the past year are reported. EU total on right-hand scale.Sources: Thomson Reuters Eikon, ESMA.
-300
-150
0
150
300
0
100
200
300
400
2Q17 2Q18 2Q19 2Q20 2Q21 2Q22
Non-financia ls Financials
1Y-Change Fin (rhs) 1Y-Change Non-fin (rhs)Note: Quarterly redempti ons over 5Y-horizon by EU private financial and non-financi als corporates, EUR bn. 1Y-Change=difference between the sum of thisyear's (four last quarters) and last year's (8th to 5th last quarters) redemptions.
Sources: Thomson Reuters EIKON, ESMA.

ESMA Report on Trends, Risks and Vulnerabilities No. 2, 2017 31
Investors R.24
Risk summary Risk drivers
Risk level – Sustained search-for-yield
– Asset re-valuation and risk re-assessment
– Correlation in asset prices
– Continued inflow into EU fund industry and potential
event-related reversals
Risk change from 1Q17
Outlook for 3Q17
Note: Assessment of main risk categories for markets under ESMA remit since past quarter, and outlook for forthcoming quarter. Systemic risk assessment based on categorisation of the ESA Joint Committee. Colours indicate current risk intensity. Coding: green=potential risk, yellow=elevated risk, orange=high risk, red=very high risk.
Upward arrows indicate a risk increase, downward arrows a risk decrease. ESMA risk assessment based on quantitative indicators and analyst judgement.
R.25 R.26 Cumulative global investment fund flows EU bond fund net flows
Inflows for funds focusing on bonds and EMs High for funds with emerging and mixed focus
R.27 R.28 RoR volatilities by fund type Liquidity risk profile of EU bond funds
Broadly stable volatilities Stable liquidity and mixed maturity changes
R.29 R.30 Money market fund interconnectedness Retail fund synthetic risk and reward indicator
Stabiliser MMFs have slightly stronger impact Decreasing for all but bond and commodity funds
-400
0
400
800
1,200
1,600
2,000
2,400
Jun-15 Dec-15 Jun-16 Dec-16 Jun-17
Europe BF Europe EF
Emerging markets BF Emerging markets EF
North America BF North America EFNote: C umulative net flows into bond and equity funds (BF and EF) over timesince 2004 by regional investment focus, EUR bn.Sources: Thomson Reuters Lipper, ESMA.
-10
-5
0
5
10
15
20
25
Jun-15 Oct-15 Feb-16 Jun-16 Oct-16 Feb-17 Jun-17Corporate Government EmergingHY Mixed Other assets
Note: 2M cumulative net flows for bond funds, EUR bn. Funds investing in corporateand government bonds that qualify for another category are only reported once (e.g.funds investing in emerging government bonds will be reported as emerging; fundsinvesting in HY corporate bonds will be reported as HY).Sources: Thomson Reuters Lipper, ESMA.
0
7
14
21
28
Jun-15 Oct-15 Feb-16 Jun-16 Oct-16 Feb-17 Jun-17
Alternative Equity Bond
Commodity Mixed Real Estate
Note: Annualised 40D historical return vol atility of EU domiciled mutual funds , in%.Sources: Thomson Reuters Lipper, ESMA.
0
20
40
60
80
3 5 7 9
Liq
uid
ity
MaturityOther Funds HY funds Loan funds
Government BF Corporate BFNote: Fund type reported according to the aver age liquidity ratio, in % (Y-axis),the effective average m aturity of assets (X-axis) and size. Each series is reportedfor 2 years, i.e. 2016 (bright colours) and 2017 (dark colours).
Sources: Thomson Reuters Lipper, ESMA.
-15
-10
-5
0
5
10
15
Jun-15 Dec-15 Jun-16 Dec-16 Jun-17
Destabiliser MMF (coeff. +) Stabiliser MMF (coeff. -)
Note: Systemic stress indicator based on products of f ractions of reg ressions withpositive (negative) estimated coefficients for individual fund retu rns' impact on themean sector retu rn and respective estimators. Coefficients stem from VEC models
regressing individual fund returns and moments of the entire industry's returndistribution on lags and general financial market indices. Measures aggregatedacross individual regressions.
Sources: Thomson Reuters Lipper, Thomson Reuter Datastream, ECB, ESMA.
1
2
3
4
5
6
7
Jun-15 Oct-15 Feb-16 Jun-16 Oct-16 Feb-17 Jun-17
Equity Bond Alternative
Commodity Money Market Real EstateNote: The calculated Synthetic Risk and Reward Indicator is based on ESMASRRI gui delines. I t is computed via a simpl e 5-year annualised volatility measurewhich is then transl ated into categories 1-7 (with 7 representing higher levels of
volatility).Sources: Thomson Reuters Lipper, ESMA.

ESMA Report on Trends, Risks and Vulnerabilities No. 2, 2017 32
R.31 R.32 Financial market interconnectedness Hedge fund interconnectedness
Increase for MMFs Low intra-sector interconnectedness
60
65
70
75
80
0
5
10
15
20
1Q12 1Q13 1Q14 1Q15 1Q16 1Q17
Total funds Hedge funds
Bond funds MMFs ( rhs)Note: Loan and debt securities vis-à-vis MFI counterparts, as a share of totalassets. EA inves tment funds and MMFs, in %. Total funds includes: bond funds ,equity funds, mixed funds, r eal estate funds, hedge funds , MMFs and other non-
MMFs investment funds.Sources: ECB, ESMA.
-0.02
-0.01
0
0.01
0.02
May-12 May-13 May-14 May-15 May-16 May-17
Destabiliser HF (coeff. +) Stabiliser HF (coeff. -)Note: Systemic stress indicator based on products of fracti ons of regr essions withpositive (negative) estimated coefficients for individual fund returns' impact onaverage return of sector significant at 99% level and respective average
estimators. Coefficients stem from VAR models regressi ng indivi dual fund returnson l ags and general fi nanci al market indices. Measures aggregated acrossindividual regressions.Sources: Barclayhedge, Eurekahedge, TASS, HFR, ESMA.

ESMA Report on Trends, Risks and Vulnerabilities No. 2, 2017 33
Infrastructures and services R.33
Risk summary Risk drivers
Risk level – Operational risks, including cyber risks
– Conduct risk, including intentional or accidental behaviour by
individuals, market abuse
– Systemic relevance, interconnectedness between
infrastructures or financial activities, system substitutability
Risk change from 1Q17
Outlook for 3Q17
Note: Assessment of main risk categories for markets under ESMA remit since past quarter, and outlook for forthcoming quarter. Systemic risk assessment based on categorisation of the ESA Joint Committee. Colours indicate current risk intensity. Coding: green=potential risk, yellow=elevated risk, orange=high risk, red=very high risk. Upward arrows indicate a risk increase, downward arrows a risk decrease. ESMA risk assessment based on quantitative indicators and analyst judgement.
R.34 R.35 Trading suspensions – lifecycle and removals Circuit breaker trigger events by sector Longer suspensions on average in 2Q17 No major market events
R.36 R.37 Equity market concentration Settlement fails
Concentration slightly lower Increase for equity and corporate bonds in 2Q17
R.38 R.39
IRS CCP clearing Euribor – Dispersion in contributions
OIS and swaps back to pre-March drop levels Decline in 2Q17
0
10
20
30
40
50
0
50
100
150
200
250
300
2Q15 4Q15 2Q16 4Q16 2Q17
Suspensions begun Suspensions ended
Removals Average duration (rhs)Note: Number of dead suspensi ons, split by the quarter during which they startedand ended, and r emovals of financial instrum ents traded on EEA trading venues.Average duration of dead suspensions , in days, computed as the mean of the
difference between the end-of-quarter date and the start date.Sources: ESMA Registers.
0
25
50
75
100
Jun-16 Aug-16 Oct-16 Dec-16 Feb-17 Apr-17 Jun-17
Financials Healthcare
Util ities Industr ials
1M-MA Financials (rhs)Note: Percentage of circuit breaker trigger events by economic sector. Resultsdisplayed as w eekly aggregates .The analysis is based on a sample of 10,000securities, incl uding all constituents of the STOXX Europe 200 Large/Mid/Small
caps and a large sample of ETFs tracking the STOXX index or sub-index.Sources: Morningstar Real-Time Data, ESMA.
0
20
40
60
80
100
Jun-15 Oct-15 Feb-16 Jun-16 Oct-16 Feb-17 Jun-17
Top 25% Core 50% Bottom 25% Median
Note: Concentrati on of notional value of equity trading by nati onal i ndicescomputed as a 1M-MA of the Herfindahl-Hirschman Index, in %. Indices i ncludedare FTSE100, C AC40, DAX, FTSE MIB, IBEX35, AEX, OMXS30, BEL20,
OMXC20, OMXH25, PSI20, ATX.Sources: BATS, ESMA.
0
2
4
6
8
10
Jun-15 Oct-15 Feb-16 Jun-16 Oct-16 Feb-17 Jun-17Corporate bonds 6M-MA corpEquities 6M-MA equitiesGovernment bonds 6M-MA gov
Note: Share of fail ed settlement instruc tions in the EU, in % of value, one-weekmoving averages. 6M-MA=six-month moving average. Free-of-paymenttransactions not considered.
Sources: National Competent Authorities, ESMA.
60
70
80
90
100
Jun-15 Oct-15 Feb-16 Jun-16 Oct-16 Feb-17 Jun-17
Swap Basis Swap OIS FRA
Note: OTC interest rate derivatives cleared by CCPs captured by Dealer vs. CCPpositions, in % of total noti onal amount. Spikes due to short-term movements innon-cleared positions.
Sources: DTCC, ESMA.
0
0.1
0.2
0.3
Jun-15 Oct-15 Feb-16 Jun-16 Oct-16 Feb-17 Jun-17
Note: N ormalised differ ence in percentage points between the highestcontribution submitted by panel banks and the correspondi ng Euribor rate. Thechart shows the maximum difference across the 8 Euribor tenors.
Sources: European Money Markets Institute, ESMA.

ESMA Report on Trends, Risks and Vulnerabilities No. 2, 2017 34
R.40 R.41 Euribor – Dispersion of submission levels Rating changes
Decrease in the top 15% Increasing volatility for financials
-0.5
-0.4
-0.3
-0.2
-0.1
0.0
0.1
0.2
Jun-15 Oct-15 Feb-16 Jun-16 Oct-16 Feb-17 Jun-17
Top 15% Core 70%Bottom 15% Raw 3M Euribor3M Euribor ECB refinancing rate
Note: Dispersion of 3M Euribor submissions, in %. T he "Raw 3M Euribor" rate iscalculated without trimming the top and bottom submissions of the panel for the3M Euribor.
Sources: European Money Markets Institute, ESMA.
0
2
4
6
8
10
12
14
Jun-15 Oct-15 Feb-16 Jun-16 Oct-16 Feb-17 Jun-17Non-Financials Covered Bond Financials
Insurance Sovereign Structured Finance
Note: Volatility of rati ngs by all credi t rating agencies, excludi ng CERVED andICAP, by asset class computed as number of rating changes over number ofoutstanding ratings.
Sources: RADAR, ESMA.

ESMA Report on Trends, Risks and Vulnerabilities No. 2, 2017 35
Vulnerabilities

ESMA Report on Trends, Risks and Vulnerabilities No. 2, 2017 36
Investor protection
The impact of charges on mutual fund returns Contact: [email protected]
This article provides metrics to analyse the impact of ongoing fees, one-off charges and inflation on the
returns of mutual funds. Preliminary evidence for the EU fund industry suggests that over the three–
year horizon, from 2013 to 2015, ongoing fees, one-off charges and inflation reduced the returns
available to investors by 29% of gross returns on average or, in absolute terms, 252bps. While
reductions vary across jurisdictions, asset classes and client types, they apply to all market segments:
Relative return reductions range from 11% for passive equity fund shares to 44% for retail fund shares
in bond mutual funds. Absolute reductions vary from 74 to 398bps, respectively. Relative and absolute
return reductions for actively managed and retail fund shares tend to exceed those of passively
managed and institutional fund shares. In general, these reductions are driven mainly by total expenses,
while sales fees act as a further driver. Investors’ real returns are further reduced by inflation. The
PRIIPs/MiFID framework will provide additional cost information, including distribution fees, to be taken
into account, with particular consideration of the impact such costs could have on return reductions. In
addition, we evaluate whether investors do indeed take fund charges and net returns into account when
making investment decisions. Despite the impact of fees and charges on the net outcome to investors,
these costs do not seem to be reflected in investor choices, given that aggregate net flows to EU fund
shares evidently react hardly at all to management fees, and even less so to cost-adjusted net returns.
Introduction1
This article proposes a methodology to
measure aggregate cost-adjusted returns on
mutual funds. First, the impact of fees and load
charges on investor returns is analysed.
Preliminary results support the notion that
management fees and subscriptions, as well as
redemption charges, and also inflation,
substantially reduce returns on fund shares. A
second, ancillary step analyses the impact of
charges on fund flows. Aggregate investments
in mutual funds are, at best, weakly price- and
cost-sensitive.
Data and methodology
We employ a number of measures to analyse
the impact of charges on returns on
investments in mutual funds (RoI). These
include:
— gross returns on the underlying portfolios;
— returns net of a fund share’s total expenses,
but including distributed income and
1 This article was authored by Giacomo Massa, Julia
Loder and Frank Hespeler.
2 These measures exclude cost components borne by investors but not charged by fund managers, such as brokerage costs, account costs, charges by financial advisors, transaction costs levied by brokers, dealers
— returns net of expenses and charges, i.e.
the second measure reduced by charges
levied by fund managers on the acquisition
and disposition of fund shares;2
— real returns net of all expenses and
charges, i.e. the third measure reduced by
inflation costs.
These metrics are constructed using data
obtained from the Thomson Reuters Lipper
database covering the EU mutual fund universe
for the period January 2013 to December 2015.
To avoid biases due to recent low interest rates,
we complement these metrics with equivalents
for the period from January 2005 to December
2015. As variables, we use entity-specific
share-class data on total net assets (TNA),
annual returns (gross, rG, net of expenses, rnE,
net of expenses/charges, rnEC, and real returns
net of expenses/charges, rnEC), and annual net
flows (flow). EU inflation figures are sourced
from Eurostat. All these data are quarterly. In
addition, we employ static information on asset
and others, and finally also taxes. Inclusion of these cost components is left to future analysis. Therefore, they may conceptually deviate from the new rules specified in PRIIPs/MiFID II to be put in place from 01/01/2018.

ESMA Report on Trends, Risks and Vulnerabilities No. 2, 2017 37
types, domiciles, client types, fund strategies,
and fees and charges levied by funds.
Total expenses and returns net of total
expenses are directly available from our data
sources.3 To incorporate one-time load
charges, such as sales (FL) or redemption fees
(BL),4 we weigh respective one-off charges with
the absolute value of asset-weighted net flows.5
Hence, our net returns decompose as:
𝑟𝑗𝑛𝑒𝑡 = 𝑟𝐺 − 𝑒𝑥𝑝 − 𝑐ℎ𝑎𝑟𝑔𝑒𝑠𝑗 𝑗 ∈ (𝐹𝐿, 𝐹𝐿 + 𝐵𝐿),
with respective reductions in returns through
expenses and charges computed as:
𝑒𝑥𝑝 = (𝑟𝐺 − 𝑟𝑛𝐸)
𝑐ℎ𝑎𝑟𝑔𝑒𝑠𝑗 = |𝑛𝑒𝑡 𝑓𝑙𝑜𝑤𝑠
𝑇𝑁𝐴|(𝑟𝑛𝐸 − 𝑟𝑗
𝑛𝐸𝐶) 𝑗 ∈ (𝐹𝐿, 𝐹𝐿 + 𝐵𝐿).6 7
This approach assumes for each fund share
that net flows correlate perfectly with gross
flows, and accepts the resulting downward cost
bias as inevitable, since gross flows are not
available.8 On the other hand, the partial
employment of maximum load fees, whenever
actual loads are not available, creates an
upward bias, which tends partially to offset the
first bias.9 This effect is substantiated by our
ignoring possible discretionary load fee
reductions granted to attract clients.
Real returns net of charges, expenses and
inflation (IC) are computed as:
𝑟𝑗𝑛𝑒𝑡
= 𝑟𝐺 − 𝑒𝑥𝑝 − 𝑐ℎ𝑎𝑟𝑔𝑒𝑠𝑗 − 𝐼𝐶 𝑗 ∈ (𝐹𝐿, 𝐹𝐿 + 𝐵𝐿).
We report TNA-weighted averages across the
EU mutual fund industry and its various
segments, using two approaches:
3 Total expenses include all fund expenses as reported
by funds, including performance fees. Potential differences in national interpretations of related EU legal concepts for individual expense categories are not necessarily factored in. For details on expense categories please refer to Lipper, 2011.
4 Sales (redemption) fees are defined as one-off fees expressed in percent of share prices and charged when the share is sold (redeemed) by the fund. See Thomson Reuters Lipper, 2011.
5 We follow a different approach from e.g. Davydoff and Klages, 2014, who assume a holding period of 5 years for factoring in the effect of load charges. We argue that a data-driven measure should adequately reflect the aggregate impact of load charges.
6 TNA-weighted net flows are computed as a piecewise function. The denominator of the weight in a given period is the start value in the case of negative net flows and the end value in the case of positive net flows. In addition, we use a threshold value of 1.5 for the absolute value of this variable, dropping all fund shares with a higher value from the analysis.
— a balanced panel requiring full data for all
relevant variables for the entire observation
horizon, and
— an unbalanced panel simultaneously
requiring full data for all relevant variables
in at least one period.
All figures presented use the entire data available for all funds matching the respective panel. Hence, our sampling encompasses the full data universe. With regard to sample sizes, the unbalanced panel presents data on 20,731 EU funds in 1Q13 and on 40,133 in 4Q15. The balanced approach reports data for 18,623 EU funds.
Sample representativeness
V.1 Relative sample deviations in rates of return
Samples representative up to +/- 10%
We illustrate the representativeness of our
sample for the two different sampling
approaches by analysing deviations in samples
from respective populations on fund returns
(V.1) and industry size (V.2).
7 Our method does not explicitly account for discounts received by investors. Such discounts would be more likely for large (institutional) investors and could therefore bias the respective figures upward. In terms of the computation of sales fees, we recalculated from fee-adjusted returns provided in the data source, while redemption fees were used directly, not recomputed from respectively adjusted returns, as the data available for the latter appeared to be of low quality.
8 We acknowledge the restrictive nature of this assumption and the resulting potential underestimation of the impact of fees and charges, as net flows need not necessarily correlate perfectly with gross flows.
9 Our data source, Thomson Reuters Lipper, offers a combination of actual and maximum load fees reported, using maximum loads to substitute for actual ones if the latter data field is empty. It draws on prospectuses and KID documents usually stating maximum amounts of entry charges. These maximum charges may not always reflect the level of actual charges applied. Maximum redemption fees are used for roughly 20% of the fund shares included and remain below 3.5% in 85% of these cases.
-0.5
0.0
0.5
1.0
1.5
EU EU
res
AT PT BE DK FI FR DE IT IE LU NL ES SE UK
Balanced FL Unbal start FL Unbal. end FL
Unbal.start FL + BL Unbal. end FL + BLNote: Rel ative deviati ons of sample fr om populati on in the average rate of grossreturns. Bal anced, unbal. start and unbal. end denote the balanced panel, thebegi nning of the unbalanced panel and its end respectively. FL and BL denote
sales and redempti on fees . Grey area marks the region between 0.9 and 1.1, thatis the regi on where sample fund return do not differ from population return morethan 10%Sources: Thomson Reuters Lipper, ESMA.

ESMA Report on Trends, Risks and Vulnerabilities No. 2, 2017 38
Regarding fund returns, on average EU funds
reporting data on charges adequately represent
the respective return metrics of related
universes. Average returns in samples for the
EU as a whole, as well as for the majority of
individual countries, are within a bound of +/-
10% around respective values for
corresponding subgroups of the entire fund
population.
Regarding the size of the fund industry, in most
instances the samples represent the majority of
respective industry segments of the entire fund
population in terms of the number of funds
(more than 50%) and in respect of the total
assets they manage (more than 60%, not
explicitly reported). Exceptions are samples for
PT and residual EU countries, for which we do
not claim representativeness. Minor deviations
in single criteria for other countries are offset by
the remaining criteria for these countries.
V.2 Relative sample deviations in fund numbers
Most sample segments cover more than 50%
By the same criteria, our results are
representative for most fund types, except for
alternative mutual funds (Alt) and real estate
(RE), for which all our samples show strong
deviations from the respective EU mutual fund
populations (up to 80% deviations in average
returns and coverage).
Breaking down samples further reduces their
representativeness, as fund numbers for
individual sample segments decline, except for
major geographic market segments. For asset
class breakdowns and for institutional and
10 We employ the TER definition by Thomson Reuters
Lipper, which conceptually resembles the TER definition of UCITS as opposed to the ongoing charges to be included in the UCITS IV KIID. One of the main differences between the two concepts is the inclusion of performance fees in the TER.
11 Our load reduction of 55bps for the average EU fund share is of the same order as the respective 31bps
passive market segments in particular,
representative preliminary results are only
available for a minority of markets.
We present results exclusively for the
unbalanced sample, as all results are
qualitatively robust to a switch to a balanced
panel. In addition, an unbalanced panel has the
advantage of including more data in the
analysis.
Cost-adjusted fund returns in the EU
As a first step, we analyse the impact of fees
included in the total expense ratio (TER), i.e.
fund charges designed to cover the costs of
administrating and managing funds,10 on fund
returns. Averaged across mutual fund shares
and the observation period from 13 January
2016 to 15 December 2016, the TER reduced
returns on EU fund shares by 13%. Depending
on the market segment considered, returns net
of total expense fees are 5 to 25% lower than
gross portfolio returns. Expressed in absolute
terms, absolute average return reductions vary
between 16 and 188bps across countries and
asset classes.
As a second step, we factor in the impact of
loads. For sales fees, the average relative
reductions in fund returns vary across different
countries, asset classes and investor types
between 7 and 34%. This adds a further
absolute reduction in fund returns of between 1
and 77bps to the profit reductions caused by the
TER. The respective EU average for the
relative reduction of returns through TER and
sales fees stands at 19%. Next, we factor in
redemption fees, which trim another 0 to 86bps
from gross returns. On average, TER and all
load fees thus reduce the returns on an EU
mutual fund share by 20%.11
Finally, inflation cuts the returns available to
investors by an additional 26 to 149bps,
equivalent to 0.4 to 8.5 percentage points (ppt)
of gross returns, bringing the average real net
return on an EU fund share to 6.32ppt, 29% less
than its respective nominal gross return.
Reductions in fund returns show considerable
geographic heterogeneity across the EU. The
lowest relative reductions due to TER are
reported in Investor Economics (2012) for a sample of Canadian funds and quite close to the estimate of 50bps in Bogle, 2014. Similarly, our average TER reduction of 119bps is of roughly the same size as the average 100bps reported for European funds in Holdt, 2016.
0.0
0.2
0.4
0.6
0.8
1.0
EU EU
res
AT PT BE DK FI FR DE IT IE LU NL ES SE UK
Balanced FL Unbal. start FL Unbal. end FL
Unbal. start FL + BL Unbal. end FL + BL
Note: Relative deviati ons of sample from population, number of funds. Balanced,unbal. s tart and unbal. end denote the balanced panel , the begi nning of theunbalanced panel and its end r espec tively. F L and BL denote sales and r edem ption
fees. Grey area m arks the regi on w hen the rati o sampl e over populati on is betw een0.5 and 1.Sources: Thomson Reuters Lipper, ESMA.

ESMA Report on Trends, Risks and Vulnerabilities No. 2, 2017 39
observed in NL and SE, where additional losses
generated by load fees are also close to zero
(in absolute terms 2-6 bps), as funds frequently
do not charge such fees. On average, the most
pronounced reductions materialise in AT, IT
and LU, with relative reductions due to TER and
loads reaching up to 28% of respective gross
portfolio returns. Substantial contributions by
loads to average relative RoI reductions are
observed for LU and BE, where loads add up to
16 ppt of the overall shrinkage in RoI. While in
most cases the major part of this additional
reduction is generated by sales fees,
redemption fees tend to exceed sales fees in
BE.
V.3 Reduction in fund returns – TER and load charges12
Average rate of, and relative reductions in Return on Investment
Absolute returns Relative return reductions
Gross Net of expenses
Net of expenses and sales charges
Net of expenses, sales and redemption
fees
Net of expenses, sales and
redemption fees, and inflation
Net of expenses
Net of expenses and sales charges
Net of expenses, sales and
redemption fees
Net of expenses, sales and
redemption fees, and inflation
1 2 3 4 5 6 7 8 9
rG rnE rFL
net rFL+BL
net rFL+BL
net (rG-rnE)/rG (rG-rFL
net)/rG (rG-
rFL+BLnet )/rG
(rG-rFL+BL
net)/rG
Geographical heterogeneity
EU 8.84 7.65 7.13 7.11 6.32 13.4% 19.3% 19.8% 28.7%
AT 6.50 5.24 4.66 4.66 3.16 19.4% 28.4% 28.4% 51.4%
BE 10.25 8.70 7.93 7.07 6.27 15.1% 22.6% 31.0% 38.8%
DE 9.15 7.82 7.37 7.37 6.54 14.6% 19.4% 19.5% 28.6%
DK 9.06 7.85 7.71 7.83 7.42 13.4% 14.9% 15.2% 19.6%
ES 6.21 4.99 4.77 4.63 4.37 19.5% 23.1% 26.7% 30.8%
FI 8.58 7.45 7.33 7.35 6.18 13.2% 14.6% 16.0% 29.3%
FR 5.83 4.92 4.56 4.54 3.96 15.6% 21.7% 22.0% 31.9%
IE 7.83 7.05 6.54 6.44 6.15 10.0% 16.5% 17.0% 20.8%
IT 6.54 5.06 4.85 4.80 4.22 22.6% 25.9% 27.7% 36.4%
LU 7.62 6.35 5.61 5.56 4.77 16.6% 26.3% 27.2% 37.5%
NL 11.68 10.67 10.64 10.61 9.52 8.6% 8.9% 9.2% 18.5%
SE 11.65 10.54 10.52 10.52 10.07 9.6% 9.7% 9.7% 13.6%
UK 13.84 12.37 11.82 11.80 10.39 10.6% 14.6% 14.7% 24.9%
Asset classes/Investor type
Equity Ret 15.54 13.82 13.18 13.15 12.21 11.1% 15.2% 15.4% 21.5%
Equity Inst 14.62 13.67 13.18 13.07 12.43 6.5% 9.8% 10.6% 15.0%
Bond Ret 5.96 4.83 4.12 4.07 3.33 18.8% 30.8% 31.9% 44.3%
Bond Inst 6.12 5.52 5.17 5.08 4.25 9.8% 15.6% 16.6% 30.2%
Mixed Ret 9.39 7.68 7.15 7.13 6.24 18.2% 23.9% 24.5% 33.9%
Mixed Inst 9.26 8.13 7.58 7.50 6.74 12.2% 18.2% 19.1% 27.3%
MMF Ret 1.42 1.15 0.94 0.92 0.34 19.0% 33.6% 34.8% 75.7%
MMF Inst 2.89 2.73 2.69 2.68 2.15 5.4% 7.0% 7.3% 25.6%
ETF 11.69 11.31 10.76 10.36 9.84 3.2% 7.9% 11.3% 15.8%
Management type
Active 8.67 7.46 6.92 6.90 6.12 14.0% 20.2% 20.7% 29.7%
Passive 13.12 12.65 12.49 12.44 11.55 3.6% 4.8% 5.2% 11.9%
Active Equity
15.49 13.76 13.09 13.04 12.14 11.2% 15.5% 15.9% 21.7%
Passive Equity
14.82 14.32 14.20 14.16 13.25 3.4% 4.2% 4.4% 10.6%
Note: The first five columns report sample averages of gross returns, returns net of charges, returns net of charges and front load fees, returns net of charges and all load fees and returns net of charges, all loads and inflation. The last four columns report the relative reductions in gross returns generated by charges, the total of charges and front loads, the total of charges and all load fees and, finally the total of charges, load fees and inflation. Formal defini tions for the individual reductions are provided in the “Data and methodology” section in the article. Ret = Retail; Inst = Institutions; all data as of December 2015, in percentage points. The results presented are derived from unbalanced panels, taking into account all available data. Equivalent results using a balanced panel approach, i.e. requiring full data for all variables, do not significantly differ in most cases. Columns 1-3 and 6-8 are based on the sample for which front load data are available. Columns 4-5 and 8-9 build on the samples for which front and back load data are available. Source: Thomson Reuters Lipper, Eurostat, ESMA.

ESMA Report on Trends, Risks and Vulnerabilities No. 2, 2017 40
Heterogeneity12in the impact of expenses on
returns and fees is considerably lower across
the locations in which funds are marketed:
Absolute (relative) reductions due to TER vary
between 118 and 196bps (19 and 27%).
Focusing on the same EU markets as above,13
load charges increase these losses within a
range of 202 to 293bps (31 to 41%), with UK,
DK and IE at the lower end of the relative
reduction spectrum.
The impact of charges on fund returns varies for
different segments of the fund industry. Relative
reductions in returns due to fees and loads are
moderate for equity funds. Retail (institutional)
equity funds experience reductions of
239bps/15% (155bps/11%) on average.
Despite lower absolute reductions, bond fund
investors lose on average a higher share of the
available gross profits (32% in retail and 17% in
institutional funds). Across all asset classes, the
highest relative return reductions are
experienced by retail investors (35%/48bps) in
MMFs and the lowest by institutional investors
in MMFs (7%/20bps).
These EU-wide results are matched by most
individual country results, with equity funds
generally experiencing lower reductions than
bond and mixed funds. With the latter two,
major national markets separate into two
groups: In FR, IE and UK returns on bond funds
are reduced less than on mixed funds, while in
BE, DK, IT, LU, ES and SE the opposite holds
true. In general, reductions range between 8%
(SE equity funds) and 42% (bond funds in BE)
of available gross returns. The exceptions are
Swedish bond funds, which experience a 78%
reduction in their returns, with particularly low
gross returns on Swedish bond funds as the
main driver. The returns on MMFs are
massively reduced by fees and loads in FI, FR,
12 Due to a printing error in the first published version of
this document, the values in the last four rows of column five have been corrected in this version.
13 The set of countries is adjusted to achieve comparability with the results for domiciles. For the entire set of markets, which includes the EU and some neighbouring markets, absolute reductions due to all fees reduce returns by 202 to 385bps, or in relative terms by 31 to 57%. The larger set of markets is due to the fact that the same fund can be marketed in several jurisdictions.
14 Despite methodological differences and correction for the inclusion of inflation costs, our results fall within the intervals of cost reductions reported by Davydoff and Klages, 2014. The smaller size of our average effects is due to actual net flows below their implicit assumption of net flows of 20% of the investment per year.
15 If inflation is not factored in, the order of cost sizes reverses for FI and FR, while for DE costs for retail and
DE and IT: by between 62 to 93% in relative
terms, with loads acting as the major driver in
FR and TER in FI, DE and IT.
On average EU-wide, annual expenses and
one-time load fees reduce returns more
markedly for retail clients (21%) than for
institutional investors (13%). This holds across
all asset classes, with the lowest relative
differences observed for mutual funds following
alternative and mixed investment strategies.
Institutional and retail clients of MMFs on the
other hand, face massive fee differences.
Factoring in inflation costs as well, this pattern
still holds across all major EU markets, with the
exception of FI, FR and DE, where the impact
of total reductions on fund returns is higher for
institutional clients (V.4).14 In contrast, IE, LU
and DK show particularly elevated relative
return reductions for retail investors.15
The results in Table V.3 illustrate that the
average share in a passive EU fund
outperformed its active peer not only in
absolute gross returns, but also in terms of their
reduction through fees and charges. This is
partly because the passive fund industry is
predominantly invested in equity markets,
which on average offer higher risk premia. In
detail, for active fund shares the reduction in
returns due to fees, charges and inflation
averaged 255bps of their annual performance,
or 30% of gross returns. The respective
reductions for passive funds amounted to
157bps or 12% of gross returns.16 Active equity
funds, however, do outperform their passive
peers in terms of gross returns (15.49% vs.
14.82%). Expenses, charges and inflation still
reduce returns substantially more for active
equity funds (335bps or 22%) than for passive
ones (157bps or 11%), leaving active equity
funds with inferior net returns.17 ETF shares
institutional clients are of a similar size. This may be due to the change in the composition of subsamples over time, which also affects client-type-specific gross returns.
16 Bogle’s 2014 estimate of 257bps for the difference between the absolute reduction experienced by an active and a passive fund exceeds our equivalent excluding inflation, but includes additional cost components such as the drag of cash positions, etc. Holdt’s 2016 estimate of 107bps difference between ongoing costs (net of taxes) for active and passive European funds exceeds our equivalent of 74bps for TER as well. The FCA’s 2016 difference of 75bps for UK equity funds, closely matches our result for the average EU fund.
17 Hence the differences in portfolio structures of actively and passively managed funds. In particular, the high proportion of funds with equity-focused portfolios in the

ESMA Report on Trends, Risks and Vulnerabilities No. 2, 2017 41
performed slightly less well than passive
funds18: on average for the EU, they suffered an
absolute reduction in their returns through fees,
load charges and inflation by 185bps,
equivalent to a relative reduction of 16%.
V.4 Relative return reductions through TER, loads and inflation
Return reductions more severe for retail clients
In terms of relative relevance, total expense
fees dominate all other components, generating
almost half of the overall reductions in returns
suffered by EU fund clients. Sales fees make up
a further 20%, leaving redemption fees with a
mere contribution of around 2% and inflation
with another 31%. IE and LU depart from this
pattern, as sales fees account for up to 30% of
the reduction in clients’ returns. On the other
hand, sales and redemption fees represent
10% maximum of the overall return reduction in
DK, FI, SE and NL. Load fees are particularly
important for ETFs, weighing in with almost
50% of their respective overall reduction in
clients’ returns, while for retail equity and mixed
funds they shave off a mere fifth.
Results for the period from 1Q06 to 4Q15, both
unweighted and asset-weighted time averages,
confirm the robustness of our findings: relative
reductions in gross returns generated by
expenses, load charges and inflation
consistently exceed respective values for the
three-year horizon. This corroborates the
relevance of costs for investors. Lower fees and
higher gross returns, however, appear to have
improved the situation for investors in recent
years.
Looking at share classes, relative return
reductions are generally quite heterogeneous.
Around 10% of fund shares display very high
relative reductions in their respective RoI (V.5).
passive fund segment appears to contribute to results aggregated across all asset types.
18 ETFs differ substantially from other investment funds in terms of their issuance process and portfolio composition. For instance, fund shares of ETFs can be
Such massive reductions stem mainly from
combinations of low gross returns on underlying
portfolios, i.e. close to zero, and the presence
of considerable load. In a situation where a fund
client is confronted with an investment yielding
gross returns close to zero the presence of
discretionary load charges can therefore render
investment and disinvestment extremely costly.
These situations are more likely to occur in the
current low interest rate environment,
reinforcing the vulnerability of investors to low
performance by their investments in the fund
industry.
V.5 Dispersion of relative return reductions
Substantial heterogeneity
Aggregate net fund flows hardly
cost- or return-sensitive
This section complements the results derived
above by analysing whether net fund flows are
sensitive to cost-adjusted fund returns and
respective fees and charges. To estimate this,
we employ the cross-sectional simultaneous
equation model
(𝑟𝑛𝐸𝐶
𝑓𝑙𝑜𝑤𝑡𝑒𝑟
) = 𝛽1 (𝑟𝑛𝐸𝐶
𝑓𝑙𝑜𝑤𝑡𝑒𝑟
) + 𝛽2𝐷 (𝑟𝑛𝐸𝐶
𝑓𝑙𝑜𝑤𝑡𝑒𝑟
) + 𝛾𝑋 + 𝜀
This comprises optimality conditions for 1) fund
managers who maximise profits by adjusting
the TER; 2) clients maximising returns on their
investments by choosing their optimal net
investment flow; and 3) the balance between
the volume of fund shares offered and the
demand by fund clients ensured by adjustments
in the fund’s net return. D represents the impact
of various dummies on interaction variables
used to distinguish contemporaneous effects of
varying fund groups. Interaction groups include
domiciles, asset types and retail/institutional
acquired or sold on primary or secondary markets. Hence, cost and return data on this fund type are not perfectly comparable with the data for other fund types.
0
0.1
0.2
0.3
0.4
0.5
0.6
AT BE DK FI FR DE IT IE LU NL ES SE UK EU
Retail Inst.
Note: Relative reductions in RoI generated by TER, front and back-load charges and inflation. Time averages across sample horizon, in ppt.Sources: Thomson Reuters Lipper, ESMA.
0.01
0.04
0.19
0.84
3.66
16.00
1Q13 3Q13 1Q14 3Q14 1Q15 3Q15
Bottom 25% Core 50% Top 25% Median
Note: Dispersion of relative reductions in ROI. Y-axis logarithmic scal e usi ng baseof 4. Val ues of 0.01 indicate negative values in the original data. N egative valuesof this kind can be generated by deflation.
Sources: Thomson Reuters Lipper, Eurostat, ESMA.

ESMA Report on Trends, Risks and Vulnerabilities No. 2, 2017 42
share classes. X denotes the set of exogenous
variables, which varies across model
specifications and includes lags of endogenous
variables, their squares, fund sizes and fund
cost data. To cope with contemporaneously
interdependent endogenous variables, the
system is estimated using three-stage least
squares estimation (TSLS).19 Family averages
or aggregates of the three endogenous
variables across funds associated with the
same investment portfolio serve as
instrumental variables.
Results demonstrate the relevance of family
returns, flows and TER: respective estimators
are significant, positive and sizeable. Fund
shares’ net returns, flows and TER depend
positively on their lags, with such effects more
pronounced for TER than for fund flows and net
returns. Fund share size weakly affects returns,
with positive elasticity and a very small negative
estimator for its square implying small and
diminishing scale effects. Annual charges
covering management costs, but not
distribution costs, impact positively, but less
than one-to-one, on TER20 and have a
tendency to be higher for more profitable fund
shares. A positive alpha for active funds tends
to be present as well, but significance is
dependent on the model version employed.
Contemporaneous effects between
endogenous variables remain weak and
ambivalent, with results showing limited
robustness across differing model versions.
When lag structures are symmetric, flows react
negatively to TER, significantly more so for
share classes of retail investors. Their reaction
to net returns is ambivalent: coefficients are
positive for institutional share classes and
negative for retail fund shares. These results
are not persistent, as lagged TER influence
flows positively21, if at all, and lagged net
19 Details of this method are available in Zellner and Theil,
1962. Reported results were, according to Hansen-Sargan statistics, not exposed to overidentification issues.
20 Econometric results reported thus far are significant on a 99% level and hold across all model versions employed.
21 Barber et al., 2005, report similar positive effects for operating expenses. In addition, our unreported result of weak evidence for a negative dependence of TER on lagged net flows similarly matches their respective results.
22 These results contradict the findings of Barber et al., 2005.
23 Our results, reported at 99% level, broadly fit with those of Bergstresser et al., 2009. They report relative flows reacting slightly negatively to expense ratios and unanimously positively to excess returns relative to
returns display negative estimators of negligible
sizes, which are not robust across all model
versions.22 When using asymmetric lag
structures in order to remove potential
multicollinearity of current and lagged TER,
contemporaneous sensitivities disappear for
institutional fund shares or, in the case of retail
shares, are positive for TER and negative for
cost-adjusted returns. Sensitivities to lagged
net returns switch signs between the first and
second lag and are of negligible size.23 OLS
estimators for the flow equation used to
evaluate robustness lend some qualitative
support to these results, while displaying less
pronounced sizes.
V.6 Estimates for sensitivity of flows to TER
Flows in some countries react negatively to TER
In models with symmetric lag structures, net
flows to bond funds appear more sensitive to
TER than net flows to mixed or equity funds,
with only moderate heterogeneity across
countries. MMFs and commodity fund flows
exhibit higher sensitivity to TER (V.6).
Differences between retail and institutional
share classes are less clear-cut: substantial
differences exist only for commodity funds and
MMFs, with retail clients appearing as the more
sensitive customer group (V.7).24
benchmarks. As we employ returns instead of excess returns, the higher statistical strength of the respective estimators in Bergstresser et al., 2009, may be due to investors’ orientation towards relative returns. In line with our results, their estimates for the effects of loads and sizes (cumulated from their fund and complex sizes) suggest ambivalent and only borderline significant results for respective flow sensitivities. Our positive flow sensitivity to contemporaneous returns for institutional share classes matches respective results for US equity funds in Edelen and Warner, 2001, which they explain through reversed causality.
24 In models with asymmetric lag structures results are even more ambiguous. Significant TER coefficients found for individual countries are positive as often as negative and of negligible size.
-1.0
-0.8
-0.6
-0.4
-0.2
0.0
UK DE FR IE LU IT AT ES SE FI DK PT BE NL
bond funds equity funds mixed fundsNote: Impact of TER on flows, significant at 90%. Derived from benchmark model.Sources: Thomson Reuters Lipper, ESMA.

ESMA Report on Trends, Risks and Vulnerabilities No. 2, 2017 43
V.7 Estimates for sensitivity of flows to TER
Retail investors in MMFs and commodity funds sensitive to TER
Negative coefficients appear only for retail fund
shares in bond, money market and commodity
funds and range between one-third and one-
fifth of the sizes of their respective equivalents
for symmetric models.25 The sensitivity of net
flows to cost-adjusted returns results shows no
perceptible pattern across domiciles or asset
classes. Again, OLS estimators support these
results.
With regard to the convexity of flows in
returns,26 our results add yet more ambiguity.
Splitting funds into performance quintiles, net
flows to institutional fund share classes that
outperform the industry appear to react
negatively to returns and more sensitively than
worse-performing funds. Estimates for flows’
sensitiveness to TER appear positive and much
stronger for institutional clients than retail
clients
We interpret this evidence as reconfirmation of
at best weakly cost-sensitive and even less
return-sensitive aggregate investor demand
functions. This impression tallies with market
intelligence reported in Andersen et al., 2016.
However, it does not necessarily imply that
individual investors are cost- or return-
insensitive. Aggregate demand for fund shares
insensitive to costs and returns can also result
from individual effects offsetting each other.
Similarly, both sales and redemptions could be
characterised by similar sensitivities, again
cancelling each other out through netting.
Conclusion
This article provides metrics to analyse the
impact of ongoing fees and one-off charges on
25 Effects discussed here are significant at the 90% level.
26 This issue is actively discussed, e.g. Keswani et al., 2010, with the consensus that flows are convex in
mutual fund returns. Our preliminary evidence
delivers two key results:
— a substantial reduction in net returns
available to investors, especially retail
investors; and
— only weakly cost- or price-sensitive
investment decisions by retail investors.27
Methodological limitations in our proposed
metrics described in this article are linked
chiefly to data availability. Transaction-level
data on individual clients’ transactions in fund
shares could e.g. serve as a first step to the
correction of biases in the calculation of cost-
adjusted returns, which are generated by the
use of aggregate net flow data or by
assumptions about clients’ average holding
periods.
Similarly, such data would contribute to a more
disaggregated analysis of the determinants of
individual investors’ demand for fund shares. In
addition, data on fees and charges levied not by
funds, but by brokers and investment advisers
are currently not available on a consistent basis
but would be necessary to provide a complete
picture of the charges investors face. Finally,
there may be merit in assessing at a later stage
whether the results presented in this paper are
confirmed when the fresh information on costs
taken from the new PRIIPs/MiFID framework to
be put in place in 2018 is available.
References
Anderson, J. D., Lee, R. and Veres B., 2016,
“Fees at a Crossroads: Adopting an Advisory
Fee Model that Reflects Your True Value”, SEI
Advisor Network.
Barber, B. M., Odean, T. and Zheng, L., 2005,
“Out of Sight, Out of Mind: The Effects of
Expenses and Mutual Fund Flows”, Journal of
Business. Volume 78, Issue 6, pp. 2095-2119.
Bergstresser, D., Chalmers J. M. R. and
Tufano, P., 2009, “Assessing the Costs and
Benefits of Brokers in the Mutual Fund
Industry”, The Review of Financial Studies,
Volume 22, Issue 10, pp. 4129-4156.
Bogle, J. C., 2014, “The Arithmetic of “All-In”
Investment Expenses”, Financial Analysts
Journal, Volume 70, Issue 1, pp.1-9.
returns, i.e. the flows of higher-performing funds react more sensitively to returns.
27 Similar results are reported in FCA, 2016, for the UK.
-1.0
-0.8
-0.6
-0.4
-0.2
0.0
Bond Equity Mixed MMF Commodity
Sensitivity to TER Sensitivity to TER - retail
Note: Impact of TER on flows, significant at 90%. Derived from benchmark model.Sources: Thomson Reuters Lipper, ESMA.

ESMA Report on Trends, Risks and Vulnerabilities No. 2, 2017 44
Davydoff, D. and Klages, M., 2014, “Study on
the Performance and Efficiency of the EU Asset
Management Industry”, INSEAD OEE Data
Services.
Edelen, R. M. and Warner, J.M., 2001,
“Aggregate Price Effects of Institutional
Trading: A Study of Mutual Fund Flows and
Market Return”, Journal of Financial
Economics, Volume 59, pp. 195-220.
FCA, 2016, “Asset Management Market Study:
Interim Report.”
Holdt Mikkelsen, N., 2016, “European Fund
Expenses are Decreasing in Percentage”,
Morningstar.
Investor Economics, 2012, “Mutual Fund MERs
and Cost to Customer in Canada:
Measurement, Trends and Changing
Perspectives”, Study for the Investment Funds
Institute of Canada.
Keswani, A. and Stolin, D., 2012, The Journal
of Financial Research, “Investor Reaction to
Mutual Fund Performance: Evidence from UK
Distribution Channels”.
Lipper 2011, “Lipper for Investment
Management Version 2.7 Data Dictionary”.
Zellner, A. and Theil, H., 1962, “Three-Stage
Least Squares: Simultaneous Estimation of
Simultaneous Equations”, Econometrica,
Volume 30, Issue 1, pp. 54-78.

ESMA Report on Trends, Risks and Vulnerabilities No. 2, 2017 45
Orderly markets
DLT – key implementation challenges Contact: [email protected]
A common view in the financial industry today is that Distributed Ledger Technology (DLT) has the
potential to bring a number of benefits to financial markets, notably more efficient post-trade processes,
enhanced transparency, greater resiliency and reduced costs. However, these benefits will not
materialise unless important challenges are addressed. This article first discusses some of the technical
aspects of the technology that have important implications for its applications to financial markets. It
then explores three key implementation challenges: governance, privacy and interoperability, and some
of the solutions that market participants are considering to address them. This article does not aim to
provide an exhaustive overview of the issues raised by the technology. In particular, it does not discuss
possible legal/regulatory challenges, which we analysed in the recent ESMA DLT Report.2
Introduction
In February1 2017, ESMA published a DLT2
Report3, setting out its view on the technology
when applied to financial markets. The Report
highlights the potential risks and benefits that
DLT may bring, as well as the interactions with
existing EU rules. The Report draws on previous
work, including a Discussion Paper4 launched in
June 2016 to collect feedback from stakeholders
on DLT.
ESMA believes that DLT could bring a number of
benefits to financial markets. These include faster
and more efficient back office processes,
especially in those segments of the markets
where these processes are most cumbersome
today, e.g. for OTC derivatives or unlisted
securities. Potential benefits also include
enhanced reporting and oversight capabilities at
firms and regulators, greater security and
reduced costs.
The extent of the benefits, but also the risks that
DLT may bring, will depend on how the
challenges posed by the technology are
addressed. This article discusses three main
challenges: governance, privacy and
interoperability issues, and some of the solutions
that market participants are exploring. Other
possible challenges, including technical and
1 This article has been authored by Anne Chone. 2 ESMA, DLT Report, February 2017.
3 Idem.
4 ESMA DLT Discussion Paper, June 2016.
5 Satoshi Nakamoto, Bitcoin: “A Peer-to-Peer Electronic Cash System”, October 2008. Satoshi Nakamoto, a pseudonym for one or several individuals, was the first to
legal/regulatory aspects, are not discussed in this
article. More information on those challenges is
available in ESMA’s DLT Report.
Even if there may be a need to update our
analysis in the near term as the technology is
evolving quickly, ESMA’s position is that
regulatory action would be premature at present,
considering that the technology is still at an early
stage. In line with its mandate, ESMA is
committed to monitoring market developments
closely with a view to identifying potential gaps
and issues in current EU financial regulation and
to assessing whether there is any need for
regulatory action to address such shortcomings,
e.g. in cases where they would prevent the
technology from achieving its potential or leave
certain risks unaddressed. This work includes
better understanding the solutions that market
participants are developing to address the
challenges posed by the technology.
DLT in a nutshell
Distributed ledgers ─ also known as ‘blockchains’
─ trace their roots to the peer-to-peer network
first described by Satoshi Nakomoto in November
2008.5 They are essentially records, or ledgers,
of electronic transactions, very similar to
accounting ledgers, with two distinguishing
features: namely the fact that they are maintained
provide a description of a peer-to-peer network that would be used to timestamp and validate transactions. Although Nakamoto did not use the term ‘distributed ledger’ at the time, he referred to the same concept, i.e. a system where trust would rest on a network of peers and not a centralised third party.

ESMA Report on Trends, Risks and Vulnerabilities No. 2, 2017 46
by a network of peers rather than a central
authority, and the use of sophisticated encryption
techniques to store and transfer assets.
Distributed Ledger Technology (DLT) is a broad
term that refers to the technologies used to
implement distributed ledgers.6 One early and
well-publicised example of DLT is the Bitcoin
Blockchain.
Asymmetric key cryptography
V.8 Symmetric vs asymmetric key cryptography
Public/private keys provide enhanced security
Public/private keys are effectively comparable to a situation
where the receiver of a given message sends an open box
with an open lock (its public key) to the sender. The sender
puts the message into the box, secures it with the lock and
sends it back to the receiver. Only the receiver may open
the box with the corresponding (private) key.
Source: ESMA
The use of computer-based encryption
techniques is common for information protection.
New, however, is their application to distributed
ledgers. Cryptography is essential to distributed
6 See for example IOSCO definition in IOSCO Research
report on Financial Technologies, February 2017.
ledgers as, in the absence of a central trusted
party, it serves to authenticate and secure the
data stored and processed on the ledgers.
Encryption techniques provide the digital
signatures to claim and move assets and support
the consensus mechanism used to validate
transactions. Indeed, distributed ledgers rely on
cryptographic proof instead of trust.
Modern encryption techniques fall into two broad
categories: symmetric and asymmetric (also
called ‘public’) key cryptography. Symmetric
cryptography uses the same key for encryption
and decryption. The sender delivers the
encrypted message to the intended recipient and
sends the key to decrypt it through a separate
secure channel. The main drawback is that the
separate channel is rarely entirely secure.
Asymmetric key cryptography, which was
conceptualised in the mid-1970s, uses two
distinct keys, a public and a private key. The
public key, as its name suggests, is public. It is
comparable to a public address. The private key
is known only to its beneficiary. Losing its private
key is equivalent to losing the right to dispose of
its assets, hence the importance of protecting
and safeguarding private keys. Only the private
key can decrypt the information encrypted with
the corresponding public key, and vice versa.
Depending on the sequence in which they are
used, public/private keys may serve different
purposes. As an example, using a public key to
encrypt a message will ensure that only the
owner of the corresponding private key has the
ability to read the message (restricted access).
Signing a message with a private key will provide
certainty as to the identity of the sender (digital
signature). DLTs effectively use these two
features in combination, as we discuss below.
Hash functions
Another important element of DLT are hash
functions. Hash functions map input data of
arbitrary size into output data of predefined size.
Cryptographic hash functions are commonly
used to obfuscate data and thereby enhance data
security because of their non-invertible and
collision-resistant features. Hash functions are
said to be one-way or non-invertible functions
because it is excessively difficult, if not
impossible, to infer x from its hash value h(x) (it
would indeed involve an inordinately large
amount of computing power). This feature is also
known as ‘pre-image resistance’. Meanwhile, it is
Sender Receiver
Encrypted message sent through insecure
channel
Decryption key sent through a secure
channel
Symmetric-key algorithm
Sender Receiver
1) The receiver sends his public key
3) The message is sent and the receiver
opens it through his private key
Asymmetric-key (“public”) algorithm
2) The sender encrypts the message w ith
the receiver's public key

ESMA Report on Trends, Risks and Vulnerabilities No. 2, 2017 47
very easy to compute the hash h(x) of a given x.
In addition, cryptographic hash functions are
collision-resistant, meaning that having two
pieces of data that generate exactly the same
hash value is extremely unlikely, i.e., for every x
and x’, h(x) ≠ h (x’). A classic example of hash
functions are those used by websites to store the
passwords of their users.7
DLT protocols
A series of DLT protocols, like the Ethereum,
Ripple or Hyperledger protocols to name but a
few, have been developed over the last few
years. Abstracting from the technical details, as
this is not the purpose of this paper, these
protocols intertwingly use public/private keys and
hash functions with a view to achieving a high
level of security, although with some variations.
In the Bitcoin protocol, for example, the
procedure to generate public/private keys
includes use of the Elliptic Curve Digital
Signature Algorithm (ECDSA) and two hash
functions (SHA-256 and RIPEMD-160). ECSDA
is a widely accepted cryptographic standard
since the late 1990s. It relies on Elliptic Curve
Cryptography. SHA-256 as its name suggests
produces standard 256-bit strings of code. In
comparison, RIPEMD produces a shorter hash of
160 bits, which enables faster transactions.
V.9 The Bitcoin Blockchain
A chain of signatures and hashes
Source: Bitcoin: A Peer-to-Peer Electronic Cash System, Satoshi Nakamoto.
Asset transfers involve intertwined use of the
public/private keys generated as per the process
described above and the SHA-256 and RIPEMD-
160 hash functions. The following chart provides
an overview of the use of public/private key and
hash functions to sign asset transfers in the
Bitcoin Blockchain.
7 Only the hashes of the passwords are recorded on the
website. Someone breaking into the system would not therefore be able to infer the passwords from the hashes, which prevents their illicit use. Meanwhile, it is easy for the website to run the passwords through the hash to
Key challenges
Governance of DLTs
A network of peers, rather than a central trusted
party, underpin DLT, as discussed above. This
decentralised framework has the potential to
provide a series of benefits. It could reduce the
number of intermediaries involved and ultimately
remove the need for trusted third parties. It could
also enhance cyber security thanks to replicated
shared records. Yet, it raises a number of issues
when applied to financial markets.
First, there is the question of who would have
access to a given DLT network and act as a
validating node. There seems to be agreement in
the industry that permissioned DLT networks
would make the most sense for financial
markets.8 Under this framework, participation
would be restricted to authorised parties only.
This is a marked departure from the original
Bitcoin Blockchain, which was meant to be open
to all. Two main reasons support the case for
restricted access in financial market applications:
(i) the need to interact with known and reliable
parties to mitigate risks, e.g., the risk of money
laundering or other illicit activities, and (ii) scale,
as the capacity to handle large volumes
decreases as the number of nodes in the network
increases.
Permissioned networks require criteria to grant
access to the network. Ideally, those criteria
should provide some form of protection against
unwanted risks, e.g. the risk of the network going
bankrupt or engaging in illicit activities. Likely
components would include minimum capital
requirements, conduct of business rules and risk
mitigation techniques. The criteria applied should
be sufficiently strict to provide for the necessary
safeguards. At the same time, they should not
represent undue barriers to entry, meaning that
they should be fair, transparent and
commensurate to the risks involved.
There also needs to be rules to govern the day-
to-day interactions between network participants.
In particular, there should be clarity on the
liabilities of the respective parties, including in
case of error, breach of compliance or fraud, and
authenticate its users. Also, two similar passwords will generate materially different hashes.
8 This does not prejudge other DLT applications.
Transaction
Owner 1’s
Public key
Owner 0’s
Signature
Hash
Transaction
Owner 2’s
Public key
Owner 1’s
Signature
Hash
Transaction
Owner 3’s
Public key
Owner 2’s
Signature
Hash
Owner 1’s
Private Key
Owner 2’s
Private Key
Owner 3’s
Private Key

ESMA Report on Trends, Risks and Vulnerabilities No. 2, 2017 48
the penalties that could apply.9 There should also
be some form of oversight mechanism to
maintain the framework and update the protocol
or source code if and when needed, as evidenced
by the DAO case.10
Based on the above, it appears that the
governance framework that would apply to DLT
networks would bear resemblance to the rules
governing the existing market infrastructure and
central authorities, such as Central
Counterparties (CCPs) or Central Securities
Depositories (CSDs) today. Indeed, depending
on the services that they intend to provide, DLT
networks may fall under the scope of EMIR,
MiFIR, SFD11 and CSDR and the existence of a
CCP or CSD may be mandatory, as highlighted
in our recent report.
Yet several aspects would require specific
consideration in a DLT environment. One aspect
has to do with the transactions validation
process. In its original design, DLT provides that
several parties, instead of one as is the case with
centralised records, validate transactions through
a consensus mechanism. Another aspect has to
do with the shared and distributed nature of the
ledgers, meaning that DLT records may not be
formally stored in one place but potentially across
several participants and locations. Establishing
the exact liability of each party and the
territoriality of the applicable law might therefore
prove challenging with DLT, unless these issues
are carefully considered and resolved prior to
implementation.
Potential governance issues would be mitigated
in the scenario where DLT would aim to upgrade
existing processes within the current market
infrastructure. Meanwhile, they would be
heightened in a more disruptive scenario, where
DLT would aim to change or replace the current
role of central trusted parties, such as CCPs or
CSDs. Our understanding is that most DLT
applications being developed for financial
markets aim to enhance current processes at this
stage. Although these applications may change
the role of certain market participants over time
or introduce new functions, e.g. the management
and safekeeping of private keys, ESMA does not
9 Legal liability does not disappear with DLT, see ‘The
Distributed Liability of Distributed Ledgers : Legal Risks of Blockchain’, Dirk A. Zezsche, Ross P. Buckley and Douglas W. Arner, 2017.
10 The Decentralized Autonomous Organisation (DAO) is a leaderless organisation comprised of smart contracts. In June 2016, an attacker exploited a flaw in the code to drain money out of the DAO. To fix the problem,
see a possibility for DLT to eliminate the need for
central trusted parties, at least in the short term.
Privacy
In its original design, DLT provides for the records
on the ledgers, encompassing both state and
transaction data, to be viewable by all network
participants (both in permissionless and
permissioned networks, although in the latter
case the participants are authorised). This
publicity serves two purposes. First, it supports
trust in the system by allowing participants to
verify and validate transactions in order to
prevent ‘double spending’ in the absence of a
central trusted party. Second, it provides access
to a single and shared ’golden record’, which
eliminates duplicate records and the need for
multiple reconciliations. Indeed, sharing identical
information in almost real time is one of the main
benefits expected of DLT.
The public aspect of the technology is mitigated
by the fact that public/private keys cannot easily
be connected to their owners. Thus the identity of
the participants in the network and those that are
party to a transaction remain hidden. Yet, when
applied to financial markets, publicity may raise
issues. Indeed, while the identity of the parties is
private, all participants are aware of transactions
and their details, e.g., the quantity of assets
involved. There is therefore a risk of participants
inferring the trading book and activity of others
from the history of the transactions. They could in
turn unduly use this information, e.g. to front-run
competitors or manipulate prices.
V.10
Enhanced Encryption Techniques
Overview
Homomorphic encryption Computations are executed on encrypted data, without requiring access to a decryption key. Zero knowledge proof One party is able to prove to another party that a given statement is true, without conveying any other information than the fact that the statement is true. Secure multi-party computation N parties are able to share a computation, each learning only what can be inferred from their own inputs and the output of the computation Source: ESMA
developers created a fork, i.e., a new branch, in the chain. This raised a number of legal issues, as the DAO’s original design did not provide for such changes. For more details, see Understanding The DAO Attack, CoinDesk, June 2016.
11 The SFD refers to the Settlement Finality Directive, Directive No 98/26/EC.

ESMA Report on Trends, Risks and Vulnerabilities No. 2, 2017 49
Another risk is that the identity of a given
participant is revealed at some point in the future,
e.g. due to advances in quantum computing, at
which point their entire history of transactions
could be traced back. Publicity may also
contravene applicable laws that treat transactions
as confidential information.
Market participants are considering several
solutions to address privacy issues in a DLT
context. Some solutions are looking at enhancing
privacy through advanced obfuscation/encryption
techniques, such as homomorphic encryption,
zero-knowledge proof or secure multi-party
computation. Advanced obfuscation/encryption
techniques enable participants to perform
specific computations and prove their accuracy
publicly without revealing the inputs and outputs
of the computations. With homomorphic
encryption, for example, asset quantities for a
transaction may be hidden to all but the sender
and recipient of that transaction, while the
participants would still be able to verify the validity
of the transaction.
Other solutions focus on some form of ledger
segregation. Digital Asset Platform12 for example
is built around a ‘Distributed Ledger Layer’, which
comprises two subcomponents: the ‘Private
Contract Store’ (PCS) and the ‘Global
Synchronisation Log’ (GLS). The PCS contains
only those contractual agreements that the
participant is entitled to store and view. The GSL
is a communication layer. With this framework,
Digital Asset aims to segregate confidential
information physically and store it locally, while
sharing a global replicated log of hashes of the
sensitive data and execution commitments. In a
somewhat similar design, the Quorum13 platform
developed by JPMorgan uses a new ‘private’
transaction identifier to prevent all participants
except those party to the transaction from seeing
sensitive data. Transactions are fully replicated
across all nodes but the state database is split
into a private state database and a public state
database. All the nodes concur on the public
state database but their private state databases
differ. Corda14 from R3 restricts publicity on the
details of a transaction to the parties to that
transaction and what they call an ‘authoritative
cluster’. Our understanding is that authorised
participants would operate those clusters. There
12 The Digital Asset Platform, Non-technical White Paper,
Digital Asset, December 2016.
13 See https://github.com/jpmorganchase/quorum/wiki and Quorum, White Paper, November 2016.
would be different clusters for different types of
assets and market segments.
Enhanced encryption techniques are
conceptually interesting. Indeed, cryptography
could go a long way towards protecting privacy.
However, these techniques are not without their
challenges. They may not be legally sound, e.g.
some participants not entitled to certain data may
hold that data in encrypted or obfuscated form.
Also, they remain untested in production
environments.
The segregation of ledgers presents other
challenges. In particular, it would require ‘bridges’
between the different clusters of ledgers and/or
the private and public components. Our
understanding is that some market participants
are working on innovative solutions to address
this issue, with a view to avoiding reconciliation
issues similar to those that exist today. However,
it is unclear what these solutions might look like
and how effective they would be in achieving both
the confidentiality needed in financial markets
and the data integrity expected from DLT.
All these solutions, whether based on enhanced
encryption techniques or some form of ledger
segregation will also require effective control
mechanisms, e.g. to manage and protect
private/public keys and link them to ‘actual’
identities.
Interoperability
It seems very unlikely that DLT will be deployed
at once across the entire trade lifecycle and all
financial assets. In a more likely scenario, and
provided a number of conditions are met, DLT
would co-exist with the current systems and
market infrastructure. It is also likely that there will
be competing DLT networks across different
market segments. DLT networks would therefore
need to interoperate with the existing systems
and between themselves. Common technical
standards and business rules will be essential to
meet interoperability requirements.
In addition, many of the perceived benefits of the
technology, e.g. the elimination of duplicate
records and the need for multiple reconciliations,
are conditional on use of the same ‘libraries’ of
smart contracts and reference data. Failing that,
and unless common rules and standards are
agreed, the deployment of DLT could lead to
14 See https://www.corda.net/ and Corda Technical White Paper, November 2016.

ESMA Report on Trends, Risks and Vulnerabilities No. 2, 2017 50
more market fragmentation than is currently the
case.
The industry is aware of the challenge, and a
number of market-driven initiatives are geared to
fostering common DLT protocols and standards
or collaborative efforts in general. Some of the
most publicised initiatives for financial markets
include the HyperLedger Linux Foundation, the
R3 Consortium and the Post-Trade Distributed
Ledger group.
V.11
Key market initiatives
Collaborative efforts are needed
Key objectives Members HyperLedger Linux Foundation Project
Create an enterprise grade, open source distributed ledger framework and code base
Leaders in: Finance, Banking, Internet of Things, Supply Chains, Manufacturing and Technology
Post-Trade Distributed Ledger group
Provide a trusted environment for key post-trade participants to collaborate and share information
Nearly 40 financial institutions and prominent market infrastructures players from all regions of the globe
R3 Consortium Develop the base layer reference architecture to underpin a global financial-grade layer
Deploy secure collaborative lab to test blockchain technologies
80 leading financial institutions
Source: ESMA
Experience with similar initiatives in the past, e.g.
the introduction of ISDA agreements for swaps,
shows that achieving consensus takes time.
Besides potential disagreements on technical
aspects, some market participants may support a
status quo situation for various reasons, including
the need to protect a competitive advantage or
simply resistance to change. ESMA will monitor
closely the progress being made in fostering
reference standards and common business rules
across the industry. DLT supporters’ ability to put
forward compelling business cases and to
identify tangible benefits for market participants
will be a key element in that journey.
Conclusion
DLT is an evolving technology which needs to
address important challenges before it can be
widely deployed in financial markets. There is an
inherent tension between the shared and
distributed features of DLT and the governance
framework and level of privacy required in
financial markets. Interoperability with existing
systems and across DLTs is also crucial for its
wide adoption. A number of FinTech firms and
financial intermediaries are working on innovative
solutions to address these governance, privacy
and interoperability issues. Our understanding is
that most DLT applications being developed
today for financial markets focus on enhancing
existing processes within the current market
structure, which would reduce potential
governance issues. Solutions to address privacy
issues, such as enhanced encryption techniques
or some form of ledger segregation, as well as
market initiatives to promote interoperability, are
at early stages of development. Importantly, the
extent of the benefits and risks which DLT may
entail will depend on the way the challenges
described in this article are addressed.

ESMA Report on Trends, Risks and Vulnerabilities No. 2, 2017 51
Financial stability
EU derivatives markets ─ a first-time overview Contact: [email protected]
This article provides first-time data on the EU interest rate, credit, equity, commodity and foreign
exchange derivatives markets, based on weekly available EMIR data. The study provides for the first
time an overview of the size and structure of EU derivatives markets by aggregating data across all six
trade repositories authorised in the EU, complementing existing work and taking a broad approach by
comprehensively considering the different markets. Trade repositories are an extensive source of
information on derivatives including bank and non-bank entities. Information on the size of the different
derivative markets, both in terms of number of transactions and gross notional amount outstanding, is
reported and measures of market participants’ market concentration are computed. Finally, this article
shows the shares of derivative transactions that occur within the EEA, as opposed to cross-border
transactions with non-EEA counterparts, as well as the breakdown between over-the-counter and
exchange-traded derivatives.
Introduction1
In 2009, G20 leaders committed to increase
transparency on derivatives markets by
prescribing mandatory reporting of derivatives
contracts. This took place against the
background of the role played by credit
derivatives in particular in the financial crisis and
the transparency related to these instruments.
In the EU, the G20 commitment translated into
the EMIR Regulation, Article 9 of which states
that in the EU “Counterparties and CCPs shall
ensure that the details of any derivative contract
they have concluded and of any modification or
termination of the contract are reported to a trade
repository”.2
EMIR reporting requirements came into force in
February 2014, and given the complexity of
derivatives products it took a great deal of work
to put the requirements into practice and ongoing
effort to improve data quality by the industry and
regulators.
1 This article was authored by Yanis El Omari, Martin
Haferkorn and Carsten Nommels.
2 Regulation (EU) No 648/2012 of the European Parliament and the Council of 4 July 2012 on OTC derivatives central counterparties and trade repositories.
3 ESRB, 2016, Occasional Paper Series, No. 11.
4 Global guidance on the harmonisation of data elements reported to trade repositories has been developed by the Committee on Payments and Market Infrastructures (CPMI) and International Organisation of Securities Commissions (IOSCO). Similarly, in 2016, the Financial Stability Board published two reports on the implementation of key aspects of reforms to the over-the-counter (OTC) derivatives market.
This article now provides for the first time an
overview of the size and structure of EU
derivatives markets based on a complete set of
EMIR data, i.e. by aggregating data across all six
trade repositories authorised in the EU, and adds
to the already existing work both at EU level3 and
globally4. In line with the BIS approach, the article
is not limited to one specific class of derivatives,
but takes a broad approach by investigating - in
addition to credit derivatives - interest rate,
equity, foreign exchange and commodity
products as well.
By combining data from all six trade repositories
authorised in the EU,5 the data provides uniquely
comprehensive coverage for the EU and
complements existing market statistics, such as
the BIS Semi-annual and Triennial derivatives
statistics, which are based on surveys of
members or derivatives dealers6. The data
reported by ISDA is another source of information
on global interest rate and credit derivative
markets.7
5 The authorised trade repositories are: DTCC Derivatives Repository Ltd. (DTRL), Krajowy Depozyt Papierow Wartosciowych S.A. (KDPW), Regis_TR S.A. (REGIS), Unavista Limited (Unavista), CME Trade Repository Ltd. (CME TR), ICE Trade Vault Europe Ltd. (ICE TVEL). In July 2017 Bloomberg Trade Repository Limited was authorised. See ESMA List of registered trade repositories.
6 The BIS publishes a set of statistics on ETD and two sets on OTC derivatives markets. For more information: http://www.bis.org/statistics/about_derivatives_stats.htm.See also Abad et al. (2016) for a description of the BIS data and its comparison to data collected under EMIR.
7 http://www.swapsinfo.org/charts/derivatives/notional-outstanding.

ESMA Report on Trends, Risks and Vulnerabilities No. 2, 2017 52
Trade repositories are an extensive source of
information on derivatives and a means of
increasing completeness, as their data is very
detailed and coverage comprises all types of
counterparties to a derivative contract, including
bank and non-bank entities. This article offers
high-level indications of market size and
composition across derivatives markets in the
EU. Differently, previous literature used EU TR
trade state data from a single TR and/or focusing
on a specific derivatives market, such as the
interest rate derivatives or CDS markets. Abad et
al. (2016) looked at the interest rate swap, credit
default swap and foreign exchange markets in
the EU using DTCC data. Ali et al. (2016),
Brunnermeier et al. (2015), D’Errico et al. (2016)
used DTCC data to analyse the EU CDS market,
and D’Errico and Roukny (2017) studied
compression mechanisms on the EU CDS
market, while Kenny et al. (2016) analysed the
role of special purpose vehicles (SPV) in the Irish
CDS market using EMIR data across all six trade
repositories authorised in the EU.
A different strand of literature uses transaction
reports (trade activity reports): Benos et al.
(2013) analyse CDS transactions using DTCC
data; Benos et al. (2016) use transactional data
from the USD and EUR segments of the plain
vanilla interest rate swap market, while Cielinski
et al. (2017) analyse the effects of the Swiss-
Franc depegging using OTC FX data provided by
DTCC.
This article begins by describing the data
available and the necessary steps to obtain an
EU-wide picture of derivatives markets. It goes on
to provide some basic descriptive statistics on the
size of and participants in interest rate, credit,
equity, commodity and foreign exchange
derivatives markets.
Data description
The subsequent analysis is based on trade state
reports on 24 February 2017 from the six trade
repositories authorised in the EU (DDRL, KDPW,
REGIS, UnaVista, CME TR and ICE TVEL).
Trade state data refer to the most updated values
of all the derivative contracts with open interest at
the end of a given day. The raw data represent a
8 Trade state reports for one day were made up of 15
different raw files amounting to 26 GB of data with different types of files (csv, excel files, text files) and different reporting formats. Files with various numbers of columns and different field names had to be standardised before they could be merged and analysed.
snapshot of all derivative contracts open at the
end of the day in the EU. 8
Following pre-processing of the data, cleaning
procedures were applied with respect to
transactions and the counterparties involved.
Regarding transactions, the double reporting
regime for intra-EU derivatives transactions
under EMIR (i.e. both buyer and seller have to
report the transaction) requires as a first step the
identification and subsequent removal of
duplicate records. This was carried out as
follows:
— If only one of the counterparties involved is
an EEA entity, no double reporting obligation
exists. Consequently, these records did not
require deduplication.
— By contrast, only one of the records was used
for each pair, as identified by matching
reports for both the trade ID and the
respective counterparty IDs.
— Lastly, wherever no matching second record
existed but there was a double reporting
obligation, the notional amount was halved.
Second, the reported notional amounts were
checked for validity. Records with values that
could not be converted to a numeric value were
excluded. The notional amounts of the remaining
records were converted to EUR using ECB
exchange rates on 24 February 2017. Following
this conversion, outliers were removed as
follows:
— transactions with a notional value equal to
zero (entries displaying negative notional
values are considered in absolute terms);
— entries with log notional value four standard
deviation above the mean.9 This accounts for
the different characteristics of each asset
class and its usage form.
Entities were identified at the Counterparty ID10
level and not aggregated at the group level. In
doing so, we introduce a small inaccuracy for
concentration measures, as each subsidiary of a
financial cooperation has its own Counterparty ID
(e.g. in each jurisdiction or city). Aggregated
measures such as notional amounts outstanding
are not impacted, but concentration measures
such as network degree centrality and the
9 Mean is calculated by asset class distinguishing between compression (Y/N) and clearing status (Y/N).
10 European Commission Delegated Regulation (EU) No 148/2013.

ESMA Report on Trends, Risks and Vulnerabilities No. 2, 2017 53
Herfindahl-Hirschman Index (HHI) are slightly
underestimated.
Moreover, the asset classes studied here are
identified either by the TRs themselves, as some
of them provide reports by asset class, or
according to the Product ID 1 and Product ID 2
fields, using CFI codes when necessary.11 In the
absence of a unique product identifier in Europe,
however, this classification can lead to the
misallocation of a specific product to the wrong
asset class both from the point of view of the
reporting entity or the data end-user. The
derivative class “Other” has not been
incorporated in the analysis below either. Another
caveat lies in the fact that trade identifiers are not
generated centrally or uniquely, with the same
identifiers potentially used for more than one
transaction. However, this can be mitigated by
relying on information on other transaction
characteristics. In addition to the trade ID, for
example, the counterparty IDs and notional
amounts could also be used to identify
transactions . There may still be some
unidentified duplicated transactions or different
transactions erroneously considered as single
ones. Any form of aggregation at the counterparty
identifier level has been left for future
examination. This is of no consequence for the
aggregated notional figures but inevitably leads
to overestimation of the market size in terms of
the number of participants or underestimation of
the concentration measures.
These procedures are a pre-condition for carrying
out analysis using trade state data aggregated
across the six authorised TRs. They have now
been implemented in an automated manner and
will allow monitoring of derivatives markets based
on time-series data going forward.
Indicators
The indicators developed describe market size in
terms of number of transactions and gross
notional amounts outstanding as well as
concentration indicators. For concentration
indicators, the analysis uses participants’ market
11 Product ID 1/ID 2 are two mandatory fields used for
identification of the asset classes. Product ID 1 can be an ISIN or Alternative Instrument Identifier (AII) code or one of the following: CO for commodity, CR for credit, CU for currency (foreign exchange in our analysis), EQ for equity, IR for interest rate, OT for others. Product ID 2 can be either blank, a CFI code (ISO 10962 Classification of Financial Instruments Code) or one of the following: CD for contract for difference, FR for forward rate agreements, FU for futures, FW for forwards, OP for options, SW for swaps, OT for others. We used the product ID 1 as the asset class when it was one of the
share as measured by the sum of all their gross
notional positions in euro. To evaluate the degree
of concentration for a specific asset class, this
study makes use of the HHI, which reflects the
concentration of a given market and is
normalised between zero and one. To provide
indications of the degree of concentration, the
analysis takes as a reference the HHI levels
defined in the EC Guidelines on the assessment
of horizontal mergers under the Council
Regulation on the control of concentrations
between undertakings (Section III).
Concentration levels with a HHI below 0.10 are
unlikely to raise competition concerns.12 As an
additional measure of concentration, we use
network degree centrality for each asset class.
This measure builds a network level centrality
score based on the individual degrees or number
of distinct bilateral relationships between the
individual counterparties in the network. It varies
between zero and one, with one representing the
highest possible concentration level for a
network, i.e. a network where one big participant
would be the unique counterparty to all the other
counterparties.
Interest rate derivatives
Participants
For interest rate derivatives, 251,916 different
counterparty identifiers were reported. Among
these, nine were CCPs authorised to offer
services and activities in the EU. 11 were CCPs
established in a third country, and an additional
339 were clearing members of either of these
CCPs. The more than 250,000 remaining
counterparties reflect the widespread use of
interest rate derivatives; they include financial
and non-financial counterparties, clients to a
clearing member in the case of a cleared trade,
or non-clearing-member brokers and their clients.
Size of the market
The trade state reports record a total of 5.4mn
open transactions amounting to a total notional
value of around EUR 282tn, making interest rate
derivatives the largest derivatives asset class in
following five: CO, CR, CU, EQ, and IR. For the rest we used the CFI code when provided in Product ID 2 to allocate the record to one of the five asset classes.
12 Council Regulation (EC) No 139/2004 of 20 January 2004 on the control of concentrations between undertakings. Art 19 and Art 20 of the EC Guidelines refer to both levels and changes in the HHI following a merger. In this analysis, we consider levels only, as changes would not be applicable in the specific case.

ESMA Report on Trends, Risks and Vulnerabilities No. 2, 2017 54
terms of gross notional amounts outstanding. As
previously mentioned, this dataset complements
other existing statistics. For example, in the case
of interest rate derivatives ISDA reports USD
543.3tn globally on 24 February 2017. In its latest
semi-annual survey, the BIS reports gross
notional outstanding of USD 368tn for OTC
interest rate derivatives at a global level for the
end of 2016.13 The differences with our dataset
might also be due to the nature of the data, BIS
and ISDA survey-based data collection.
Differences in reported numbers can also be
observed for the other asset classes.
6% and 94% of transactions were exchange-
traded derivatives (ETD) and OTC derivatives
transactions respectively. This compares to 14%
ETD and 86% OTC in terms of notional, indicating
a larger volume of standardised ETD
transactions. It is worth noting that the average
notional amount per transaction is much higher
than for the other derivative categories. This is
due to the character of IRDs, where a typical IRD
used to hedge an interest rate risk with payments
expressed in basis points will have a very high
notional amount (V.12).
V.12 Interest rate derivatives
Mostly OTC transactions
Number of transactions
% of total
Notional value
% of total
ETD 0.30 6 41 14
Trade with EEA
0.24 4 20 7
Trade with non-EEA
0.06 1 21 7
OTC 5.05 94 239.8 85
Trade with EEA
3.46 64 137 49
Trade with non-EEA
1.52 28 100 35
Total 5.36 100 283 100
Note: Number of transactions in millions of records. Notional value in EUR tn. Transactions for which the trading venues were not reported and transactions for which the “trade with non-EEA” field was not reported are only included in total numbers. Source: ESMA
In both ETD and OTC markets, approximately
half of the transactions measured by notionals
take place between two EEA-based
counterparties, while the remainder involve a
counterparty based in another jurisdiction. This is
in line with expectations, as interest rate
13 The BIS compiles and publishes one set of statistics on
ETD and two sets on OTC derivatives markets. For more information: http://www.bis.org/statistics/about_derivatives_stats.htm
derivatives often serve as a means of hedging
interest rate payments across jurisdictions.
In terms of concentration, both the HHI and the
network concentration measures indicate a
relatively decentralised market. As interest rate
derivatives cover a wide variety of needs for a
broad set of economic actors/agents, this result
is in line with expectations. Moreover, the often
bilateral and bespoke nature of these
agreements is reflected in the predominance of
the OTC market segment. These numbers are in
line with the HHI provided by the BIS which,
although not directly comparable (HHI for interest
rate swaps separated by currency for the BIS
figures), are in the same order of magnitude
(V.13).14
V.13 Interest rate derivatives
Relatively decentralised
OTC ETD Overall
HHI 0.05
Degree centrality 0.07 0.16 0.07
Note: Market share of participants as measured by the sum of their gross notional positions in euro. Source: ESMA.
Credit derivatives
Participants
Compared to interest rate derivatives, the
number of participants in the credit derivative
segment is much smaller, with only 9,829 unique
counterparty identifiers reported. In total, six
CCPs are active in the market – two of which are
authorised in the EU, while the other four are
established in third countries. In addition, 76
clearing members are active in this market
segment. It is the smallest derivatives market in
terms of the number of counterparties, as firms
entering into credit derivative contracts are
typically those with substantial financial hedging
needs. This is reflected in the lower number of
small non-financial counterparties compared to
other markets.
Size of the market
The vast majority of trades were OTC (97% or
1.2mn transactions) whereas only 3% or 30,000
transactions were ETDs. In terms of notional
value, the credit derivative markets totalled EUR
13.8tn. BIS reports USD 9.9tn of CDS contracts
outstanding globally between dealers as at end-
2016, and ISDA reports USD 10.5tn as at 24
See also Abad et al. (2016) for a description of the BIS data and how it compares to data collected under EMIR.
14 http://stats.bis.org/statx/srs/table/d7.

ESMA Report on Trends, Risks and Vulnerabilities No. 2, 2017 55
February 2017. With regard to the EUR 13.8tn
notional value in our data, 96%, or EUR 13.3tn,
were attributable to the OTC segment, where
CDS for instance are primarily traded. On the
OTC side, more than 60% of transactions occur
between an EEA and a non-EEA counterparty (in
terms of both the number of transactions and
notionals) (V.14).
V.14 Credit derivatives
Mostly OTC transactions
Number of transactions
% of total
Notional value
% of total
ETD 0.03 3 0.5 4
Trade with EEA
0.003 0 0.3 2
Trade with non-EEA
0.03 2 0.2 1
OTC 1.18 97 13.3 96
Trade with EEA
0.41 34 4.5 32
Trade with non-EEA
0.77 63 8.8 64
Total 1.21 100 13.8 100
Note: Number of transactions in millions of records. Notional value in EUR tn. Transactions for which the trading venues were not reported and transactions for which the “trade with non-EEA” field was not reported are only included in total numbers. Source: ESMA.
Based on the network centrality indicator,
markets for credit derivatives are more
concentrated than for interest rate derivatives.
This is even more pronounced for OTC
derivatives, which consist mainly of CDS
contracts. These are characterised by a high
degree of concentration at the counterparty level,
which is in line with existing literature
(Brunnermeier et al., 2015). The HHI is, however,
only marginally higher than for interest rate
derivatives despite a smaller number of
counterparties (V.15).
V.15 Credit derivatives
High level of network centrality
OTC ETD Overall
HHI 0.07
Degree centrality 0.44 0.24 0.43
Note: Market share of participants as measured by the sum of their gross notional positions in euro. Source: ESMA.
Equity derivatives
Participants
For equity derivatives, 220,256 different
counterparties were reported. Among market
participants, 13 EU-based CCPs were present,
15 http://stats.bis.org/statx/srs/table/d8.
as well as 13 third-country CCPs and 193 of their
clearing members.
Size of the market
In terms of the number of transactions, equity
derivatives are the largest derivatives asset class
with 16.8mn open transactions. Of these
transactions, 12.5mn were OTC (80%) and
3.1mn were ETDs (20%). However, the order is
different when considering notional amounts:
EUR 15.3tn are OTC derivatives (43%), while
EUR 20.2tn are ETDs (57%), again indicating the
larger share of standardised transactions.
V.16 Equity derivatives
Mostly OTC transactions, larger amounts for ETD
Number of transactions
% of total
Notional value
% of total
ETD 3.12 20 20 57
Trade with EEA
1.64 10 13 36
Trade with non-EEA
1.48 10 7 21
OTC 12.50 80 15 43
Trade with EEA
5.54 35 6 17
Trade with non-EEA
6.94 45 9 26
Total 15.62 100 35 100
Note: Number of transactions in millions of records. Notional value in EUR tn. Transactions for which the trading venues were not reported and transactions for which the “trade with non-EEA” field was not reported are only included in total numbers. Source: ESMA.
Concentration levels are relatively low overall:
between the levels observed in the rather
concentrated credit derivative segment and the
interest rate segment. This is in line with the BIS
concentration index for equity-linked options
(V.16).15
V.17 Equity derivatives
High-level concentration
OTC ETD Overall
HHI 0.06
Degree centrality 0.28 0.20 0.22
Note: Market share of participants as measured by the sum of their gross notional positions in euro. Source: ESMA.
Concentration levels and the relatively similar
importance of OTC vs. ETD transactions are
consistent with the very diverse nature of equity

ESMA Report on Trends, Risks and Vulnerabilities No. 2, 2017 56
derivatives covering both standardised products
such as exchange-traded futures or plain vanilla
options as well as bespoke, bilaterally traded
forwards and exotic options (V.17).
Commodity derivatives
Participants
305,685 different counterparty IDs were reported
for the commodity asset class, which makes this
category the largest in terms of market
participants. That is not surprising given the
widespread use of these contracts across
industries and types of counterparties, notably
non-financials. Overall, 10 EU CCPs and 11 third
countries’ CCPs were present in this market, as
well as 149 clearing members (V.18).
V.18 Commodity derivatives
Majority of ETD transactions
Number of transactions
% of total
Notional value
% of total
ETD 2.65 54 5 60
Trade with EEA
0.89 18 2 16
Trade with non-EEA
1.76 35 4 43
OTC 2.34 46 4 40
Trade with EEA
1.05 21 2 21
Trade with non-EEA
1.29 26 2 18
Total 5.03 100 9 100
Note: Number of transactions in millions of records. Notional value in EUR tn. Transactions for which the trading venues were not reported and transactions for which the “trade with non-EEA” field was not reported are only included in total numbers. Source: ESMA.
Size of the market
Around five million open commodity derivatives
transactions were reported, 54% of them ETD
derivatives. Similarly, in terms of notional
amounts ETDs account for EUR 5.4tn (60%) of
notional values compared to EUR 3.6tn (40%) for
OTC. Once again, most of these transactions
involve a non-EEA counterparty. The average
notional transaction amount is lower than for the
other asset classes, reflecting the wide use of
commodity derivatives by small non-financial
firms such as commodity producers managing
their commodity price risk (V.19)
Comparatively high levels of concentration can
be observed on the commodity derivatives
market. Values for the HHI (0.16) and degree
centrality – in particular for OTC derivatives – are
the highest among all asset classes. This
illustrates the nature of the commodity derivative
markets, where many counterparties, including
many non-financial corporations, interact with a
few large brokers.
V.19 Commodity derivatives
Comparatively high level of concentration
OTC ETD Overall
HHI 0.16
Degree centrality 0.46 0.16 0.44
Note: Market share of participants as measured by the sum of their gross notional positions in euro. Source: ESMA.
Foreign exchange derivatives
Participants
Nine EU and seven third-country CCPs, and 41
clearing members were among the 162,698
different counterparty IDs reported for foreign
exchange derivatives.
Size of the market
V.20 Foreign exchange derivatives
Primarily OTC transactions
Number of transactions
% of total
Notional value
% of total
ETD 0.05 1 0.5 0
Trade with EEA
0.03 1 0.2 0
Trade with non-EEA
0.01 0 0.2 0
OTC 6.46 99 111.7 99
Trade with EEA
3.42 52 18.2 16
Trade with non-EEA
3.02 46 93.3 83
Total 6.52 100 112.3 100
Note: Number of transactions in millions of records. Notional value in EUR tn. Transactions for which the trading venues were not reported and transactions for which the “trade with non-EEA” field was not reported are only included in total numbers. Source: ESMA.
6.5mn transactions were open at the time of the
analysis, almost all of them OTC. They totalled
EUR 112tn, only EUR 475bn of which were
exchange traded (V.20).
V.21 Foreign exchange derivatives
Comparatively low levels of concentration
OTC ETD Overall
HHI 0.05
Degree centrality 0.11 0.22 0.11
Note: Market share of participants as measured by the sum of their gross notional positions in euro. Source: ESMA.

ESMA Report on Trends, Risks and Vulnerabilities No. 2, 2017 57
As regards concentration, we do not observe any
significant level. Values for both the HHI (0.05)
and degree-centrality are low overall, in line with
the BIS figures. Interestingly, however unlike
most other asset classes, degree-centrality is
higher for EC than for OTC positions (V.21).
Conclusion
This article provides descriptive statistics from
EU EMIR data for the first time, including an initial
overview of the EU interest rate, credit, equity,
commodity and foreign exchange derivatives
markets. Data are based on mandatory reporting
under EMIR and aggregated across all six trade
repositories authorised in the EU. The data
provide very comprehensive coverage of the EU
derivatives markets, complementing other
existing market statistics.
In terms of number of transactions, the equity
derivatives market is the largest (48% of the total
number of transactions reported), followed by
foreign exchange products (19%), interest rate
derivatives (15%), commodity derivatives (14%)
and credit derivatives (4%) (V.22).
V.22 Number of transactions by asset class
EQ predominant
However, in terms of market size as measured by
the value of gross notional amount outstanding,
the picture looks different. Interest rate
derivatives constitute the largest market (EUR
282tn), followed by foreign exchange derivatives
(EUR 112tn). Equity, credit and commodity
derivatives markets are much smaller (EUR 36tn,
EUR 13.8tn and EUR 9.1tn respectively).
Different average transaction sizes reflect the
different uses made of the various types of
derivatives. The typical IRD used to hedge an
interest rate risk, with payments expressed in
basis points, will thus have a very high notional,
16 The BIS compiles and publishes one set of statistics on
ETD and two sets on OTC derivatives markets. For more information: http://www.bis.org/statistics/about_derivatives_stats.htm
while equity or commodity derivatives linked to
stocks or physical commodities will have smaller
notionals on average (V.23).
V.23 Gross notional amounts outstanding by asset class
IR predominant
In terms of market size, it is worth noting that the
coverage of the EMIR dataset used here is based
on mandatory regulatory reporting and is more
comprehensive than coverage of the data
reported by the BIS. The BIS Semiannual and
Triennial derivatives statistics are based on
surveys of members or derivatives dealers.16 For
example, the gross notional amounts outstanding
in the EU total EUR 13.8tn (of which EUR 13.3tn
are OTC) for credit derivatives. This compares
with USD 11.8tn of OTC derivatives outstanding
globally as reported by big dealers to the BIS.
Derivatives markets also have very different
market structures with, for example, more
concentrated markets such as the commodity
and credit derivatives markets. These tend to
exhibit a core of central counterparties with large
exposures and a periphery of smaller ones. Other
markets are less concentrated, with a larger
number of small counterparties. We also observe
an important part of EU derivatives trading
activity occurring with non-EEA counterparts.
Finally, the type of transaction varies significantly
across asset classes, reflecting different degrees
of contract standardisation. OTC transactions are
predominant on FX, credit and interest rate
derivatives markets, whereas there is a slight
majority of ETD transactions on equity and
commodity derivatives markets (V.24).
ESMA is thus taking advantage of newly
available data in this area to complement existing
literature and study focusing on the EU
derivatives markets. However, this article is but a
starting point, with substantial work yet to be
See also Abad et al. (2016) for a description of the BIS data and how it compares to data collected under EMIR.
IR15%
CR4%
EQ48%
CO14%
FX19%
Note: share of the total number of transactions by asset class.Source: ESMA.
IR282
CR14
EQ36
CO9
FX112
Note: Gross notional amount outstanding by asset class. in Eur tn.Source: ESMA.

ESMA Report on Trends, Risks and Vulnerabilities No. 2, 2017 58
carried out on enhancing data quality and on
further market and statistical analysis. The above
aspects are key priorities for ESMA in the coming
years
V.24 ETD vs OTC
Heterogeneous across asset classes
References
Abad, J., Aldasoro, I., Aymanns, C., D’Errico, M.,
and Rousova L., F., Hoffmann, P., Langfield, S.,
Neychey, M. and Roukny, T., 2016, “Shedding
light on dark markets: First insights from the new
EU-wide OTC derivatives dataset”, ESRB
occasional paper No. 11.
Ali R., Vause, N. and Zikes, F., 2013, “Systemic
risk in derivatives markets: a pilot study using
CDS data”, Bank of England Financial Stability
Paper, 38.
Benos, E., Wetherilt, A. and Zikes F, (2013), “The
structure and dynamics of the UK credit default
swap market”, Financial Stability Paper, 25.
Benos, E., Payne, R. and Vasios, M., (2016),
“Centralising trading in interest rate swap
markets: The impact of Dodd-Frank”, Bank of
England Staff Working Paper, 580.
Brunnermeier, M., Clerc, L., El Omari, Y.,
Gabrieli, S., Kern, S. et al., 2015, “Assessing
contagion risks from the CDS market”, ESRB
occasional paper No. 4.
Cielinska, O., Joseph, A., Shreyas, U., Tanner, J.
and Vasios M., 2017, “Gauging market dynamics
using trade repository data: The case of the
Swiss franc de-pegging”, Bank of England
Financial Stability Paper, 41.
D’Errico, M., Battiston, S., Peltonen, T., and
Scheicher, M., 2016, “How does risk flow in the
credit default swap market?”.
D’Errico, M., Roukny, T., 2017, “Compressing
over-the-counter markets” Mimeo.
Kenny, O., Killeen, N., Moloney, K., 2016,
“Network analysis using EMIR credit default swap
data: Micro-level evidence from Irish domiciled
special purpose vehicles (SPVs)”, Working
Paper, pp. 1–20.
0.0
0.2
0.4
0.6
0.8
1.0
IR CR EQ CO FX
ETD OTCNote: Executi on type by asset class . Transacti ons for which the trading venuewas not reported are not included. % of total.Source: ESMA.

ESMA Report on Trends, Risks and Vulnerabilities No. 2, 2017 59
Annexes

ESMA Report on Trends, Risks and Vulnerabilities No. 2, 2017 60
Statistics
Securities markets Please note that for charts related to issuance and outstanding, ESMA has changed the source of commercial data across asset
classes. In addition, charts on credit quality and CRAs are now constructed on the basis of more refined ESMA proprietary data
based on the RADAR reporting tool. For more detailed information on RADAR kindly refer to “ESMA’s supervision of credit rating
agencies, trade repositories and monitoring of third country central counterparties. 2016 annual report and 2017 work
programme”, published in February 2017. Where data sources have been changed, data differ compared to previous editions of
the TRV. These differences generally pertain to the levels of activity, and not to market trends and directions. Our findings and
risk analysis are not materially affected by the change in data sources.
Market environment
A.1 A.2 Market price performance Market volatilities
A.3 A.4 Economic policy uncertainty EUR exchange rates
A.5 A.6 Exchange rate implied volatility Market confidence
50
60
70
80
90
100
110
Jun-15 Oct-15 Feb-16 Jun-16 Oct-16 Feb-17 Jun-17Equities CommoditiesCorporate bonds Sovere ign bonds
Note: Return i ndices on EU equities (Datastream regional index), gl obalcommodities (S&P GSCI) converted to EUR, EA corporate and sovereign bonds(Iboxx Euro, all maturities). 01/06/2015=100.
Sources: Thomson Reuters Datastream, ESMA.
0
10
20
30
40
Jun-15 Oct-15 Feb-16 Jun-16 Oct-16 Feb-17 Jun-17Equities CommoditiesCorporate bonds Sovere ign bonds
Note: Annualised 40D volatility of return indices on EU equities (Datastreamregional index), global commodities (S&P GSCI) converted to EUR, EA corporateand sovereign bonds (Iboxx Euro all maturities), in %.
Sources: Thomson Reuters Datastream, ESMA.
0
10
20
30
40
0
100
200
300
400
500
Jun-15 Oct-15 Feb-16 Jun-16 Oct-16 Feb-17 Jun-17
EU US Global VSTOXX (rhs)Note: Economic Policy Uncertainty Index (EPU), devel oped by Baker et al.(www.policyuncertai nty.com), based on the frequency of articles in EUnewspapers that contain the followi ng triple: "economic" or "economy",
"uncertain" or "uncertainty" and one or more policy rel evant terms. Gl obalaggregation based on PPP-adjusted GDP wei ghts . Implied volatility of EuroStoxx50 (VSTOXX), monthly average, on the right-hand side.Sources: Baker, Bloom, and Davis 2015; Bloomberg, ESMA.
80
90
100
110
120
130
Jun-15 Oct-15 Feb-16 Jun-16 Oct-16 Feb-17 Jun-17
USD JPYGBP CHFEmerging 5Y-MA USD
Note: Spot exchange rates to Euro. Em erging is a weighted average (2015 GDP)of spot exchange rates for CNY, BRL, RUB, INR, MXN, IDR and TRY.01/06/2015=100. Incr eases in value represent an appreci ation of EUR. 5Y-MA
USD=five-year moving average of the USD exchange rate.Sources: ECB, IMF, ESMA.
0
5
10
15
20
Jun-15 Oct-15 Feb-16 Jun-16 Oct-16 Feb-17 Jun-17
EUR-GBP EUR-USD
GBP-USD 5Y-MA EURNote: Implied volatilities for 3M opti ons on exchange rates. 5Y-MA EUR is thefive-year movi ng average of the implied volatility for 3M options on EUR-USDexchange rate.
Sources: Bloomberg, ESMA.
0
10
20
30
40
Jun-15 Oct-15 Feb-16 Jun-16 Oct-16 Feb-17 Jun-17
Financial intermediation Insurance and pension fund.Auxiliary activities Overall financial sector5Y-MA Overall
Note: European Commission survey of EU financi al services sector andsubsec tors (NACE Rev.2 64, 65, 66). Confidence indicators are averages of thenet balance of responses to questions on devel opment of the business situation
over the past three months, evoluti on of demand over the past three months andexpectation of demand over the next three months, in % of answers received.Sources: European Commission, ESMA.

ESMA Report on Trends, Risks and Vulnerabilities No. 2, 2017 61
A.7 A.8 Portfolio investment flows Equity investment flows
A.9 A.1 A.10 Institutional investment flows Debt issuance
A.11 A.2 A.12 Non-bank wholesale funding Market financing
Equity markets
A.13 A.14 Issuance by deal type Issuance by sector
-150
-100
-50
0
50
100
150
Apr-15 Aug-15 Dec-15 Apr-16 Aug-16 Dec-16 Apr-17Equity assets Long term debt liabilitiesEquity l iabili ties Short term debt assetsLong term debt assets Short term debt liabili tiesTota l net flows
Note: Bal ance of Payments statistics, financial accounts, portfolio inves tments byasset class . Assets=net purchases (net sales) of non-EA securities by EAinvestors. Liabilities=net sales (net purchases) of EA securities by non-EA
investors. Total net flows=net outflows (inflows) from (into) the EA. EUR bn.Sources: ECB, ESMA.
-250
0
250
500
750
1Q12 1Q13 1Q14 1Q15 1Q16 1Q17Govt. and househ. Other financeInsurance and pensions MFIsNFC 1Y-MA
Note: Quarterly Sector Accounts . Investment flows by resi dent sec tor i n equity(excluding investment fund shares) and debt securities, EUR bn. 1Y-MA=one-year moving average of all investment flows.
Sources: ECB, ESMA.
-200
-100
0
100
200
300
400
1Q12 1Q13 1Q14 1Q15 1Q16 1Q17Bond funds Equity fundsHedge funds Real estate fundsInsurance and pensions Other1Y-MA
Note: EA i nstitutional investment flows by type of investor, EUR bn.Other=financial vehicle corporations, mixed funds, other funds. 1Y-MA=one-yearmoving average of all investment flows.
Sources: ECB, ESMA.
-2-10123
SE
C 1
5Q
2
SE
C 1
6Q
2
SE
C 1
7Q
2
HY
15Q
2
HY
16Q
2
HY
17Q
2
IG 1
5Q
2
IG 1
6Q
2
IG 1
7Q
2
CB
15Q
2
CB
16Q
2
CB
17Q
2
MM
15Q
2
MM
16Q
2
MM
17Q
2
SO
V 1
5Q
2
SO
V 1
6Q
2
SO
V 1
7Q
2
90% 10% Current Median
Note: Growth rates of issuance volume, in %, normalised by standard devi ationfor the following bond classes, following Eikon classification: securitised (SEC);high-yield (HY); inves tment grade (IG); covered bonds (CB); money market
(MM); sovereign (SOV). Percentiles computed from 12Q r olling window. All datainclude securities with a maturity higher than 18M, except for MM (maturity l essthan 12M). Bars denote the range of values between the 10th and90th percentiles. Missing diamond indicates no issuance for previous quarter.Sources: Thomsons Reuters Eikon, ESMA.
-10
-5
0
5
10
0.0
0.5
1.0
1.5
2.0
2.5
4Q11 4Q12 4Q13 4Q14 4Q15 4Q16
Resid OFIs debt secur ities MMFs debt securitiesIFs debt securities OFIs depositsMMFs deposits Sec. assets net of re t. sec.Growth rate (rhs)
Note: Amount of wholesal e funding provided by Euro area non-banks, EUR tn,and growth rate (rhs), in %. Resid OFIs reflec ts the differ ence betw een the totalfinanci al sector and the know n sub-sectors within the s tatistical financial accounts
(i.e. assets from banking sector, i nsurances, pension funds, FVCs, inves tmentfunds and MMFs).Sources: ECB, ESMA.
-15
-5
5
15
25
0
25
50
75
100
1Q12 1Q13 1Q14 1Q15 1Q16 1Q17Debt securities Equity, IF sharesLoans Unlisted sharesOthers Market financing growth (rhs)
Note: Quarterly Sector Accounts . Liabilities of non-financial corporations (NFC),closing balance sheet positions , all original maturities, by debt type as share oftotal liabilities. Others include: fi nancial derivatives and employee stock opti ons;
insurance, pensions and standar dised guarantee schemes; trade credits andadvances of NFC; other accounts r eceivable/payable. Market financing growth:annual growth in debt securities and equity and investment fund (IFs) liabilities.Sources: ECB, ESMA.
0
100
200
300
400
500
0
20
40
60
80
100
120
2Q12 2Q13 2Q14 2Q15 2Q16 2Q17
Values of FOs Value of IPOs
5Y-MA IPO+FO Number of deals (rhs)
Note: EU equity offerings (IPOs and follow-on) and num ber of deals, EUR bn.5Y-MA=five-year moving average of the total value of equity offerings.Sources: Thomson Reuters Eikon, ESMA.
0
20
40
60
80
100
120
2Q12 4Q12 2Q13 4Q13 2Q14 4Q14 2Q15 4Q15 2Q16 4Q16 2Q17
Finance Industry and services
Real estate Util ities, mining and energyNote: EU equity issuance by sector, EUR bn. Finance includes: Banki ng andinvestment services; insurance; investment trusts.Sources: Thomson Reuters Eikon, ESMA.

ESMA Report on Trends, Risks and Vulnerabilities No. 2, 2017 62
A.15 A.16 Price performance Price performance of national indices
A.17 A.18 Equity prices by sector Price-earning ratios
A.19 A.20 Return dispersion Volatility
A.21 A.22 Implied volatility Correlation STOXX Europe 600 and sectoral indices
70
80
90
100
110
120
Jun-15 Oct-15 Feb-16 Jun-16 Oct-16 Feb-17 Jun-17
EU US JPNote: Datastream regi onal equity indices for the EU, the US and Japan, indexedwith 01/06/2015=100. Indices in their regional currency.Sources: Thomson Reuters Datastream, ESMA.
60
70
80
90
100
110
120
Jun-15 Oct-15 Feb-16 Jun-16 Oct-16 Feb-17 Jun-17
EuroStoxx 50 CAC 40 DAXFTSE 100 FTSE MIB IBEX
Note: National equity indices, selected EU members, indexed with01/06/2015=100.Sources: Thomson Reuters Datastream, ESMA.
50
60
70
80
90
100
110
120
Jun-15 Oct-15 Feb-16 Jun-16 Oct-16 Feb-17 Jun-17
Non-financia ls Banks
Insurance Financial servicesNote: STOXX Europe equity total return indices. 01/06/2015=100.Sources: Thomson Reuters Datastream, ESMA.
0.00
1.00
2.00
3.00
4.00
May-15 Sep-15 Jan-16 May-16 Sep-16 Jan-17 May-17Adjusted P/E EA Average EA
Adjusted P/E US Average US
Note: Monthly ear nings adj usted for trends and cyclical fac tors via Kalman filtermethodology based on OECD l eading indicators; units of standard deviation;averages computed from 8Y. Data available until the end of May 2017.
Sources: Thomson Reuters Datastream, ESMA.
-20
-15
-10
-5
0
5
10
15
Jun-15 Oct-15 Feb-16 Jun-16 Oct-16 Feb-17 Jun-17
Min Median Max
Note: Dispersion of the weekly returns of the main equity indices in the EU.Sources: Thomson Reuters Datastream, ESMA.
0
10
20
30
40
50
Jun-15 Oct-15 Feb-16 Jun-16 Oct-16 Feb-17 Jun-17
VIX (US) VSTOXX 5Y-MA VSTOXX
Note: Implied volatility of EuroStoxx50 (VSTOXX) and S&P 500 (VIX), in %.Sources: Thomson Reuters Datastream, ESMA.
0
10
20
30
40
50
Jun-15 Oct-15 Feb-16 Jun-16 Oct-16 Feb-17 Jun-17
VSTOXX 1M VSTOXX 3MVSTOXX 12M VSTOXX 24M
Note: Eurostoxx50 implied volatilities, measured as price indices, in %.Sources: Thomson Reuters Datastream, ESMA.
0.6
0.7
0.8
0.9
1.0
Jun-15 Oct-15 Feb-16 Jun-16 Oct-16 Feb-17 Jun-17Banks Financial ServicesInsurance Non-Financia l Corporation
Note: Correlati ons between daily returns of the STOXX Eur ope 600 and STOXXEurope 600 sectoral indices. Calculated over 60D rolling windowsSources: Thomson Reuters Datastream, ESMA.

ESMA Report on Trends, Risks and Vulnerabilities No. 2, 2017 63
A.23 A.24 ESMA composite equity liquidity index Bid-ask spread
Sovereign-bond markets
A.25 A.26 Issuance and outstanding Issuance by credit rating
A.27 A.28 Rating distribution Equity-sovereign bond correlation dispersion
A.29 A.30 Net issuance by country 10Y yields
0.49
0.50
0.51
0.52
0.53
0.54
0.55
Jun-15 Oct-15 Feb-16 Jun-16 Oct-16 Feb-17 Jun-17
Illiquid ity index 2Y-MANote: Composite i ndicator of illiquidity in the equity market for the currentEurostoxx 200 constituents, com puted by applying the principal componentmethodology to six input liquidity measures (Amihud illiquidity coefficient, bid-ask
spread, Hui-Heubel ratio, turnover value, inverse turnover ratio, MEC). Theindicator range is between 0 (higher liquidity) and 1 (lower liquidity).Sources: Thomson Reuters Datastream, ESMA.
0.00
0.02
0.04
0.06
0.08
0.10
Jun-15 Oct-15 Feb-16 Jun-16 Oct-16 Feb-17 Jun-17
Bid-ask spread 40D-MA 5Y-MA
Note: Liquidity measure as m edian of the bid-ask price percentage difference forthe current EU constituents of Stoxx Europe Large 200, in %.Sources: Thomson Reuters Datastream, ESMA.
0
140
280
420
560
700
0
2
4
6
8
10
2Q12 2Q13 2Q14 2Q15 2Q16 2Q17
Outstanding EA Outstanding EU ex.EAEU ex.EA issuance (rhs) Euro area issuance (rhs)5Y-MA
Note: Quarterly issuance (rhs), EUR bn, and outstanding debt, EUR tn.Sources: Thomson Reuters Eikon, ESMA.
0
100
200
300
400
500
2Q12 2Q13 2Q14 2Q15 2Q16 2Q17
AAA AA+ to AA-
Below AA- Avg Rating (rhs)Note: Quarterly soverei gn bond issuance i n the EU by rati ng category, EUR bn.Avg Rati ng = Wei ghted aver age rating com puted as a one-year moving average ofratings converted into a numeric scale (AAA=1, AA+=2, etc).
Sources: Thomson Reuters EIKON, ESMA.
AAA
AA
A+
A-
0.0
0.2
0.4
0.6
0.8
1.0
2Q12 2Q13 2Q14 2Q15 2Q16 2Q17
AAA AA A BBB BB and lowerNote: Outstanding amount of sover eign bonds as of issuance date by ratingcategory, in % of the total.Sources:Thomson Reuters Eikon, ESMA.
-1.0
-0.5
0.0
0.5
1.0
Jun-15 Oct-15 Feb-16 Jun-16 Oct-16 Feb-17 Jun-17
Top 25% Core 50% Bottom 25% MedianNote: Dispersion of the correlati on between daily returns of national equityindices and national sovereign debt retur n index, for 16 countries in the EU, over60D rolling windows.
Sources: Thomson Reuters Datastream, ESMA.
-200
-150
-100
-50
0
-75
-50
-25
0
25
AT
BE
BG
CY
CZ
DE
DK
EE
ES FI
FR
GB
GR
HR
HU IE IT LT
LU
LV
MT
NL
PL
PT
RO
SE SI
SK
EU
1Y high 1Y low 2Q17
Note: Quarterly net issuance of EU sovereign debt by country, EUR bn. Netissuance calculated as the difference between new issuance over the quarterand outstandi ng debt maturing over the quarter. Highest and l owest quarterly net
issuance in the past year are reported. EU total on right-hand scale.Sources: Thomson Reuters Eikon, ESMA.
-1
0
1
2
3
Jun-15 Oct-15 Feb-16 Jun-16 Oct-16 Feb-17 Jun-17
DE BE ESFR IT SEGB 5Y-MA
Note: Yiel ds on 10Y sovereign bonds, selec ted EU members, in %. 5Y-MA=five-year moving average of EA 10Y bond indices computed by Datastream.Sources: Thomson Reuters Datastream, ESMA.

ESMA Report on Trends, Risks and Vulnerabilities No. 2, 2017 64
A.31 A.32 10Y spreads Yield dispersion
A.33 A.34 Volatility Yield correlation dispersion
A.35 A.36 CDS spreads CDS volumes
A.37 A.38 Bid-ask spreads ESMA composite sovereign bond liquidity index
0
4
8
12
16
20
0
1
2
3
4
5
Jun-15 Oct-15 Feb-16 Jun-16 Oct-16 Feb-17 Jun-17
PT IE IT ES GR ( rhs)
Note: Selected 10Y EA sovereign bond risk premia (vs. DE Bunds), in %.Sources: Thomson Reuters Datastream, ESMA.
0
5
10
15
20
Jun-15 Oct-15 Feb-16 Jun-16 Oct-16 Feb-17 Jun-17
Top 25% Core 50% Bottom 25% Median
Note: Dispersion of yields on 10Y sovereign bonds of EU 17 countries, in %.Sources: Thomson Reuters Datastream, ESMA.
0
5
10
15
Jun-15 Oct-15 Feb-16 Jun-16 Oct-16 Feb-17 Jun-17DE BE ESFR IT SEGB 5Y-MA
Note: Annualised 40D vol atility of 10Y sovereign bonds, sel ected EU members,in %. 5Y-MA=five-year moving average of EA 10Y bond i ndices computed byDatastream.
Sources: Thomson Reuters Datastream, ESMA.
-1.0
-0.5
0.0
0.5
1.0
Jun-15 Oct-15 Feb-16 Jun-16 Oct-16 Feb-17 Jun-17
Top 25% Core 50% Bottom 25% Median
Note: Dispersion of correlations between 10Y DE Bunds and other EU countries'sovereign bond redemption yields over 60D rolling windows.Sources: Thomson Reuters Datastream, ESMA.
0
50
100
150
Jun-15 Oct-15 Feb-16 Jun-16 Oct-16 Feb-17 Jun-17
EU US 5Y-MA EU
Note: Datastream CDS sovereign indices (5 years, mid-spread).Sources: Thomson Reuters Datastream, ESMA.
0
5
10
15
20
May-15 Sep-15 Jan-16 May-16 Sep-16 Jan-17 May-17
DE ES FR IE IT PTNote: Value of outs tanding net noti onal sovereign CDS for selected countries, inUSD bn.Sources: DTCC, ESMA.
0.06
0.08
0.10
0.12
Jun-15 Oct-15 Feb-16 Jun-16 Oct-16 Feb-17 Jun-17
Bid-ask EuroMTS Bid-ask Domestic MTS
1Y MA EuroMTS 1Y MA Domestic
Note: Bid-ask spread as average bi d-ask spread over one month across ten EUmarkets, Domestic and Euro MTS, in %. 1Y MA = one-year moving average.Sources: MTS, ESMA.
0
0.2
0.4
0.6
Jun-15 Oct-15 Feb-16 Jun-16 Oct-16 Feb-17 Jun-17EuroMTS Domestic MTS1Y MA Domestic 1Y MA EuroMTS
Note:Composite indicator of market liquidity i n the soverei gn bond m arket for thedomestic and Euro MTS platforms, computed by applying the principalcomponent methodology to four input liquidity m easur es (Amihud illiquidity
coefficient, Bid-ask spread, Roll illiqui dity measure and T urnover). 1Y MA = one-year moving average. The i ndicator range is between 0 (higher liqui dity) and 1(lower liquidity).Sources: MTS, ESMA.

ESMA Report on Trends, Risks and Vulnerabilities No. 2, 2017 65
A.39 A.40 Liquidity Liquidity dispersion
Corporate-bond markets
A.41 A.42 IG and HY bond issuance Issuance by sector
A.43 A.44 Debt redemption profile by sector Rating distribution
A.45 A.46 Hybrid capital instruments Sovereign-corporate yield correlation
0
1
2
3
4
5
6
Jun-15 Oct-15 Feb-16 Jun-16 Oct-16 Feb-17 Jun-17
Liquidity indicator 40D-MA 5Y-MA
Note: Liquidity measured as median across countries of the difference in bid-ask yields for 10Y sovereign bonds, in basis points. 25 EU countries are included.Sources: Bloomberg, ESMA.
0
20
40
60
80
100
Jun-15 Oct-15 Feb-16 Jun-16 Oct-16 Feb-17 Jun-17
Top 25% Core 50% Bottom 25% MedianNote: Dispersion of liquidity measured as medi an across countries of thedifference in ask and bid yields for 10Y soverei gn bonds, in basis points. 25 EUcountries are included.
Sources: Bloomberg, ESMA.
0
50
100
150
200
250
300
350
0
1
2
3
4
5
6
7
2Q12 2Q13 2Q14 2Q15 2Q16 2Q17
Outstanding HY Outstanding IGHY issuance (rhs) IG issuance (rhs)5Y-MA Issuance (rhs)
Note: Quarterly investment grade (rating >= BBB-) and hi gh yield (rating < BBB-)corporate bond issuance in the EU (rhs), EUR bn, and outs tanding amounts,EUR tn.
Sources: Thomson Reuters EIKON, ESMA.
0
50
100
150
200
250
300
350
2Q12 2Q13 2Q14 2Q15 2Q16 2Q17
Util ities, mining and energy Industry and services
Financials Avg Rating (rhs)Note: Quarterly corporate bond issuance in the EU by sec tor, EUR bn. Avgrating=weighted average rating computed as a one-year moving average of rati ngsconverted into a numerical scale (AAA=1, AA+=2, etc).
Sources: Thomson Reuters EIKON, ESMA.
AAA
AA-
A-
BBB-
-300
-150
0
150
300
0
100
200
300
400
2Q17 2Q18 2Q19 2Q20 2Q21 2Q22
Non-financia ls Financials
1Y-Change Fin (rhs) 1Y-Change Non-fin (rhs)Note: Quarterly redempti ons over 5Y-horizon by EU private financial and non-financi als corporates, EUR bn. 1Y-Change=difference between the sum of thisyear's (four last quarters) and last year's (8th to 5th last quarters) redemptions.
Sources: Thomson Reuters EIKON, ESMA.
0.00
0.25
0.50
0.75
1.00
2Q12 2Q13 2Q14 2Q15 2Q16 2Q17
AAA AA A BBB BB and lowerNote: Outstandi ng amount of corporate bonds as of issuance date by ratingcategory, in % of the total.Sources: Thomson Reuters Eikon, ESMA.
0
200
400
600
800
1,000
0
10
20
30
40
50
2Q12 1Q13 4Q13 3Q14 2Q15 1Q16 4Q16
Outstanding (rhs) Issuance 5Y-MA
Note: Hybrid capital. Outs tanding amount computed as the cum ulative sum ofpreviously issued debt minus the cumulative sum of matured debt prior toreference date, EUR bn. Eikon Thomson R euters hybrid capital classification is
used.Sources: Thomson Reuters Eikon, ESMA.
-1.0
-0.5
0.0
0.5
1.0
Jun-15 Oct-15 Feb-16 Jun-16 Oct-16 Feb-17 Jun-17
Top 25% Core 50%
Note: Dispersion of correlations between 10Y DE Bunds and other EU countries'sovereign bond redemption yields over 60D rolling windows.Sources: Thomson Reuters Datastream, ESMA.

ESMA Report on Trends, Risks and Vulnerabilities No. 2, 2017 66
A.47 A.48 Yields by credit rating Spreads by credit rating
A.49 A.50 Bid-ask spreads and Amihud indicator Turnover ratio and average trade size
Credit quality
A.51 A.52 Rating issued by collateral type Outstanding ratings by collateral type
A.53 A.54 High quality collateral outstanding Covered bond spreads
0
1
2
3
Jun-15 Oct-15 Feb-16 Jun-16 Oct-16 Feb-17 Jun-17
AAA AA A
BBB 5Y-MANote: Markit iBoxx euro corporate bond indices for maturities 5-7 years, in %. 5Y-MA=five-year moving average of all indices.Sources: Thomson Reuters Datastream, ESMA.
0
50
100
150
200
250
Jun-15 Oct-15 Feb-16 Jun-16 Oct-16 Feb-17 Jun-17AAA AA A BBB
Note: EA non-financial corporate bond spreads by rating between iBoxx non-financi al corporate yiel ds and ICAP Euro Euribor sw ap r ates for maturities from 5to 7 years, basis points.
Sources: Thomson Reuters Datastream, ESMA.
0.0
0.1
0.2
0.3
0.4
0.5
0.6
0.0
0.1
0.2
0.3
0.4
0.5
0.6
Jun-15 Oct-15 Feb-16 Jun-16 Oct-16 Feb-17 Jun-17
Bid-Ask 1Y-MA Amihud (rhs)
Note: EUR Markit iBoxx corporate bond index bi d-ask spread, in %, computedas a one-month moving average of the iBoxx components in the currentcomposition. 1Y-MA=one-year moving average of the bid-ask spread. Amihud
liquidity coefficient i ndex between 0 and 1. Highest value indicates lessliquidity.Sources: IHS Markit, ESMA.
0.0
0.5
1.0
1.5
2.0
0
3
6
9
12
Jun-15 Oct-15 Feb-16 Jun-16 Oct-16 Feb-17 Jun-17
Turnover Average transaction size (rhs)
Note: Average transaction size for the corporate bond segment as the ratio ofnominal am ount of settlement instruc tions to number of settl ed instruc tions , inEUR mn. Turnover is the one-month moving average of the ratio of trading
volume over outstanding amount, in %.Sources: IHS Markit, ESMA.
0
20
40
60
80
100
0
4
8
12
16
20
Jul-15 Oct-15 Jan-16 Apr-16 Jul-16 Oct-16 Jan-17 Apr-17 Jun-17
ABS CDO CMBS OTH RMBS (rhs)
Note: Number of rated structured finance instruments by asset class, hundreds.Sources: RADAR, ESMA.
0
20
40
60
80
100
Jul-15 Nov-15 Mar-16 Jul-16 Nov-16 Mar-17 Jun-17
ABS CDO CMBS RMBS Other SFI
Note: Outs tanding EU r atings of structured finance instr uments by asset class, in% of total.Sources: RADAR, ESMA.
0
2
4
6
8
10
2Q12 2Q13 2Q14 2Q15 2Q16 2Q17Quasi high-quali ty colla teral outstanding
High-quality collateral outstanding
Note: Outstanding amount of debt securities issued, EUR tn. High-qualitycollateral is the sum of outstanding debt securities issued by EU governmentswith a rati ng equal to or higher than BBB-.Quasi high-quality is outstanding
corporate debt with a rating equal to or higher than AA-.Sources: Thomson Reuters Eikon, ESMA.
0
25
50
75
100
125
150
Jun-15 Oct-15 Feb-16 Jun-16 Oct-16 Feb-17 Jun-17
All AAA AA A 5Y-MANote: Asset swap spreads based on iBoxx covered bond indices, basis points.5Y-MA=five-year moving average of all bonds.Sources: Thomson Reuters Datastream, ESMA.

ESMA Report on Trends, Risks and Vulnerabilities No. 2, 2017 67
A.55 A.56 Rating distribution of covered bonds Rating distribution of securitised products
A.57 A.58 Rating changes Size of rating changes
A.59 A.60 Change in outstanding SFI ratings
Change in outstanding covered bond ratings
A.61 A.62
Rating actions Non-financial corporates rating changes
0.00
0.25
0.50
0.75
1.00
2Q12 2Q13 2Q14 2Q15 2Q16 2Q17
AAA AA A BBB BB and belowNote: Outstanding amount of covered bonds by rating category, in % of total.Sources: Thomson Reuters Eikon, ESMA.
0.00
0.25
0.50
0.75
1.00
2Q12 2Q13 2Q14 2Q15 2Q16 2Q17
AAA AA A BBB BB and lower
Note: Outstanding amount of securitised pr oduc ts as of issuance date by r atingcategory, in % of total.Sources: Thomson Reuters Eikon, ESMA.
0
1
2
3
Jul-15 Oct-15 Jan-16 Apr-16 Jul-16 Oct-16 Jan-17 Apr-17 Jun-17
Downgrades Upgrades
3M-MA Downgrades 3M-MA Upgrades
Note: Number of rati ng changes on securitised assets , thousands . 3M-MA =three month moving average.Sources: RADAR, ESMA.
0
1
2
3
4
Jul-15 Oct-15 Jan-16 Apr-16 Jul-16 Oct-16 Jan-17 Apr-17 Jun-17
Downgrades Upgrades
3M-MA Downgrades 3M-MA UpgradesNote: Average size of upgrades and downgrades when credit rating agenciestook rating actions on securitised assets, number of buckets tr aversed. 3M-MA =three month moving averages of upgrades and downgraes.
Sources: RADAR, ESMA.
-400
-200
0
200
Jul-15 Oct-15 Jan-16 Apr-16 Jul-16 Oct-16 Jan-17 Apr-17 Jun-17
Withdrawn New Net Change
Note: Number of withdrawn and new ratings for structured finance instruments.Sources: RADAR, ESMA
-600
-300
0
300
600
Jul-15 Oct-15 Jan-16 Apr-16 Jul-16 Oct-16 Jan-17 Apr-17 Jun-17
New Withdrawn Net Change
Note: Number of withdrawn and new ratings for covered bonds.Sources: RADAR, ESMA.
0
0.5
1
1.5
2
2.5
NFC F I Sov SF CB
Upgrades Downgrades
Note: Average size of upgrades and downgrades from all credit rati ng agenci es,excluding CERVED and ICAP, by asset class for 17H1, average number ofnotches. NFC = Non Financials, F = Financials, I = Insurance, Sov = Sovereign,
SF = Structured Finance, CB = Covered Bonds.Sources: RADAR, ESMA
-50
-40
-30
-20
-10
0
10
20
-20
-15
-10
-5
0
5
10
15
Sep-15 Dec-15 Mar-16 Jun-16 Sep-16 Dec-16 Mar-17
ES IE IT PT GR (rhs)Note: Number of upgrades minus dow ngrades for ES, GR, IE, IT and PT, in % ofoutstanding ratings. Data from Fitch Ratings, Moody's, S&P's.Sources: RADAR, ESMA

ESMA Report on Trends, Risks and Vulnerabilities No. 2, 2017 68
A.63 A.64 Rating changes Rating volatility
Market-based credit intermediation
A.65 A.66 EU shadow banking liabilities US shadow banking liabilities
A.67 A.68 MMFs and other financial institutions Financial market interconnectedness
A.69 A.70 Sovereign repo volumes Sovereign repo market specialness
-5
0
5
10
Jun-15 Oct-15 Feb-16 Jun-16 Oct-16 Feb-17 Jun-17Non-Financials Covered Bond Financials
Insurance Sovereign Structured Finance
Note: Net change in ratings from all credit rating agencies, excluding C ERVEDand ICAP, by asset class com puted as a percentage number of upgrades minuspercentage number of downgrades over number of outstanding ratings.
Sources: RADAR, ESMA.
0
2
4
6
8
10
12
14
Jun-15 Oct-15 Feb-16 Jun-16 Oct-16 Feb-17 Jun-17Non-Financials Covered Bond Financials
Insurance Sovereign Structured Finance
Note: Volatility of rati ngs by all credi t rating agencies, excludi ng CERVED andICAP, by asset class computed as number of rating changes over number ofoutstanding ratings.
Sources: RADAR, ESMA.
0
5
10
15
20
25
0
2
4
6
8
10
4Q11 4Q12 4Q13 4Q14 4Q15 4Q16
ABCP ABS
MMFs Securi ties lending
Repo % of bank liabi lities (rhs)Note: Size of shadow banking system proxied by am ounts of ABS and ABCPoutstanding, size of the EU repo market and EU securities on loan (collateralisedwith cash), and liabilities of MMF, in EUR tn. In % of bank liabilities on rhs.
Sources: ECB, AFME, ICMA, Markit Securities Finance, ESMA.
0
30
60
90
120
0
5
10
15
20
1Q12 1Q13 1Q14 1Q15 1Q16 1Q17CP ABS,GSEsMMF Securi ties lendingRepo % of bank liabi lities (rhs)
Note:Size of shadow banki ng system proxi ed by liabilities of ABS issuers, GSEsand pool securities, open commercial paper (CP), size of the US repo andsecurities l endi ng (collateralised with cash) markets, and liabilities of Money
Market Funds, in USD tn. In % of bank liabilities on rhs.Sources: Federal Reserve Flow of Funds, Thomson Reuters Datastream, ESMA.
0
20
40
60
80
100
120
0
5
10
15
20
25
30
35
1Q12 1Q13 1Q14 1Q15 1Q16 1Q17
IF MMFsFVC Other_OFIOFIs + MMFs (rhs) IF + MMFs (rhs)
Note: Total assets for EA Money Market Funds (MMFs) and other financi alinstitutions (OFI): i nvestment funds (IF), financial vehicle corpor ations (FVC),other OFI estimated with ECB Quarterly Sec tor Accounts MFUA, in EUR tn. In %
of bank assets on rhs.Sources: ECB, ESMA.
60
65
70
75
80
0
5
10
15
20
1Q12 1Q13 1Q14 1Q15 1Q16 1Q17Tota l funds Hedge fundsBond funds MMFs ( rhs)
Note: Loan and debt securities vis-à-vis MFI counterparts, as a share of totalassets. EA investment funds and MMFs, in %. Total funds includes: bond funds,equity funds, mixed funds, real estate funds, hedge funds, MMFs and other non-
MMF investment funds.Sources: ECB, ESMA.
80
120
160
200
240
Jun-15 Oct-15 Feb-16 Jun-16 Oct-16 Feb-17 Jun-17
Volume 1M-MA
Note: 1M-MA of specific and general collateral transac tion volumes executedthrough CCPs in seven sovereign EUR repo markets (AT, BE, D E, FI, FR, ITand NL), EUR bn. Index volumes filter out atypical transactions.
Sources: RepoFunds Rate, ESMA.
0
5
10
15
20
25
Jun-15 Oct-15 Feb-16 Jun-16 Oct-16 Feb-17 Jun-17Median 75th perc 90th perc
Note: Median, 75th and 90th percentil e of w eekly special ness, measured as thedifference between general collateral and special collateral repo rates ongovernment bonds in selected countries.
Sources: RepoFunds Rate, ESMA.

ESMA Report on Trends, Risks and Vulnerabilities No. 2, 2017 69
A.71 A.72 Credit terms in SFT and OTC deribvatives Securities financing conditions
A.73 A.74 Sovereign repo dispersion Securities lending by instrument type
A.75 A.76 Securities utilisation rate Securities lending by region
A.77 A.78 Securities lending contracts tenure Securities lending against cash collateral
2.5
2.8
3.0
3.3
3.5
4Q13 2Q14 4Q14 2Q15 4Q15 2Q16 4Q16 2Q17
Price terms Non-pr ice termsNote: Wei ghted average of responses to the ques tion: "Over the pas t three m onths,how have terms offer ed as reflec ted across the entire spectrum of securitiesfinanci ng and OTC derivatives tr ansac tion types changed?" 1=tightened
considerably, 2=tightened somewhat, 3=remai ned basically unchanged, 4= easedsomewhat and 5=eased considerably.Sources: ECB, ESMA.
2.5
2.8
3.0
3.3
3.5
4Q13 2Q14 4Q14 2Q15 4Q15 2Q16 4Q16 2Q17
Demand for funding Liquidity and functioning
Note: Wei ghted average of responses to the questi ons: "Over the past 3M, howhas dem and for funding / how have liquidity and func tioni ng for all collateral typeschanged?" 1= decreased / deteriorated considerably, 2= decreased / deteriorated
somewhat, 3= remained basically unchanged, 4= i ncreased / improved somew hat,and 5= increased / improved considerably.Sources: ECB, ESMA.
-1.0
-0.8
-0.6
-0.4
-0.2
0.0
Jun-15 Oct-15 Feb-16 Jun-16 Oct-16 Feb-17 Jun-17
Top 25% Core 50% Bottom 25% MedianNote: Dispersion of seven sovereign EUR repo markets (AT, BE, DE, FI, FR, IT and NL), volume-weighted average of fixed rate index value, in %.Sources: RepoFunds Rate, ESMA.
0
100
200
300
400
500
600
700
Jun-15 Oct-15 Feb-16 Jun-16 Oct-16 Feb-17 Jun-17
Equities Government bonds Corporate bonds
Note: Total value of EU securities on loan, EUR bn.Sources: Markit Securities Finance, ESMA.
0
5
10
15
20
25
30
35
Jun-15 Oct-15 Feb-16 Jun-16 Oct-16 Feb-17 Jun-17
Corporate bonds Government bonds EquitiesNote: European securities lending utilisation rate, computed as outs tanding valueof securities on loan over outs tanding total l endabl e val ue, in %. Corpor ate bondscomprise EUR denominated bonds only.
Sources:Markit Securities Finance, ESMA.
400
600
800
1,000
Jun-15 Oct-15 Feb-16 Jun-16 Oct-16 Feb-17 Jun-17
EU US 5Y-MA EUNote: T otal value of EU and U S securities on l oan, EUR bn. 5Y-MA EU=five-yearmoving average for EU securities.Sources: Markit Securities Finance, ESMA.
0
50
100
150
200
250
300
May-14 Nov-14 May-15 Nov-15 May-16 Nov-16 May-17
Equities Government bonds Corporate bonds
Note: Average tenure of EU securities lending contracts, days.Sources: Markit Securities Finance, ESMA.
0
10
20
30
40
Jun-15 Oct-15 Feb-16 Jun-16 Oct-16 Feb-17 Jun-17
Equities Government bonds Corporate bondsNote: Rati o of European securities on loan collateralised with cash over totalsecurities on loan, outstanding values, in %.Source: Markit Securities Finance, ESMA.
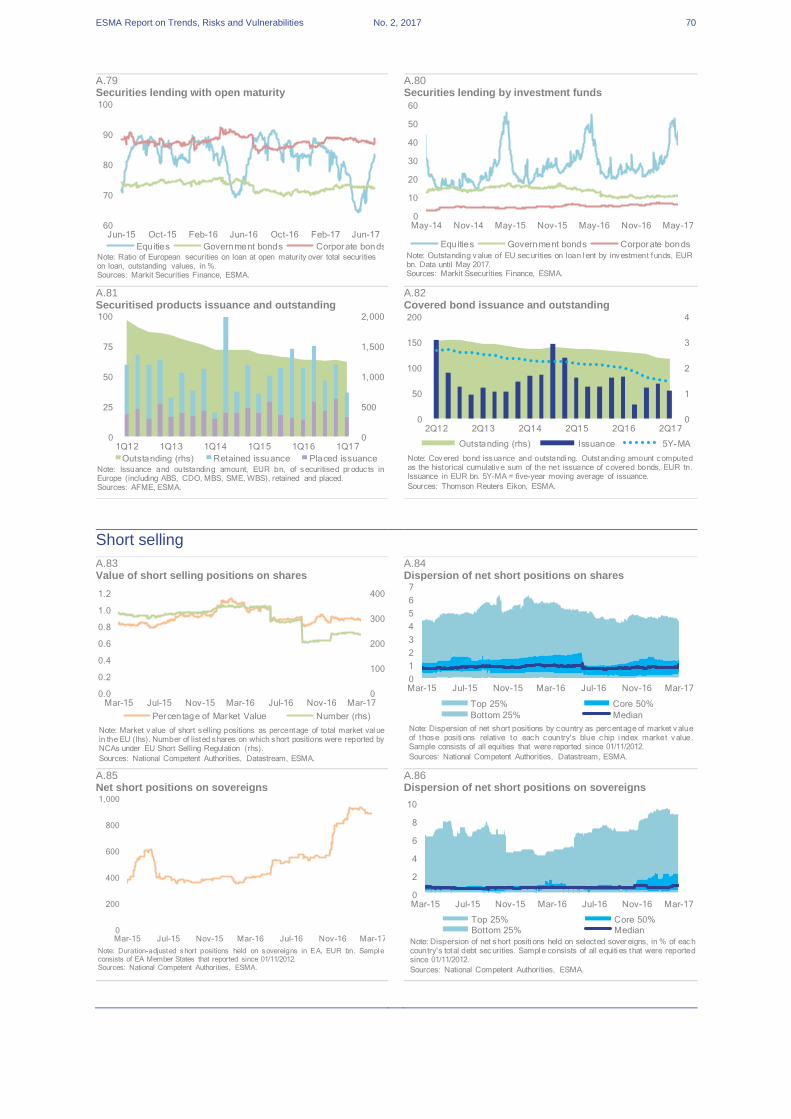
ESMA Report on Trends, Risks and Vulnerabilities No. 2, 2017 70
A.79 A.80 Securities lending with open maturity Securities lending by investment funds
A.81 A.82 Securitised products issuance and outstanding Covered bond issuance and outstanding
Short selling
A.83 A.84 Value of short selling positions on shares Dispersion of net short positions on shares
A.85 A.86 Net short positions on sovereigns Dispersion of net short positions on sovereigns
60
70
80
90
100
Jun-15 Oct-15 Feb-16 Jun-16 Oct-16 Feb-17 Jun-17
Equities Government bonds Corporate bondsNote: Ratio of European securities on loan at open maturity over total securities on loan, outstanding values, in %.Sources: Markit Securities Finance, ESMA.
0
10
20
30
40
50
60
May-14 Nov-14 May-15 Nov-15 May-16 Nov-16 May-17
Equities Government bonds Corporate bonds
Note: Outstanding value of EU securities on loan l ent by investment funds, EURbn. Data until May 2017.Sources: Markit Ssecurities Finance, ESMA.
0
500
1,000
1,500
2,000
0
25
50
75
100
1Q12 1Q13 1Q14 1Q15 1Q16 1Q17
Outstanding (rhs) Retained issuance Placed issuanceNote: Issuance and outstanding amount, EUR bn, of securitised pr oduc ts inEurope (including ABS, CDO, MBS, SME, WBS), retained and placed.Sources: AFME, ESMA.
0
1
2
3
4
0
50
100
150
200
2Q12 2Q13 2Q14 2Q15 2Q16 2Q17
Outstanding (rhs) Issuance 5Y-MA
Note: Covered bond issuance and outstandi ng. Outstanding amount computedas the historical cumulative sum of the net issuance of covered bonds, EUR tn.Issuance in EUR bn. 5Y-MA = five-year moving average of issuance.
Sources: Thomson Reuters Eikon, ESMA.
0
100
200
300
400
0.0
0.2
0.4
0.6
0.8
1.0
1.2
Mar-15 Jul-15 Nov-15 Mar-16 Jul-16 Nov-16 Mar-17
Percentage of Market Value Number (rhs)
Note: Market value of short selling positions as percentage of total market val uein the EU (lhs). Number of listed shares on which short positions were reported byNCAs under EU Short Selling Regulation (rhs).
Sources: National Competent Authorities, Datastream, ESMA.
0
1
2
3
4
5
6
7
Mar-15 Jul-15 Nov-15 Mar-16 Jul-16 Nov-16 Mar-17
Top 25% Core 50%
Bottom 25% Median
Note: Dispersion of net short positions by country as percentage of market valueof those positi ons relative to each country's blue chip i ndex market value.Sample consists of all equities that were reported since 01/11/2012.
Sources: National Competent Authorities, Datastream, ESMA.
0
200
400
600
800
1,000
Mar-15 Jul-15 Nov-15 Mar-16 Jul-16 Nov-16 Mar-17
Note: Duration-adjusted short positions held on sovereigns in EA, EUR bn. Sampl econsists of EA Member States that reported since 01/11/2012.Sources: National Competent Authorities, ESMA.
0
2
4
6
8
10
Mar-15 Jul-15 Nov-15 Mar-16 Jul-16 Nov-16 Mar-17
Top 25% Core 50%
Bottom 25% Median
Note: Dispersion of net short positi ons held on selected sover eigns, in % of eachcountry's total debt securities. Sampl e consists of all equiti es that were reportedsince 01/11/2012.
Sources: National Competent Authorities, ESMA.

ESMA Report on Trends, Risks and Vulnerabilities No. 2, 2017 71
Money markets
A.87 A.88 Interest rates Spreads to OIS
A.89 A.90 Interbank overnight activity Implied volatilities
Commodity markets
A.91 A.92 Prices Volatility
A.93 A.94 Open interest Implied volatility
-0.4
-0.2
0.0
0.2
0.4
Jun-15 Oct-15 Feb-16 Jun-16 Oct-16 Feb-17 Jun-17
EONIA 5Y-MA EONIA
3M Euribor ECB rateNote: Money market rates, in %.Sources: Thomson Reuters Datastream, ESMA.
0
10
20
30
40
50
Jun-15 Oct-15 Feb-16 Jun-16 Oct-16 Feb-17 Jun-17
Eur ibor GBP LiborUSD Libor 5Y-MA Eur ibor
Note: Spreads between 3M interbank rates and 3M Overnight Index Swap (OIS),in basis points. 5Y-MA Euribor=five-year moving average for Euribor spread.Sources: Thomson Reuters Datastream, ESMA.
0
10
20
30
Jun-15 Oct-15 Feb-16 Jun-16 Oct-16 Feb-17 Jun-17
EONIA SONIA (rhs) 5Y-MA EONIANote: 20D moving average of daily lending volumes on Euro Overnight IndexAverage (EONIA) and Sterling Overnight Index Average (SONIA), EUR and GBPbn.
Sources: ECB, Bloomberg, ESMA.
0
20
40
60
80
100
120
Jun-15 Oct-15 Feb-16 Jun-16 Oct-16 Feb-17 Jun-17
2Y 5Y 10Y 1Y-MA
Note: Implied vol atilities on one-month forward ICAP Euro vs. 6M Euriborswaptions based on the normal volatility model, i n basis points. 1Y-MA= one-year moving average of all series.
Sources: Bloomberg, ESMA.
25
50
75
100
125
150
Jun-15 Oct-15 Feb-16 Jun-16 Oct-16 Feb-17 Jun-17
Energy Industr ial metalsNatural gas Precious meta lsBrent 5Y-MA
Note: S&P GSCI commodi ty indices and Brent price, indexed, 01/06/2015=100.5Y-MA=five-year moving average computed usi ng S&P GSCI. Indicesdenominated in USD.
Sources: Thomson Reuters Datastream, ESMA.
0
15
30
45
60
75
Jun-15 Oct-15 Feb-16 Jun-16 Oct-16 Feb-17 Jun-17Energy Industr ial metalsNatural gas Precious metalsBrent 5Y-MA
Note: Annualised 40D volatility of S&P GSCI commodity indices and Br ent price,in %. 5Y-MA=five-year moving average computed using S&P GSCI.Sources: Thomson Reuters Datastream, ESMA.
0.0
0.5
1.0
1.5
2.0
2.5
Jun-15 Oct-15 Feb-16 Jun-16 Oct-16 Feb-17 Jun-17
Light crude oil Natural gas5Y-MA oil 5Y-MA gas
Note: Continuous future open interests on number of barrels, in million ofcontracts . 5Y-MA Oil (Gas)= five-year moving average of li ght cr ude oil futures(natural gas futures).
Sources: Thomson Reuters Datastream, ESMA.
0
15
30
45
60
75
90
Jun-15 Oct-15 Feb-16 Jun-16 Oct-16 Feb-17 Jun-17
Light crude oil Natural gas
3Y-MA oil 3Y-MA gasNote: One-month implied volatility of at the money opti ons, in %. 3Y-MA oil(gas)= one-year moving average of light crude oil (natural gas).Sources: Thomson Reuters Datastream, ESMA.

ESMA Report on Trends, Risks and Vulnerabilities No. 2, 2017 72
Derivatives markets
A.95 A.96 OTC notional outstanding OTC market value
A.97 A.98 ETD notional outstanding by product category ETD turnover by product category
A.99 A.100 ETD notional outstanding by asset class ETD turnover by asset class
A.101 A.102 ETD notional outstanding by exchange location ETD turnover by exchange location
0
200
400
600
800
2H11 2H12 2H13 2H14 2H15 2H16Credit default swaps CommodityEquity-linked Interest rateForeign exchange
Note: Gross notional amounts of outstanding OTC derivatives by productcategory, USD tn.Sources: Bank for International Settlements, ESMA.
0
5
10
15
20
25
30
2H11 2H12 2H13 2H14 2H15 2H16
Credit default swaps Commodity
Equity-linked Interest rate
Foreign exchange
Note: Gr oss market values of outstanding OTC derivatives by category, USD tn.Gross market val ues represent the cos t of replacing all open contracts at theprevailing market prices.
Sources: Bank for International Settlements, ESMA.
0
15
30
45
60
75
90
1Q12 1Q13 1Q14 1Q15 1Q16 1Q17
Short-term interest rate Long-term interest rate
Foreign exchangeNote: Open interest in exchange-traded derivatives by product category, in USDtn.Sources: Bank for International Settlements, ESMA.
0.0
0.1
0.2
0.3
0.4
0
2
4
6
8
10
Mar-15 Jul-15 Nov-15 Mar-16 Jul-16 Nov-16 Mar-17
Interest rate 1Y-MA IRForeign exchange (rhs) 1Y-MA FX ( rhs)
Note: Global average daily tur nover in exchange-traded derivatives by productcategory, in U SD tn. 1Y-MA IR=1Y moving average for interes t rate, 1Y-MAFX=1Y moving average for foreign exchange.
Sources: Bank for International Settlements, ESMA.
0
15
30
45
60
75
90
1Q12 1Q13 1Q14 1Q15 1Q16 1Q17
Options Futures
Note: Open interest in exchange-traded derivatives by asset class, in USD tn.Sources: Bank for International Settlements, ESMA.
0
2
4
6
8
Mar-15 Jul-15 Nov-15 Mar-16 Jul-16 Nov-16 Mar-17
Options FuturesNote: Global average daily turnover in exchange-traded derivatives by assetclass, in USD tn.Sources: Bank for International Settlements, ESMA.
0
15
30
45
60
75
90
1Q12 1Q13 1Q14 1Q15 1Q16 1Q17
North America Europe Asia/Pacific OtherNote: Open interest in exchange-traded derivatives by exchange location, in U SDtn.Sources: Bank for International Settlements, ESMA.
0
2
4
6
8
Mar-15 Jul-15 Nov-15 Mar-16 Jul-16 Nov-16 Mar-17
North America EuropeAsia/Pacific Other1Y-MA Europe
Note: Global aver age daily turnover in exchange-traded derivatives by exchangelocation, in USD tn. "Europe" as defined by BIS.Sources: Bank for International Settlements, ESMA.

ESMA Report on Trends, Risks and Vulnerabilities No. 2, 2017 73
Investors
Fund industry
A.103 A.104 Fund performance Fund volatility
A.105 A.106 Entities authorised under UCITS Share of entities authorised under UCITS by country
A.107 A.108 Entities authorised under AIFMD Share of entities authorised under AIFMD by country
A.109 A.110 Assets by market segment NAV by legal form
-2
-1
0
1
2
3
Jun-15 Dec-15 Jun-16 Dec-16 Jun-17
Alternatives Equity
Bond Commodity
Mixed Assets Real Estate
Note: EU-domiciled investment funds' annual average monthly returns, asset weighted, in %.Sources:Thomson Reuters Lipper, ESMA.
0
7
14
21
28
Jun-15 Oct-15 Feb-16 Jun-16 Oct-16 Feb-17 Jun-17
Alternative Equity BondCommodity Mixed Real Estate
Note: Annualised 40D historical return volatility of EU domiciled mutual funds, in%.Sources: Thomson Reuters Lipper, ESMA.
-80
-40
0
40
80
1,250
1,275
1,300
1,325
1,350
2Q12 2Q13 2Q14 2Q15 2Q16 2Q17
Withdrawn entities Newly authorised entitiesNumber of entities (lhs)
Note: Num ber of entities authorised under UCITS Directive by nationalcompetent authorities of the Member States and notified to ESMA. Newlyauthorised entities and withdrawn entities on the right axis.
Sources: ESMA Registers.
France21%
Luxembourg15%
United Kingdom
12%
Spain8%
Ireland6%
Poland5%
Sw eden4%
Others29%
Note: N umber of entities authorised under UCITS Directive by national com petentauthorities and notified to ESMA, in %.Sources: ESMA Registers.
-200
0
200
400
600
800
0
500
1,000
1,500
2,000
2,500
2Q12 2Q13 2Q14 2Q15 2Q16 2Q17
Withdrawn entities Newly authorised entitiesNumber of entities (lhs)
Note: N umber of entiti es authorised under AIFMD by national competentauthorities of the Member States and notified to ESMA. Newly authorisedentities and withdrawn entities on the right axis.
Sources: ESMA Registers.
United Kingdom
25%
France16%
Luxembourg10%
Spain10%
Germany5%
Netherlands
4%
Ireland4%
Others26%
Note: N umber of entiti es authorised under AIFMD by national competentauthorities and notified to ESMA, in %.Sources: ESMA Registers.
0
2
4
6
8
10
12
0
1
2
3
4
Apr-15 Aug-15 Dec-15 Apr-16 Aug-16 Dec-16 Apr-17
Bond Equity HFMixed Real estate Total (rhs)
Note: AuM of EA funds by fund type, EUR tn. HF=Hedge funds.Sources: ECB, ESMA.
0
2
4
6
8
10
1Q12 1Q13 1Q14 1Q15 1Q16 1Q17
Non-UCITS UCITS
Note: NAV of EU fund industry, EUR tn. Quarterly data.Sources: EFAMA, ESMA.

ESMA Report on Trends, Risks and Vulnerabilities No. 2, 2017 74
A.111 A.112 NAV by fund market segment Leverage by market segment High and slightly increasing for real estate
A.113 A.114 Fund flows by fund type Fund flows by regional investment focus
A.115 A.116 Bond fund flows by regional investment focus Equity fund flows by regional investment focus
A.117 A.118 Net flows for bond funds Net asset valuation
0
1
2
3
4
Apr-15 Aug-15 Dec-15 Apr-16 Aug-16 Dec-16 Apr-17
Bond Equity Mixed Real estate
Note: EA Investment funds’ NAV by fund type, EUR tn.Sources: ECB, ESMA.
1.0
1.1
1.2
1.3
Apr-15 Aug-15 Dec-15 Apr-16 Aug-16 Dec-16 Apr-17
Bond Equity Mixed Real estateNote: EA inves tment funds' leverage by fund type computed as the AuM/NAVratio.Sources: ECB, ESMA.
-40
0
40
80
120
160
Jun-15 Oct-15 Feb-16 Jun-16 Oct-16 Feb-17 Jun-17
Tota l EU Equity Bond Mixed
Note: EU-domiciled funds' 2M cumulative net flows, EUR bn.Sources: Thomson Reuters Lipper, ESMA.
-400
0
400
800
1,200
1,600
2,000
2,400
Jun-15 Dec-15 Jun-16 Dec-16 Jun-17
Europe BF Europe EF
Emerging markets BF Emerging markets EF
North America BF North America EFNote: C umulative net flows into bond and equity funds (BF and EF) over timesince 2004 by regional investment focus, EUR bn.Sources: Thomson Reuters Lipper, ESMA.
-100
-50
0
50
100
Jun-15 Dec-15 Jun-16 Dec-16 Jun-17
Western Europe North America Global Emerging markets
Note: 2M cumulative bond flows by regional investment focus, EUR bn.Sources: Thomson Reuters Lipper, ESMA.
-120
-60
0
60
Jun-15 Dec-15 Jun-16 Dec-16 Jun-17
Western Europe North America Global Emerging markets
Note: 2M cumulative equity flows by regional investment focus, EUR bn.Sources: Thomson Reuters Lipper, ESMA.
-12
-4
4
12
20
28
Jun-15 Dec-15 Jun-16 Dec-16 Jun-17
Government Emerging HY
Corporate MixedBonds OtherNote: 2M cumul ative net flows for bond funds, EUR bn. Funds i nvesti ng i ncorporate and government bonds that qualify for another category are onlyreported once (e.g. funds investing in emergi ng government bonds will be
reported as Em erging; funds investing in HY corpor ate bonds will be reported asHY).Sources: Thomson Reuters Lipper, ESMA.
0
3
6
9
12
-400
-200
0
200
400
600
800
1,000
1Q12 1Q13 1Q14 1Q15 1Q16 1Q17AuM (rhs) Capital flows Valuation effect
Note: Net valuation effec t related to the AuM of EA investment funds, computedas the i ntraperiod change i n AuM, net of flows received in the respective period.Capital flows and valuation effects in EUR bn. AuM expressed in EUR tn.
Sources: ECB, ESMA.

ESMA Report on Trends, Risks and Vulnerabilities No. 2, 2017 75
A.119 A.120 Liquidity risk profile of EU bond funds Cash as percentage of assets
A.121 A.122 Credit quality of bond funds assets Maturity of assets of EU bond funds
Money market funds
A.123 A.124 MMF performance MMF volatility
A.125 A.126 MMF flows by domicile MMF flows by geographical focus
0
20
40
60
80
3 5 7 9
Liq
uid
ity
MaturityOther Funds HY funds Loan funds
Government BF Corporate BFNote: Fund type reported according to the aver age liquidity ratio, in % (Y-axis),the effective average m aturity of assets (X-axis) and size. Each series is reportedfor 2 years, i.e. 2016 (bright colours) and 2017 (dark colours).
Sources: Thomson Reuters Lipper, ESMA.
0
2
4
6
Jun-15 Oct-15 Feb-16 Jun-16 Oct-16 Feb-17 Jun-17
Cash 4Y-AVGNote: Cash held by EU corporate bond funds, in % of portfolio holdings. Short positions can have a negative value.Sources: Thomson Reuters Lipper, ESMA.
25
%
25
%
25
%
24
%
21
%
18
%
16
%
16
%
14
%
15
%
15
%
14
%
14
%
15
%
15
%
15
%
15
%
14
%
14
%
14
%
14
%
9%
8%
8%
8%
11
%
14
%
14
%
14
%
14
%
15
%
15
%
14
%
14
%
16
%
14
%
14
%
14
%
14
%
14
%
13
%
12
%
20
%
19
%
19
%
16
%
14
%
14
%
16
%
15
%
15
%
15
%
15
%
15
%
16
%
15
%
15
%
14
%
14
%
14
%
14
%
14
%
13
%
22
%
22
%
22
%
26
%
28
%
27
%
26
%
26
%
27
%
27
%
27
%
27
%
27
%
25
%
26
%
28
%
28
%
28
%
29
%
29
%
30
%
24
%
25
%
25
%
26
%
26
%
27
%
28
%
29
%
30
%
29
%
28
%
29
%
29
%
29
%
29
%
29
%
30
%
30
%
30
%
31
%
31
%
0.0
0.2
0.4
0.6
0.8
1.0
2Q12 2Q13 2Q14 2Q15 2Q16 2Q17
<BBB BBB A AA AAA
Note: Ratings of bonds held by EU bond funds, data in % of total assets.Sources: Thomson Reuters Lipper, ESMA and Standard & Poor’s.
7.0
7.5
8.0
8.5
9.0
2Q12 2Q13 2Q14 2Q15 2Q16 2Q17
Note: Weighted average effec tive maturity of EU bond funds' assets , data inyears.Sources: Thomson Reuters Lipper, ESMA
-2
-1
0
1
2
Jun-15 Oct-15 Feb-16 Jun-16 Oct-16 Feb-17 Jun-17
2nd/98th percentile Weighted average
MedianNote: EU-domiciled MMFs' average yearly returns by m onth, asset-weighted, in%. The graph shows the median and average asset-weighted returns and thedifference between the returns corresponding to the 98th and 2nd percentile.
Sources: Thomson Reuters Lipper, ESMA.
0
2
4
6
8
Jun-15 Dec-15 Jun-16 Dec-16 Jun-17
MMF
Note: Annualised 40D historical return volatility of EU-domiciled MMF, in %.Sources: Thomson Reuter Lipper, ESMA.
-100
-50
0
50
100
Jun-15 Dec-15 Jun-16 Dec-16 Jun-17
EU USNote: MMF 2M cumulative net flows by domicile, EUR bn.Sources: Thomson Reuters Lipper, ESMA.
-60
-30
0
30
60
90
120
Jun-15 Oct-15 Feb-16 Jun-16 Oct-16 Feb-17 Jun-17
Western Europe North America Global Emerging markets
Note: MMF 2M cumulative net flows by geographical focus, EUR bn.Sources: Thomson Reuters Lipper, ESMA.

ESMA Report on Trends, Risks and Vulnerabilities No. 2, 2017 76
A.127 A.128 Assets and leverage Systemic risk indicator
A.129 A.130 MMF maturity MMF liquidity
Alternative funds
A.131 A.132 Hedge fund returns Hedge fund performance by strategy
A.133 A.134 AuM by strategy Fund flows by domicile
1.00
1.01
1.02
1.03
1.04
0.0
0.3
0.6
0.9
1.2
1.5
1Q12 1Q13 1Q14 1Q15 1Q16 1Q17AuM NAVLeverage ( rhs) 5Y-AVG lev (rhs)
Note: NAV and AuM of EA MMFs, EUR tn. Leverage computed as the AuM/NAVratio. 5Y-MA lev=five-year moving average for the leverage ratio.Sources: ECB, ESMA.
-15
-10
-5
0
5
10
15
Jun-15 Dec-15 Jun-16 Dec-16 Jun-17
Destabiliser MMF (coeff. +) Stabiliser MMF (coeff. -)
Note: Systemic stress indicator based on products of f ractions of reg ressions withpositive (negative) estimated coefficients for individual fund retu rns' impact on themean sector retu rn and respective estimators. Coefficients stem from VEC models
regressing individual fund returns and moments of the entire industry's returndistribution on lags and general financial market indices. Measures aggregatedacross individual regressions.
Sources: Thomson Reuters Lipper, Thomson Reuter Datastream, ECB, ESMA.
30
40
50
60
70
Jun-15 Oct-15 Feb-16 Jun-16 Oct-16 Feb-17 Jun-17
WAM WALNote: Wei ghted average m aturity (WAM) and weighted average life (WAL) of EUPrime MMFs, in days. Aggregati on carried out by w eighti ng indivi dual MMFs'WAM and WAL by AuM.
Sources: Fitch Ratings, ESMA.
20
30
40
50
Jun-15 Oct-15 Feb-16 Jun-16 Oct-16 Feb-17 Jun-17
Weekly Liquidity Daily L iquidity
Note: D aily and weekly liqui dity includes all assets maturing over night and sharesby AAA MMFs, securities issued by hi ghly-rated soverei gns with a maturity ofless than one year, in % of total assets.Aggregati on carried out using indivi dual
MMF data weighted by AuM.Sources: Fitch Ratings, ESMA.
-15
-10
-5
0
5
10
15
Jun-15 Oct-15 Feb-16 Jun-16 Oct-16 Feb-17 Jun-17
Corridor 2nd/98th percentileCorridor 1st/3rd quartile
Note: EU-domiciled hedge funds' m onthly returns, in %. The gr aph shows themedian returns, the difference between the returns corresponding to the 2nd and98th percentiles and the difference between the returns corresponding to the 1s t
and 3rd quartiles.Sources: Barclayhedge, Eurekahedge, TASS, HFR, ESMA.
-4
0
4
8
Arb
itra
ge
CT
A
Dis
tre
ss
ed
EM
Eq
uity
Ev
en
t
Fix
ed
In
co
me
Fo
Fs
Fu
nd
am
en
tal
Glo
ba
l M
acr
o
Mu
lti
Oth
ers
RV
Vo
latil
ity
3Q16 4Q16 1Q17 2Q17Note: Quarterly mean sector returns of EU hedge fund by strategy, in %.Sources: BarclayHedge, Eurekahedge, TASS, HFR, ESMA.
0
5
10
15
20
FH
F
CT
A
Dis
tre
ss
EM LS
LB
Ev
en
t
FI
Ma
cro
Mu
lti
Oth
er
1Q16 2Q16 3Q16 4Q16Note: Market share of hedge funds' AuM by strategy: Fund of hedge funds ,Commodity Tradi ng Advisor, distressed debt, emerging market, l ong/shortequity , equity long bias, event-driven, fixed i ncome, macro, m ulti-strategy, other.
Funds of hedge funds are not included in the total. In % of total.Sources: BarclayHedge, ESMA.
-21
-14
-7
0
7
14
Jun-15 Oct-15 Feb-16 Jun-16 Oct-16 Feb-17 Jun-17EU US
Note: Alternative m utual funds' 2M cumulative net flows by domicile, EUR bn.Data on alternative mutual funds represents only a subset of the entirealternative fund industry.
Sources: Thomson Reuters Lipper, ESMA.

ESMA Report on Trends, Risks and Vulnerabilities No. 2, 2017 77
A.135 A.136 Alternative fund flows by geographical focus Direct and indirect property fund flows
A.137 A.138 Assets and leverage Hedge fund interconnectedness
Exchange-traded funds
A.139 A.140 Returns Volatility
A.141 A.142 NAV and number by domicile NAV by asset type
-15
-10
-5
0
5
10
Jun-15 Dec-15 Jun-16 Dec-16 Jun-17
Western Europe North America Global Emerging markets
Note: Alternative mutual funds' 2M cumulative net flows by geographical focus,EUR bn. Data on alternative mutual funds represents only a subset of the entirealternative fund industry.
Sources: Thomson Reuters Lipper, ESMA.
-1.5
0
1.5
3
4.5
Jun-15 Dec-15 Jun-16 Dec-16 Jun-17
Indirect Direct
Note: 2M cumulative flows for direct and i ndirect EU property funds. Indirectproperty funds invest in securities of real estate companies, including REITs.
1.0
1.2
1.4
1.6
1.8
2.0
0
100
200
300
400
500
600
Apr-15 Aug-15 Dec-15 Apr-16 Aug-16 Dec-16 Apr-17AuM NAVLeverage ( rhs) 5Y-AVG lev (rhs)
Note: NAV and AuM of EA hedge funds, EUR bn. Leverage computed as theAuM/NAV ratio. 5Y-MA lev=five-year moving average for the leverage ratio.Sources: ECB, ESMA.
-0.02
-0.01
0
0.01
0.02
May-12 May-13 May-14 May-15 May-16 May-17
Destabiliser HF (coeff. +) Stabiliser HF (coeff. -)Note: Systemic stress indicator based on products of fracti ons of regr essions withpositive (negative) estimated coefficients for individual fund returns' impact onaverage return of sector significant at 99% level and respective average
estimators. Coefficients stem from VAR models regressi ng indivi dual fund returnson l ags and general fi nanci al market indices. Measures aggregated acrossindividual regressions.Sources: Barclayhedge, Eurekahedge, TASS, HFR, ESMA.
-5
-3
-1
1
3
5
Jun-15 Oct-15 Feb-16 Jun-16 Oct-16 Feb-17 Jun-17
2nd/98th perc. Weighted averageMedian
Note: EU-domiciled ETFs' average yearly r eturns by month, asset-weighted, %.The graph shows the median and average asset-wei ghted returns and thedifference between the returns corresponding to the 98th and the 2nd percentile
(light blue corridor).Sources: Thomson Reuters Lipper, ESMA.
0
6
12
18
24
Jun-15 Oct-15 Feb-16 Jun-16 Oct-16 Feb-17 Jun-17
ETF
Note: Annualised 40D historical return volatility of EU-domiciled ETF, in %.Sources: Thomson Reuters Lipper, ESMA.
10
15
20
25
0
1
2
3
Jun-15 Dec-15 Jun-16 Dec-16 Jun-17
EU USNum EU ETFs ( rhs) Num US ETFs ( rhs)
Note: NAV of ETFs, EUR tn, and number of ETFs, hundreds.Sources: Thomson Reuters Lipper, ESMA.
0
150
300
450
600
Jun-15 Dec-15 Jun-16 Dec-16 Jun-17
Mixed Assets Alternatives Money Market
Commodity Other Bond
Note: NAV of EU ETFs by asset type, EUR bn.Sources: Thomson Reuters Lipper, ESMA.

ESMA Report on Trends, Risks and Vulnerabilities No. 2, 2017 78
A.143 A.144 Tracking error Flows by domicile
A.145 A.146 Volumes of leveraged European ETFs Average beta values for European ETFs
A.147 A.148 Volumes of European ETFs by replication method Flows into European ETFs by replication method
0.0
0.2
0.4
0.6
0.8
1.0
1.2
Jun-15 Oct-15 Feb-16 Jun-16 Oct-16 Feb-17 Jun-17ETFsMFs index trackers Non-UCITSMFs index trackers UCITS
Note: Tracking error defined as standard deviation of funds' excess r eturnscompared to benchmark. T he graph shows the tr acking error for ETF and mutualfunds (MFs) both UCITS and non-UCITS. Yearly standard deviati on reported on
monthly frequency. End-of-month data.Sources: Thomson Reuters Lipper, ESMA.
-20
0
20
40
60
Jun-15 Oct-15 Feb-16 Jun-16 Oct-16 Feb-17 Jun-17
EU US
Note: ETF non-cumulative net flows by domicile, EUR bn.Sources: Thomson Reuters Lipper, ESMA.
0
20
40
60
80
0
1
2
3
4
5
6
2013 2014 2015 2016
Leveraged (short) volume Leveraged (long) volume
Note: Volumes of leveraged long and leveraged short ETFs with primary listingsin Europe, in EURbn (lhs). Numbers of these products (rhs), plotted as line.Sources: ETFGI, ESMA.
-3.0
-1.5
0.0
1.5
3.0
Jun-15 Oct-15 Feb-16 Jun-16 Oct-16 Feb-17 Jun-17
Unleveraged (short) Unleveraged (long)
Leveraged (short) Leveraged (long)
Note: Leveraged ETFs are self-reported. The annual average monthly beta ismeasured as the vol atility of a fund return i n comparison to its benchmark. Anunleveraged ETF replicating i ts benchmark will typically have a beta close to
1.0.Sources: Thomson Reuters Lipper, ESMA.
0
200
400
600
800
1,000
0
100
200
300
400
500
600
2012 2013 2014 2015 2016
Physical volume Synthetic volume
Physical number Synthetic number
Note: Volumes of physical and synthetic ETFs with primary listings in Europe, inEURbn (lhs), plotted as bars. Numbers of these products (rhs), plotted as lines.Sources: ETFGI, ESMA.
-20
0
20
40
60
80
100
120
2012 2013 2014 2015 2016
Physica l net flows Synthetic net flows
Note: Net flows of physical and synthetic ETFs with primary listings i n Europe, inEURbn.Sources: ETFGI, ESMA.

ESMA Report on Trends, Risks and Vulnerabilities No. 2, 2017 79
Retail investors
A.149 A.150 Portfolio returns Investor sentiment
A.151 A.152 Disposable income Asset growth
A.153 A.154 Household assets to liabilities ratio Growth rates in financial assets
A.155 A.156 Retail fund synthetic risk and reward indicator Share ownership by income
-0.5
0.0
0.5
1.0
May-15 Sep-15 Jan-16 May-16 Sep-16 Jan-17 May-17
Returns 5Y-MANote: Annual aver age monthly returns for a r epresentative portfolio forhouseholds, i n %. Asset weights, computed using ECB Financial Accounts byInstitutional Sectors, are 37% for collec tive inves tment schemes (of which 12%
mutual funds and 25% i nsurance and pension funds), 31% for deposits , 22% forequity, 7% debt securities and 3% for other assets.Sources: Thomson Reuters Datastream, Thomson Reuters Lipper, ECB, ESMA.
-10
0
10
20
30
40
50
Jun-15 Oct-15 Feb-16 Jun-16 Oct-16 Feb-17 Jun-17
EA institutional current EA private current
EA institutional future EA private futureNote: Sentix Sentiment Indicators for Euro Area private and current i nstitutionalinvestors on a 10Y horizon. The zero benchmark is a risk-neutral position.Sources: Thomson Reuters Datastream, ESMA.
-1
0
1
2
3
4Q11 4Q12 4Q13 4Q14 4Q15 4Q16
Weighted average 5Y-MA
Note: Annualised growth rate of wei ghted-average gross disposable income for11 countries (AT, BE, DE, ES, FI, FR, IE, IT, NL, PT, SI), in %.Sources: Eurostat, Thomson Reuters Datastream, ESMA.
-4
-2
0
2
4
6
8
1Q12 1Q13 1Q14 1Q15 1Q16 1Q17Financial assets Real assets5Y-MA financial assets 5Y-MA real assets
Note: Annualised growth rate of EA-19 households' real and financial assets, in%. 5Y-MA=five-year moving average of the growth rate.Sources: ECB, ESMA.
300
310
320
330
340
0
5
10
15
20
25
30
35
1Q14 3Q14 1Q15 3Q15 1Q16 3Q16 1Q17
Assets Liabilities Assets/Liabil ities ratio ( rhs)
Note: EU households' financial assets and liabilities, EUR tn. Assets/Li abilitiesratio in %.Sources: ECB, ESMA.
-30
-20
-10
0
10
20
30
1Q14 3Q14 1Q15 3Q15 1Q16 3Q16 1Q17Deposits Debt securitiesLoans Investment fund sharesShares Ins. & pension fundsOther assets
Note: Average annualised growth r ates of fi nancial asset classes held by EUhouseholds, in %. Other assets=other accounts receivable/payable.Sources: ECB, ESMA.
1
2
3
4
5
6
7
Jun-15 Oct-15 Feb-16 Jun-16 Oct-16 Feb-17 Jun-17
Equity Bond Alternative
Commodity Money Market Real EstateNote: The calculated Synthetic Risk and Reward Indicator is based on ESMASRRI gui delines. I t is computed via a simpl e 5-year annualised volatility measurewhich is then transl ated into categories 1-7 (with 7 representing higher levels of
volatility).Sources: Thomson Reuters Lipper, ESMA.
0
10
20
30
40
50
60
Bottom
20%
20-40% 40-60% 60-80% 80-90% 90-100%
Bottom 25% Core 50% Top 25% MedianNote: Dispersion of the national percentages of househol ds owning shares, bytheir income group. Data for EA countries (excl . LT), HU and PL for 2011-2015,%. 'Bottom 25%' represents the range of values from minimum to 1st quartile,
'Core 50%' interquartile range, and 'Top 25%' from 3rd quartile to maximum.Sources: ECB HFCS, ESMA.

ESMA Report on Trends, Risks and Vulnerabilities No. 2, 2017 80
A.157 A.158 Financial numeracy Investment taxation
A.159 A.160 Total complaints Complaints data by type of firm
A.161 A.162 Complaints data by cause Complaints data by instrument
Structured retail products
A.163 A.164 Outstanding Sales
0
10
20
30
40
50
60
70
30 40 50 60 70 80 90 100
Note: X- axis: Numeracy = share of respondents with correct answers (threenumerical questi ons asked). Y-axis = households i n EA (excl . IE, LT), HU andPL holding debt in 2011-2015, %.
Sources: ECB HFCS, ESMA.
0
20
40
60
80
100
2010 2011 2012 2013 2014 2015 2016Average CIT Average PITAverage CIT+PIT Max CIT+PITMin CIT+PIT
Note: Average rate of Personal Income Tax (PIT) and Corporate Income Tax(CIT) over 22 countries (AT, BE, CZ, DE, DK, EE, ES, FI, FR, GR, HU, IE, IT , LU,LV, NL, PL, PT , SE, SI, SK, UK), weighted by total val ue of funds, equities and
debt securities held by househol ds, plotted with lines. Shares of total tax rate ondividend income via PIT and CIT plotted with bars. Data in %.Sources: ECB, OECD, ESMA.
0
2,000
4,000
6,000
8,000
1H14 2H14 1H15 2H15 1H16 2H16
Note: Total complaints reported directly to NCAs. Data collected by NCAs.Sources: ESMA complaints database.
0
20
40
60
80
100
1H14 2H14 1H15 2H15 1H16 2H16
Bank and build ing society Non-bank investment firm Other typesNote: Compl aints reported via firms by type of firm, % of total. Data collec ted byNCAs.Sources: ESMA complaints database.
0
20
40
60
80
100
1H14 2H14 1H15 2H15 1H16 2H16
Execution of orders Investment advicePor tfolio management Quality/lack of informationFees/charges General adminUnauthorised business Other causes
Note: C omplaints reported directly to NCAs by financi al instrum ent, % of total. Datacollected by NCAs.Sources: ESMA complaints database.
0
20
40
60
80
100
1H14 2H14 1H15 2H15 1H16 2H16
Other investment products/funds Financial contracts for difference
Options, futures, swaps Mutual funds/UCITS
Money-market securities Structured securi ties
Bonds/debt secur ities Shares/stock/equityNote: Complai nts reported by financial instrument, % of total. Data collected byNCAs.Sources: ESMA complaints database.
0
1
2
3
4
5
0
200
400
600
800
2011 2012 2013 2014 2015 2016
Outstanding amounts Number of products (rhs)
Note: Outstanding amounts, EUR bn. Number of products, mn.Sources: StructuredRetailProducts.com, ESMA.
0
100
200
300
400
500
600
0
10
20
30
40
50
60
2Q12 2Q13 2Q14 2Q15 2Q16 2Q17
Sales
5Y-MA sales
Number of products (rhs)
Note: Vol umes of structured retail products issued, EUR bn. Number ofproducts, thousand.Sources: Structured Retail Products, ESMA.

ESMA Report on Trends, Risks and Vulnerabilities No. 2, 2017 81
A.165 A.166 Sales by asset class Sales by provider
A.167 A.168 Capital protection by number of products sold Capital protection by volume sold
A.169 A.170 Investment term Type of product
0
400
800
1,200
1,600
2,000
0
40
80
120
160
200
2011 2012 2013 2014 2015 2016
Th
ou
sa
nd
s
FX rate Interest rateOther CommoditiesEquity Number of products (rhs)
Note: Vol umes of str uctured products sold to retail investors by asset cl ass, EURbn. Number of products sold, thousand.Sources: Structured Retail Products, ESMA.
0
40
80
120
160
2011 2012 2013 2014 2015 2016
Th
ou
sa
nd
s
Asset or fund manager Investment bank
Retai l bank or savings institution Universal bank
Other
Note: Annual volumes of str uctured pr oduc ts sol d to retail investors by pr ovider,EUR bn. Others include: academic i nstitutions ; asset or fund managers;brokerage; commercial banks; independent fi nancial advisers; insurance and
pensi on companies; private banks or w ealth managers; securities companies;SPV.Sources: Structural Retail Products, ESMA.
0
1
2
3
4
5
6
7
0
200
400
600
800
1,000
1,200
2011 2012 2013 2014 2015 2016 2017
Capital protection <100%Capital protection =>100%
Note: N umber of struc tured products sol d to retail investors by type of capitalprotection, thousands. 2017 data until June.Sources: Structured Retail Products, ESMA.
0
50
100
150
2011 2012 2013 2014 2015 2016
=0% >0% <=90% >90% <100% =100%
Note: Volumes of structured products sol d to retail inves tors by level of capitalprotection, EURbn.Sources: Structured Retail Products, ESMA.
0
40
80
120
160
2011 2012 2013 2014 2015 2016
Long Term (>6 years) Medium Term (>2 and <=6 years)
Short Term (<=2 years)
Note: Annual volumes of structured products sol d to retail inves tors byinvestment term, EURbn.Sources: Structured Retail Products, ESMA.
0
40
80
120
160
2011 2012 2013 2014 2015 2016
Growth Income Growth and Income
Note: Volumes of structured products sold to retail investors by type, EURbn.Sources: Structured Retail Products, ESMA.

ESMA Report on Trends, Risks and Vulnerabilities No. 2, 2017 82
Infrastructures and services
Trading venues and MiFID entities
A.171 A.172 On-going trading suspensions by rationale Trading suspensions – lifecycle and removal
A.173 A.174 Equity trading turnover by transaction type Share of equity trading by transaction type
A.175 A.176 Equity trading turnover by type of trading venue Equity trading turnover by origin of issuer
A.177 A.178 Turnover by type of assets Share of turnover by type of assets
0.0
0.5
1.0
1.5
2.0
050
100150200250
2Q15 4Q15 2Q16 4Q16 2Q17
Market management arrangementsIssuer's failure to disclose periodic in formation on timeUndisclosed price-sensitive informationOther non-compliance with rules of the regulated marketOther disorderly trading conditionsUnknownAverage duration (rhs)
Note: N umber of suspensions of financial ins truments traded on EEA tradi ngvenues on- going at the end of the reporting period, grouped by quarter duringwhich they started and by rational e. Aver age durati on, in years, computed as the
mean of the difference between the end-of-quarter date and the start date.Sources: ESMA Registers.
0
10
20
30
40
50
0
50
100
150
200
250
300
2Q15 4Q15 2Q16 4Q16 2Q17
Suspensions begun Suspensions ended
Removals Average duration (rhs)Note: Number of dead suspensi ons, split by the quarter during which they startedand ended, and r emovals of financial instrum ents traded on EEA trading venues.Average duration of dead suspensions , in days, computed as the mean of the
difference between the end-of-quarter date and the start date.Sources: ESMA Registers.
0
500
1,000
1,500
2,000
Jun-15 Oct-15 Feb-16 Jun-16 Oct-16 Feb-17 Jun-17Dark pools EOBOff-order book TRFAll trading 2Y-AVG
Note: Monthly equity turnover on EU tradi ng venues by transacti on type. EUR bn.2Y-AVG=two-year average of all trading, EOB=Electronic Order Book,TRF=Trade Reporting Facilities.
Sources: FESE, ESMA.
Dark pools2.5%
Electronic order book
53.1%
Off-order book
13.7%
Trading reporting
facilities30.7%
Note: Share of equity turnover by transacti on type over the reporting period, as %of total.Sources: FESE, ESMA.
0
2
4
6
8
10
0
500
1,000
1,500
2,000
2,500
Jun-15 Oct-15 Feb-16 Jun-16 Oct-16 Feb-17 Jun-17
Regulated exchanges MTF
Share of MTFs (rhs) 1Y-MA share (rhs)Note: Monthly equity turnover by type of EU tradi ng venue, i n EUR bn. Trading onmultilateral tradi ng facilities as % of total trading on the right axis. 1Y-MAshare=one-year moving average share of MTFs.
Sources: FESE, ESMA.
0
100
200
300
400
500
600
Jun-15 Oct-15 Feb-16 Jun-16 Oct-16 Feb-17 Jun-17
Domestic issuer Foreign issuer
1Y-MA domestic 1Y-MA foreignNote: Monthly equity turnover on EU trading venues by origi n of the traded equity,in EUR bn. Data for London Stock Exchange, Equiduc t and BATS Chi-X Europeare not reported. Foreign equiti es are issued i n a country other than that of the
trading venue.Sources: FESE, ESMA.
0
10
20
30
40
0
500
1,000
1,500
2,000
2,500
Jun-15 Oct-15 Feb-16 Jun-16 Oct-16 Feb-17 Jun-17
Bonds Equities ETFs (rhs) UCITS ( rhs)Note: Monthly turnover on EU trading venues by type of assets, in EUR bn. D atafor Aquis Exchange, BATS Chi-x Eur ope, Equiduct, London Stock Exchange,TOM MTF and Turquoise are not reported for bonds, ETFs and UCITS.
Sources: FESE, ESMA.
Bonds28.3%
ETFs1.1%
Equities70.3%
UCITS0.3%
Note: Share of turnover by asset classes, in % of total turnover over thereporting period. Data for Aquis Exchange, BATS Chi-x Europe, Equi duct,London Stock Exchange, TOM MTF and Turquoise are not reported for bonds ,
ETFs and UCITS.Sources: FESE, ESMA.

ESMA Report on Trends, Risks and Vulnerabilities No. 2, 2017 83
A.179 A.180 Circuit breaker occurrences by market capitalisation Circuit breaker trigger events by sector
A.181 A.182 Number of entities authorised under MiFID Share of entities authorised under MiFID by country
Central counterparties
A.183 A.184 Value cleared Trade size
A.185 A.186 IRS CCP clearing Share of transactions cleared by CCPs
0
400
800
1,200
1,600
Mar-16 Jun-16 Sep-16 Dec-16 Mar-17 Jun-17
Large caps Mid caps Small caps ETFs
Note: N umber of daily circuit breaker trigger events by type of financial instr umentand by market cap. R esults displayed as weekly aggregates.T he analysis isbased on a sample of 10,000 securities , includi ng all cons tituents of the STOXX
Europe 200 Large/Mid/Small caps and a large sample of ETFs tracking theSTOXX index or sub-index.Sources: Morningstar Real-Time Data, ESMA.
0
25
50
75
100
Jun-16 Aug-16 Oct-16 Dec-16 Feb-17 Apr-17 Jun-17
Financials Healthcare
Util ities Industr ials
1M-MA Financials (rhs)Note: Percentage of circuit breaker trigger events by economic sector. Resultsdisplayed as w eekly aggregates .The analysis is based on a sample of 10,000securities, incl uding all constituents of the STOXX Europe 200 Large/Mid/Small
caps and a large sample of ETFs tracking the STOXX index or sub-index.Sources: Morningstar Real-Time Data, ESMA.
-200
-100
0
100
200
8,000
8,100
8,200
8,300
8,400
8,500
2Q12 2Q13 2Q14 2Q15 2Q16 2Q17
Withdrawn entities Newly authorised entities
Number of entitiesNote: N umber of entities authorised under MiFID by national competentauthorities of the Member States and notifi ed to ESMA. Newly authorised entitiesand withdrawn entities on the right axis.
Sources: ESMA Registers.
United Kingdom
36%
Germany28%
Italy7%
France5%
Spain3%
Netherlands3%
Denmark2%
Others16%
Note: N umber of entities authorised under MiFID by national competentauthorities and notified to ESMA, in %.Sources: ESMA Registers.
0
100
200
300
400
500
2010 2011 2012 2013 2014 2015 2016
Cash Repo OTC ETD
Note: Volume of transactions cleared by reporting CCPs. Annual data, EUR tn,for Cash, R epos, non-OTC and OTC derivatives. LCH Ltd, although the l argestCCP in terms of volume in the OTC segment, is not reported due to uneven
reporting during the period.Sources: ECB, ESMA.
0
5
10
15
20
0
0.1
0.2
0.3
0.4
2010 2011 2012 2013 2014 2015 2016
ETD OTC Cash Repo (rhs)
Note: Aver age size of transactions cleared by reporting CCPs, for Cash, Repos,non-OTC and OTC derivatives. Annual data, EUR mn. LCH Ltd, although thelargest CCP in terms of volume in the OTC segment, is not reported due to
uneven reporting during the period.Sources: ECB, ESMA.
60
70
80
90
100
Jun-15 Oct-15 Feb-16 Jun-16 Oct-16 Feb-17 Jun-17
Swap Basis Swap OIS FRA
Note: OTC interest rate derivatives cleared by CCPs captured by Dealer vs. CCPpositions, in % of total noti onal amount. Spikes due to short-term movements innon-cleared positions.
Sources: DTCC, ESMA.
EUREX Clearing
50%ICE Clear
Europe
20%
LCH SA19%
CCG8%
Others3%
Note: Share of volume of transactions cleared by reporting CCPs for C ash,Repos, non-OTC and OTC derivatives, 2016. LCH Ltd, although the largest CCPin terms of volume in the OTC segment, is not reported due to uneven reporting
during the period.Sources: ECB, ESMA.

ESMA Report on Trends, Risks and Vulnerabilities No. 2, 2017 84
A.187 A.188 IRD trading volumes CDS trading volumes
Central securities depositories
A.189 A.190 Settlement activity Settlement fails
A.191 A.192 Securities held in CSD accounts Value of settled transactions
Credit rating agencies
A.193 A.194 Outstanding ratings issued by the top 3 CRAs Outstanding ratings excluding the top 3 CRAs
0
20
40
60
80
100
0
50
100
150
200
Jun-15 Oct-15 Feb-16 Jun-16 Oct-16 Feb-17 Jun-17
Cleared Non-cleared
% cleared 1Y-MA % clearedNote: Daily trading vol umes for EU-currency-denominated IRD products (EUR,HUF, PLN, GBP). Produc ts include IRS, basis swaps, FRAs, infl ation swaps,OIS. 40D-MA notional data, in USD bn. ISDA SwapsInfo data ar e based on
publicly availabl e data from DTCC Trade R epository LLC and Bloomberg SwapData Repository.Sources: ISDA SwapsInfo, ESMA.
0
20
40
60
80
100
0
5
10
15
20
Jun-15 Oct-15 Feb-16 Jun-16 Oct-16 Feb-17 Jun-17
Cleared Non-cleared
% cleared 1Y-MA % clearedNote: Daily trading vol umes for the main EUR CDS indices including ItraxxEurope, Itr axx Europe Crossover, I traxx Eur ope Senior Financials. 40D-MAnotional data, in USD bn. ISDA SwapsInfo data are based on publicly available
data from DTCC Trade Repository LLC and Bloomberg Swap Data Repository.Sources: ISDA SwapsInfo, ESMA.
0
2
4
6
8
10
Jun-15 Oct-15 Feb-16 Jun-16 Oct-16 Feb-17 Jun-17
Corporate bonds 6M-MA corpEquities 6M-MA equitiesGovernment bonds 6M-MA gov
Note: Share of fail ed settlement instruc tions in the EU, in % of value, one-weekmoving averages. 6M-MA=six-month moving average. Free-of-paymenttransactions not considered.
Sources: National Competent Authorities, ESMA.
0
10
20
30
40
50
60
2010 2011 2012 2013 2014 2015 2016
Others Monte Titoli Iberclear Euroclear Crest Clearstream
Note: Value of securities held by EU CSDs in accounts, EUR tn.Sources: ECB, ESMA.
0
200
400
600
800
1,000
1,200
2010 2011 2012 2013 2014 2015 2016
Others Monte Titoli Iberclear Euroclear Crest Clearstream
Note: Value of settlement instructions processed by EU CSDs, EUR tn.Sources: ECB, ESMA.
70
80
90
100
110
Jul-15 Nov-15 Mar-16 Jul-16 Nov-16 Mar-17 Jun-17
NFC CB F I
Sov Sub-sov SF
Note: Evolution of outstandi ng r atings of S&P, Moody's and Fitch(Jul2015=100). NFC = C orporates, CB = Cover ed bonds , F = Financials, I =Insurance, Sov = Sovereigns, Sub-sov = Sub-sovereign, SF = structured
finance.Sources: RADAR, ESMA
50
100
150
200
250
300
350
400
Jul-15 Nov-15 Mar-16 Jul-16 Nov-16 Mar-17 Jun-17
NFC CB F I
Sov Sub-sov SFNote: Evoluti on of outstanding ratings by asset type. All CRAs excl uding S&P,Moody's and Fitch (Jul2015=100). NFC = C orporates, CB = Covered bonds, F =Financials, I = Insurance, Sov = Sovereigns , Sub-sov = Sub-sovereign, SF =
structured finance.Sources: RADAR, ESMA.

ESMA Report on Trends, Risks and Vulnerabilities No. 2, 2017 85
Financial benchmarks
A.195 A.196 Number of Euribor panel banks Dispersion in Euribor contributions
A.197 A.198 Euribor submission dispersion Euribor submission variation
0
5
10
15
20
25
Jun-15 Oct-15 Feb-16 Jun-16 Oct-16 Feb-17 Jun-17Note: N umber of banks contributi ng to the Euribor panel; non-viability is assumedat 12 contributing banks.Sources: European Money Markets Institute, ESMA.
0
0.1
0.2
0.3
Jun-15 Oct-15 Feb-16 Jun-16 Oct-16 Feb-17 Jun-17Note: N ormalised differ ence in percentage points between the highestcontribution submitted by panel banks and the correspondi ng Euribor rate. Thechart shows the maximum difference across the 8 Euribor tenors.
Sources: European Money Markets Institute, ESMA.
-0.5
-0.4
-0.3
-0.2
-0.1
0.0
0.1
0.2
Jun-15 Oct-15 Feb-16 Jun-16 Oct-16 Feb-17 Jun-17Top 15% Core 70%Bottom 15% Raw 3M Euribor3M Euribor ECB refinancing rate
Note: Dispersion of 3M Euribor submissions, in %. T he "Raw 3M Euribor" rate iscalculated without trimming the top and bottom submissions of the panel for the3M Euribor.
Sources: European Money Markets Institute, ESMA.
-0.4
-0.3
-0.2
-0.1
0.0
0.1
0.0
0.2
0.4
0.6
0.8
1.0
Jun-15 Oct-15 Feb-16 Jun-16 Oct-16 Feb-17 Jun-17
Rate increase Rate unchangedRate reduction ECB refinancing rate (rhs)3M Euribor (rhs)
Note: N umber of banks changi ng their 3M Euribor submission from day to day, in%.Sources: European Money Markets Institute, ESMA.

ESMA Report on Trends, Risks and Vulnerabilities No. 2, 2017 86
List of abbreviations ABS Asset-Backed Securities AuM Assets under Management AVG Average BF Bond fund BPS Basis points CAP Cumulative Accuracy Profile CCP Central Counterparty CDO Collateralised Debt Obligation CDS Credit Default Swap CRA Credit Rating Agency CTA Commodity Trading Advisors funds DTCC Depository Trust and Clearing Corporation EA Euro Area EBA European Banking Authority ECB European Central Bank EF Equity fund EFAMA European Fund and Asset Management Association EIOPA European Insurance and Occupational Pensions Authority EM Emerging market EMIR European Market Infrastructure Regulation EOB Electronic Order Book EONIA Euro Overnight Index Average ESMA European Securities and Markets Authority ETF Exchange Traded Fund EU European Union FRA Forward Rate Agreement IMF International Monetary Fund IPO Initial Public Offering IRD Interest Rate Derivative IRS Interest Rate Swap LTRO Long-Term Refinancing Operation MA Moving Average MBS Mortgage-Backed Securities MMF Money Market Funds MTN Medium Term Note NAV Net Asset Value NCA National Competent Authority NFC Non Financial Corporation OIS Overnight Index Swap OMT Outright Monetary Transactions OTC Over the Counter RMBS Residential Mortgage-Backed Securities SCDS Sovereign Credit Default Swap SF Structured Finance SFT Securities Financing Transaction UCITS Undertaking for Collective Investment in Transferable Securities YTD Year to Date Countries abbreviated according to ISO standards Currencies abbreviated according to ISO standards