3.2: Linear Correlation Measure the strength of a linear relationship between two variables. As x...
12
3.2: Linear Correlation • Measure the strength of a linear relationship between two variables. • As x increases, no definite shift in y: no correlation. • As x increase, a definite shift in y: correlation. • Positive correlation: x increases, y increases. • Negative correlation: x increases, y decreases. • If the ordered pairs follow a
Transcript of 3.2: Linear Correlation Measure the strength of a linear relationship between two variables. As x...

3.2: Linear Correlation
• Measure the strength of a linear relationship between two variables.
• As x increases, no definite shift in y: no correlation.• As x increase, a definite shift in y: correlation.• Positive correlation: x increases, y increases.• Negative correlation: x increases, y decreases.• If the ordered pairs follow a straight-line path:
linear correlation.

Interpreting scatterplots
After plotting two variables on a scatterplot, we describe the
relationship by examining the form, direction, and strength of the
association. We look for an overall pattern …
Form: linear, curved, clusters, no pattern
Direction: positive, negative, no direction
Strength: how closely the points fit the “form”
… and deviations from that pattern. Outliers

Form and direction of an association
Linear
Nonlinear
No relationship

Positive association: High values of one variable tend to occur together
with high values of the other variable.
Negative association: High values of one variable tend to occur together
with low values of the other variable.
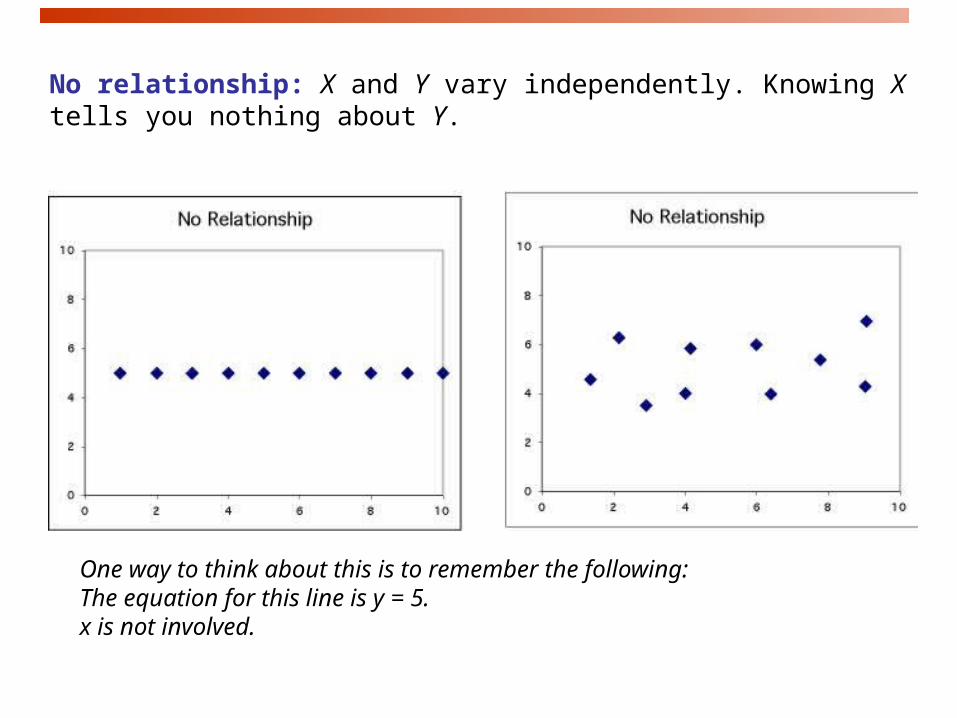
One way to think about this is to remember the following: The equation for this line is y = 5.x is not involved.
No relationship: X and Y vary independently. Knowing X tells you nothing about Y.

Strength of the association
The strength of the relationship between the two variables can be
seen by how much variation, or scatter, there is around the main form.
With a strong relationship, you can get a pretty good estimate
of y if you know x.
With a weak relationship, for any x you might get a wide range of
y values.

This is a very strong relationship.
The daily amount of gas consumed
can be predicted quite accurately for
a given temperature value.
This is a weak relationship. For a
particular state median household
income, you can’t predict the state
per capita income very well.

Outliers
An outlier is a data value that has a very low probability of occurrence
(i.e., it is unusual or unexpected).
In a scatterplot, outliers are points that fall outside of the overall pattern
of the relationship.

Not an outlier:
The upper right-hand point here is
not an outlier of the relationship—It
is what you would expect for this
many beers given the linear
relationship between beers/weight
and blood alcohol.
This point is not in line with the
others, so it is an outlier of the
relationship.
Outliers

55504540353025201510
60
50
40
30
20
Input
Out
put
Example: positive correlation.
As x increases, y also increases.

302010
55
45
35
Input
Out
put
Example: no correlation. As x increases, there is no definite shift in y.

55504540353025201510
95
85
75
65
55
Input
Out
put
Example: negative correlation.
As x increases, y decreases.