
31, Fund Other Moderator: Presenter: Douglas L. Robbins ... · Douglas L. Robbins, FSA, MAAA...
71
Session 31, Statistical Techniques for Fund Mapping and Other Applications Moderator: Douglas L. Robbins, FSA, MAAA Presenter: Douglas L. Robbins, FSA, MAAA
Transcript of 31, Fund Other Moderator: Presenter: Douglas L. Robbins ... · Douglas L. Robbins, FSA, MAAA...
Session 31, Statistical Techniques for Fund Mapping and Other Applications
Moderator:
Douglas L. Robbins, FSA, MAAA
Presenter: Douglas L. Robbins, FSA, MAAA
Douglas L. Robbins
August 29, 2016
Statistical Techniques for Fund Mapping and Other Applications
2
Topics
Fund Mapping: What, Why, How?
Where do Linear Models Fit?
What Can Go Wrong?
Other Statistical Thoughts
3
Topics
Fund Mapping: What, Why, How?
4
DefinitionsFund – A subaccount within a
Variable Product Held within the Separate Account Has an objective (growth, income, etc) Many managed outside the ins co
Index – An indicator or measure of the performance of a certain broad asset class; may be real (e.g., S&P500) or notional (e.g., Large Cap)
5
How are the Two Related?One of them truly exists within typical
variable products
The other, at least for VA / VL, exists only w/i models
What does thatmean? Why doesit matter?
6
Fund Mapping GoalsBy its nature, every fund probably has
different risk & expected return characteristics Conservative funds tend to be low on both Aggressive funds have the opposite tendency
But there’s more to it, as asset blends all have their own tendencies
Fund mapping is an attempt at capturing these tendencies
7
What will this Affect?For recent business, conservatism will
generally reduce rider costs – bonds especially so (more on that below)
For seasoned business, it’s less clear:For an AB or DB may still be trueFor an IB or WB, think about the
possible futures for Cash and/or BondsBonds can end up being a worst case
once a contract is deeply in the money
8
How Does One Map Funds?There are really three approaches,
which may be complementary Find a published info “source” for each fund,
which indicates long-run goals Find a “source” that gives you current mix Use a linear model of some sort to analyze
return data and come up with a mapping
It is probably a good idea to try to do more than one of these
9
One Recent Actual CaseAvailable information on a given fund Morningstar allocation by asset classes−Reasonable given what one might expect−Had a subset of “unmappable” classes
Fund and Index Returns by month for 20 years
Amenable to a “combined” look, using a true statistical approach Morningstar becomes “null hypothesis” Linear model used to “accept” or “reject”
10
Topics
Where do Linear Models Fit?
11
DefinitionsWhat does “Linear Model” even
mean?
At the end of the day, it means you are mapping predictors to predictees using linear factors
One way to think about this involves matrices (something from WAY back)
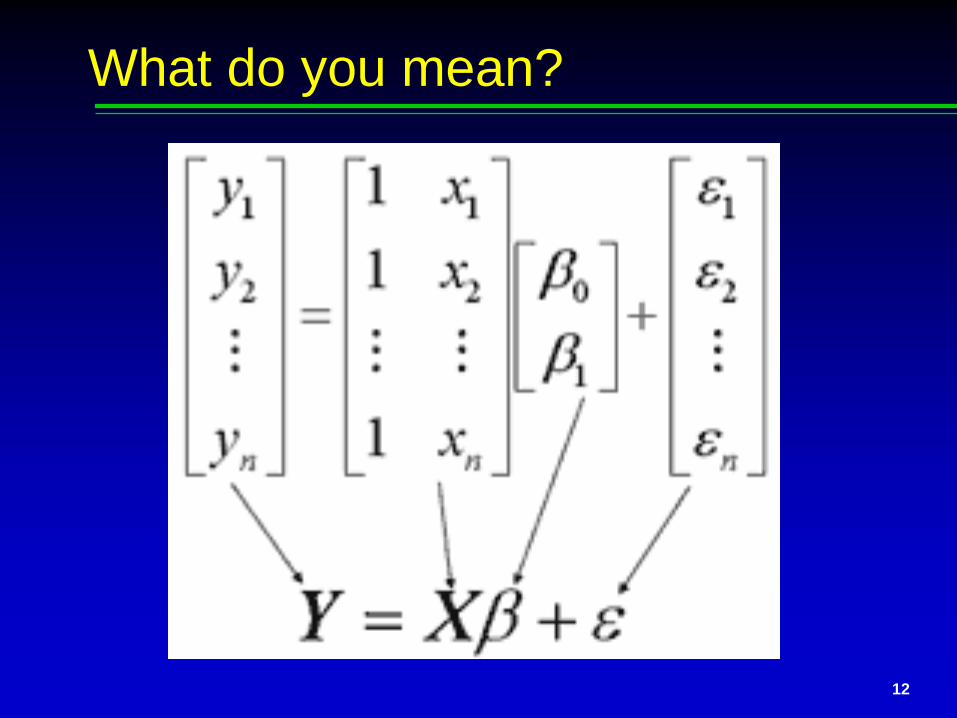
12
What do you mean?
13
A Couple Important PointsThe matrix of predictors and the vector
of coefficients can have “n” dimensions
There is no scientific reason you need a column of constants (i.e., the “1s”), or a least squares goal
Then why is it the most common textbook example? Because it’s elegant, intuitive, & easy to visualize And also, this . . . .
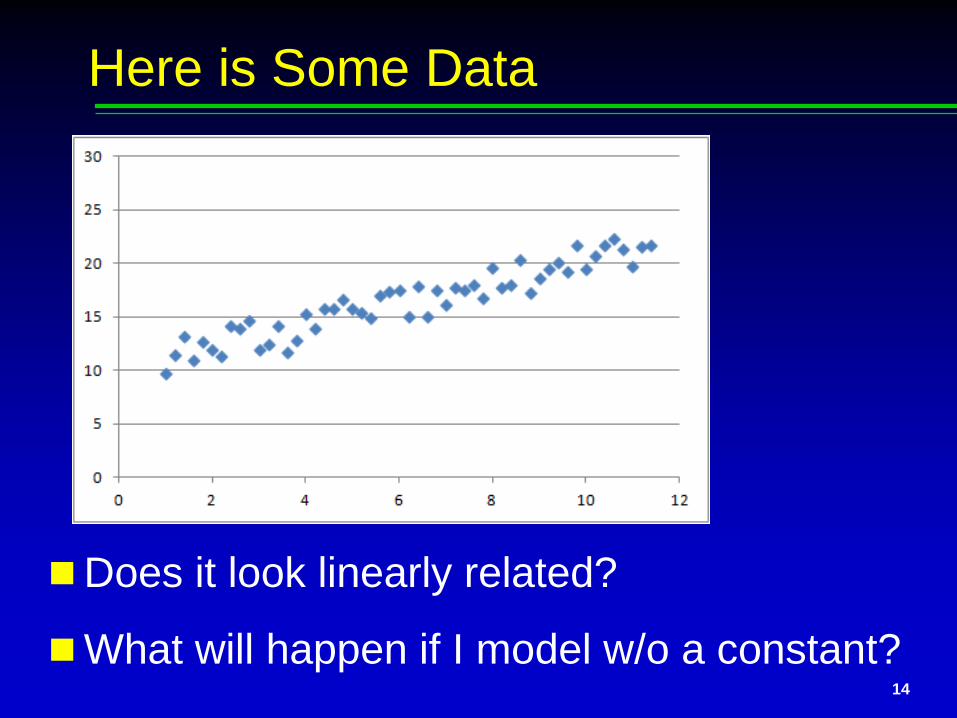
Does it look linearly related?
What will happen if I model w/o a constant?14
Here is Some Data
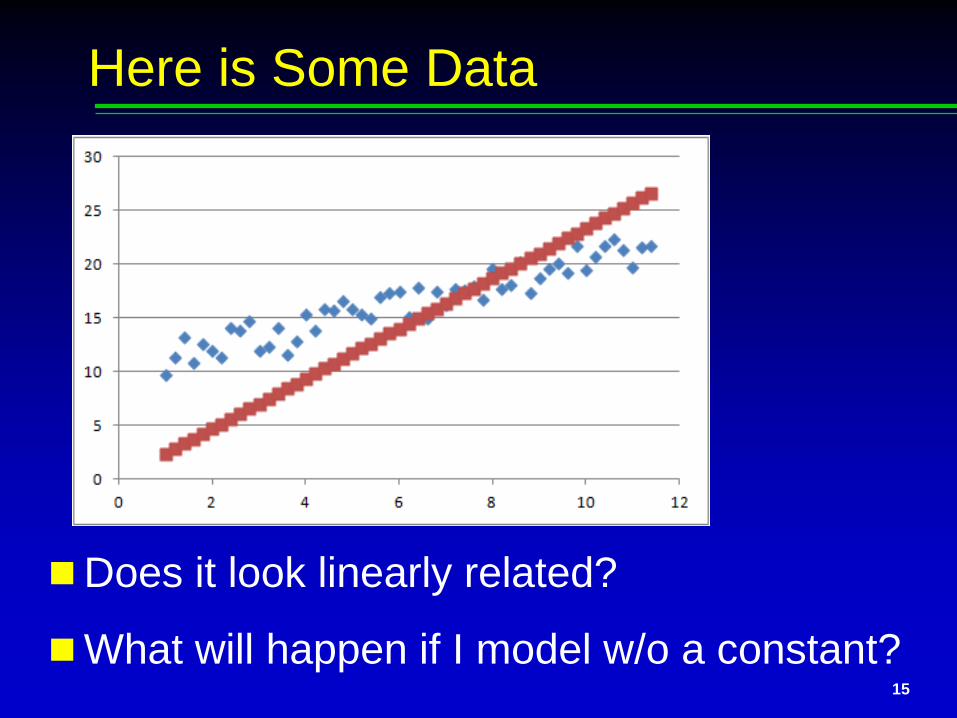
Does it look linearly related?
What will happen if I model w/o a constant?15
Here is Some Data
16
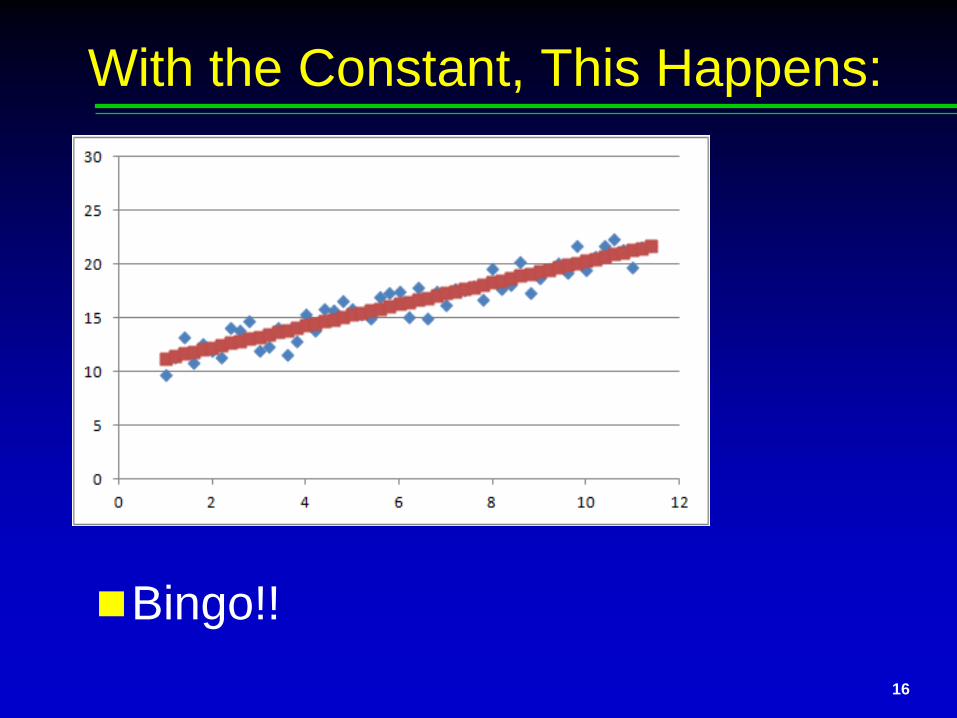
With the Constant, This Happens:
Bingo!!
17
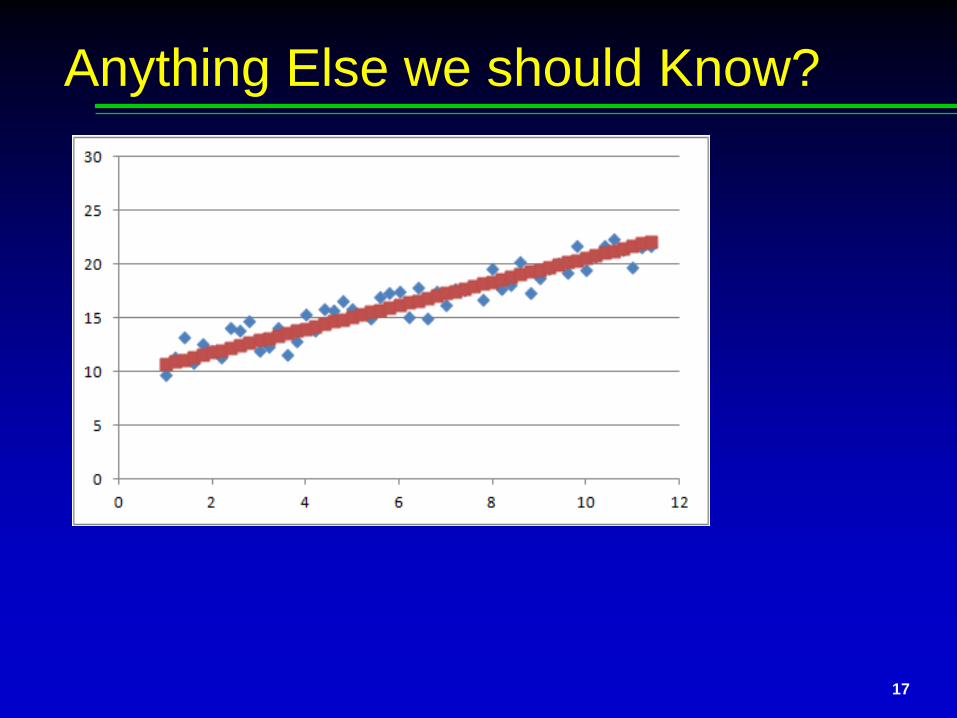
Anything Else we should Know?
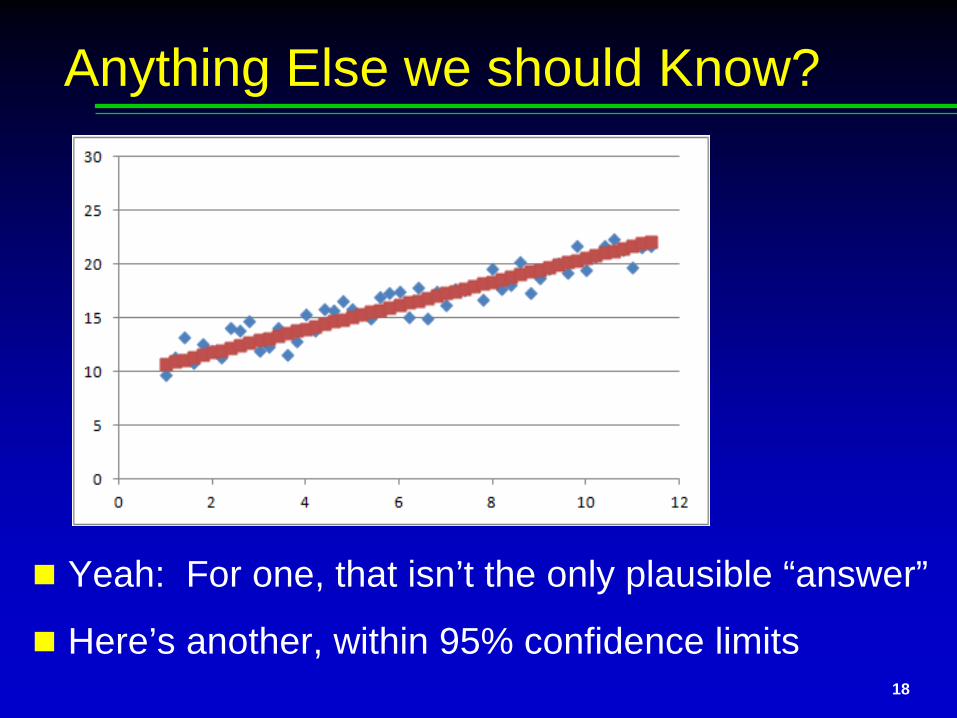
Yeah: For one, that isn’t the only plausible “answer”
Here’s another, within 95% confidence limits18
Anything Else we should Know?
19
When that can Haunt YouWhen does this matter “a little”?
When would it matter “a lot”?
Should this issue concern me, vis-à-vis Fund Mapping?
What else, related to Fund Mapping?− Using a zero constant is a practical necessity− Multiple “X” variables are a key feature
20
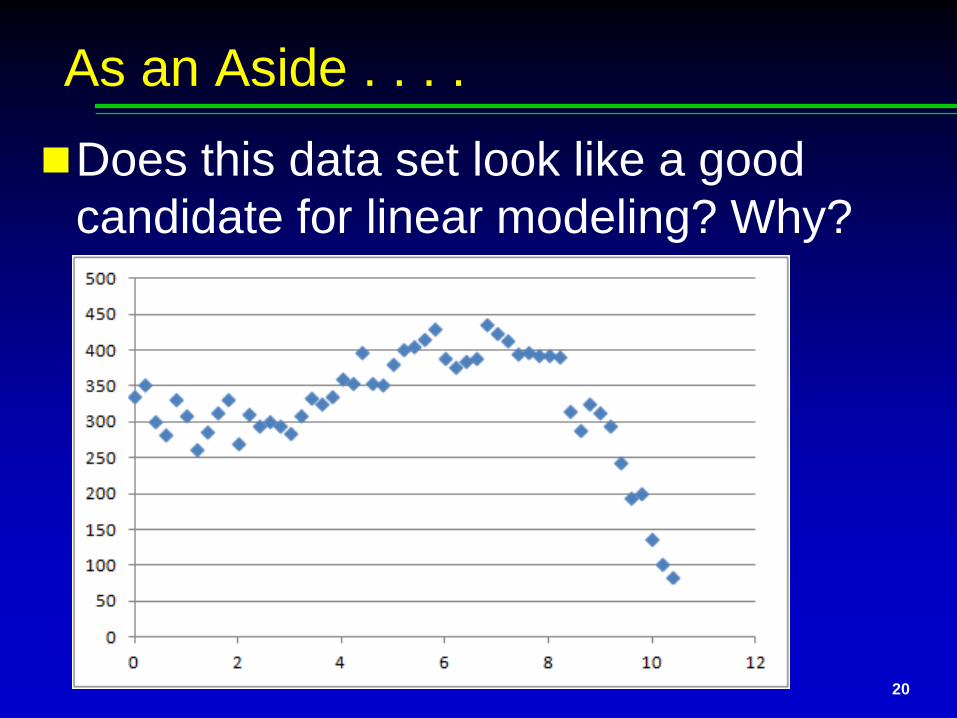
As an Aside . . . .
Does this data set look like a good candidate for linear modeling? Why?
21
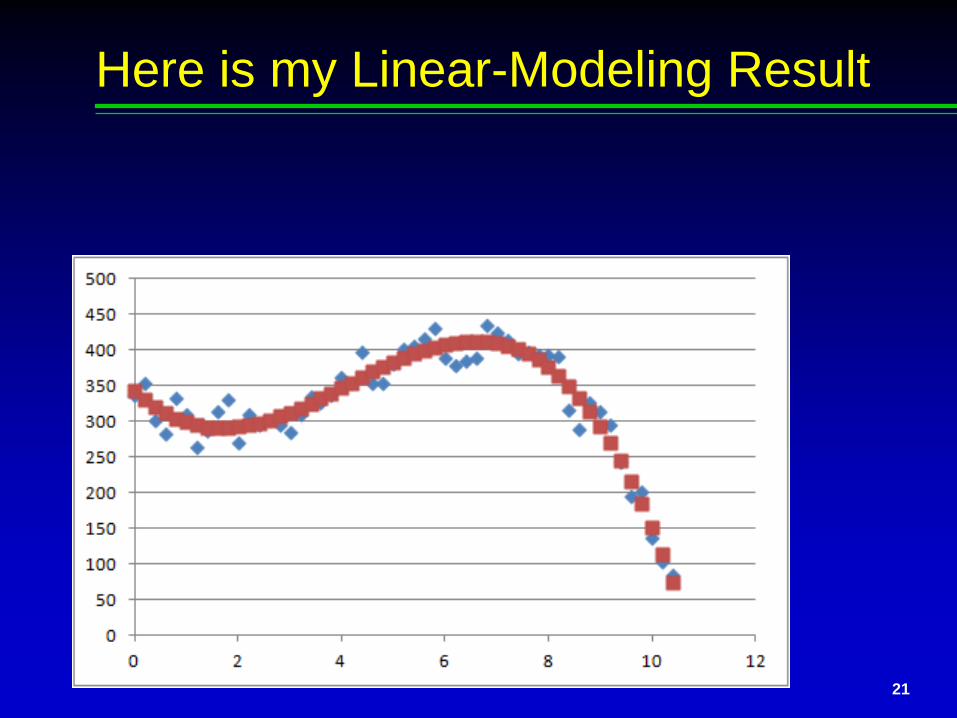
Here is my Linear-Modeling Result
22
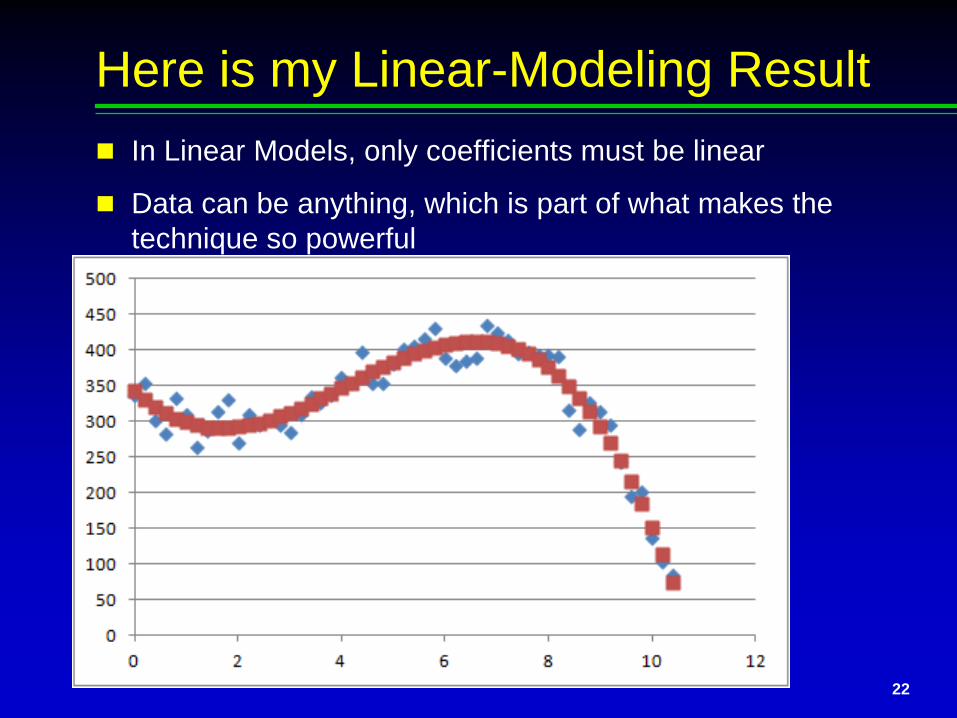
Here is my Linear-Modeling Result In Linear Models, only coefficients must be linear
Data can be anything, which is part of what makes the technique so powerful
23
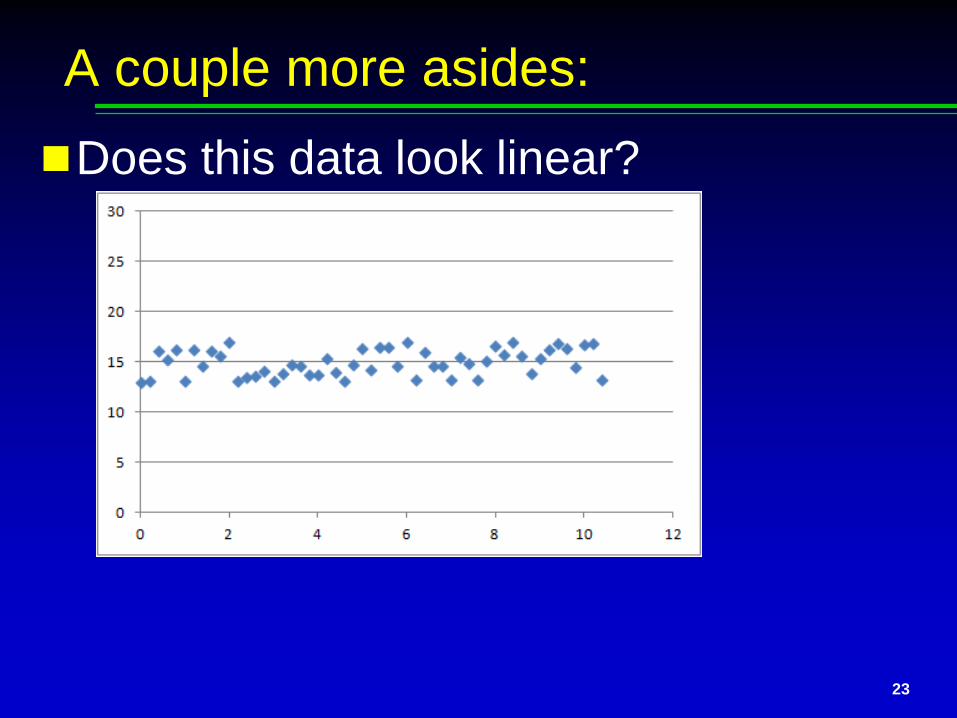
A couple more asides:Does this data look linear?
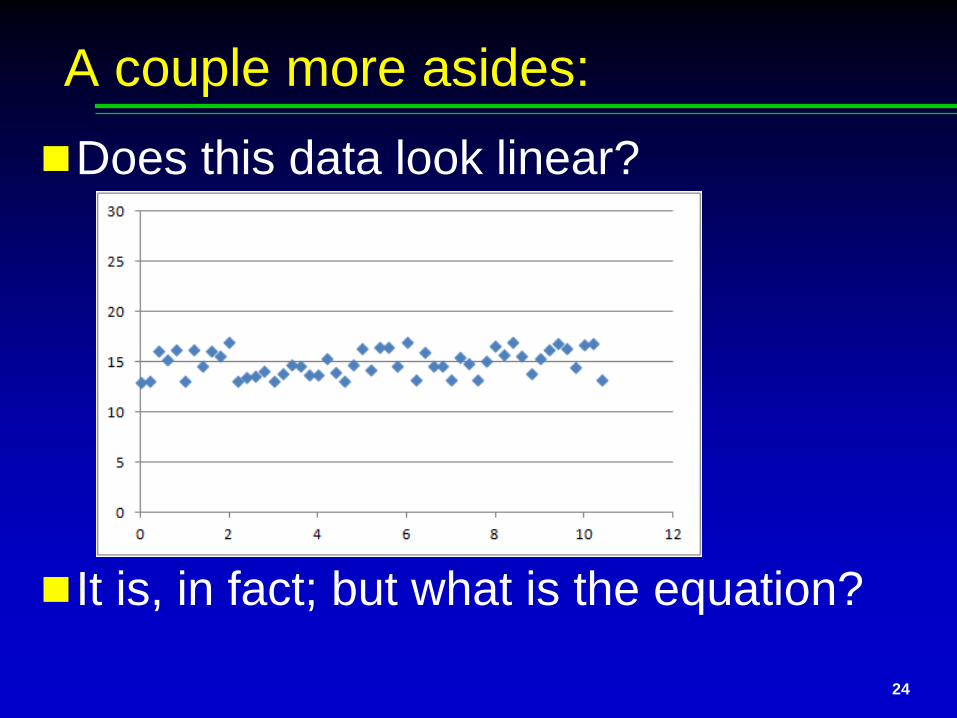
24
A couple more asides:Does this data look linear?
It is, in fact; but what is the equation?
25
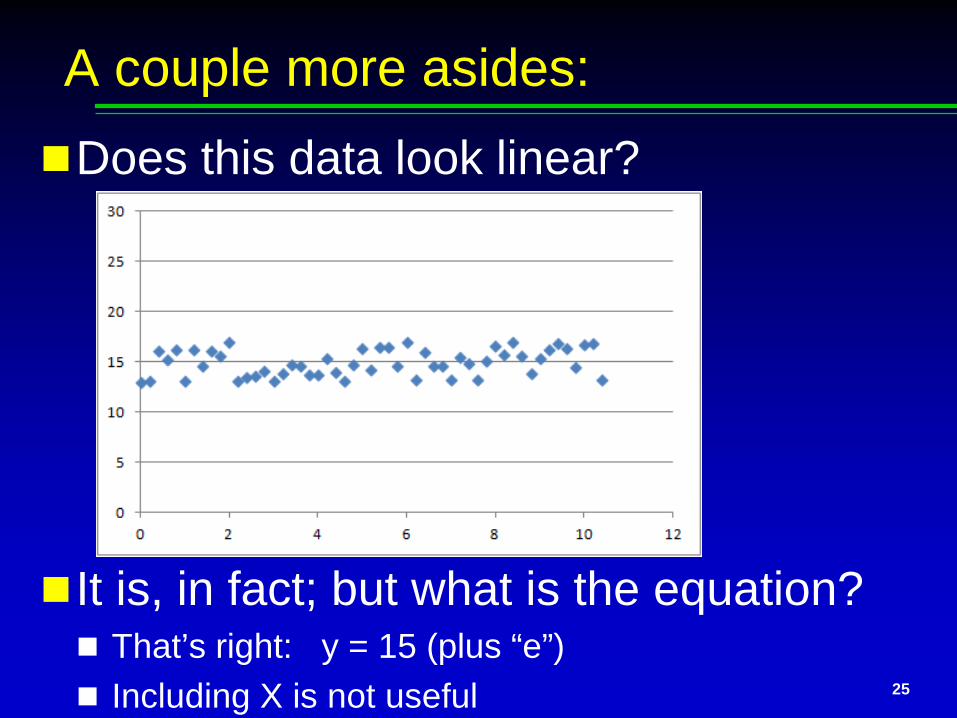
A couple more asides:Does this data look linear?
It is, in fact; but what is the equation? That’s right: y = 15 (plus “e”) Including X is not useful
26
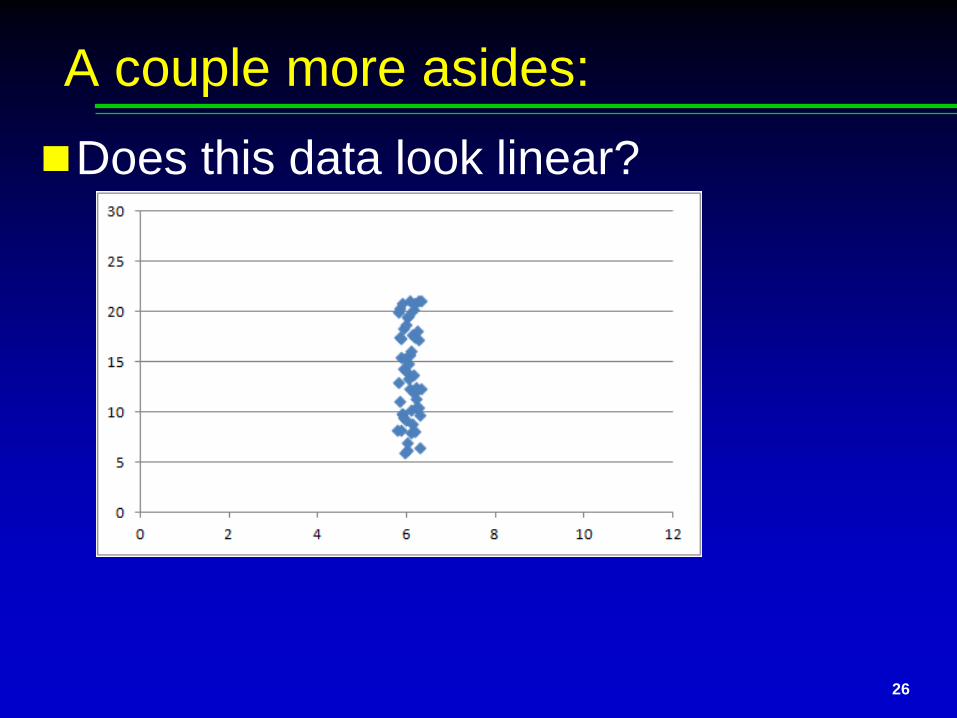
A couple more asides:Does this data look linear?
27
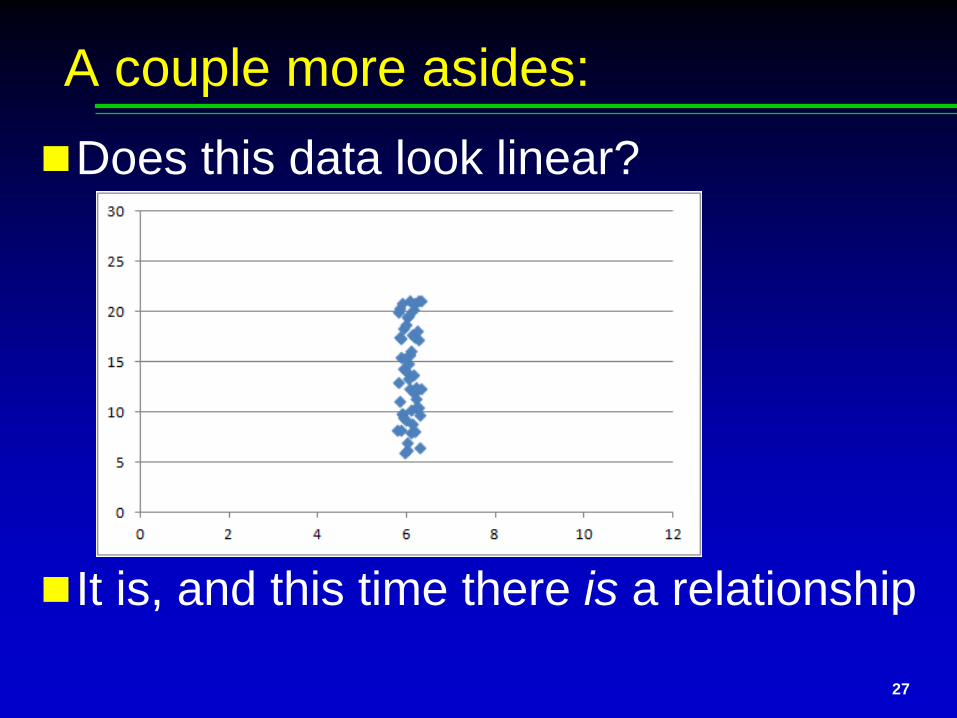
A couple more asides:Does this data look linear?
It is, and this time there is a relationship
28
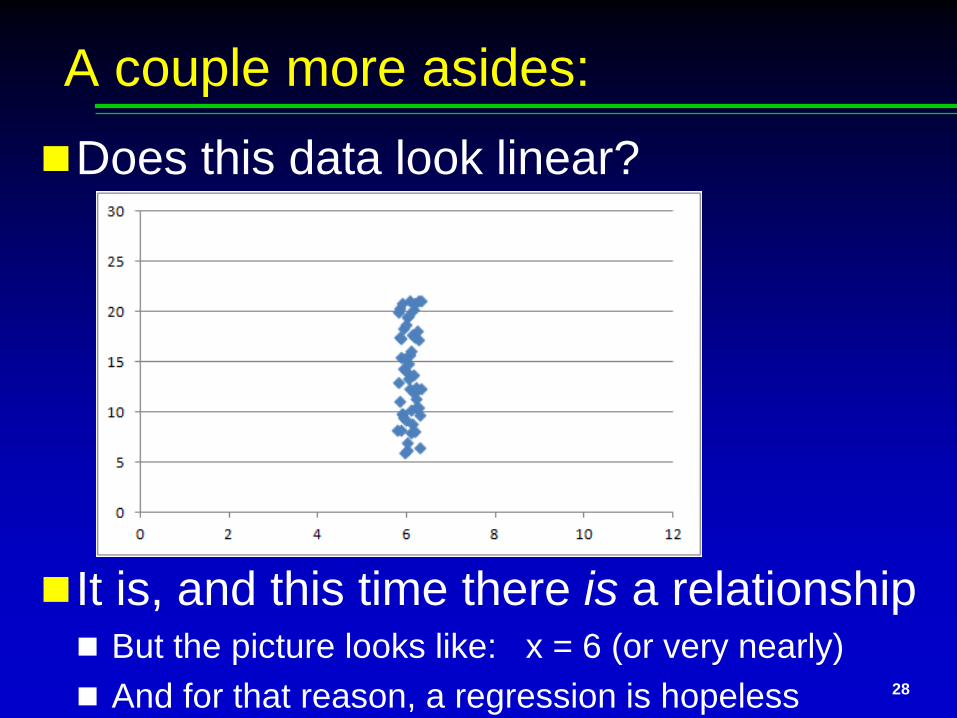
A couple more asides:Does this data look linear?
It is, and this time there is a relationship But the picture looks like: x = 6 (or very nearly) And for that reason, a regression is hopeless
29
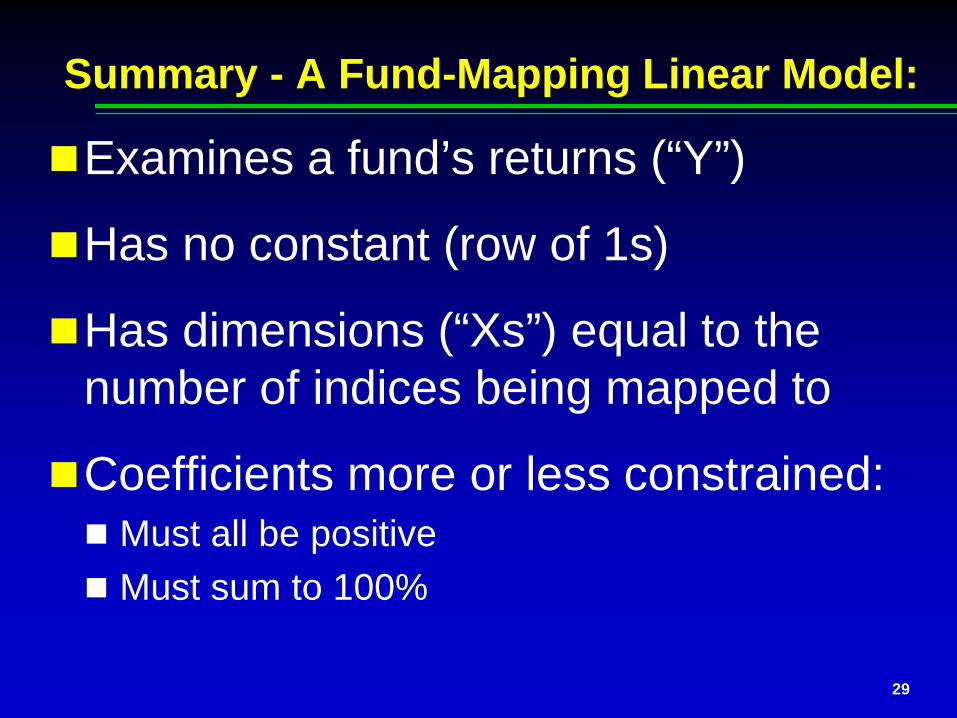
Summary - A Fund-Mapping Linear Model:
Examines a fund’s returns (“Y”)
Has no constant (row of 1s)
Has dimensions (“Xs”) equal to the number of indices being mapped to
Coefficients more or less constrained: Must all be positive Must sum to 100%
30
Topics
What Can Go Wrong?
31
Cash is Typically Tough to Map
32
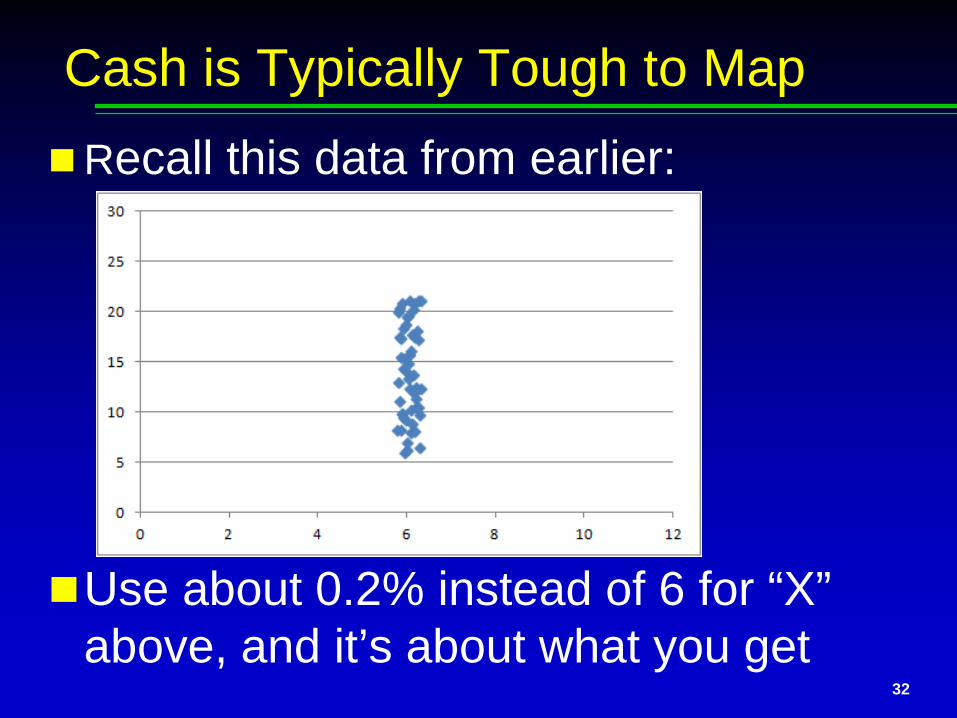
Cash is Typically Tough to MapRecall this data from earlier:
Use about 0.2% instead of 6 for “X” above, and it’s about what you get
33
Most Funds won’t map well to all 5 Indices
Some will have a trivial or essentially a “0 coefficient” relationship to the fund’s returns
If your process doesn’t sort these out, future “predictability” will be hurt
Additionally, due to constraints, and since Cash has minimal impact on final return, it will tend to rise or fall very fluidly; result?
May need to estimate Cash outside of your Linear Model (as in my Morningstar example – can’t reject “null hypothesis,” really)

34
Possibly the Biggest Potential Pitfall

35
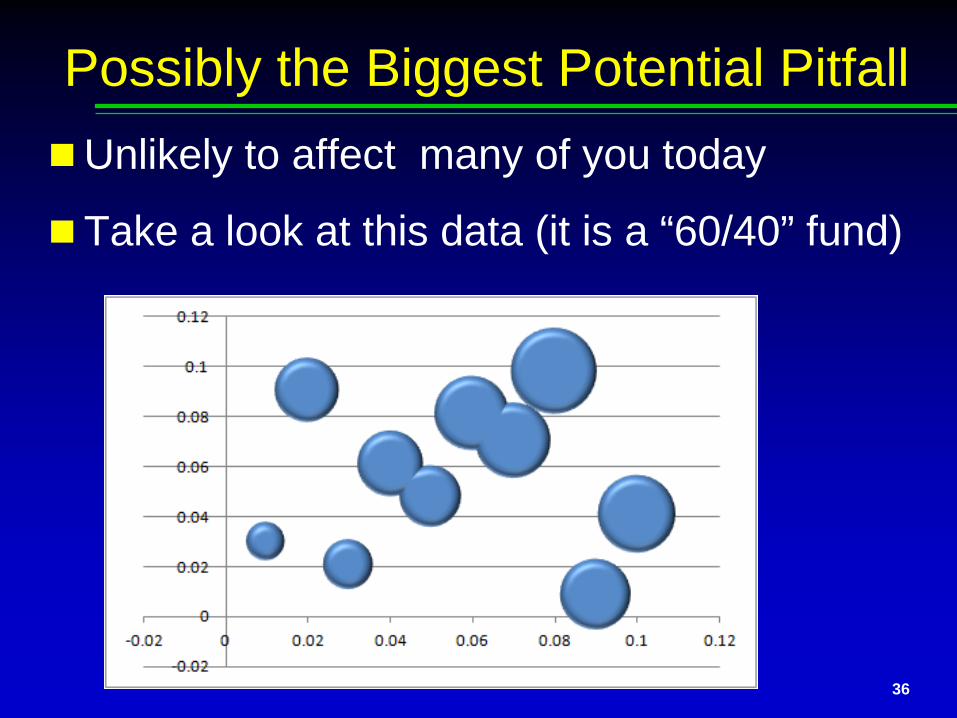
Possibly the Biggest Potential PitfallUnlikely to affect many of you today
36
Possibly the Biggest Potential PitfallUnlikely to affect many of you today
Take a look at this data (it is a “60/40” fund)
37
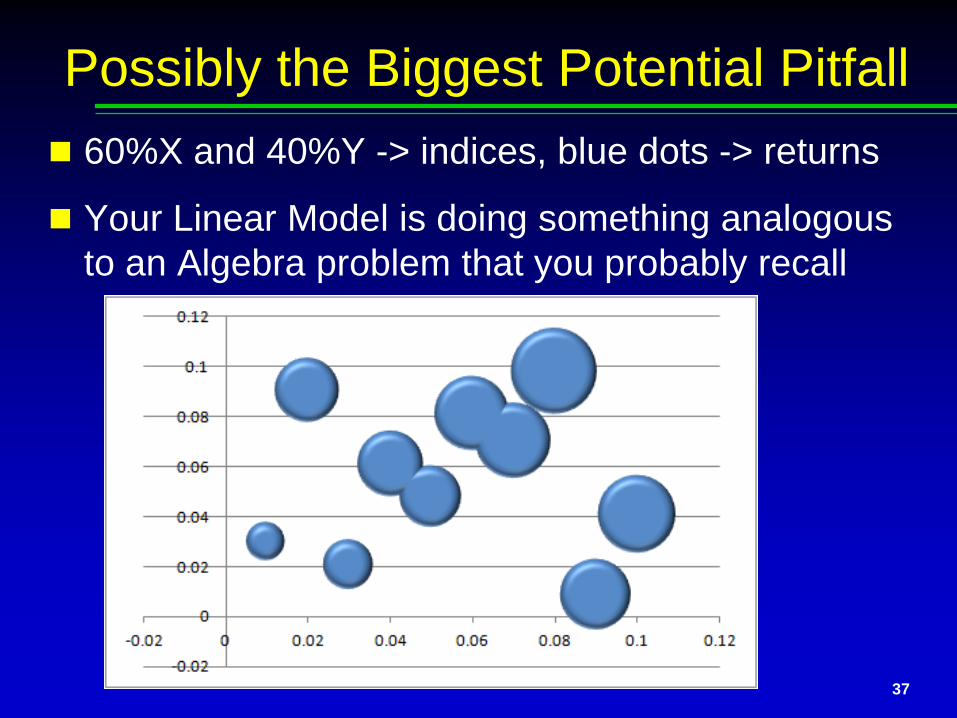
Possibly the Biggest Potential Pitfall 60%X and 40%Y -> indices, blue dots -> returns
Your Linear Model is doing something analogous to an Algebra problem that you probably recall
38
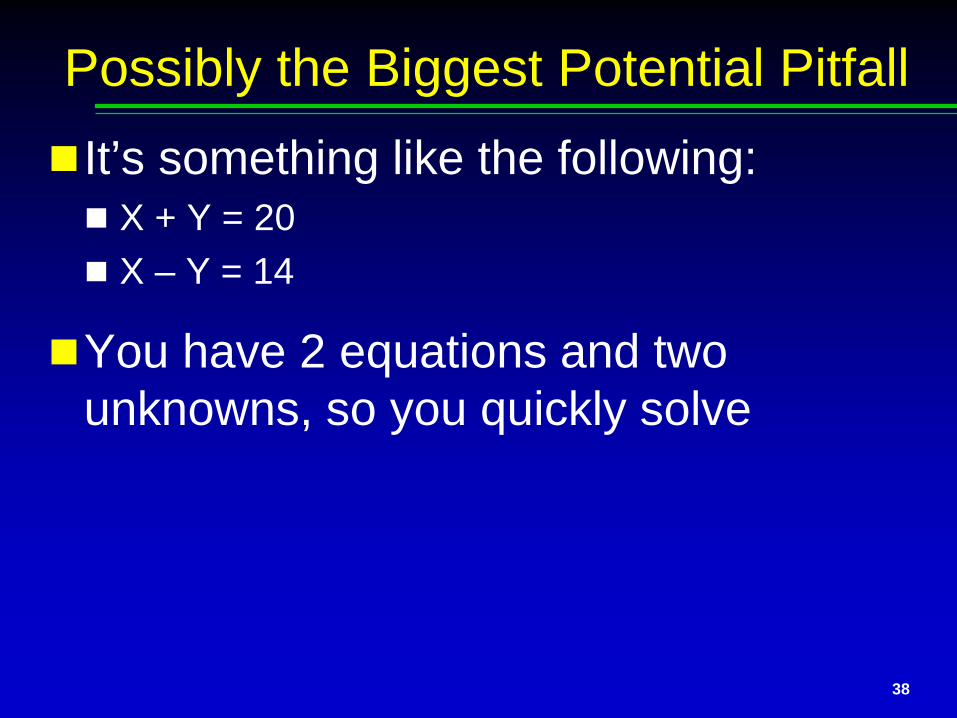
Possibly the Biggest Potential PitfallIt’s something like the following: X + Y = 20 X – Y = 14
You have 2 equations and two unknowns, so you quickly solve
39
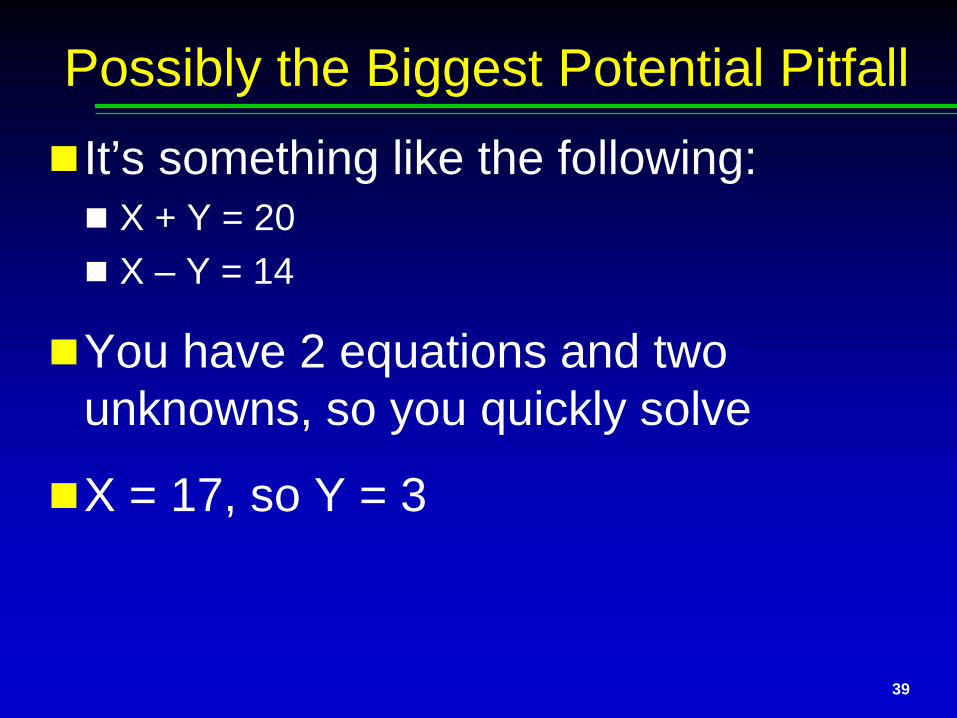
Possibly the Biggest Potential PitfallIt’s something like the following: X + Y = 20 X – Y = 14
You have 2 equations and two unknowns, so you quickly solve
X = 17, so Y = 3
40
Possibly the Biggest Potential PitfallIt’s something like the following: X + Y = 20 X – Y = 14
You have 2 equations and two unknowns, so you quickly solve
X = 17, so Y = 3
Yay!
41
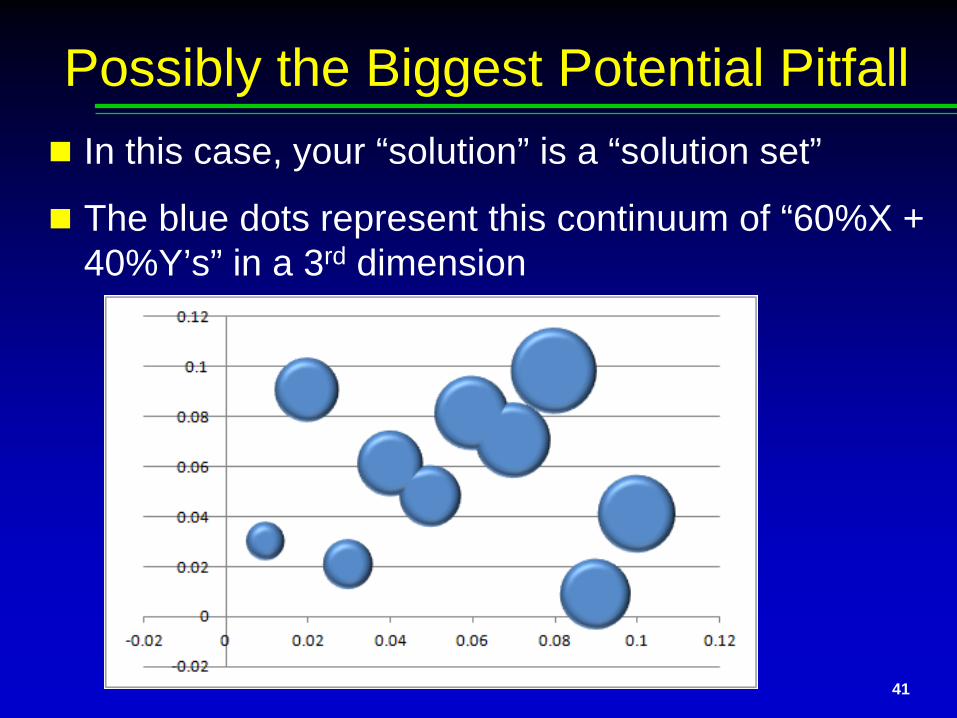
Possibly the Biggest Potential Pitfall In this case, your “solution” is a “solution set”
The blue dots represent this continuum of “60%X + 40%Y’s” in a 3rd dimension
42
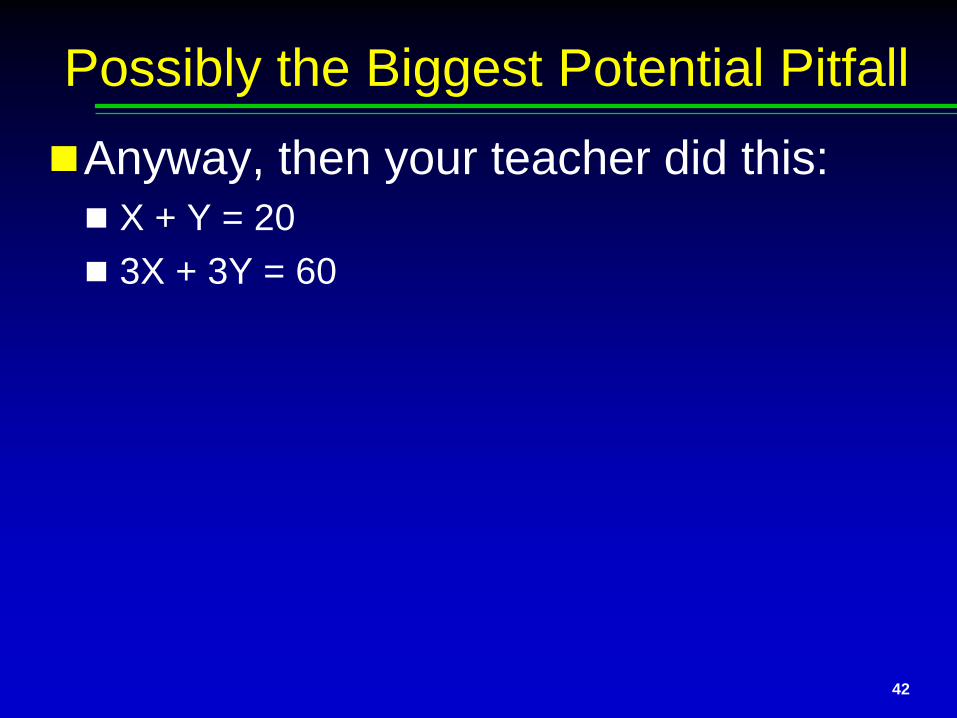
Possibly the Biggest Potential PitfallAnyway, then your teacher did this: X + Y = 20 3X + 3Y = 60

43
Possibly the Biggest Potential PitfallAnyway, then your teacher did this: X + Y = 20 3X + 3Y = 60
And you threw your hands up in the air, and said, “But . . . the answer could be anything!!”
44
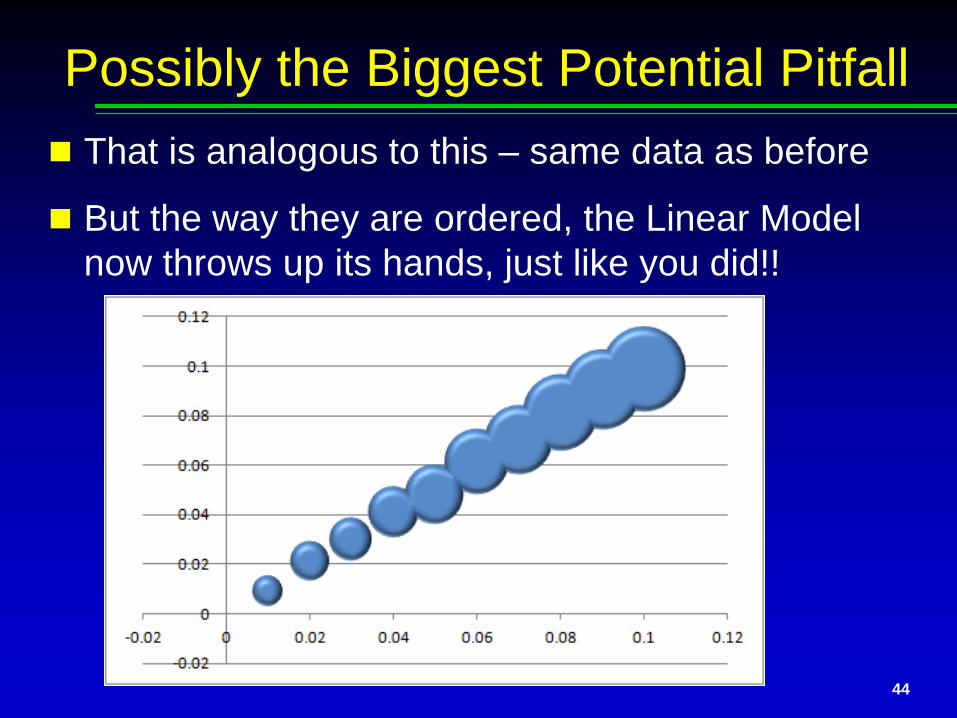
Possibly the Biggest Potential Pitfall That is analogous to this – same data as before
But the way they are ordered, the Linear Model now throws up its hands, just like you did!!
45
Possibly the Biggest Potential Pitfall In the first case, a regression’s output will
almost always be very accurate
46
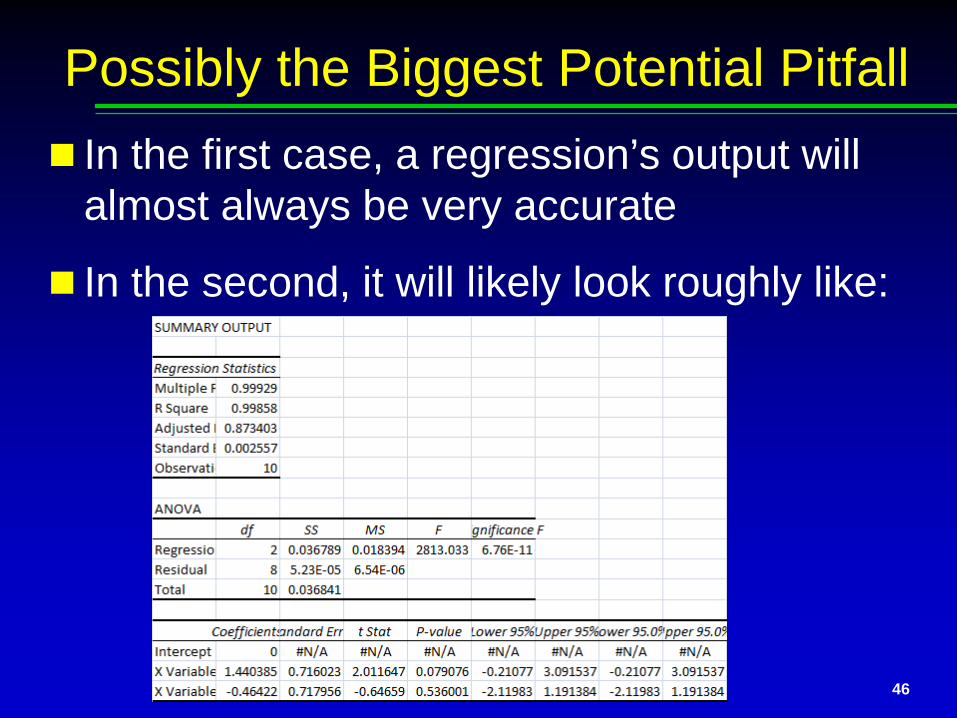
Possibly the Biggest Potential Pitfall In the first case, a regression’s output will
almost always be very accurate
In the second, it will likely look roughly like:
Unfortunately, a differing Beta doesn’t help
47
Possibly the Biggest Potential Pitfall
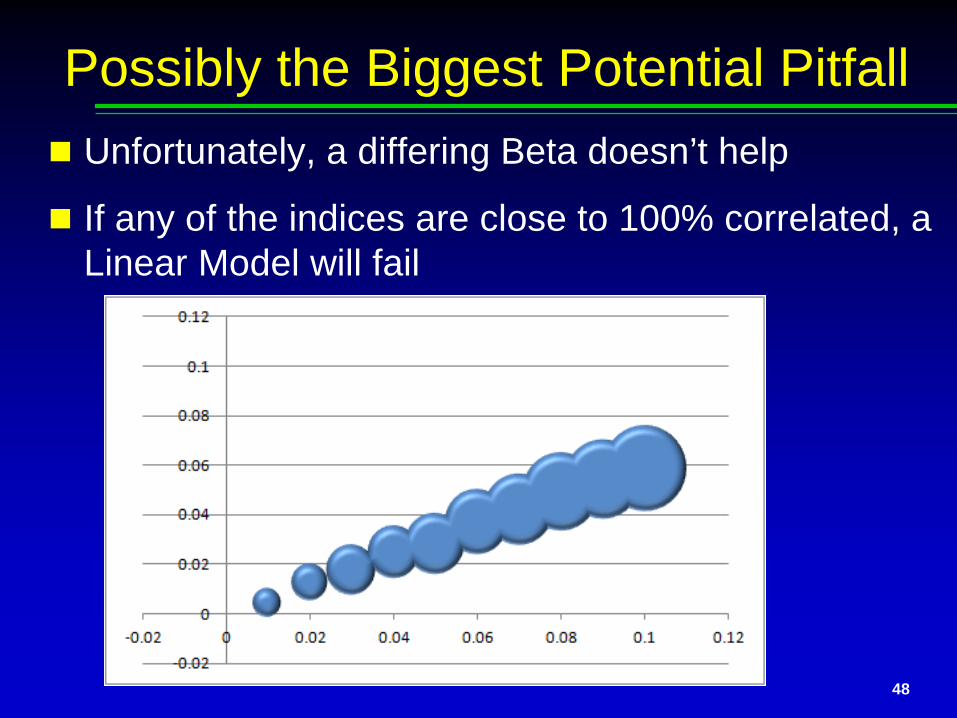
Unfortunately, a differing Beta doesn’t help
If any of the indices are close to 100% correlated, a Linear Model will fail
48
Possibly the Biggest Potential Pitfall

Why could this be quite important?
49
Possibly the Biggest Potential Pitfall
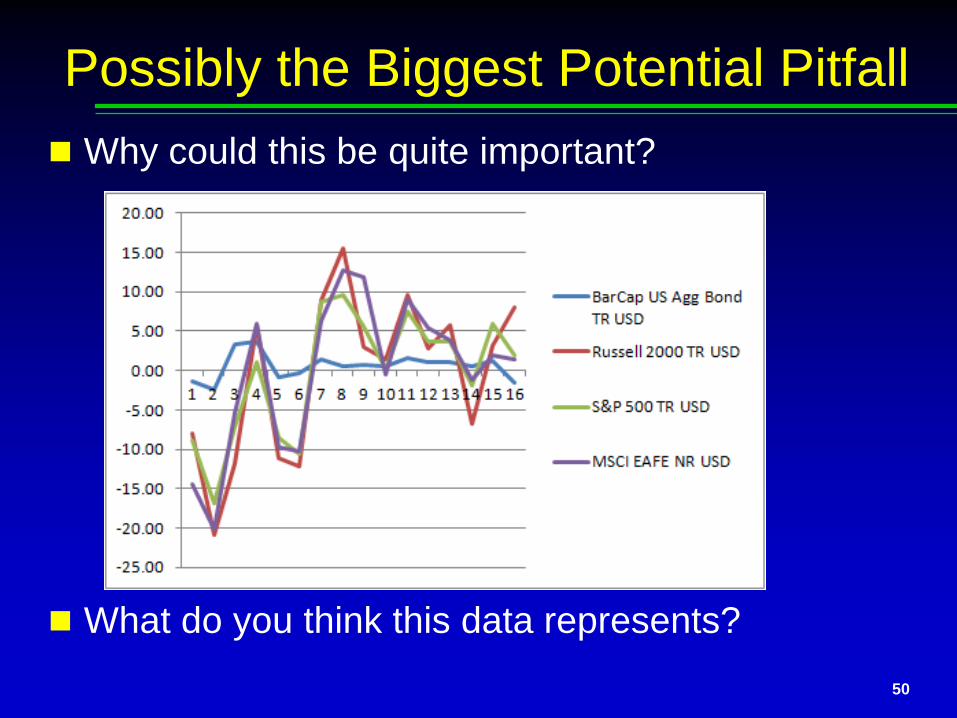
Why could this be quite important?
What do you think this data represents?50
Possibly the Biggest Potential Pitfall
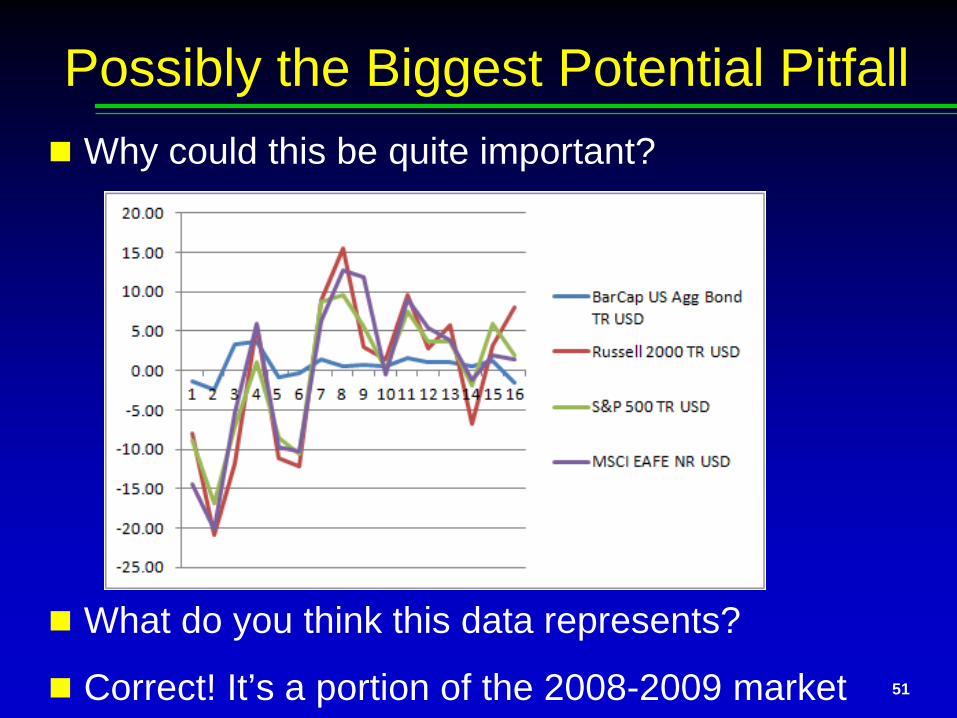
Why could this be quite important?
What do you think this data represents?
Correct! It’s a portion of the 2008-2009 market 51
Possibly the Biggest Potential Pitfall
Analysis of a balanced fund here will likely fail
52
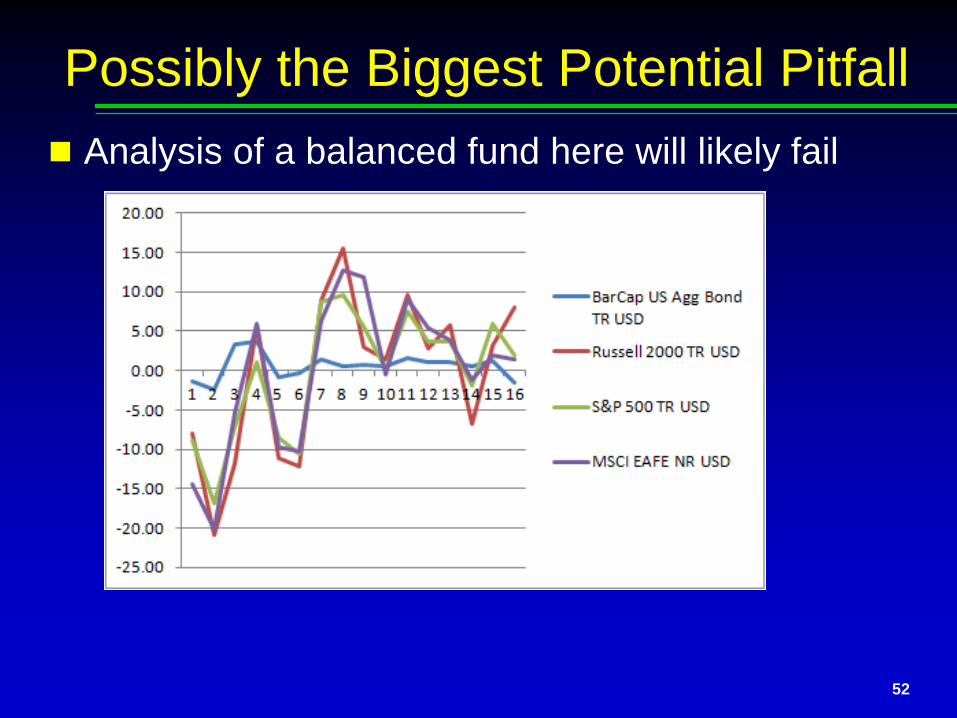
Possibly the Biggest Potential Pitfall
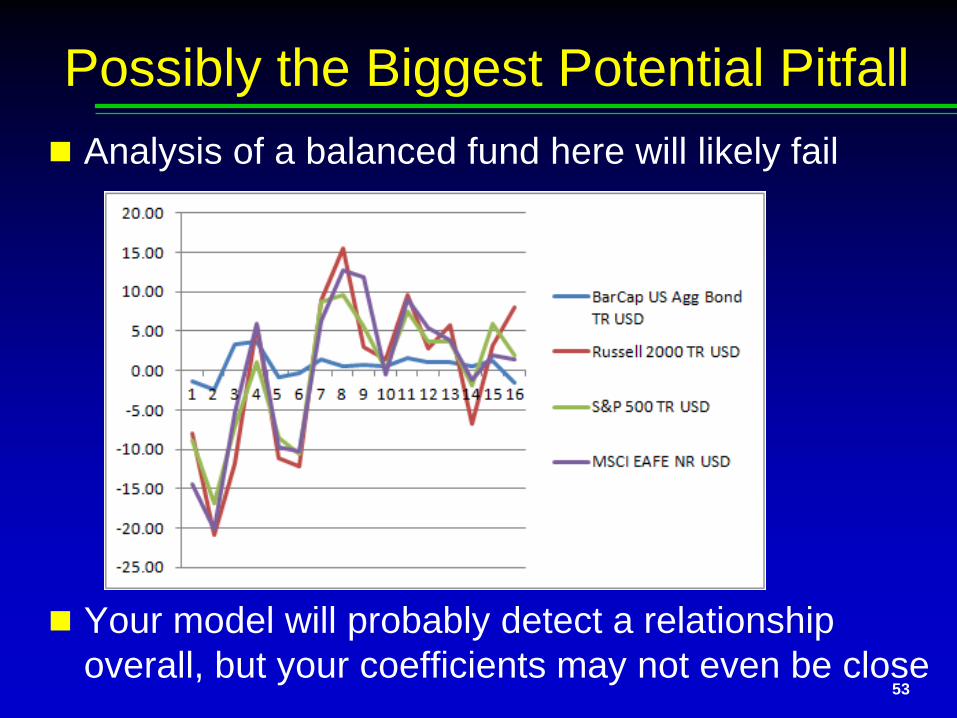
Analysis of a balanced fund here will likely fail
Your model will probably detect a relationship overall, but your coefficients may not even be close
53
Possibly the Biggest Potential Pitfall
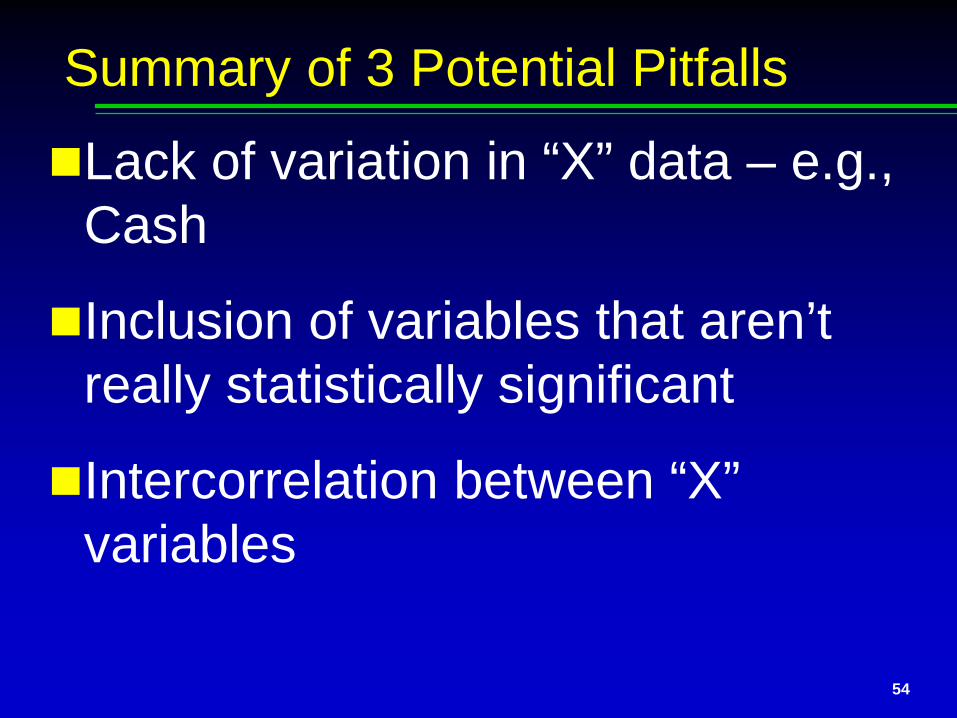
Lack of variation in “X” data – e.g., Cash
Inclusion of variables that aren’t really statistically significant
Intercorrelation between “X” variables
54
Summary of 3 Potential Pitfalls
55
Topics
Other Statistical Thoughts
In my experience, actuaries tend to do stochastically only at the economy
What if assumptions are not independent? Some risk factors, like economy and lapse, may
be “prima facie dependent”
Others might seem independent, but not be
56
Something to Consider . . . .
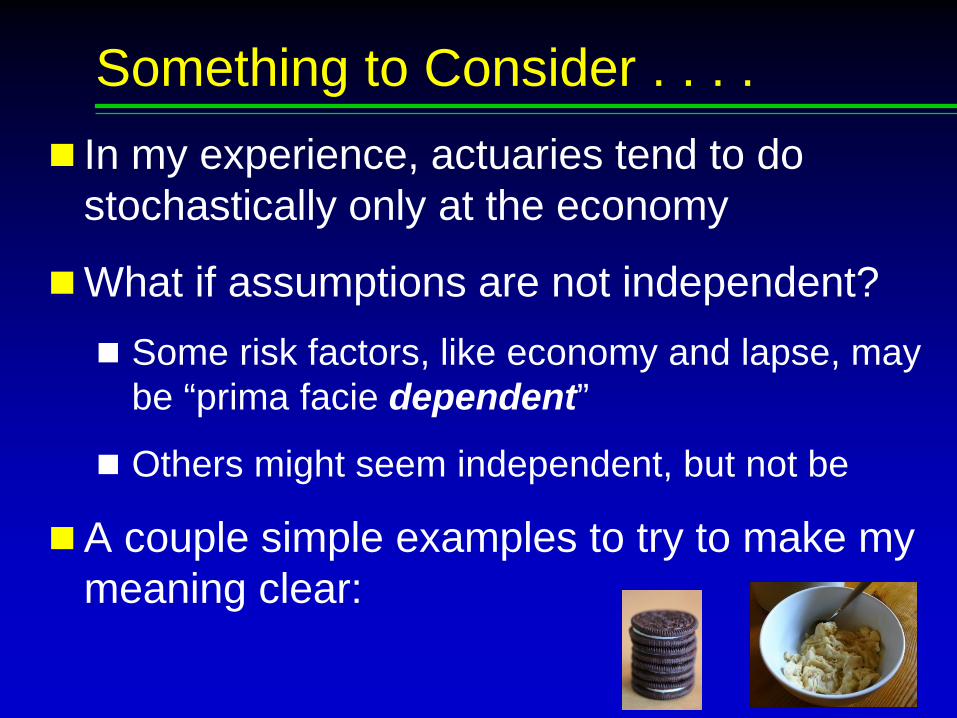
In my experience, actuaries tend to do stochastically only at the economy
What if assumptions are not independent? Some risk factors, like economy and lapse, may
be “prima facie dependent”
Others might seem independent, but not be
A couple simple examples to try to make my meaning clear:
57
Something to Consider . . . .
Consider a proposed relationship between outside temperature, and how much ice cream you want (Sm, Md, Lg) I would claim this is “prima facie dependent”
The hotter it is, the more ice cream you want!
Now, what if you are considering your desire for ice cream, alongside your desire for Oreo cookies? Independent?
Let’s assume so; but what if . . . . 58
The Ice Cream / Oreo Paradox
. . . . you know your spouse will kill you if you go large on both, in a single day?
How effectively will you analyze the “Risk Margin” related to a given “snack,” if you hold the other “snack” at “expected”?
59
What If . . . .
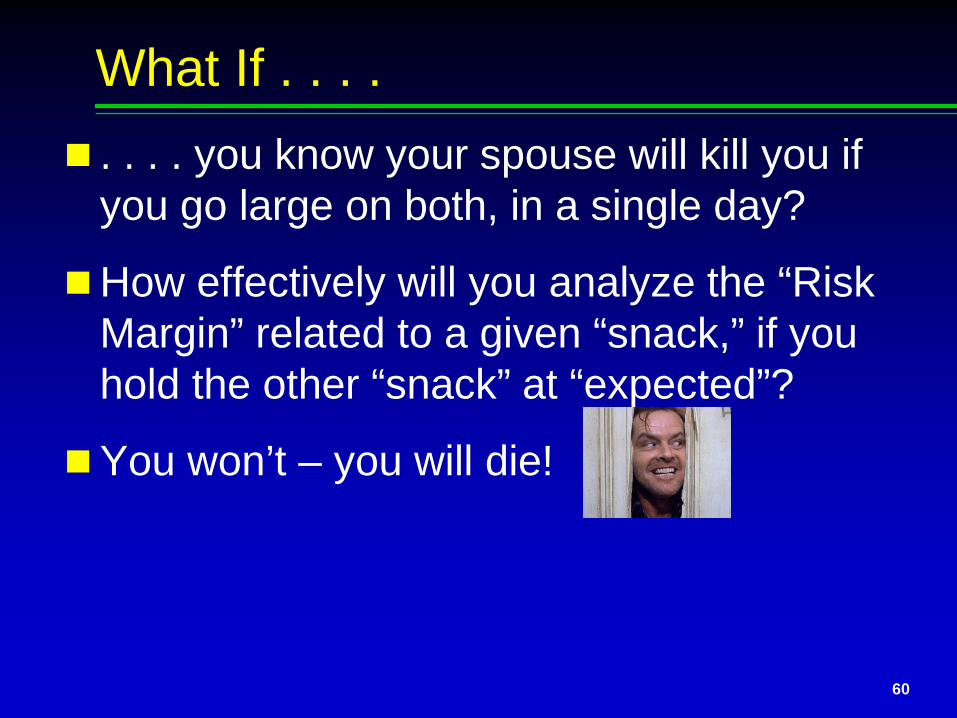
. . . . you know your spouse will kill you if you go large on both, in a single day?
How effectively will you analyze the “Risk Margin” related to a given “snack,” if you hold the other “snack” at “expected”?
You won’t – you will die!
60
What If . . . .
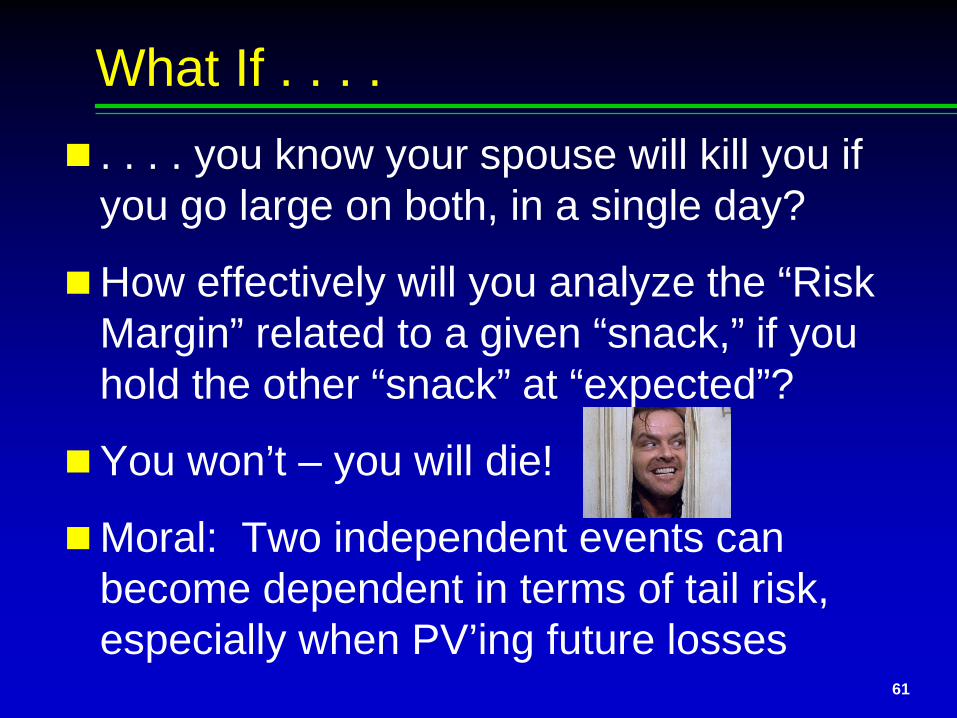
. . . . you know your spouse will kill you if you go large on both, in a single day?
How effectively will you analyze the “Risk Margin” related to a given “snack,” if you hold the other “snack” at “expected”?
You won’t – you will die!
Moral: Two independent events can become dependent in terms of tail risk, especially when PV’ing future losses
61
What If . . . .
62
Thoughts on Loss Distribution, and: How large a block is “large enough”?
Concept: “Velocity of Diversification,” Case StudyHow many of you are on the Life Side?Have your PD guys developed ROP
Term? If so, have you thanked them?
There is one stochastic / statistical sense in which ROP Term is far superior to ordinary Term
63
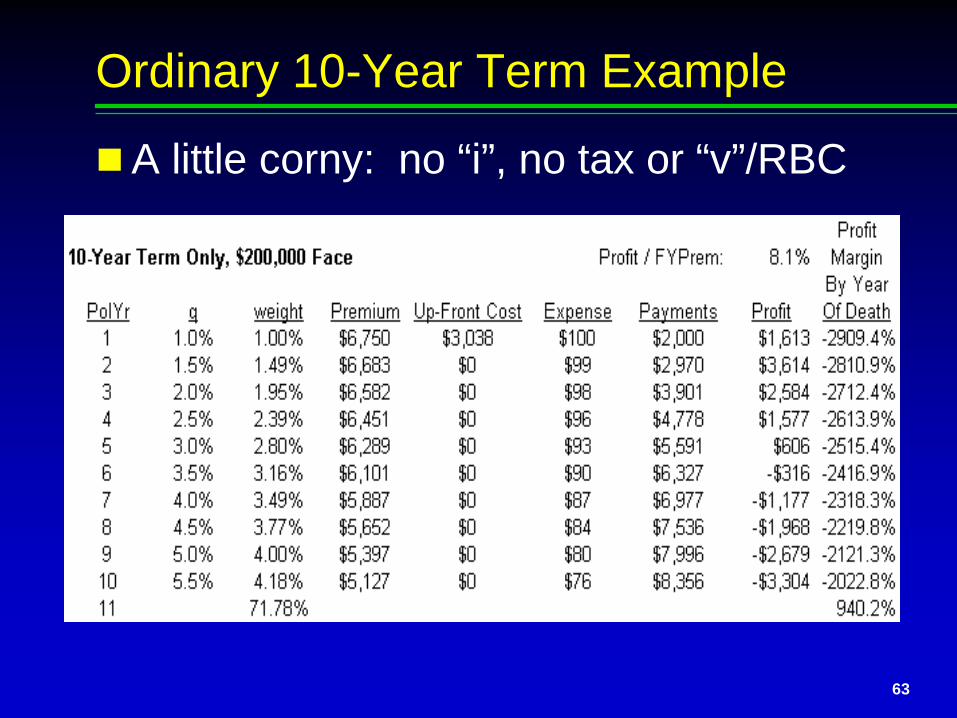
Ordinary 10-Year Term Example
A little corny: no “i”, no tax or “v”/RBC
64
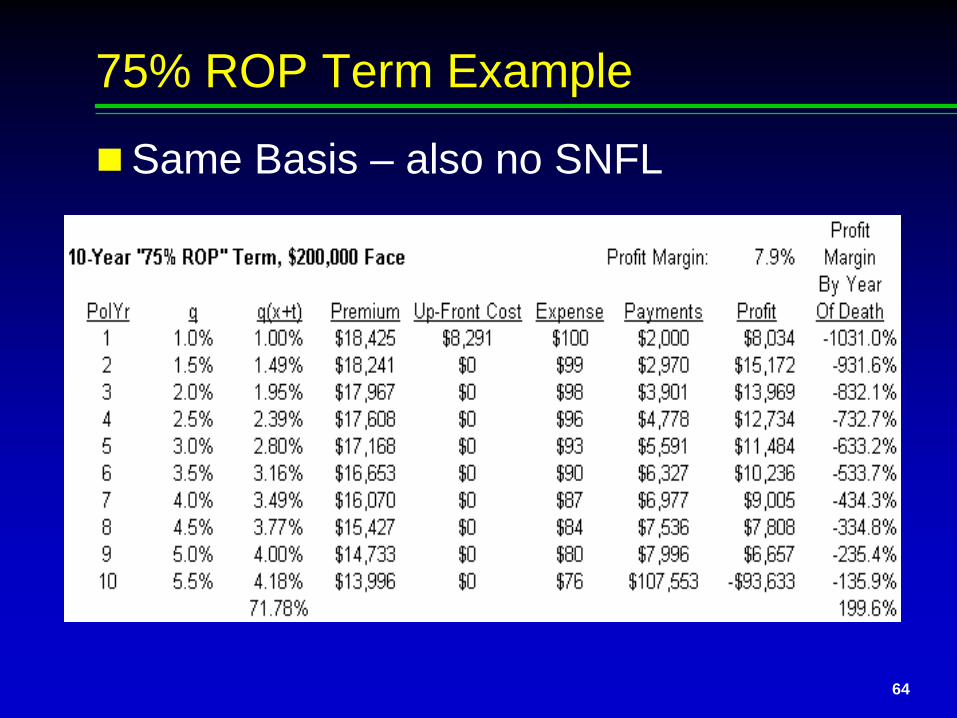
75% ROP Term Example
Same Basis – also no SNFL
65
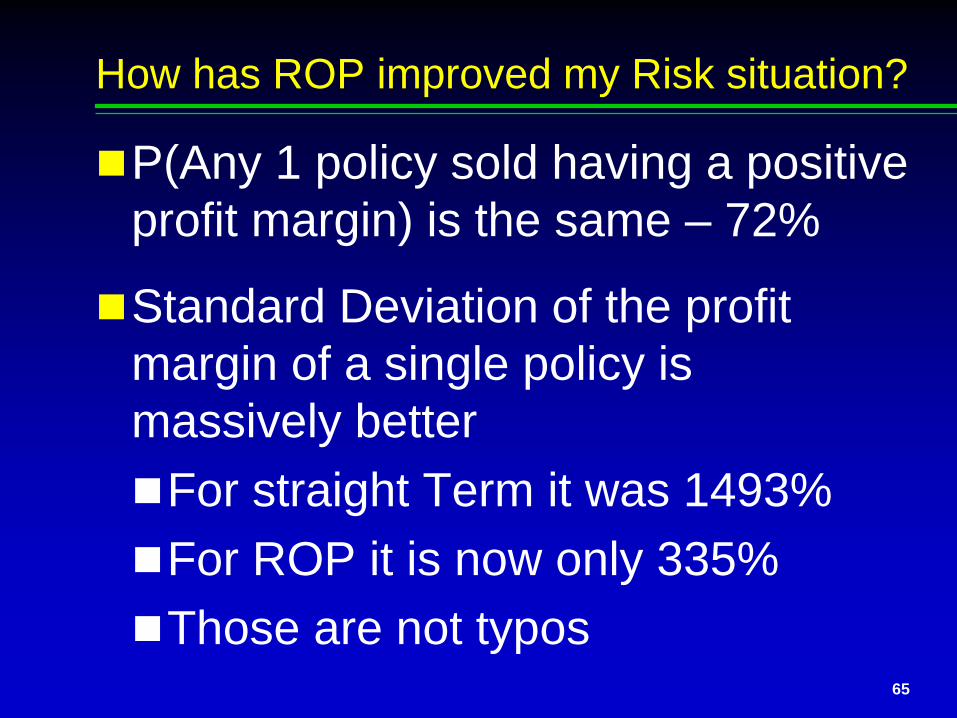
How has ROP improved my Risk situation?
P(Any 1 policy sold having a positive profit margin) is the same – 72%
Standard Deviation of the profit margin of a single policy is massively betterFor straight Term it was 1493%For ROP it is now only 335%Those are not typos
66
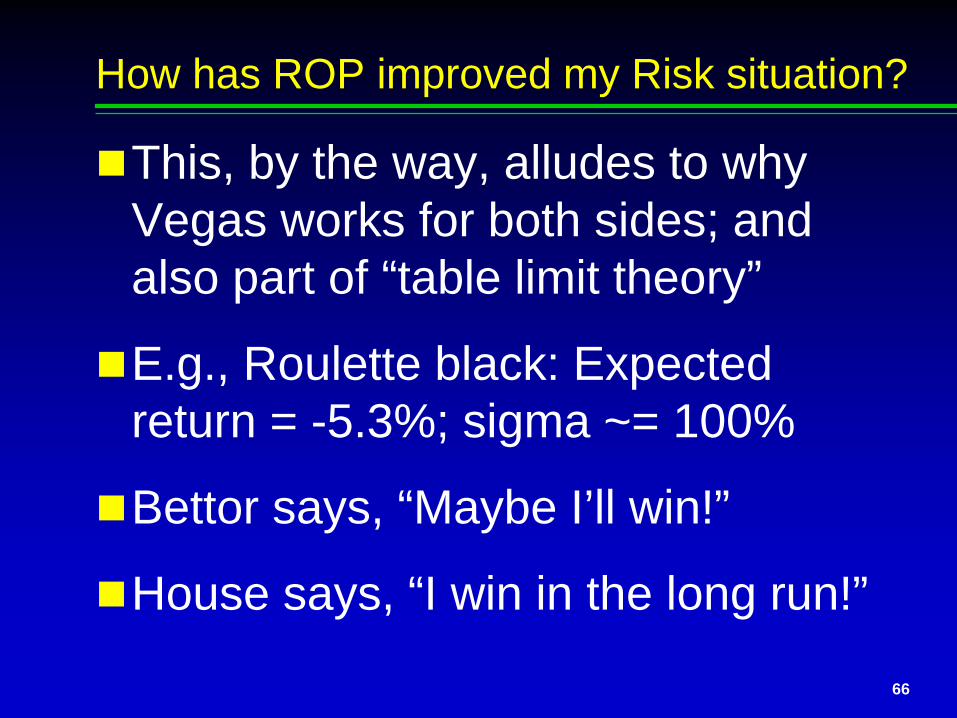
How has ROP improved my Risk situation?
This, by the way, alludes to why Vegas works for both sides; and also part of “table limit theory”
E.g., Roulette black: Expected return = -5.3%; sigma ~= 100%
Bettor says, “Maybe I’ll win!”
House says, “I win in the long run!”
67
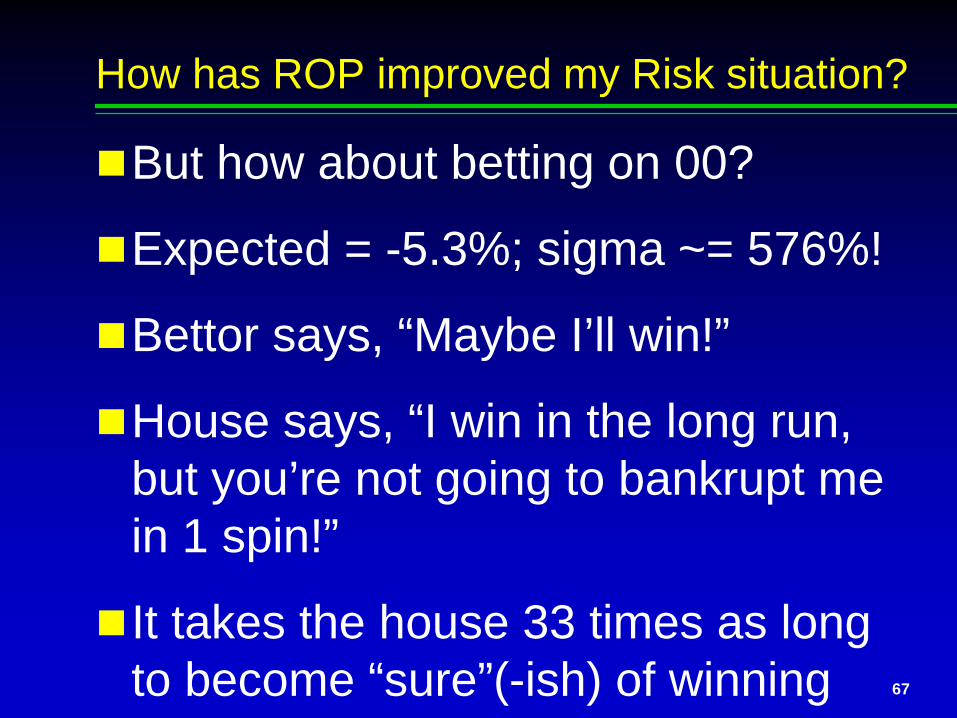
How has ROP improved my Risk situation?
But how about betting on 00?
Expected = -5.3%; sigma ~= 576%!
Bettor says, “Maybe I’ll win!”
House says, “I win in the long run, but you’re not going to bankrupt me in 1 spin!”
It takes the house 33 times as long to become “sure”(-ish) of winning
68
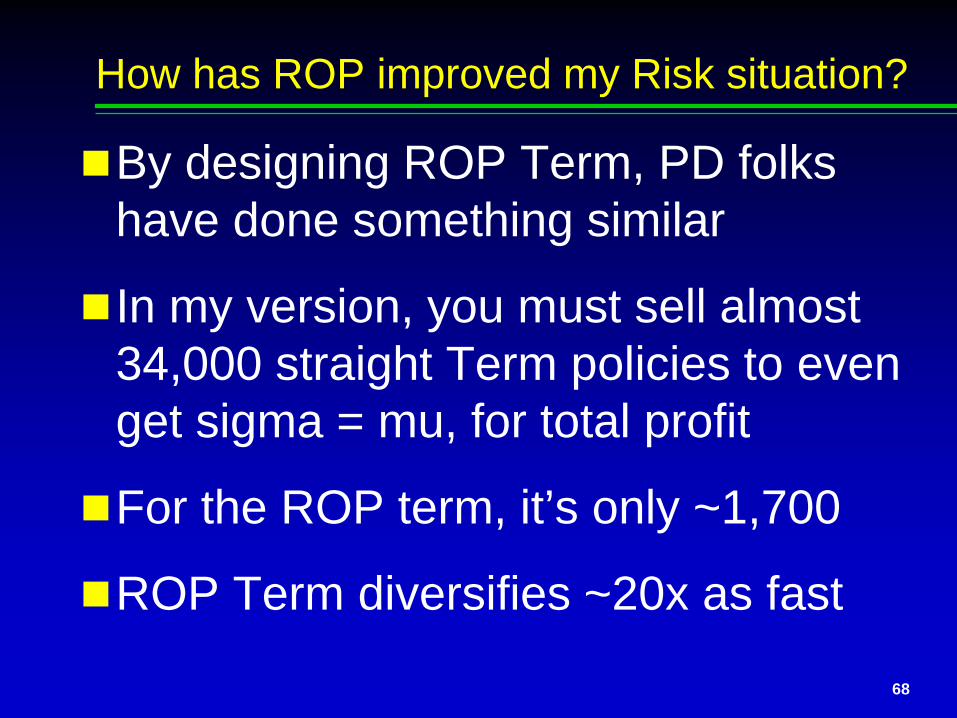
How has ROP improved my Risk situation?
By designing ROP Term, PD folks have done something similar
In my version, you must sell almost 34,000 straight Term policies to even get sigma = mu, for total profit
For the ROP term, it’s only ~1,700
ROP Term diversifies ~20x as fast
69
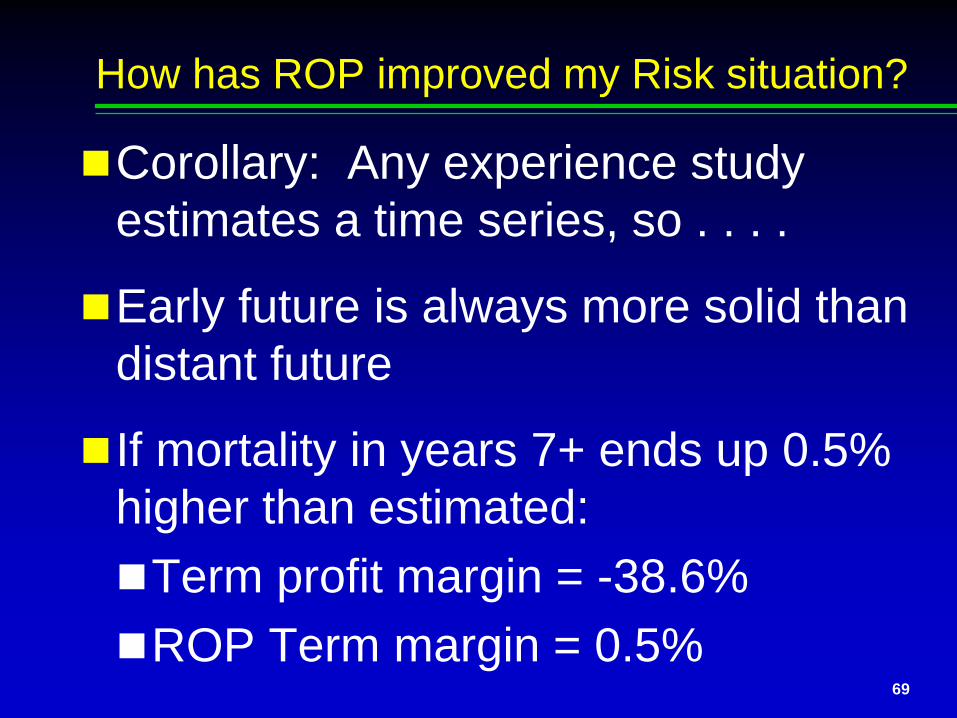
How has ROP improved my Risk situation?
Corollary: Any experience study estimates a time series, so . . . .
Early future is always more solid than distant future
If mortality in years 7+ ends up 0.5% higher than estimated:Term profit margin = -38.6%ROP Term margin = 0.5%
70
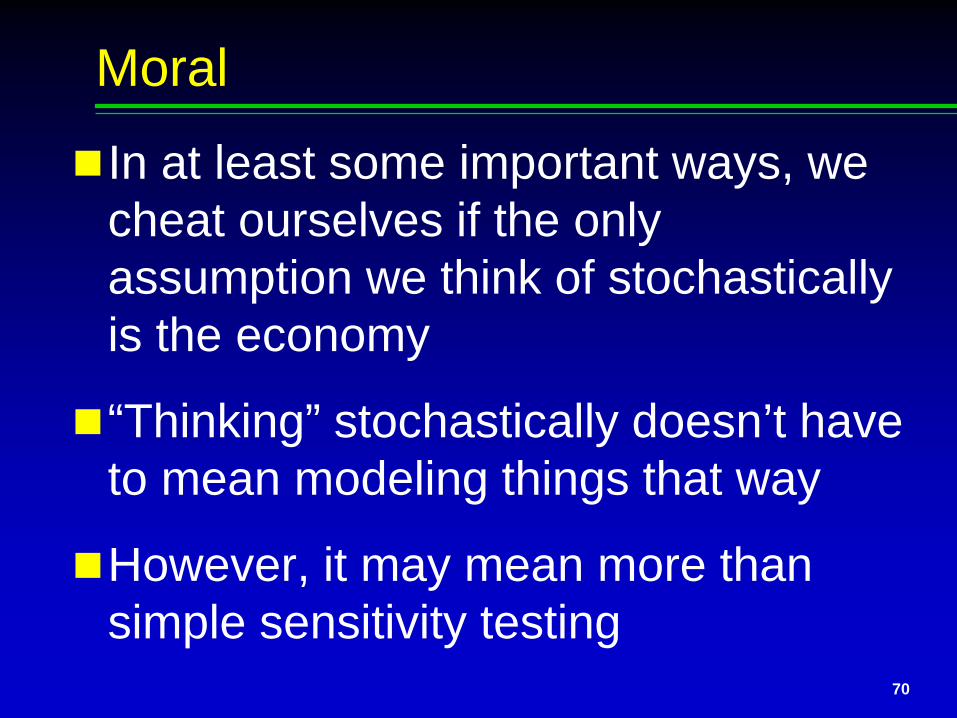
Moral
In at least some important ways, we cheat ourselves if the only assumption we think of stochastically is the economy
“Thinking” stochastically doesn’t have to mean modeling things that way
However, it may mean more than simple sensitivity testing
![[Kay a. Robbins, Steve Robbins] UNIX Systems Progr Pratica](https://static.fdocuments.us/doc/165x107/552dbfcc4a795956618b4757/kay-a-robbins-steve-robbins-unix-systems-progr-pratica.jpg)