31 December 2016 Strictly Embargoed until 00.01 hrs ... · ... 31 December 2016 Strictly Embargoed...
13
Covering the five weeks 27 November – 31 December 2016 Strictly Embargoed until 00.01 hrs – Tuesday 10 January 2017 % change year on year Online sales of Non-Food products in the UK grew 7.2% in December versus a year earlier, when they had increased by 15.1%. This is the first growth below 10% in four months. December’s growth was below the 3-month average of 9.5% and the 12-month average of 10.0%. % change year on year Over the 3 months to December, Online sales of Non-Food products in the UK grew 9.5% year-on-year. Over the same period, Total Non-Food sales in the UK grew 1.3%. Online sales as % of Non-Food In December 2016, Online sales represented 24.3% of total Non- Food sales in the UK, against 22.6% in December 2015. This is the brings the 12-month average penetration rate up to 21.7 per cent. Over the 3 months to December, Online sales contributed 2.9 percentage points to the year- on-year growth of Total Non- Food sales, while In-Store sales made a negative contribution of 1.6 percentage points (rounded). In December, Online sales contributed 2.7 percentage points. % change year-on-year Over the 3 months to December, In-Store sales fell, posting declines of 1.2% on a total basis and 1.4% on a like- for-like basis. For the month of December, In-Store sales showed a decline.
Transcript of 31 December 2016 Strictly Embargoed until 00.01 hrs ... · ... 31 December 2016 Strictly Embargoed...

Covering the five weeks 27 November – 31 December 2016
Strictly Embargoed until 00.01 hrs – Tuesday 10 January 2017
% change year on year
Online sales of Non-Food products in the UK grew 7.2% in December versus a year earlier, when they had increased by 15.1%. This is the first growth below 10% in four months. December’s growth was below the 3-month average of 9.5% and the 12-month average of 10.0%.
% change year on year
Over the 3 months to December, Online sales of Non-Food products in the UK grew 9.5% year-on-year. Over the same period, Total Non-Food sales in the UK grew 1.3%.
Online sales as % of Non-Food
In December 2016, Online sales represented 24.3% of total Non-Food sales in the UK, against 22.6% in December 2015. This is the brings the 12-month average penetration rate up to 21.7 per cent.
Over the 3 months to December, Online sales contributed 2.9 percentage points to the year-on-year growth of Total Non-Food sales, while In-Store sales made a negative contribution of 1.6 percentage points (rounded). In December, Online sales contributed 2.7 percentage points.
% change year-on-year
Over the 3 months to December, In-Store sales fell, posting declines of 1.2% on a total basis and 1.4% on a like-for-like basis. For the month of December, In-Store sales showed a decline.

2
Covering the five weeks 27 November – 31 December 2016
Helen Dickinson OBE, Chief Executive | British Retail Consortium
“After three months of double digit growth for online sales, December saw the third slowest growth rate of 2016 at 7.2 per cent. At first glance this may appear a disappointing figure; but with December taking the second highest volume of online sales in the year, after November, this makes it an extremely tough comparable period. So overall, this is a relatively solid performance. “As with total sales, there was a shift in spending towards the end of the month compared with last year and a slow start to the festive trading period was offset by a spending spree during the Christmas week. Online growth was also driven by Christmas gift purchases, keeping the beauty and toy categories at the top of the growth rankings for a second month. “Shopping online is becoming increasingly popular during the festive month. The channel won its greatest share of December sales to date, with nearly a quarter of all purchases being made online. No doubt this was partly due to customers being able to receive deliveries right up to the two days before Christmas, thanks to retailers extending their delivery guarantees this year. The penetration rate for online sales now remains above 20 per cent for the fifteenth consecutive month.”
Paul Martin, UK Head of Retail | KPMG
“Online retail sales remained strong in December, with non-food growth up 7.2% compared to last year. Penetration rates also remained high at 24.3%, suggesting that more shoppers felt comfortable logging in than hitting the shops this Christmas. “Mirroring high street sales, toys, health and beauty products as well as men’s and children’s footwear proved popular this Christmas. Meanwhile, furniture struggled in light of purchases being prioritised elsewhere and women’s footwear slipped and failed to make it to e-checkouts. “Most online categories noted sales growth in December, which will of course be welcome news. However, whilst the shopping channel continues to grow in popularity, retailers will need to battle with the logistics of fulfilment and the flurry of goods returned post-Christmas. Retailers will be hoping this doesn’t result in too much of a hangover.”

3
Covering the five weeks 27 November – 31 December 2016
Source: BRC-KPMG RSM
Note: Online sales in the Monitor include all distance sales, notably mail and phone orders
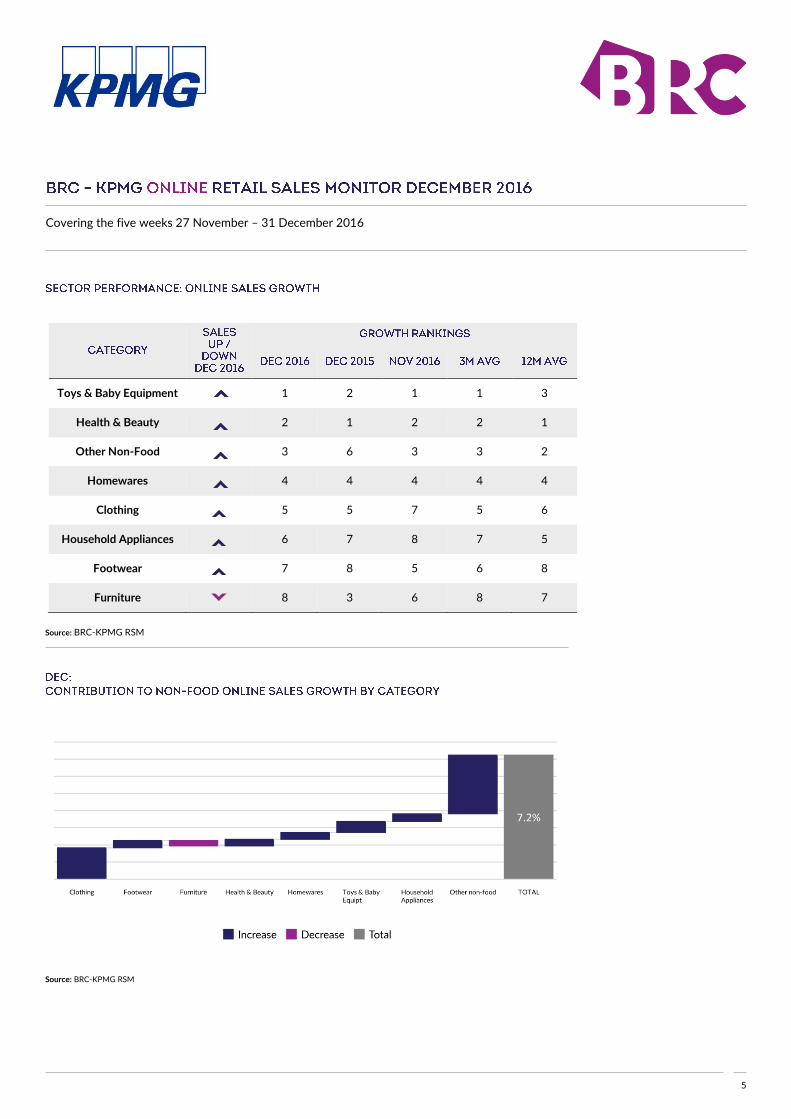
Online sales in December grew 7.2 per cent year-on-year, the slowest online growth rate since August and the third slowest of 2016. After three months of double digit growth online this may appear disappointing at first glance. However, after November, December is the best month in the year for online sales representing a large base to grow upon. This was compounded by a strong comparable period with online growth in December 2015 at 15.1%. The top four in the online growth rankings remained unchanged from November, the Toys & Baby Equipment category leading the pack, likely the result of continued promotional activity among retailers and Christmas demand. Other Non-Food also benefited from Christmas purchases, and contributed almost half of the total growth figure, while Furniture was the only category in December to see year on year decline. Clothing performed well, while Footwear slid down the growth rankings, though it is important to note that sales figures may have been affected by returns of items sold on Black Friday at the end of November. In December, online sales contributed 2.7 percentage points to total non-food sales growth, again compensating for a negative contribution from in-store sales. As for overall total sales, the week before Christmas saw huge growth across the categories. While online saw growth in the month’s opening weeks, this paled in comparison to this pre-Christmas week, when the majority of categories recorded double digit growth. Since Christmas Day fell on a Sunday this year, leaving a full shopping week in the run-up, it seems many waited almost until the last minute to buy gifts. Penetration dropped from last month’s record high, but at 24.3% shows that online sales still accounted for close to a quarter of all sales in December, and was almost two points higher than in December 2015. Since December is the biggest month of the year for in-store shopping, it is unsurprising that the rate has dropped from November’s peak, which was helped by canny promotions and the online sales furore surrounding Black Friday and Cyber Monday. Anoush Darabi, Junior Analyst, Retail Insight and Analytics, BRC
43.7%
28.7%
30.6%
26.1%
22.5%
22.6%
22.4%
17.1%
7.3%
46.8%
33.0%
32.4%
26.8%
25.3%
24.3%
23.3%
17.8%
8.0%
0% 10% 20% 30% 40% 50%
Household Appliances
Toys & Baby Eqpt
Footwear
Furniture
Other Non-Food
TOTAL
Clothing
Homewares
Health and Beauty
2016
2015
Dec 2016 7.2% n/d
Dec 2015 15.1% n/d
Nov 2016 10.9% n/d
3m avg 9.5% 1.3%
12m avg 10.0% 1.3%
n/d: cannot be disclosed

4
Covering the five weeks 27 November – 31 December 2016
Source: BRC-KPMG RSM: Online
Source: BRC-KPMG RSM
0%2%4%6%
8%10%
12%
14%16%
18%20%
De
c-1
4
Jan
-15
Fe
b-1
5
Mar
-15
Ap
r-1
5
May
-15
Jun
-15
Jul-
15
Au
g-1
5
Se
p-1
5
Oct
-15
No
v-1
5
De
c-1
5
Jan
-16
Fe
b-1
6
Mar
-16
Ap
r-1
6
May
-16
Jun
-16
Jul-
16
Au
g-1
6
Se
p-1
6
Oct
-16
No
v-1
6
De
c-1
6
ye
ar-o
n-y
ear
% c
han
ge
Online 12m average
-3.0%
-2.0%
-1.0%
0.0%
1.0%
2.0%
3.0%
4.0%
Online
Stores
All Channels
5
Covering the five weeks 27 November – 31 December 2016
Toys & Baby Equipment 1 2 1 1 3
Health & Beauty 2 1 2 2 1
Other Non-Food 3 6 3 3 2
Homewares 4 4 4 4 4
Clothing 5 5 7 5 6
Household Appliances 6 7 8 7 5
Footwear 7 8 5 6 8
Furniture 8 3 6 8 7
Source: BRC-KPMG RSM
Source: BRC-KPMG RSM

6
Covering the five weeks 27 November – 31 December 2016
Dec 2015 15.1 12.3 19.7 21.9 3.0 2.4
Jan 2016 14.9 14.0 21.5 22.0 2.4 2.7
Feb 10.7 13.7 20.4 20.5 2.1 2.5
Mar 9.5 11.5 20.5 20.8 2.1 2.2
Apr 6.6 8.9 20.9 20.6 2.0 2.1
May 13.7 9.9 21.2 20.9 2.6 2.2
Jun 9.0 9.7 20.6 20.9 2.1 2.3
Jul 11.2 11.1 20.4 20.7 2.1 2.3
Aug 6.2 8.8 20.2 20.4 2.0 2.1
Sep 10.2 9.3 21.1 20.6 2.4 2.2
Oct 11.1 9.3 22.2 21.2 2.3 2.2
Nov 10.9 10.7 27.6 23.4 3.7 2.8
Dec 7.2 9.5 24.3 24.7 2.7 2.9
Source: BRC-KPMG RSM
Source: BRC-KPMG RSM
J F M A M J J A S O N D
2015 20.1 18.9 19.0 19.2 18.9 19.8 19.4 19.1 19.8 21.1 25.3 22.6
2016 21.5 20.4 20.5 20.9 21.2 20.6 20.4 20.2 21.1 22.2 27.6 24.3
-
5.0
10.0
15.0
20.0
25.0
30.0
2015
2016

7
Covering the five weeks 27 November – 31 December 2016
Source: BRC-KPMG RSM
Source: BRC-KPMG RSM
0.0%
2.0%
4.0%
6.0%
8.0%
10.0%
12.0%
14.0%
16.0%
18.0%
20.0%
J F M A M J J A S O N D
yo
y %
gro
wth
2015 2016
-5.0%
0.0%
5.0%
10.0%
15.0%
20.0%
De
c-1
4
Jan
-15
Fe
b-1
5
Mar
-15
Ap
r-1
5
May
-15
Jun
-15
Jul-
15
Au
g-1
5
Se
p-1
5
Oct
-15
No
v-1
5
De
c-1
5
Jan
-16
Fe
b-1
6
Mar
-16
Ap
r-1
6
May
-16
Jun
-16
Jul-
16
Au
g-1
6
Se
p-1
6
Oct
-16
No
v-1
6
De
c-1
6
Online Non-Food sales Total Non-Food sales In-Store Non-Food sales
8
Covering the five weeks 27 November – 31 December 2016
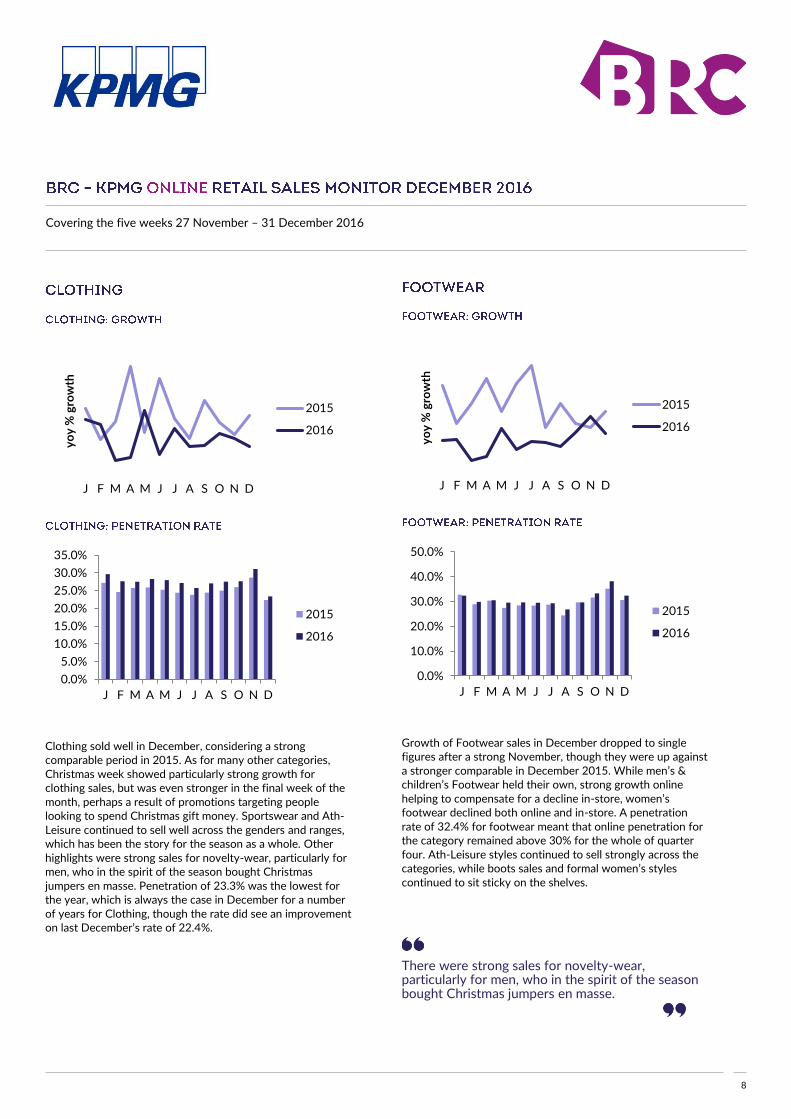
Clothing sold well in December, considering a strong comparable period in 2015. As for many other categories, Christmas week showed particularly strong growth for clothing sales, but was even stronger in the final week of the month, perhaps a result of promotions targeting people looking to spend Christmas gift money. Sportswear and Ath-Leisure continued to sell well across the genders and ranges, which has been the story for the season as a whole. Other highlights were strong sales for novelty-wear, particularly for men, who in the spirit of the season bought Christmas jumpers en masse. Penetration of 23.3% was the lowest for the year, which is always the case in December for a number of years for Clothing, though the rate did see an improvement on last December’s rate of 22.4%.
Growth of Footwear sales in December dropped to single figures after a strong November, though they were up against a stronger comparable in December 2015. While men’s & children’s Footwear held their own, strong growth online helping to compensate for a decline in-store, women’s footwear declined both online and in-store. A penetration rate of 32.4% for footwear meant that online penetration for the category remained above 30% for the whole of quarter four. Ath-Leisure styles continued to sell strongly across the categories, while boots sales and formal women’s styles continued to sit sticky on the shelves. There were strong sales for novelty-wear, particularly for men, who in the spirit of the season bought Christmas jumpers en masse.
J F M A M J J A S O N D
yo
y %
gro
wth
2015
2016
0.0%
5.0%
10.0%
15.0%
20.0%
25.0%
30.0%
35.0%
J F M A M J J A S O N D
2015
2016
J F M A M J J A S O N D
yo
y %
gro
wth
2015
2016
0.0%
10.0%
20.0%
30.0%
40.0%
50.0%
J F M A M J J A S O N D
2015
2016

9
Covering the five weeks 27 November – 31 December 2016
Health & Beauty continued to sit high in the online growth rankings in December, helped by strong sales of gift products, fragrances, and skincare. The arrival of cold weather in December and with it assorted sniffles and colds also led to strong sales of healthcare products. As for other categories, the week leading up to Christmas saw the strongest growth in Health & Beauty, and similarly to Clothing this carried over somewhat into the following week. Online promotions aimed specifically at previous customers were successful, as were those advertised through social media. Online penetration remained high at 8.0%, albeit slightly down on November’s record rate of 9.4% for Health & Beauty.
As for other categories, the week leading up to Christmas saw the strongest growth in Health & Beauty
Homewares growth remained healthy online in December, though dropped below 10% after double digit growth in October and November. Christmas and seasonal products understandably sold well, and as for other categories Homewares had its strongest week leading up directly to Christmas. The penetration rate for Homewares dropped below 20% for the first time since September, falling 3.8 percentage points to 17.8%, but was higher than the rate for last December.
J F M A M J J A S O N D
yo
y %
gro
wth
2015
2016
0.0%
2.0%
4.0%
6.0%
8.0%
10.0%
J F M A M J J A S O N D
2015
2016
J F M A M J J A S O N D
yo
y %
gro
wth
2015
2016
0.0%
5.0%
10.0%
15.0%
20.0%
25.0%
J F M A M J J A S O N D
2015
2016
10
Covering the five weeks 27 November – 31 December 2016
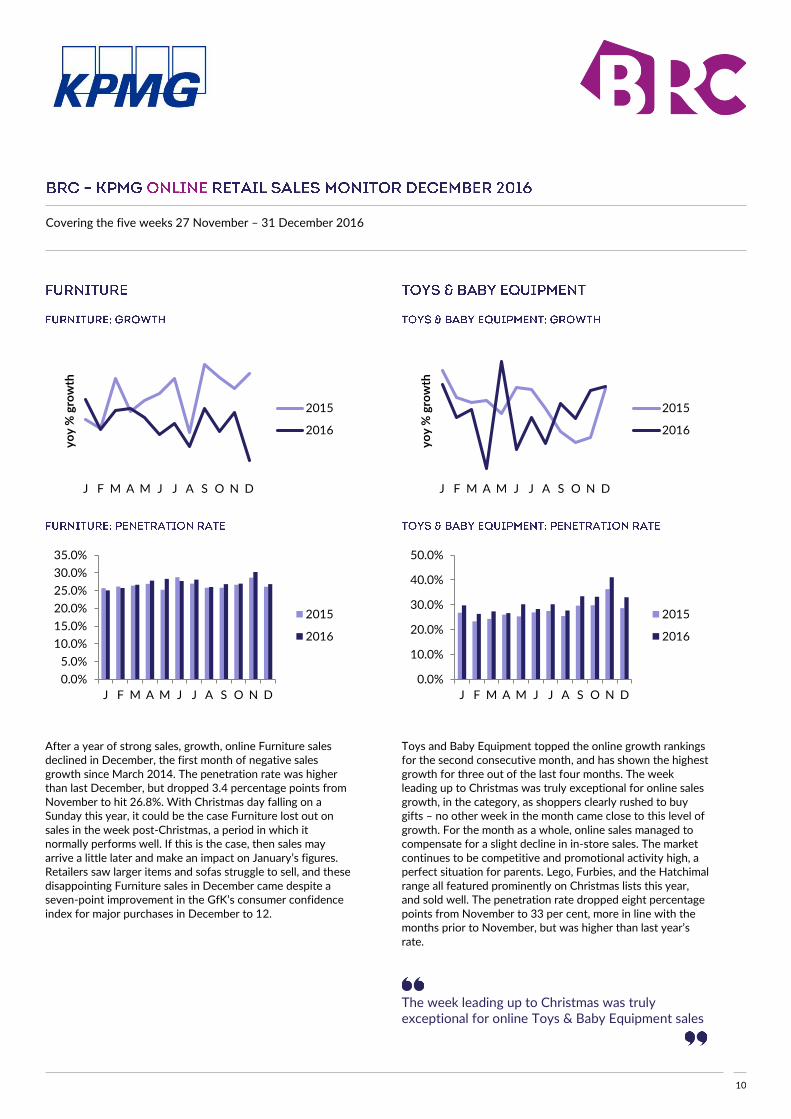
After a year of strong sales, growth, online Furniture sales declined in December, the first month of negative sales growth since March 2014. The penetration rate was higher than last December, but dropped 3.4 percentage points from November to hit 26.8%. With Christmas day falling on a Sunday this year, it could be the case Furniture lost out on sales in the week post-Christmas, a period in which it normally performs well. If this is the case, then sales may arrive a little later and make an impact on January’s figures. Retailers saw larger items and sofas struggle to sell, and these disappointing Furniture sales in December came despite a seven-point improvement in the GfK’s consumer confidence index for major purchases in December to 12.
Toys and Baby Equipment topped the online growth rankings for the second consecutive month, and has shown the highest growth for three out of the last four months. The week leading up to Christmas was truly exceptional for online sales growth, in the category, as shoppers clearly rushed to buy gifts – no other week in the month came close to this level of growth. For the month as a whole, online sales managed to compensate for a slight decline in in-store sales. The market continues to be competitive and promotional activity high, a perfect situation for parents. Lego, Furbies, and the Hatchimal range all featured prominently on Christmas lists this year, and sold well. The penetration rate dropped eight percentage points from November to 33 per cent, more in line with the months prior to November, but was higher than last year’s rate.
The week leading up to Christmas was truly exceptional for online Toys & Baby Equipment sales
J F M A M J J A S O N D
yo
y %
gro
wth
2015
2016
0.0%
5.0%
10.0%
15.0%
20.0%
25.0%
30.0%
35.0%
J F M A M J J A S O N D
2015
2016
J F M A M J J A S O N D
yo
y %
gro
wth
2015
2016
0.0%
10.0%
20.0%
30.0%
40.0%
50.0%
J F M A M J J A S O N D
2015
2016

11
Covering the five weeks 27 November – 31 December 2016
Sales growth of Household Appliances online in December were not sufficient to compensate for decline in store. In contrast to the same period last year, the category did not post dramatically lower growth than in November, but improved. The penetration rate fell 2.8% percentage points from last month’s high, but at 46.8% is still the third highest rate for 2016. White goods, particularly refrigerators, sold well, shoppers perhaps anticipating the post-Christmas day leftovers, but online the growth rate for small appliances was even faster. The new Dyson Supersonic Hairdryer attracted much attention.
Other Non-Food continued its strong online performance from November, and with a penetration rate of 25.3% ensured that online maintained more than a quarter of all growth during December. Despite a significant decline in-store, Other Non-Food again saw double digit growth online, and, as for many other categories, recorded its strongest week of growth by far in the week directly preceding Christmas. This is likely a result of retailers extending their guaranteed delivery period, therefore allowing shoppers to shop online almost to the last moment. Shoppers were drawn towards mobile phones and the latest products in wearable technology, while audio equipment was also popular, and gaming benefitted as usual from Christmas purchases. The final week of December also saw strong growth in the category, if not quite to the level of the week before Christmas Day, as shoppers headed online to look for bargains.
Despite a significant decline in-store, Other Non-Food again saw double digit growth online
J F M A M J J A S O N D
yo
y %
gro
wth
2015
2016
0.0%
10.0%
20.0%
30.0%
40.0%
50.0%
60.0%
J F M A M J J A S O N D
2015
2016
J F M A M J J A S O N D
yo
y %
gro
wth
2015
2016
0.0%
5.0%
10.0%
15.0%
20.0%
25.0%
30.0%
J F M A M J J A S O N D
2015
2016

12
Covering the five weeks 27 November – 31 December 2016
The Online BRC-KPMG Retail Sales Monitor measures changes in the actual value (including VAT) of online retail sales, excluding automotive fuel. The Monitor measures the value of spending and hence does not adjust for price or VAT changes. If prices are rising, sales volumes will increase by less than sales values. In times of price deflation, sales volumes will increase by more than sales values. Retailers report the value of their online sales for the current period and the equivalent period a year ago. Total Non-Food sales growth is the percentage change in the value of all retail sales with the exception of food sales compared to the same period a year earlier. The total Non-Food sales measure is used to assess market level trends in Non-Food retail sales. Non-Food retail spending represents approximately 55% of total retail sales. Online (including mail order and phone) sales of Non-Food are transactions which take place over the internet, or via mail order or phone. Online sales growth is the percentage change in the value of online sales compared to those in the same period a year earlier. It is a guide to the growth of sales made by all non-store channels. Penetration is the proportion of sales attributed to the online channel (including mail order and phone). Penetrations are calculated category by category as online sales submitted by participating retailers relative to total sales those retailers submit to the BRC-KPMG Retail Sales Monitor. Participants who do not sell online (or through non-store channels) are included but participants who do sell online but do not submit their online sales are excluded. The responses provided by retailers within each sales category are weighted* to reflect the contribution of each category to total retail sales, thus making it representative of UK retail sales as a whole. The rates used are derived from the Office of National Statistics Family Spending Survey and revised every year. Because the figures compare sales the latest figures with the comparable period last year, a seasonal adjustment is not made. However, changes in the timing of Bank Holidays and Easter can create distortions, which should be considered in the interpretation of the data. In its role as sponsor of the BRC-KPMG Retail Sales Monitor, KPMG is responsible for the aggregation of the retail sales data provided by the retailers on a weekly basis. This data consists of the relevant current week’s sales data and comparative sales figures for the same period in the prior year. The aggregation has been performed by KPMG on data for periods following 2 April 2000 and equivalent prior periods. The accuracy of the data is entirely the responsibility of the retailers providing it. The sponsorship role has been performed by KPMG since 10 April 2000 and the same for the aggregation of comparative sales figures for the period from 2 April 2000 it is not responsible for the aggregation of any data included in this Monitor relating to any period prior to 2 April 2000. The commentary from the BRC is intended to be of general interest to readers but is not advice or a recommendation and should not be relied upon without first taking professional advice. Anyone choosing to rely on it does so at his or her own risk. To the fullest extent permitted by law, KPMG will accept no responsibility or liability in connection with its sponsorship of the Monitor and its aggregation work to any party other than the BRC.
© Copyright British Retail Consortium and KPMG (2016). The contents of this report and those of all ancillary documents and preparatory materials are the sole property of BRC and KPMG and are not to be copied, modified, published, distributed or commercially exploited other than with the express permission of BRC or for the purposes of journalistic comment and review. All rights reserved.

13
Covering the five weeks 27 November – 31 December 2016
The January 2017 Monitor, covering the four weeks 1 – 28 January, will be released at 00.01am Tuesday 7 February 2017. The data is collected and collated for the BRC by KPMG.
The British Retail Consortium (BRC) is the UK’s leading retail trade association. It represents the full range of retailers, large and small, multiples and independents, food and non-food, online and store based. S KPMG LLP, a UK limited liability partnership, operates from 22 offices across the UK with approximately 12,000 partners and staff. The UK firm recorded a revenue of £1.96 billion in the year ended September 2015. KPMG is a global network of professional firms providing Audit, Tax, and Advisory services. It operates in 155 countries and has 174,000 professionals working in member firms around the world. The independent member firms of the KPMG network are affiliated with KPMG International Cooperative ("KPMG International"), a Swiss entity. Each KPMG firm is a legally distinct and separate entity and describes itself as such. Detailed weekly data by category is available to retailers who contribute to the monitor: If you would like to participate in the Retail Sales Monitor, please contact: Anne Alexandre 0207 854 8960 [email protected]
British Retail Consortium 2 London.Bridge London SE1 9RA
T 020 7854 8900 W www.brc.org.uk
Zoe Maddison T 0207 854 8924 E [email protected]
KPMG 15 Canada Square London, E14 5GL
T 020 7311 1000 W www.kpmg.co.uk
Simon Wilson T 0207 311 6651 M 0778 537 3397 E [email protected]
![Strictly embargoed until: 07.00 on [11th ] November 2015](https://static.fdocuments.us/doc/165x107/61d0c2e97d42c14e3d373803/strictly-embargoed-until-0700-on-11th-november-2015.jpg)