3.1 Chapter 3 Data and Signals Copyright © The McGraw-Hill Companies, Inc. Permission required for...
51
3.1 Chapter 3 Data and Signals Copyright © The McGraw-Hill Companies, Inc. Permission required for reproduction or display.
-
Upload
braydon-cubitt -
Category
Documents
-
view
214 -
download
1
Transcript of 3.1 Chapter 3 Data and Signals Copyright © The McGraw-Hill Companies, Inc. Permission required for...

3.1
Chapter 3
Data and Signals
Copyright © The McGraw-Hill Companies, Inc. Permission required for reproduction or display.

3.2
To be transmitted, data must be transformed to electromagnetic signals.
Note
3.3
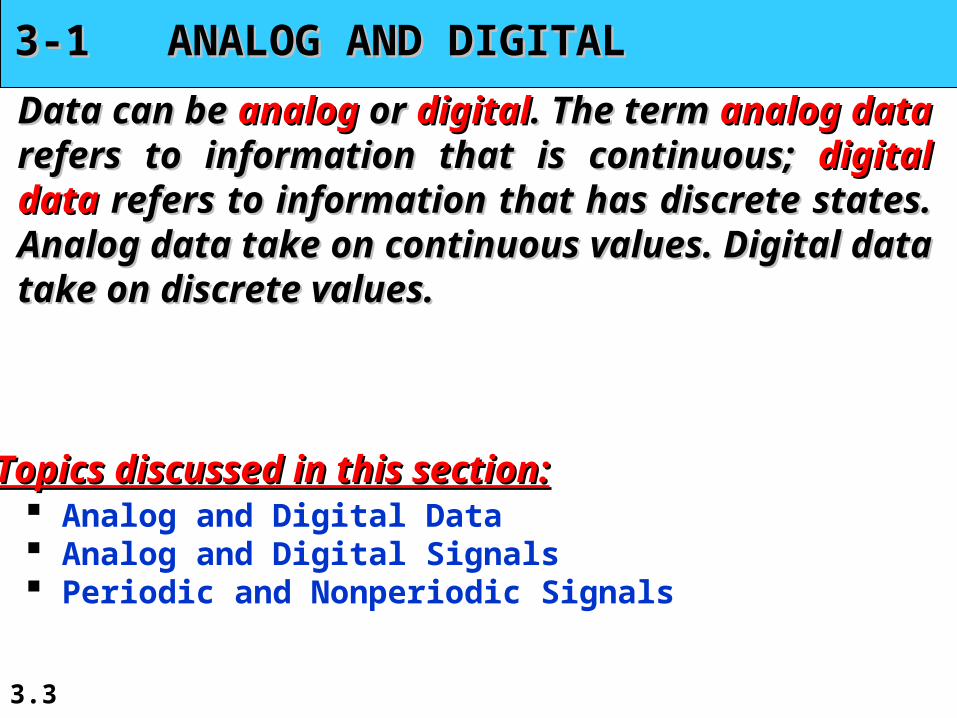
3-1 ANALOG AND DIGITAL3-1 ANALOG AND DIGITAL
Data can be Data can be analoganalog or or digitaldigital. The term . The term analog dataanalog data refers refers to information that is continuous; to information that is continuous; digital datadigital data refers to refers to information that has discrete states. Analog data take on information that has discrete states. Analog data take on continuous values. Digital data take on discrete values.continuous values. Digital data take on discrete values.
Analog and Digital Data Analog and Digital Signals Periodic and Nonperiodic Signals
Topics discussed in this section:Topics discussed in this section:

3.4
Analog and Digital Data
Data can be analog or digital. Analog data are continuous and take
continuous values. Digital data have discrete states and take
discrete values.

3.5
Analog and Digital Signals
• Signals can be analog or digital.• Analog signals can have an infinite number
of values in a range.• Digital signals can have only a limited
number of values.

3.6
Figure 3.1 Comparison of analog and digital signals

3.7
3-2 PERIODIC ANALOG SIGNALS3-2 PERIODIC ANALOG SIGNALS
In data communications, we commonly use periodic analog signals and nonperiodic digital signals.Periodic analog signals can be classified as Periodic analog signals can be classified as simplesimple or or compositecomposite. A simple periodic analog signal, a . A simple periodic analog signal, a sine wavesine wave, , cannot be decomposed into simpler signals. A compositecannot be decomposed into simpler signals. A compositeperiodic analog signal is composed of multiple sine periodic analog signal is composed of multiple sine waves.waves.
Sine Wave Wavelength Time and Frequency Domain Composite Signals Bandwidth
Topics discussed in this section:Topics discussed in this section:

3.8
Figure 3.2 A sine wave

3.9
Figure 3.3 Two signals with the same phase and frequency, but different amplitudes

3.10
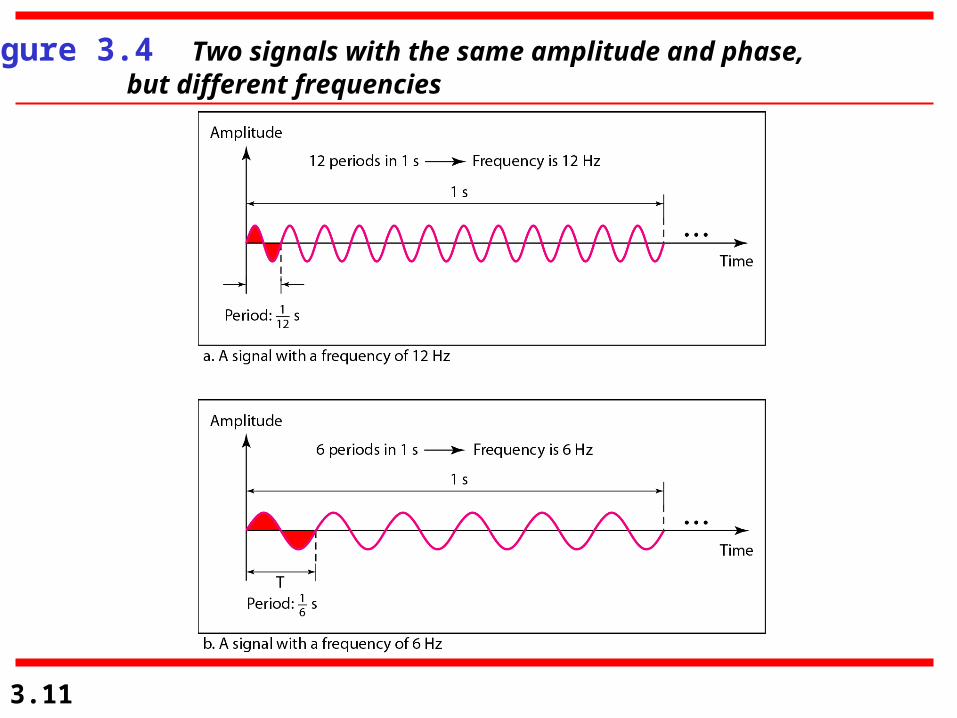
Frequency and period are the inverse of each other.
Note
3.11
Figure 3.4 Two signals with the same amplitude and phase, but different frequencies

3.12
Table 3.1 Units of period and frequency
3.13
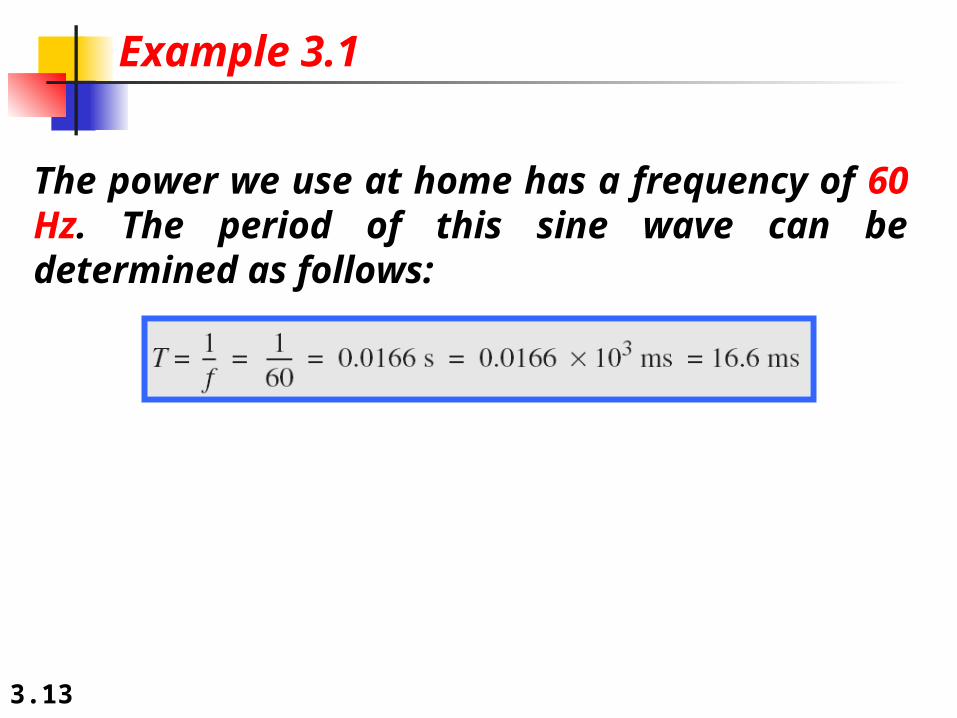
The power we use at home has a frequency of 60 Hz. The period of this sine wave can be determined as follows:
Example 3.1

3.14
The period of a signal is 100 ms. What is its frequency in kilohertz?
Example 3.2
SolutionFirst we change 100 ms to seconds, and then we calculate the frequency from the period (1 Hz = 10−3 kHz).

3.15
Frequency
• Frequency is the rate of change with respect to time.
• Change in a short span of time means high frequency.
• Change over a long span of time means low frequency.

3.16
If a signal does not change at all, its frequency is zero.
If a signal changes instantaneously, its frequency is infinite.
Note

3.17
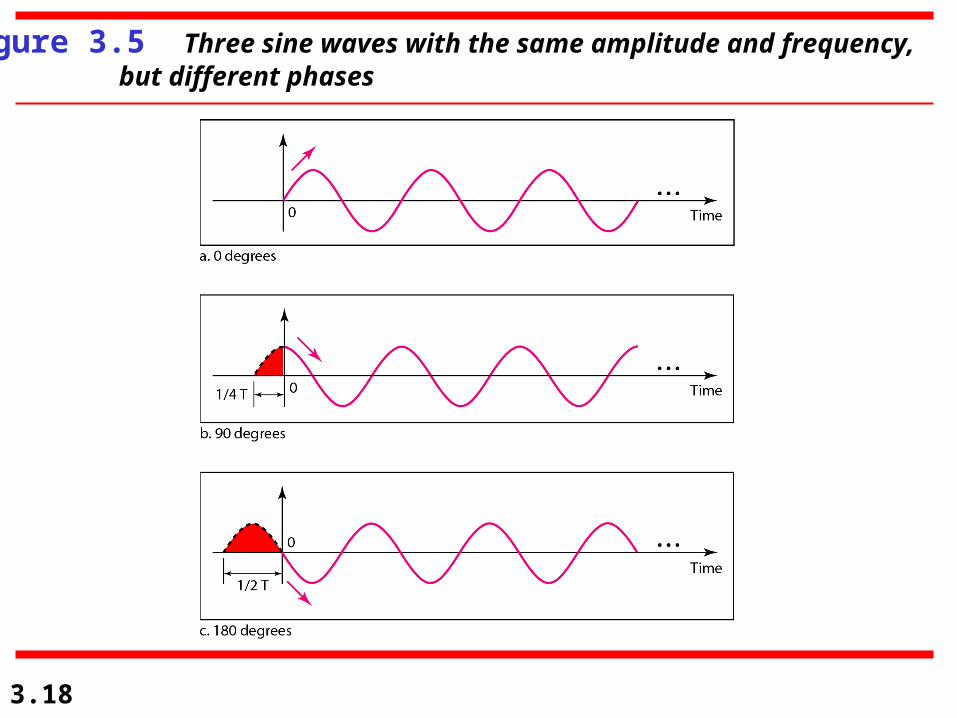
Phase describes the position of the waveform relative to time 0.
Note
3.18
Figure 3.5 Three sine waves with the same amplitude and frequency, but different phases

3.19
A sine wave is offset 1/6 cycle with respect to time 0. What is its phase in degrees and radians?
Example 3.3
SolutionWe know that 1 complete cycle is 360°. Therefore, 1/6 cycle is

3.20
Figure 3.6 Wavelength and period

3.21
Figure 3.7 The time-domain and frequency-domain plots of a sine wave
3.22
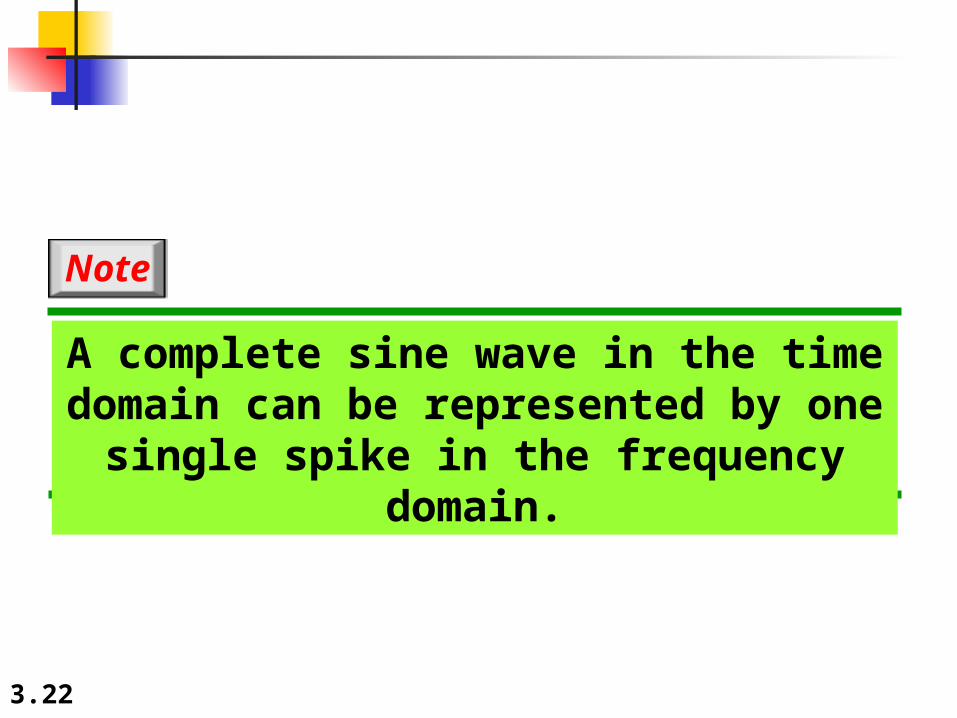
A complete sine wave in the time domain can be represented by one
single spike in the frequency domain.
Note
3.23
The frequency domain is more compact and useful when we are dealing with more than one sine wave. For example, Figure 3.8 shows three sine waves, each with different amplitude and frequency. All can be represented by three spikes in the frequency domain.
Example 3.7

3.24
Figure 3.8 The time domain and frequency domain of three sine waves

3.25
Signals and Communication A single-frequency sine wave is not
useful in data communications We need to send a composite signal, a
signal made of many simple sine waves. According to Fourier analysis, any
composite signal is a combination of simple sine waves with different frequencies, amplitudes, and phases.

3.26
Composite Signals and Periodicity
If the composite signal is periodic, the decomposition gives a series of signals with discrete frequencies.
If the composite signal is nonperiodic, the decomposition gives a combination of sine waves with continuous frequencies.

3.27
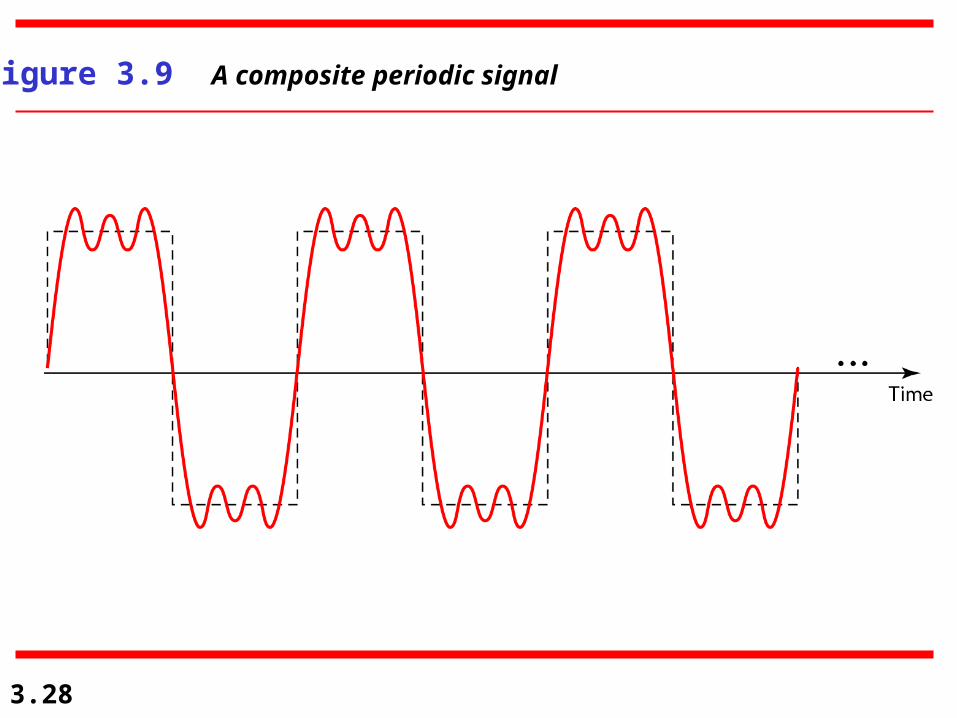
Figure 3.9 shows a periodic composite signal with frequency f. This type of signal is not typical of those found in data communications. We can consider it to be three alarm systems, each with a different frequency. The analysis of this signal can give us a good understanding of how to decompose signals.
Example 3.4
3.28
Figure 3.9 A composite periodic signal
3.29
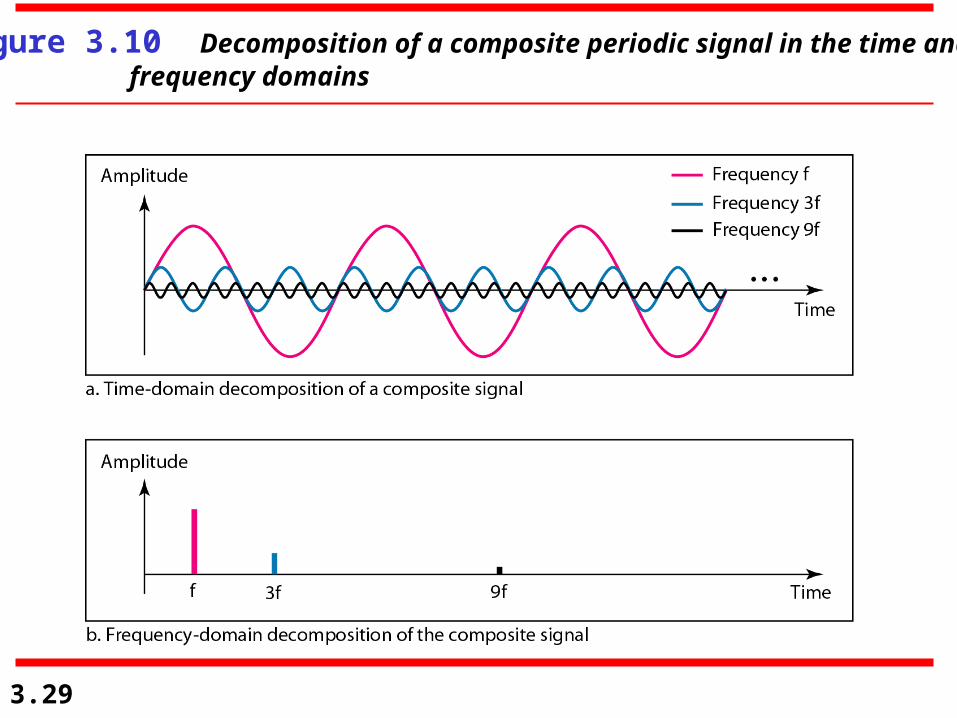
Figure 3.10 Decomposition of a composite periodic signal in the time and frequency domains
3.30
Figure 3.11 shows a nonperiodic composite signal. It can be the signal created by a microphone or a telephone set when a word or two is pronounced. In this case, the composite signal cannot be periodic, because that implies that we are repeating the same word or words with exactly the same tone.
Example 3.5

3.31
Figure 3.11 The time and frequency domains of a nonperiodic signal

3.32
Bandwidth and Signal Frequency
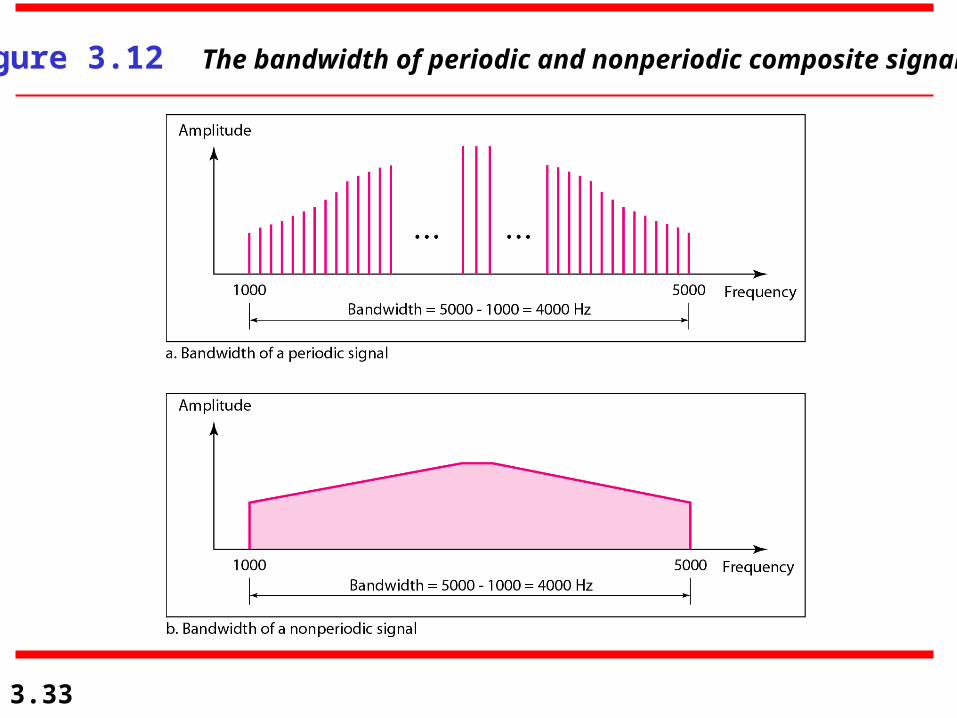
The bandwidth of a composite signal is the difference between the highest and the lowest frequencies contained in that signal.
3.33
Figure 3.12 The bandwidth of periodic and nonperiodic composite signals

3.34
If a periodic signal is decomposed into five sine waves with frequencies of 100, 300, 500, 700, and 900 Hz, what is its bandwidth? Draw the spectrum, assuming all components have a maximum amplitude of 10 V.SolutionLet fh be the highest frequency, fl the lowest frequency, and B the bandwidth. Then
Example 3.6
The spectrum has only five spikes, at 100, 300, 500, 700, and 900 Hz (see Figure 3.13).

3.35
Figure 3.13 The bandwidth for Example 3.6
3.36
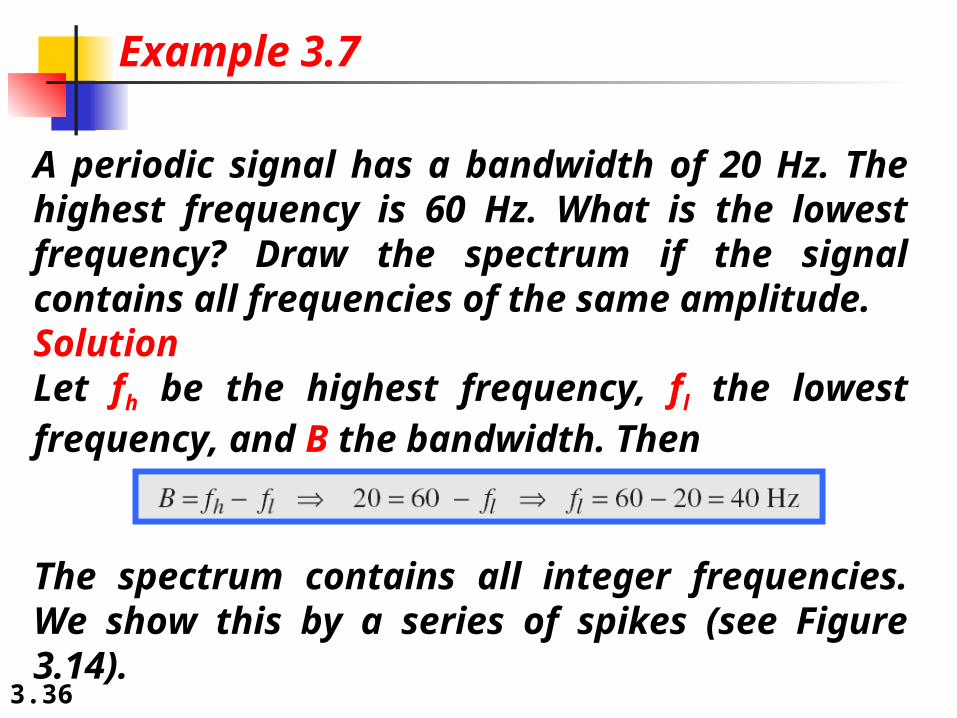
A periodic signal has a bandwidth of 20 Hz. The highest frequency is 60 Hz. What is the lowest frequency? Draw the spectrum if the signal contains all frequencies of the same amplitude.SolutionLet fh be the highest frequency, fl the lowest frequency, and B the bandwidth. Then
Example 3.7
The spectrum contains all integer frequencies. We show this by a series of spikes (see Figure 3.14).

3.37
Figure 3.14 The bandwidth for Example 3.7

3.38
A nonperiodic composite signal has a bandwidth of 200 kHz, with a middle frequency of 140 kHz and peak amplitude of 20 V. The two extreme frequencies have an amplitude of 0. Draw the frequency domain of the signal.
SolutionThe lowest frequency must be at 40 kHz and the highest at 240 kHz. Figure 3.15 shows the frequency domain and the bandwidth.
Example 3.8

3.39
Figure 3.15 The bandwidth for Example 3.8

3.40
An example of a nonperiodic composite signal is the signal propagated by an AM radio station. In the United States, each AM radio station is assigned a 10-kHz bandwidth. The total bandwidth dedicated to AM radio ranges from 530 to 1700 kHz. We will show the rationale behind this 10-kHz bandwidth in Chapter 5.
Example 3.9
3.41
Another example of a nonperiodic composite signal is the signal propagated by an FM radio station. In the United States, each FM radio station is assigned a 200-kHz bandwidth. The total bandwidth dedicated to FM radio ranges from 88 to 108 MHz. We will show the rationale behind this 200-kHz bandwidth in Chapter 5.
Example 3.10

3.42
Another example of a nonperiodic composite signal is the signal received by an old-fashioned analog black-and-white TV. A TV screen is made up of pixels. If we assume a resolution of 525 × 700, we have 367,500 pixels per screen. If we scan the screen 30 times per second, this is 367,500 × 30 = 11,025,000 pixels per second. The worst-case scenario is alternating black and white pixels. We can send 2 pixels per cycle. Therefore, we need 11,025,000 / 2 = 5,512,500 cycles per second, or Hz. The bandwidth needed is 5.5125 MHz.
Example 3.11

3.43
Fourier analysis is a tool that changes a time domain signal to a frequency
domain signal and vice versa.
Note
Fourier Analysis

3.44
Fourier Series
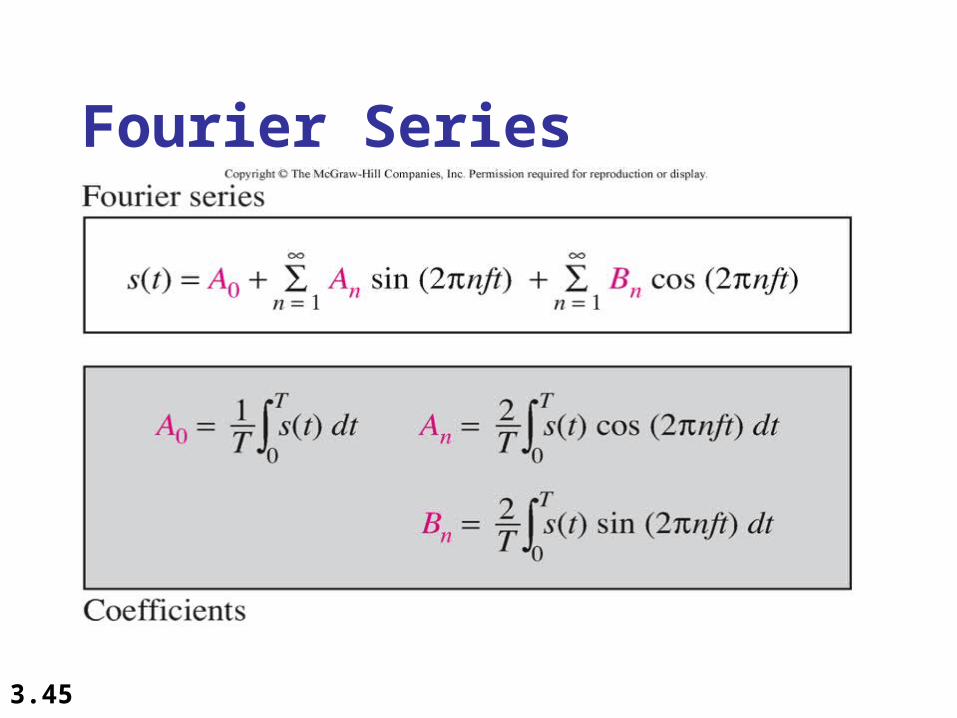
Every composite periodic signal can be represented with a series of sine and cosine functions.
The functions are integral harmonics of the fundamental frequency “f” of the composite signal.
Using the series we can decompose any periodic signal into its harmonics.
3.45
Fourier Series
3.46
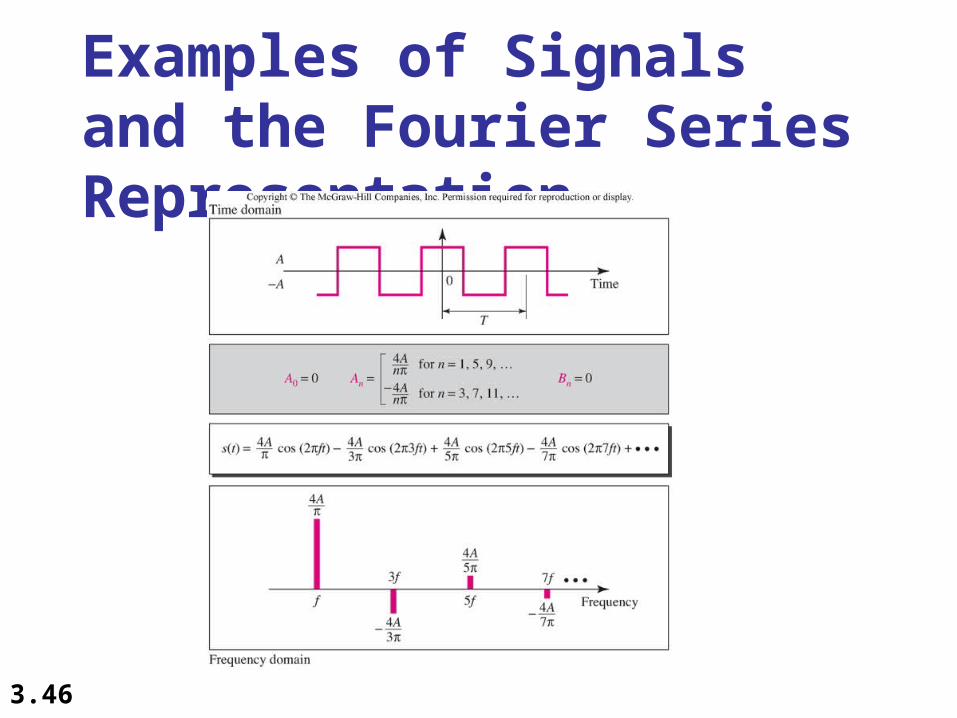
Examples of Signals and the Fourier Series Representation

3.47
Sawtooth Signal
3.48
Fourier Transform
Fourier Transform gives the frequency domain of a nonperiodic time domain signal.

3.49
Example of a Fourier Transform

3.50
Inverse Fourier Transform
3.51
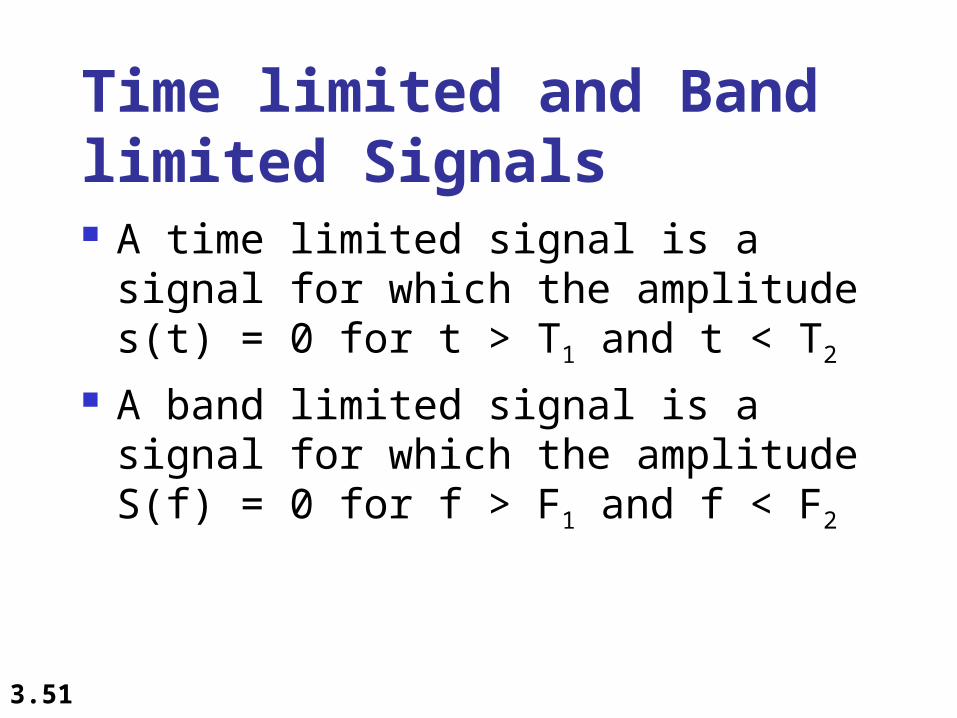
Time limited and Band limited Signals A time limited signal is a signal for which
the amplitude s(t) = 0 for t > T1 and t < T2
A band limited signal is a signal for which the amplitude S(f) = 0 for f > F1 and f < F2