30.Passageofparticlesthroughmatter 1 - Particle Data...
42
30. Passage of particles through matter 1 30. PASSAGE OF PARTICLES THROUGH MATTER ..................... 2 30.1. Notation ................... 2 30.2. Electronic energy loss by heavy parti- cles ...................... 3 30.2.1. Moments and cross sections ........ 3 30.2.2. Stopping power at intermediate energies ................... 4 30.2.3. Energy loss at low energies ......... 9 30.2.4. Density effect ............... 10 30.2.5. Energetic knock-on electrons (δ rays) ..................... 11 30.2.6. Restricted energy loss rates for relativistic ionizing particles .......... 12 30.2.7. Fluctuations in energy loss ......... 12 30.2.8. Energy loss in mixtures and com- pounds .................... 15 30.2.9. Ionization yields .............. 16 30.3. Multiple scattering through small angles ..................... 16 30.4. Photon and electron interactions in matter ..................... 18 30.4.1. Radiation length ............. 18 30.4.2. Energy loss by electrons .......... 19 30.4.3. Critical energy .............. 22 30.4.4. Energy loss by photons .......... 22 30.4.5. Bremsstrahlung and pair produc- tion at very high energies ........... 26 30.4.6. Photonuclear and electronuclear interactions at still higher energies ....... 26 30.5. Electromagnetic cascades ........... 27 30.6. Muon energy loss at high energy ........ 31 30.7. Cherenkov and transition radiation ....... 33 30.7.1. Optical Cherenkov radiation ........ 33 30.7.2. Coherent radio Cherenkov radia- tion ..................... 35 30.7.3. Transition radiation ............ 36 J. Beringer et al.(PDG), PR D86, 010001 (2012) (http://pdg.lbl.gov) June 18, 2012 16:19
-
Upload
nguyenmien -
Category
Documents
-
view
214 -
download
0
Transcript of 30.Passageofparticlesthroughmatter 1 - Particle Data...
30. Passage of particles through matter 1
30. PASSAGE OF PARTICLES THROUGHMATTER . . . . . . . . . . . . . . . . . . . . . 2
30.1. Notation . . . . . . . . . . . . . . . . . . . 2
30.2. Electronic energy loss by heavy parti-cles . . . . . . . . . . . . . . . . . . . . . . 3
30.2.1. Moments and cross sections . . . . . . . . 3
30.2.2. Stopping power at intermediateenergies . . . . . . . . . . . . . . . . . . . 4
30.2.3. Energy loss at low energies . . . . . . . . . 9
30.2.4. Density effect . . . . . . . . . . . . . . . 10
30.2.5. Energetic knock-on electrons (δrays) . . . . . . . . . . . . . . . . . . . . . 11
30.2.6. Restricted energy loss rates forrelativistic ionizing particles . . . . . . . . . . 12
30.2.7. Fluctuations in energy loss . . . . . . . . . 12
30.2.8. Energy loss in mixtures and com-pounds . . . . . . . . . . . . . . . . . . . . 15
30.2.9. Ionization yields . . . . . . . . . . . . . . 16
30.3. Multiple scattering through smallangles . . . . . . . . . . . . . . . . . . . . . 16
30.4. Photon and electron interactions inmatter . . . . . . . . . . . . . . . . . . . . . 18
30.4.1. Radiation length . . . . . . . . . . . . . 18
30.4.2. Energy loss by electrons . . . . . . . . . . 19
30.4.3. Critical energy . . . . . . . . . . . . . . 22
30.4.4. Energy loss by photons . . . . . . . . . . 22
30.4.5. Bremsstrahlung and pair produc-tion at very high energies . . . . . . . . . . . 26
30.4.6. Photonuclear and electronuclearinteractions at still higher energies . . . . . . . 26
30.5. Electromagnetic cascades . . . . . . . . . . . 27
30.6. Muon energy loss at high energy . . . . . . . . 31
30.7. Cherenkov and transition radiation . . . . . . . 33
30.7.1. Optical Cherenkov radiation . . . . . . . . 33
30.7.2. Coherent radio Cherenkov radia-tion . . . . . . . . . . . . . . . . . . . . . 35
30.7.3. Transition radiation . . . . . . . . . . . . 36
J. Beringer et al.(PDG), PR D86, 010001 (2012) (http://pdg.lbl.gov)June 18, 2012 16:19
2 30. Passage of particles through matter
30. PASSAGE OF PARTICLES THROUGH MATTER
Revised January 2012 by H. Bichsel (University of Washington), D.E. Groom(LBNL), and S.R. Klein (LBNL).
30.1. Notation
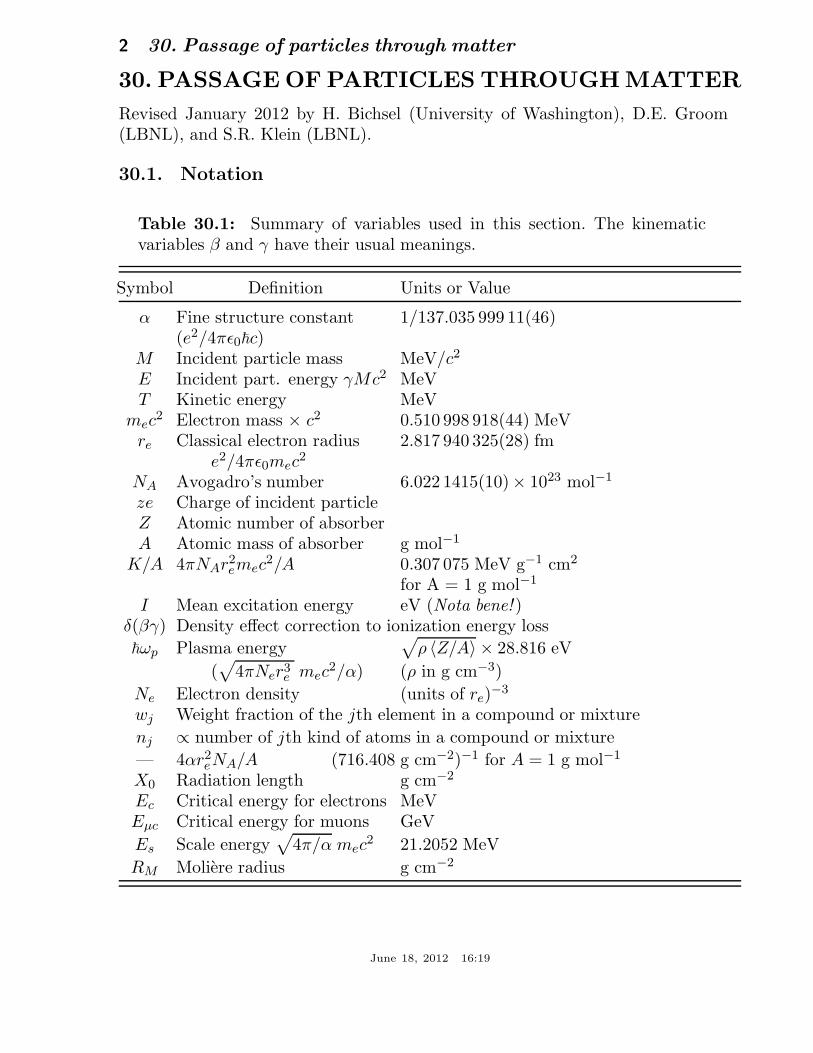
Table 30.1: Summary of variables used in this section. The kinematicvariables β and γ have their usual meanings.
Symbol Definition Units or Value
α Fine structure constant 1/137.035 999 11(46)(e2/4πǫ0~c)
M Incident particle mass MeV/c2
E Incident part. energy γMc2 MeVT Kinetic energy MeV
mec2 Electron mass × c2 0.510 998 918(44) MeV
re Classical electron radius 2.817 940 325(28) fme2/4πǫ0mec
2
NA Avogadro’s number 6.022 1415(10)× 1023 mol−1
ze Charge of incident particleZ Atomic number of absorberA Atomic mass of absorber g mol−1
K/A 4πNAr2emec
2/A 0.307 075 MeV g−1 cm2
for A = 1 g mol−1
I Mean excitation energy eV (Nota bene! )δ(βγ) Density effect correction to ionization energy loss
~ωp Plasma energy√
ρ 〈Z/A〉 × 28.816 eV
(√
4πNer3e mec
2/α) (ρ in g cm−3)
Ne Electron density (units of re)−3
wj Weight fraction of the jth element in a compound or mixture
nj ∝ number of jth kind of atoms in a compound or mixture
— 4αr2eNA/A (716.408 g cm−2)−1 for A = 1 g mol−1
X0 Radiation length g cm−2
Ec Critical energy for electrons MeVEµc Critical energy for muons GeV
Es Scale energy√
4π/α mec2 21.2052 MeV
RM Moliere radius g cm−2
June 18, 2012 16:19

30. Passage of particles through matter 3
30.2. Electronic energy loss by heavy particles [1–34]
30.2.1. Moments and cross sections :
The electronic interactions of fast charged particles with speed v = βc occurin single collisions with energy losses E [1], leading to ionization, atomic, orcollective excitation. Most frequently the energy losses are small (for 90% of allcollisions the energy losses are less than 100 eV). In thin absorbers few collisionswill take place and the total energy loss will show a large variance [1]; alsosee Sec. 30.2.7 below. For particles with charge ze more massive than electrons(“heavy” particles), scattering from free electrons is adequately described by theRutherford differential cross section [2], * †
dσR(E;β)
dE=
2πr2emec
2z2
β2
(1 − β2E/Tmax)
E2, (30.1)
where Tmax is the maximum energy transfer possible in a single collision. But inmatter electrons are not free. E must be finite and depends on atomic and bulkstructure. For electrons bound in atoms Bethe [3] used “Born Theorie” to obtainthe differential cross section
dσB(E;β)
dE=
dσR(E, β)
dEB(E) . (30.2)
Examples of B(E) and dσB/dE can be seen in Figs. 5 and 6 of Ref. 1.Bethe’s theory extends only to some energy above which atomic effects were
not important. The free-electron cross section (Eq. (30.1)) can be used to extendthe cross section to Tmax. At high energies σB is further modified by polarizationof the medium, and this “density effect,” discussed in Sec. 30.2.4, must also beincluded. Less important corrections are discussed below.
The mean number of collisions with energy loss between E and E +dE occurringin a distance δx is Neδx (dσ/dE)dE, where dσ(E;β)/dE contains all contributions.It is convenient to define the moments
Mj(β) = Ne δx
∫
Ej dσ(E;β)
dEdE , (30.3)
so that M0 is the mean number of collisions in δx, M1 is the mean energy loss in δx,M2 − M2
1 is the variance, etc. The number of collisions is Poisson-distributed withmean M0. Ne is either measured in electrons/g (Ne = NAZ/A) or electrons/cm3
(Ne = NA ρZ/A). The former is used throughout this chapter, since quantities
* For spin 0 particles. The β dependence in the parentheses is different forspin 1/2 and spin 1 particles, but it is not important except at energies far aboveatomic binding energies.
† In high-energy physics E normally means total energy, T + mc2. In stoppingpower discussions, E means kinetic energy, and we follow that convention (withsome inconsistency).
June 18, 2012 16:19
4 30. Passage of particles through matter
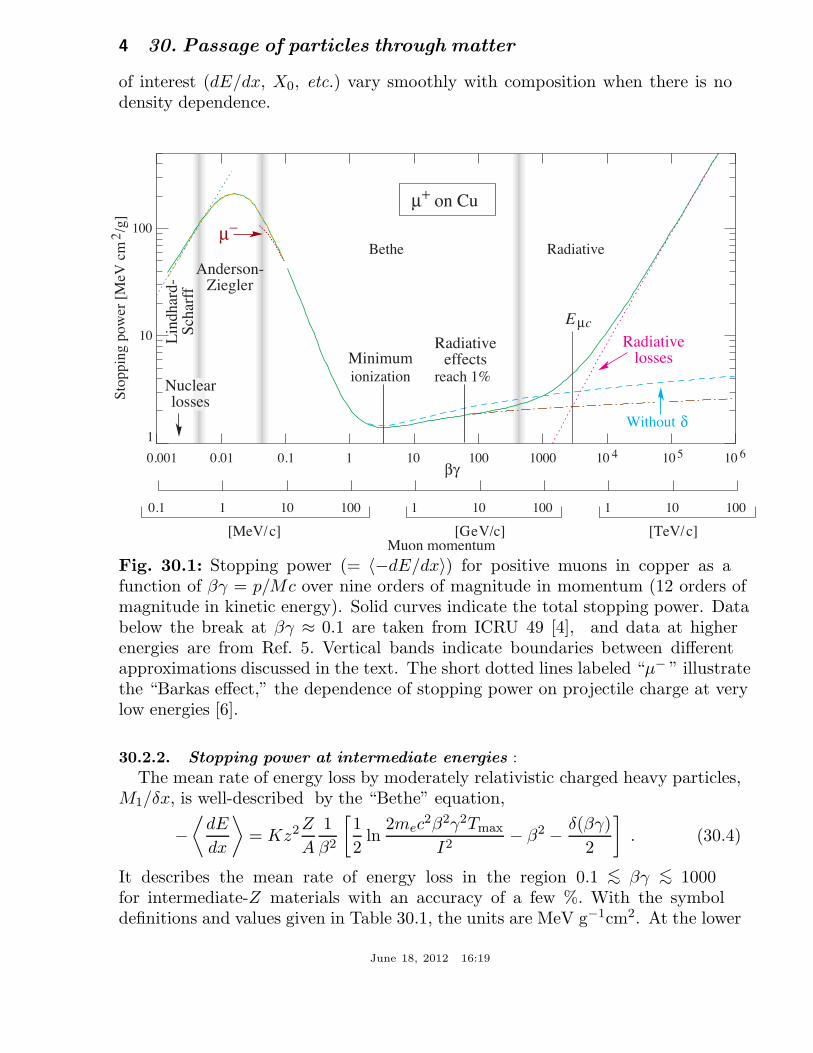
of interest (dE/dx, X0, etc.) vary smoothly with composition when there is nodensity dependence.
Fig. 30.1: Stopping power (= 〈−dE/dx〉) for positive muons in copper as afunction of βγ = p/Mc over nine orders of magnitude in momentum (12 orders ofmagnitude in kinetic energy). Solid curves indicate the total stopping power. Databelow the break at βγ ≈ 0.1 are taken from ICRU 49 [4], and data at higherenergies are from Ref. 5. Vertical bands indicate boundaries between differentapproximations discussed in the text. The short dotted lines labeled “µ− ” illustratethe “Barkas effect,” the dependence of stopping power on projectile charge at verylow energies [6].
30.2.2. Stopping power at intermediate energies :
The mean rate of energy loss by moderately relativistic charged heavy particles,M1/δx, is well-described by the “Bethe” equation,
−⟨
dE
dx
⟩
= Kz2Z
A
1
β2
[
1
2ln
2mec2β2γ2Tmax
I2− β2 − δ(βγ)
2
]
. (30.4)
It describes the mean rate of energy loss in the region 0.1 <∼ βγ <∼ 1000for intermediate-Z materials with an accuracy of a few %. With the symboldefinitions and values given in Table 30.1, the units are MeV g−1cm2. At the lower
June 18, 2012 16:19
30. Passage of particles through matter 5
limit the projectile velocity becomes comparable to atomic electron “velocities”(Sec. 30.2.3), and at the upper limit radiative effects begin to be important(Sec. 30.6). Both limits are Z dependent. Here Tmax is the maximum kineticenergy which can be imparted to a free electron in a single collision, and the othervariables are defined in Table 30.1. A minor dependence on M at the highestenergies is introduced through Tmax, but for all practical purposes 〈dE/dx〉 in agiven material is a function of β alone.
For heavy projectiles, like ions, additional terms are required to account forhigher-order photon coupling to the target, and to account for the finite size of thetarget radius. These can change dE/dx by a factor of two or more for the heaviestnuclei in certain kinematic regimes [7].
1
2
3
4
5
6
8
10
1.0 10 100 1000 10 0000.1
Pion momentum (GeV/c)
Proton momentum (GeV/c)
1.0 10 100 10000.1
1.0 10 100 10000.1
1.0 10 100 1000 10 0000.1
−d
E/
dx (
MeV
g−1
cm2)
βγ = p/Mc
Muon momentum (GeV/c)
H2 liquid
He gas
CAl
FeSn
Pb
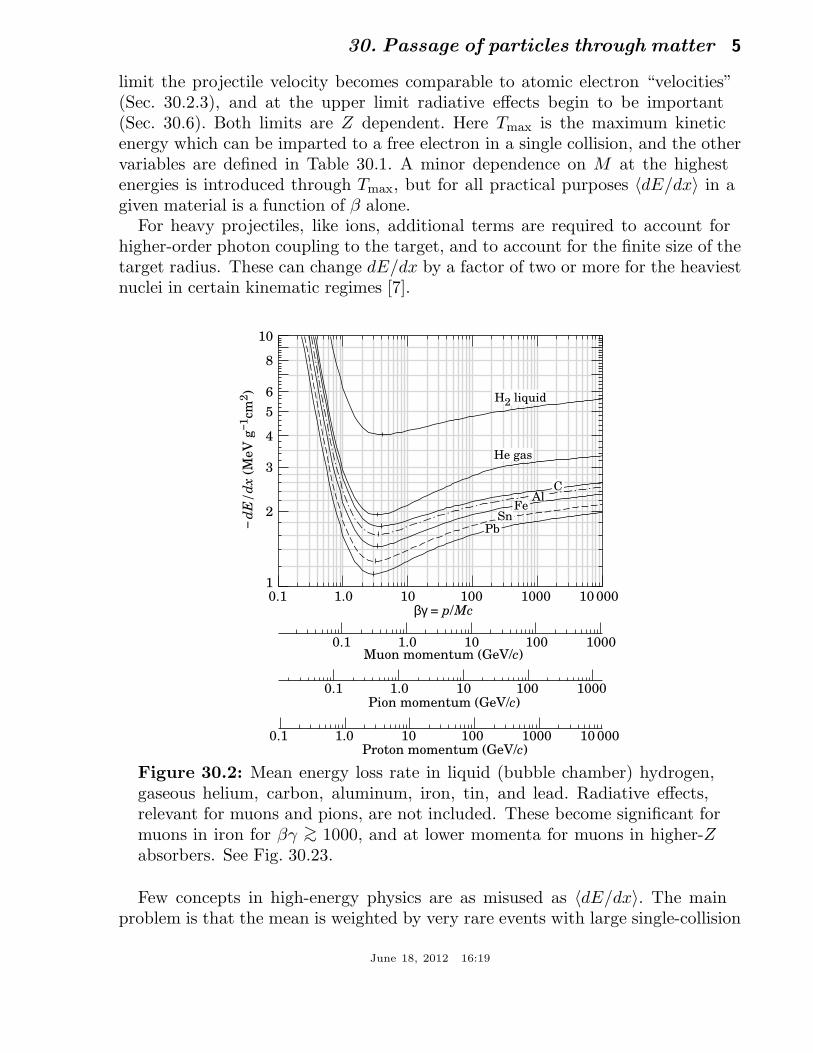
Figure 30.2: Mean energy loss rate in liquid (bubble chamber) hydrogen,gaseous helium, carbon, aluminum, iron, tin, and lead. Radiative effects,relevant for muons and pions, are not included. These become significant formuons in iron for βγ >∼ 1000, and at lower momenta for muons in higher-Zabsorbers. See Fig. 30.23.
Few concepts in high-energy physics are as misused as 〈dE/dx〉. The mainproblem is that the mean is weighted by very rare events with large single-collision
June 18, 2012 16:19

6 30. Passage of particles through matter
energy deposits. Even with samples of hundreds of events a dependable value forthe mean energy loss cannot be obtained. Far better and more easily measured isthe most probable energy loss, discussed in Sec. 30.2.7. The most probable energyloss in a detector is considerably below the mean given by the Bethe equation.
In a TPC (Sec. 31.6.5), the mean of 50%–70% of the samples with the smallestsignals is often used as an estimator.
Although it must be used with cautions and caveats, 〈dE/dx〉 as de-scribed in Eq. (30.4) still forms the basis of much of our understand-ing of energy loss by charged particles. Extensive tables are available[5,4,pdg.lbl.gov/AtomicNuclearProperties/].
0.5
1.0
1.5
2.0
2.5
⟨–d
E/
dx
⟩ min
(M
eV
g–1cm
2)
1 2 5 10 20 50 100
Z
H He Li Be B CNO Ne SnFe
SolidsGases
H2 gas: 4.10 H2 liquid: 3.97
2.35 – 0.28 ln(Z)
Figure 30.3: Stopping power at minimum ionization for the chemicalelements. The straight line is fitted for Z > 6. A simple functionaldependence on Z is not to be expected, since 〈−dE/dx〉 also depends onother variables.
The function as computed for muons on copper is shown as the “Bethe”region of Fig. 30.1. Mean energy loss behavior below this region is discussed inSec. 30.2.3, and the radiative effects at high energy are discussed in Sec. 30.6.Only in the Bethe region is it a function of β alone; the mass dependence is morecomplicated elsewhere. The stopping power in several other materials is shown inFig. 30.2. Except in hydrogen, particles with the same velocity have similar ratesof energy loss in different materials, although there is a slow decrease in the rate ofenergy loss with increasing Z. The qualitative behavior difference at high energiesbetween a gas (He in the figure) and the other materials shown in the figure isdue to the density-effect correction, δ(βγ), discussed in Sec. 30.2.4. The stopping
June 18, 2012 16:19
30. Passage of particles through matter 7
power functions are characterized by broad minima whose position drops fromβγ = 3.5 to 3.0 as Z goes from 7 to 100. The values of minimum ionization as afunction of atomic number are shown in Fig. 30.3.
In practical cases, most relativistic particles (e.g., cosmic-ray muons) have meanenergy loss rates close to the minimum; they are “minimum-ionizing particles,” ormip’s.
0.05 0.10.02 0.50.2 1.0 5.02.0 10.0
Pion momentum (GeV/c)
0.1 0.50.2 1.0 5.02.0 10.0 50.020.0
Proton momentum (GeV/c)
0.050.02 0.1 0.50.2 1.0 5.02.0 10.0
Muon momentum (GeV/c)
βγ = p/Mc
1
2
5
10
20
50
100
200
500
1000
2000
5000
10000
20000
50000
R/M
(g c
m−2
G
eV
−1)
0.1 2 5 1.0 2 5 10.0 2 5 100.0
H2 liquid
He gas
Pb
FeC
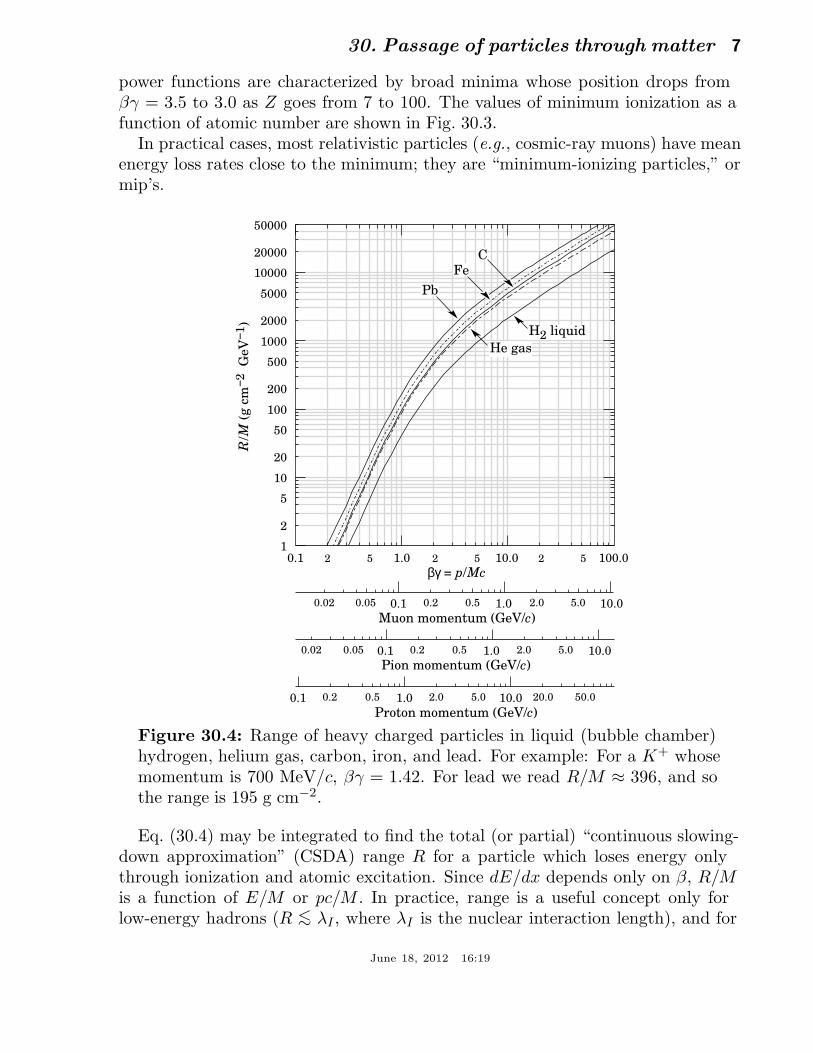
Figure 30.4: Range of heavy charged particles in liquid (bubble chamber)hydrogen, helium gas, carbon, iron, and lead. For example: For a K+ whosemomentum is 700 MeV/c, βγ = 1.42. For lead we read R/M ≈ 396, and sothe range is 195 g cm−2.
Eq. (30.4) may be integrated to find the total (or partial) “continuous slowing-down approximation” (CSDA) range R for a particle which loses energy onlythrough ionization and atomic excitation. Since dE/dx depends only on β, R/Mis a function of E/M or pc/M . In practice, range is a useful concept only forlow-energy hadrons (R <∼ λI , where λI is the nuclear interaction length), and for
June 18, 2012 16:19
8 30. Passage of particles through matter
muons below a few hundred GeV (above which radiative effects dominate). R/Mas a function of βγ = p/Mc is shown for a variety of materials in Fig. 30.4.
The mass scaling of dE/dx and range is valid for the electronic losses describedby the Bethe equation, but not for radiative losses, relevant only for muons andpions.
For a particle with mass M and momentum Mβγc, Tmax is given by
Tmax =2mec
2 β2γ2
1 + 2γme/M + (me/M)2. (30.5)
In older references [2,8] the “low-energy” approximation Tmax = 2mec2 β2γ2, valid
for 2γme/M ≪ 1, is often implicit. For a pion in copper, the error thus introducedinto dE/dx is greater than 6% at 100 GeV.
At energies of order 100 GeV, the maximum 4-momentum transfer to theelectron can exceed 1 GeV/c, where hadronic structure effects significantly modifythe cross sections. This problem has been investigated by J.D. Jackson [9], whoconcluded that for hadrons (but not for large nuclei) corrections to dE/dx arenegligible below energies where radiative effects dominate. While the cross sectionfor rare hard collisions is modified, the average stopping power, dominated bymany softer collisions, is almost unchanged.
0 10 20 30 40 50 60 70 80 90 100 8
10
12
14
16
18
20
22
I ad
j/Z
(eV
)
Z
Barkas & Berger 1964
Bichsel 1992
ICRU 37 (1984) (interpolated values are not marked with points)
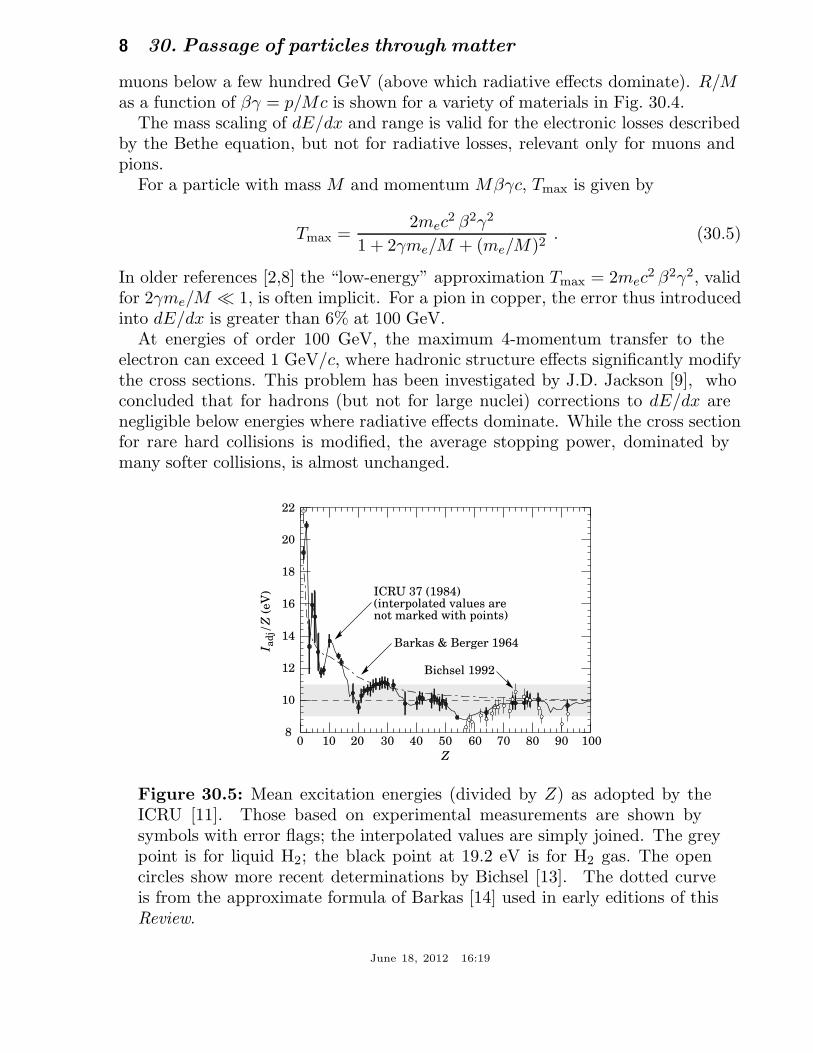
Figure 30.5: Mean excitation energies (divided by Z) as adopted by theICRU [11]. Those based on experimental measurements are shown bysymbols with error flags; the interpolated values are simply joined. The greypoint is for liquid H2; the black point at 19.2 eV is for H2 gas. The opencircles show more recent determinations by Bichsel [13]. The dotted curveis from the approximate formula of Barkas [14] used in early editions of thisReview.
June 18, 2012 16:19
30. Passage of particles through matter 9
“The determination of the mean excitation energy is the principal non-trivialtask in the evaluation of the Bethe stopping-power formula” [10]. Recommendedvalues have varied substantially with time. Estimates based on experimentalstopping-power measurements for protons, deuterons, and alpha particles and onoscillator-strength distributions and dielectric-response functions were given inICRU 49 [4]. See also ICRU 37 [11]. These values, shown in Fig. 30.5, have sincebeen widely used. Machine-readable versions can also be found [12]. These valuesare widely used.
30.2.3. Energy loss at low energies : Shell corrections C/Z must be includedin the square brackets of of Eq. (30.4) [4,11,13,14] to correct for atomic bindinghaving been neglected in calculating some of the contributions to Eq. (30.4). TheBarkas form [14] was used in generating Fig. 30.1. For copper it contributes about1% at βγ = 0.3 (kinetic energy 6 MeV for a pion), and the correction decreasesvery rapidly with increasing energy.
Equation 30.2, and therefore Eq. (30.4), are based on a first-order Bornapproximation. Higher-order corrections, again important only at lower energies,are normally included by adding the “Bloch correction” z2L2(β) inside the squarebrackets (Eq.(2.5) in [4]) .
An additional “Barkas correction” zL1(β) reduces the stopping power for anegative particle below that for a positive particle with the same mass and velocity.In a 1956 paper, Barkas et al. noted that negative pions had a longer range thanpositive pions [6]. The effect has been measured for a number of negative/positiveparticle pairs, including a detailed study with antiprotons [15].
A detailed discussion of low-energy corrections to the Bethe formula is givenin ICRU Report 49 [4]. When the corrections are properly included, the Bethetreatment is accurate to about 1% down to β ≈ 0.05, or about 1 MeV for protons.
For 0.01 < β < 0.05, there is no satisfactory theory. For protons, one usuallyrelies on the phenomenological fitting formulae developed by Andersen andZiegler [4,16]. As shown in ICRU 49 [4] (using data taken from Ref. 16), thenuclear plus electronic proton stopping power in copper is 113 MeV cm2 g−1 atT = 10 keV, rises to a maximum of 210 MeV cm2 g−1 at 100–150 keV, then fallsto 120 MeV cm2 g−1 at 1 MeV.
For particles moving more slowly than ≈ 0.01c (more or less the velocity of theouter atomic electrons), Lindhard has been quite successful in describing electronicstopping power, which is proportional to β [17]. Finally, we note that at evenlower energies, e.g., for protons of less than several hundred eV, non-ionizingnuclear recoil energy loss dominates the total energy loss [4,17,18].
June 18, 2012 16:19
10 30. Passage of particles through matter
30.2.4. Density effect : As the particle energy increases, its electric field flattensand extends, so that the distant-collision contribution to Eq. (30.4) increases asln βγ. However, real media become polarized, limiting the field extension andeffectively truncating this part of the logarithmic rise [2–8,19–21]. At very highenergies,
δ/2 → ln(~ωp/I) + ln βγ − 1/2 , (30.6)
where δ(βγ)/2 is the density effect correction introduced in Eq. (30.4) and ~ωp isthe plasma energy defined in Table 30.1. A comparison with Eq. (30.4) shows that|dE/dx| then grows as ln βγ rather than lnβ2γ2, and that the mean excitationenergy I is replaced by the plasma energy ~ωp. The ionization stopping power ascalculated with and without the density effect correction is shown in Fig. 30.1.Since the plasma frequency scales as the square root of the electron density, thecorrection is much larger for a liquid or solid than for a gas, as is illustrated by theexamples in Fig. 30.2.
The density effect correction is usually computed using Sternheimer’s parame-terization [19]:
δ(βγ) =
2(ln 10)x − C if x ≥ x1;2(ln 10)x − C + a(x1 − x)k if x0 ≤ x < x1;0 if x < x0 (nonconductors);δ0102(x−x0) if x < x0 (conductors)
(30.7)
Here x = log10 η = log10(p/Mc). C (the negative of the C used in Ref. 19) isobtained by equating the high-energy case of Eq. (30.7) with the limit given inEq. (30.6). The other parameters are adjusted to give a best fit to the results ofdetailed calculations for momenta below Mc exp(x1). Parameters for elements andnearly 200 compounds and mixtures of interest are published in a variety of places,notably in Ref. 21. A recipe for finding the coefficients for nontabulated materialsis given by Sternheimer and Peierls [22], and is summarized in Ref. 5.
The remaining relativistic rise comes from the β2γ2 growth of Tmax, which inturn is due to (rare) large energy transfers to a few electrons. When these eventsare excluded, the energy deposit in an absorbing layer approaches a constant value,the Fermi plateau (see Sec. 30.2.6 below). At extreme energies (e.g., > 332 GeVfor muons in iron, and at a considerably higher energy for protons in iron),radiative effects are more important than ionization losses. These are especiallyrelevant for high-energy muons, as discussed in Sec. 30.6.
June 18, 2012 16:19
30. Passage of particles through matter 11
30.2.5. Energetic knock-on electrons (δ rays) : The distribution of secondaryelectrons with kinetic energies T ≫ I is [2]
d2N
dTdx=
1
2Kz2Z
A
1
β2
F (T )
T 2(30.8)
for I ≪ T ≤ Tmax, where Tmax is given by Eq. (30.5). Here β is the velocityof the primary particle. The factor F is spin-dependent, but is about unity forT ≪ Tmax. For spin-0 particles F (T ) = (1 − β2T/Tmax); forms for spins 1/2 and1 are also given by Rossi [2]( Sec. 2.3, Eqns. 7 and 8). For incident electrons, theindistinguishability of projectile and target means that the range of T extends onlyto half the kinetic energy of the incident particle. Additional formulae are given inRef. 23. Equation (30.8) is inaccurate for T close to I [24].
δ rays of even modest energy are rare. For a β ≈ 1 particle, for example, onaverage only one collision with Te > 10 keV will occur along a path length of 90cm of Ar gas [1].
A δ ray with kinetic energy Te and corresponding momentum pe is produced atan angle θ given by
cos θ = (Te/pe)(pmax/Tmax) , (30.9)
where pmax is the momentum of an electron with the maximum possible energytransfer Tmax.
Landau/Vavilov/Bichsel ∆p/x for :
Bethe
Tcut = 10 dE/dx|minTcut = 2 dE/dx|min
Restricted energy loss for :
0.1 1.0 10.0 100.0 1000.0
1.0
1.5
0.5
2.0
2.5
3.0
MeV
g−1
cm
2 (E
lect
onic
lose
s on
ly)
Muon kinetic energy (GeV)
Silicon
x/ρ = 1600 µm320 µm80 µm
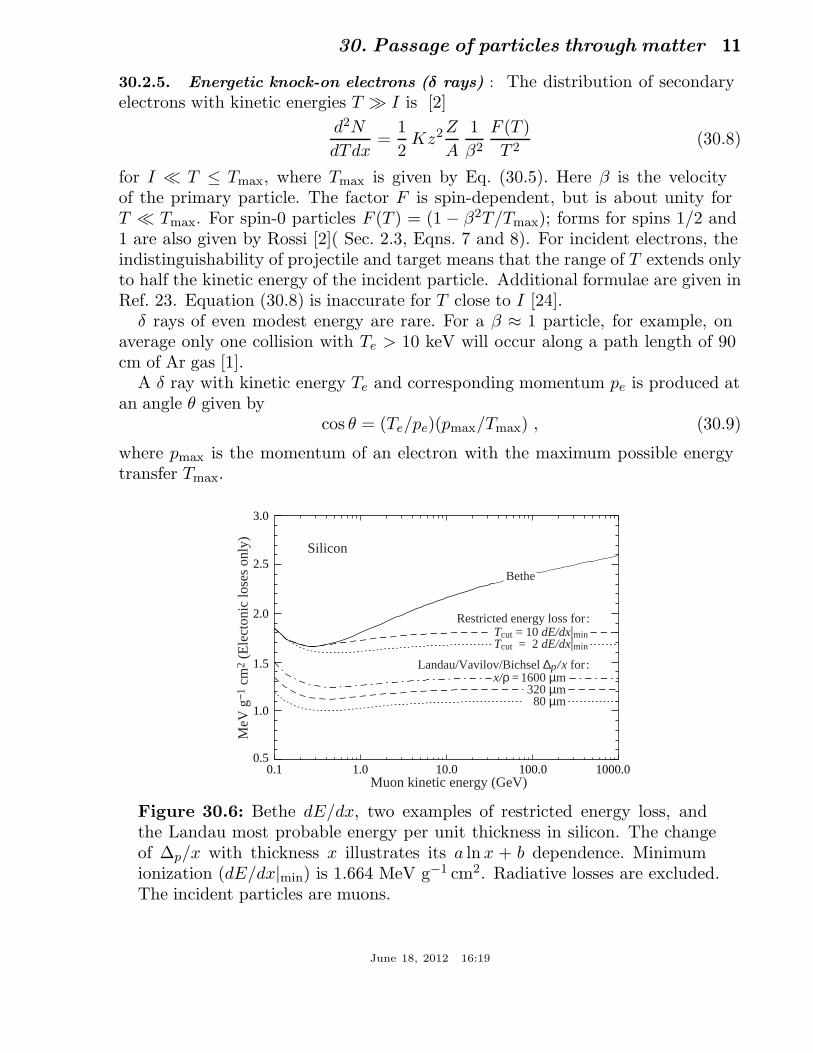
Figure 30.6: Bethe dE/dx, two examples of restricted energy loss, andthe Landau most probable energy per unit thickness in silicon. The changeof ∆p/x with thickness x illustrates its a ln x + b dependence. Minimumionization (dE/dx|min) is 1.664 MeV g−1 cm2. Radiative losses are excluded.The incident particles are muons.
June 18, 2012 16:19

12 30. Passage of particles through matter
30.2.6. Restricted energy loss rates for relativistic ionizing particles : Fur-ther insight can be obtained by examining the mean energy deposit by an ionizingparticle when energy transfers are restricted to T ≤ Tcut ≤ Tmax. The restrictedenergy loss rate is
−dE
dx
∣
∣
∣
∣
T<Tcut
= Kz2Z
A
1
β2
[
1
2ln
2mec2β2γ2Tcut
I2
−β2
2
(
1 +Tcut
Tmax
)
− δ
2
]
. (30.10)
This form approaches the normal Bethe function (Eq. (30.4)) as Tcut → Tmax. Itcan be verified that the difference between Eq. (30.4) and Eq. (30.10) is equal to∫ Tmax
TcutT (d2N/dTdx)dT , where d2N/dTdx is given by Eq. (30.8).
Since Tcut replaces Tmax in the argument of the logarithmic term of Eq. (30.4),the βγ term producing the relativistic rise in the close-collision part of dE/dxis replaced by a constant, and |dE/dx|T<Tcut
approaches the constant “Fermiplateau.” (The density effect correction δ eliminates the explicit βγ dependenceproduced by the distant-collision contribution.) This behavior is illustrated inFig. 30.6, where restricted loss rates for two examples of Tcut are shown incomparison with the full Bethe dE/dx and the Landau-Vavilov most probableenergy loss (to be discussed in Sec. 30.2.7 below).
30.2.7. Fluctuations in energy loss : For detectors of moderate thickness x (e.g.scintillators or LAr cells),* the energy loss probability distribution f(∆;βγ, x)is adequately described by the highly-skewed Landau (or Landau-Vavilov)distribution [25,26]. The most probable energy loss is [27]
∆p = ξ
[
ln2mc2β2γ2
I+ ln
ξ
I+ j − β2 − δ(βγ)
]
, (30.11)
where ξ = (K/2) 〈Z/A〉 (x/β2) MeV for a detector with a thickness x in g cm−2,and j = 0.200 [27]. † While dE/dx is independent of thickness, ∆p/x scales asa ln x + b. The density correction δ(βγ) was not included in Landau’s or Vavilov’swork, but it was later included by Bichsel [27]. The high-energy behavior of δ(βγ)(Eq. (30.6)) is such that
∆p −→βγ>∼100
ξ
[
ln2mc2ξ
(~ωp)2+ j
]
. (30.12)
* G <∼ 0.05–0.1, where G is given by Rossi [Ref. 2, Eq. 2.7.10]. It is Vavilov’sκ [26].
† Rossi [2], Talman [28], and others give somewhat different values for j. Themost probable loss is not sensitive to its value.
June 18, 2012 16:19
30. Passage of particles through matter 13
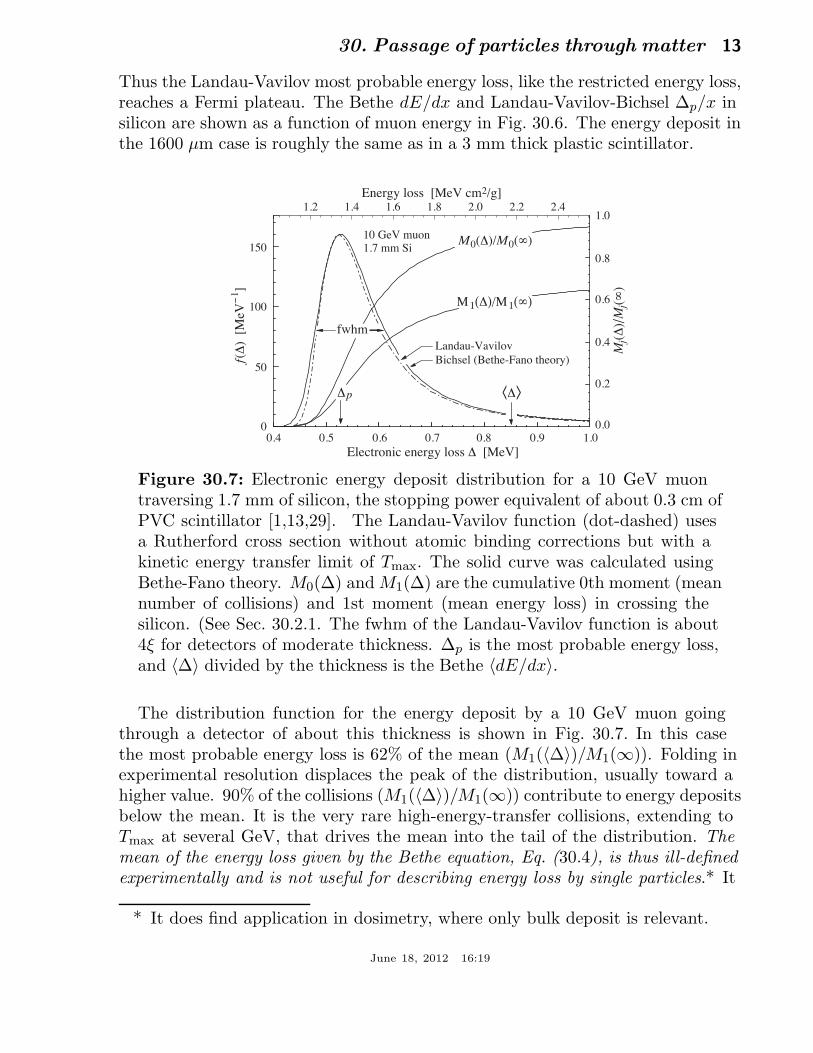
Thus the Landau-Vavilov most probable energy loss, like the restricted energy loss,reaches a Fermi plateau. The Bethe dE/dx and Landau-Vavilov-Bichsel ∆p/x insilicon are shown as a function of muon energy in Fig. 30.6. The energy deposit inthe 1600 µm case is roughly the same as in a 3 mm thick plastic scintillator.
f(Δ
) [
MeV
−1]
Electronic energy loss Δ [MeV]
Energy loss [MeV cm2/g]
150
100
50
00.4 0.5 0.6 0.7 0.8 1.00.9
0.8
1.0
0.6
0.4
0.2
0.0
Mj(Δ
) /Mj(∞
)
Landau-Vavilov
Bichsel (Bethe-Fano theory)
Δp Δ
fwhm
M0(Δ)/M0(∞)
Μ1(Δ)/Μ1(∞)
10 GeV muon1.7 mm Si
1.2 1.4 1.6 1.8 2.0 2.2 2.4
< >
Figure 30.7: Electronic energy deposit distribution for a 10 GeV muontraversing 1.7 mm of silicon, the stopping power equivalent of about 0.3 cm ofPVC scintillator [1,13,29]. The Landau-Vavilov function (dot-dashed) usesa Rutherford cross section without atomic binding corrections but with akinetic energy transfer limit of Tmax. The solid curve was calculated usingBethe-Fano theory. M0(∆) and M1(∆) are the cumulative 0th moment (meannumber of collisions) and 1st moment (mean energy loss) in crossing thesilicon. (See Sec. 30.2.1. The fwhm of the Landau-Vavilov function is about4ξ for detectors of moderate thickness. ∆p is the most probable energy loss,and 〈∆〉 divided by the thickness is the Bethe 〈dE/dx〉.
The distribution function for the energy deposit by a 10 GeV muon goingthrough a detector of about this thickness is shown in Fig. 30.7. In this casethe most probable energy loss is 62% of the mean (M1(〈∆〉)/M1(∞)). Folding inexperimental resolution displaces the peak of the distribution, usually toward ahigher value. 90% of the collisions (M1(〈∆〉)/M1(∞)) contribute to energy depositsbelow the mean. It is the very rare high-energy-transfer collisions, extending toTmax at several GeV, that drives the mean into the tail of the distribution. Themean of the energy loss given by the Bethe equation, Eq. (30.4), is thus ill-definedexperimentally and is not useful for describing energy loss by single particles.* It
* It does find application in dosimetry, where only bulk deposit is relevant.
June 18, 2012 16:19

14 30. Passage of particles through matter
rises as ln βγ because Tmax increases as β2γ2. The large single-collision energytransfers that increasingly extend the long tail are rare, making the mean ofan experimental distribution consisting of a few hundred events subject to largefluctuations and sensitive to cuts. The most probable energy loss should be used.†
100 200 300 400 500 6000.0
0.2
0.4
0.6
0.8
1.0
0.50 1.00 1.50 2.00 2.50
640 µm (149 mg/cm2)
320 µm (74.7 mg/cm2)
160 µm (37.4 mg/cm2)
80 µm (18.7 mg/cm2)
500 MeV pion in silicon
Mean energyloss rate
wf(∆
/x)
∆/x (eV/µm)
∆p/x
∆/x (MeV g−1 cm2)
Figure 30.8: Straggling functions in silicon for 500 MeV pions, normalizedto unity at the most probable value δp/x. The width w is the full width athalf maximum.
The Landau distribution fails to describe energy loss in thin absorbers such asgas TPC cells [1] and Si detectors [27], as shown clearly in Fig. 1 of Ref. 1 foran argon-filled TPC cell. Also see Talman [28]. While ∆p/x may be calculatedadequately with Eq. (30.11), the distributions are significantly wider than theLandau width w = 4ξ [Ref. 27, Fig. 15]. Examples for 500 MeV pions incidenton thin silicon detectors are shown in Fig. 30.8. For very thick absorbers thedistribution is less skewed but never approaches a Gaussian.
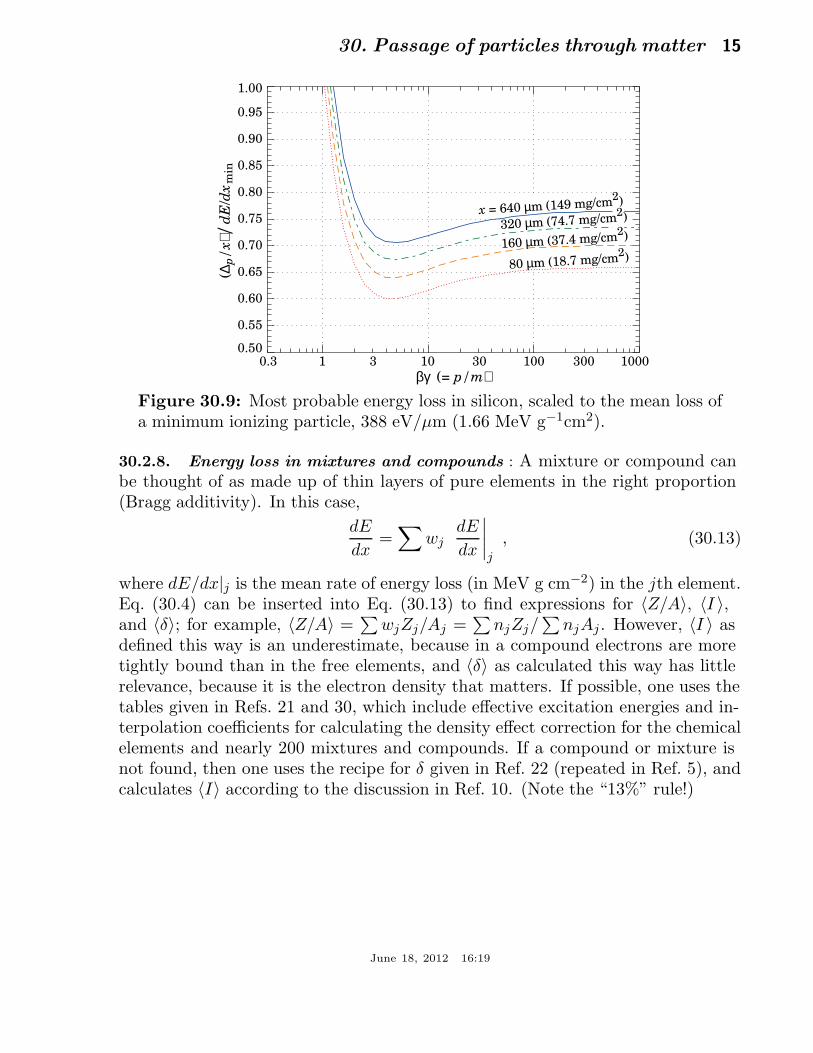
The most probable energy loss, scaled to the mean loss at minimum ionization,is shown in Fig. 30.9 for several silicon detector thicknesses.
† An alternative approach is taken in TPC analysis, where some fraction of thehighest energy deposit signals along a track, e.g. 20%, are discarded before takingthe average.
June 18, 2012 16:19
30. Passage of particles through matter 15
1 30.3 30 30010 100 1000
βγ (= p/m)
0.50
0.55
0.60
0.65
0.70
0.75
0.80
0.85
0.90
0.95
1.00
(∆p/
x) /
dE
/dx
min
80 µm (18.7 mg/cm2)
160 µm (37.4 mg/cm2)
x = 640 µm (149 mg/cm2)
320 µm (74.7 mg/cm2)
Figure 30.9: Most probable energy loss in silicon, scaled to the mean loss ofa minimum ionizing particle, 388 eV/µm (1.66 MeV g−1cm2).
30.2.8. Energy loss in mixtures and compounds : A mixture or compound canbe thought of as made up of thin layers of pure elements in the right proportion(Bragg additivity). In this case,
dE
dx=
∑
wjdE
dx
∣
∣
∣
∣
j
, (30.13)
where dE/dx|j is the mean rate of energy loss (in MeV g cm−2) in the jth element.Eq. (30.4) can be inserted into Eq. (30.13) to find expressions for 〈Z/A〉, 〈I 〉,and 〈δ〉; for example, 〈Z/A〉 =
∑
wjZj/Aj =∑
njZj/∑
njAj . However, 〈I 〉 asdefined this way is an underestimate, because in a compound electrons are moretightly bound than in the free elements, and 〈δ〉 as calculated this way has littlerelevance, because it is the electron density that matters. If possible, one uses thetables given in Refs. 21 and 30, which include effective excitation energies and in-terpolation coefficients for calculating the density effect correction for the chemicalelements and nearly 200 mixtures and compounds. If a compound or mixture isnot found, then one uses the recipe for δ given in Ref. 22 (repeated in Ref. 5), andcalculates 〈I〉 according to the discussion in Ref. 10. (Note the “13%” rule!)
June 18, 2012 16:19
16 30. Passage of particles through matter
30.2.9. Ionization yields : Physicists frequently relate total energy loss to thenumber of ion pairs produced near the particle’s track. This relation becomescomplicated for relativistic particles due to the wandering of energetic knock-onelectrons whose ranges exceed the dimensions of the fiducial volume. For aqualitative appraisal of the nonlocality of energy deposition in various media bysuch modestly energetic knock-on electrons, see Ref. 31. The mean local energydissipation per local ion pair produced, W , while essentially constant for relativisticparticles, increases at slow particle speeds [32]. For gases, W can be surprisinglysensitive to trace amounts of various contaminants [32]. Furthermore, ionizationyields in practical cases may be greatly influenced by such factors as subsequentrecombination [33].
30.3. Multiple scattering through small angles
A charged particle traversing a medium is deflected by many small-anglescatters. Most of this deflection is due to Coulomb scattering from nuclei, andhence the effect is called multiple Coulomb scattering. (However, for hadronicprojectiles, the strong interactions also contribute to multiple scattering.) TheCoulomb scattering distribution is well represented by the theory of Moliere [35].It is roughly Gaussian for small deflection angles, but at larger angles (greaterthan a few θ0, defined below) it behaves like Rutherford scattering, with largertails than does a Gaussian distribution.
If we define
θ0 = θ rmsplane =
1√2
θrmsspace . (30.14)
then it is sufficient for many applications to use a Gaussian approximation for thecentral 98% of the projected angular distribution, with a width given by [36,37]
θ0 =13.6 MeV
βcpz
√
x/X0
[
1 + 0.038 ln(x/X0)]
. (30.15)
Here p, βc, and z are the momentum, velocity, and charge number of the incidentparticle, and x/X0 is the thickness of the scattering medium in radiation lengths(defined below). This value of θ0 is from a fit to Moliere distribution for singlycharged particles with β = 1 for all Z, and is accurate to 11% or better for10−3 < x/X0 < 100.
Eq. (30.15) describes scattering from a single material, while the usual probleminvolves the multiple scattering of a particle traversing many different layers andmixtures. Since it is from a fit to a Moliere distribution, it is incorrect to add theindividual θ0 contributions in quadrature; the result is systematically too small. Itis much more accurate to apply Eq. (30.15) once, after finding x and X0 for thecombined scatterer.
June 18, 2012 16:19
30. Passage of particles through matter 17
x
splaneyplane
Ψplane
θplane
x /2
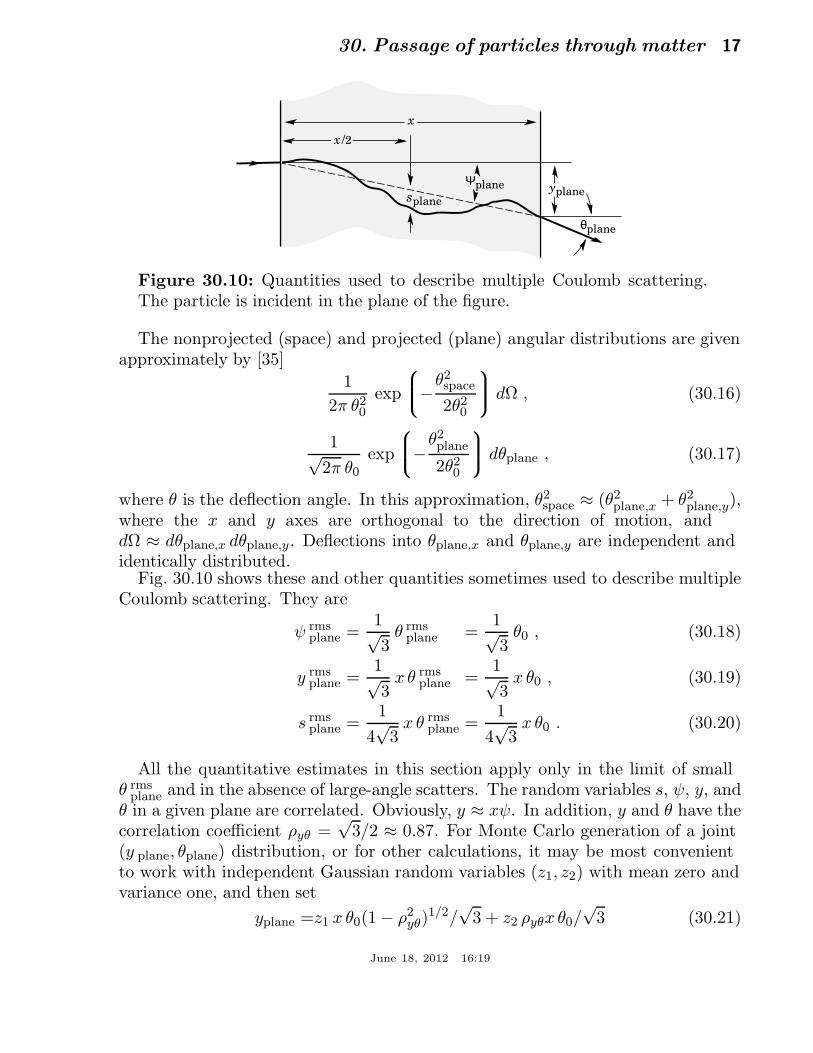
Figure 30.10: Quantities used to describe multiple Coulomb scattering.The particle is incident in the plane of the figure.
The nonprojected (space) and projected (plane) angular distributions are givenapproximately by [35]
1
2π θ20
exp
−θ2space
2θ20
dΩ , (30.16)
1√2π θ0
exp
−θ2plane
2θ20
dθplane , (30.17)
where θ is the deflection angle. In this approximation, θ2space ≈ (θ2
plane,x + θ2plane,y),
where the x and y axes are orthogonal to the direction of motion, anddΩ ≈ dθplane,x dθplane,y. Deflections into θplane,x and θplane,y are independent andidentically distributed.
Fig. 30.10 shows these and other quantities sometimes used to describe multipleCoulomb scattering. They are
ψ rmsplane =
1√3
θ rmsplane =
1√3
θ0 , (30.18)
y rmsplane =
1√3
x θ rmsplane =
1√3
x θ0 , (30.19)
s rmsplane =
1
4√
3x θ rms
plane =1
4√
3x θ0 . (30.20)
All the quantitative estimates in this section apply only in the limit of smallθ rms
plane and in the absence of large-angle scatters. The random variables s, ψ, y, andθ in a given plane are correlated. Obviously, y ≈ xψ. In addition, y and θ have thecorrelation coefficient ρyθ =
√3/2 ≈ 0.87. For Monte Carlo generation of a joint
(y plane, θplane) distribution, or for other calculations, it may be most convenientto work with independent Gaussian random variables (z1, z2) with mean zero andvariance one, and then set
yplane =z1 x θ0(1 − ρ2yθ)
1/2/√
3 + z2 ρyθx θ0/√
3 (30.21)
June 18, 2012 16:19
18 30. Passage of particles through matter
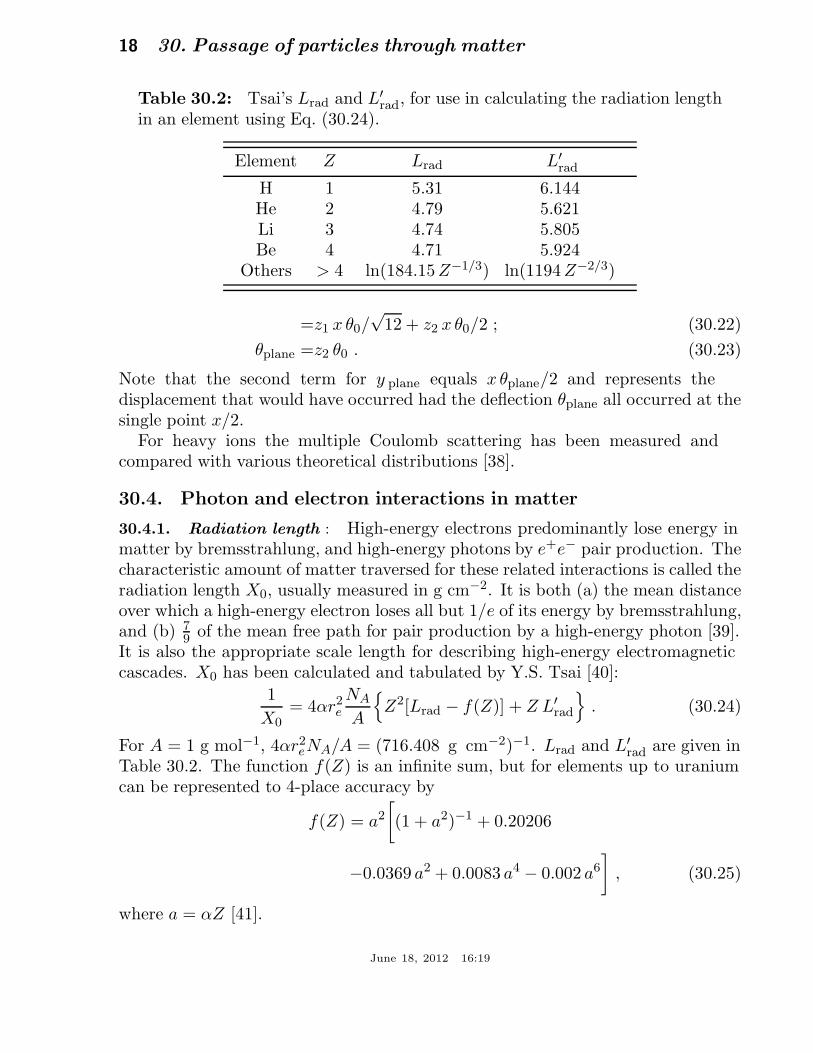
Table 30.2: Tsai’s Lrad and L′rad, for use in calculating the radiation length
in an element using Eq. (30.24).
Element Z Lrad L′rad
H 1 5.31 6.144He 2 4.79 5.621Li 3 4.74 5.805Be 4 4.71 5.924
Others > 4 ln(184.15 Z−1/3) ln(1194 Z−2/3)
=z1 x θ0/√
12 + z2 x θ0/2 ; (30.22)
θplane =z2 θ0 . (30.23)
Note that the second term for y plane equals x θplane/2 and represents thedisplacement that would have occurred had the deflection θplane all occurred at thesingle point x/2.
For heavy ions the multiple Coulomb scattering has been measured andcompared with various theoretical distributions [38].
30.4. Photon and electron interactions in matter
30.4.1. Radiation length : High-energy electrons predominantly lose energy inmatter by bremsstrahlung, and high-energy photons by e+e− pair production. Thecharacteristic amount of matter traversed for these related interactions is called theradiation length X0, usually measured in g cm−2. It is both (a) the mean distanceover which a high-energy electron loses all but 1/e of its energy by bremsstrahlung,and (b) 7
9 of the mean free path for pair production by a high-energy photon [39].It is also the appropriate scale length for describing high-energy electromagneticcascades. X0 has been calculated and tabulated by Y.S. Tsai [40]:
1
X0= 4αr2
e
NA
A
Z2[Lrad − f(Z)] + Z L′rad
. (30.24)
For A = 1 g mol−1, 4αr2eNA/A = (716.408 g cm−2)−1. Lrad and L′
rad are given inTable 30.2. The function f(Z) is an infinite sum, but for elements up to uraniumcan be represented to 4-place accuracy by
f(Z) = a2
[
(1 + a2)−1 + 0.20206
−0.0369 a2 + 0.0083 a4 − 0.002 a6
]
, (30.25)
where a = αZ [41].
June 18, 2012 16:19

30. Passage of particles through matter 19
The radiation length in a mixture or compound may be approximated by
1/X0 =∑
wj/Xj , (30.26)
where wj and Xj are the fraction by weight and the radiation length for the jthelement.
Figure 30.11: Fractional energy loss per radiation length in lead as afunction of electron or positron energy. Electron (positron) scattering isconsidered as ionization when the energy loss per collision is below 0.255MeV, and as Møller (Bhabha) scattering when it is above. Adapted fromFig. 3.2 from Messel and Crawford, Electron-Photon Shower DistributionFunction Tables for Lead, Copper, and Air Absorbers, Pergamon Press,1970. Messel and Crawford use X0(Pb) = 5.82 g/cm2, but we have modifiedthe figures to reflect the value given in the Table of Atomic and NuclearProperties of Materials (X0(Pb) = 6.37 g/cm2).
30.4.2. Energy loss by electrons : At low energies electrons and positronsprimarily lose energy by ionization, although other processes (Møller scattering,Bhabha scattering, e+ annihilation) contribute, as shown in Fig. 30.11. Whileionization loss rates rise logarithmically with energy, bremsstrahlung losses risenearly linearly (fractional loss is nearly independent of energy), and dominatesabove a few tens of MeV in most materials (See Sec. 30.4.3 below.)
Ionization loss by electrons and positrons differ somewhat, and both differ fromloss by heavy particles because of the kinematics, spin, and the identity of theincident electron with the electrons which it ionizes. Complete discussions andtables can be found in Refs. 10, 11, and 30.
June 18, 2012 16:19
20 30. Passage of particles through matter
At very high energies and except at the high-energy tip of the bremsstrahlungspectrum, the cross section can be approximated in the “complete screening case”as [40]
dσ/dk = (1/k)4αr2e(4
3 − 43y + y2)[Z2(Lrad − f(Z)) + Z L′
rad]
+ 19(1 − y)(Z2 + Z) ,
(30.27)
where y = k/E is the fraction of the electron’s energy transfered to the radiatedphoton. At small y (the “infrared limit”) the term on the second line ranges from1.7% (low Z) to 2.5% (high Z) of the total. If it is ignored and the first linesimplified with the definition of X0 given in Eq. (30.24), we have
dσ
dk=
A
X0NAk
(
43 − 4
3y + y2)
. (30.28)
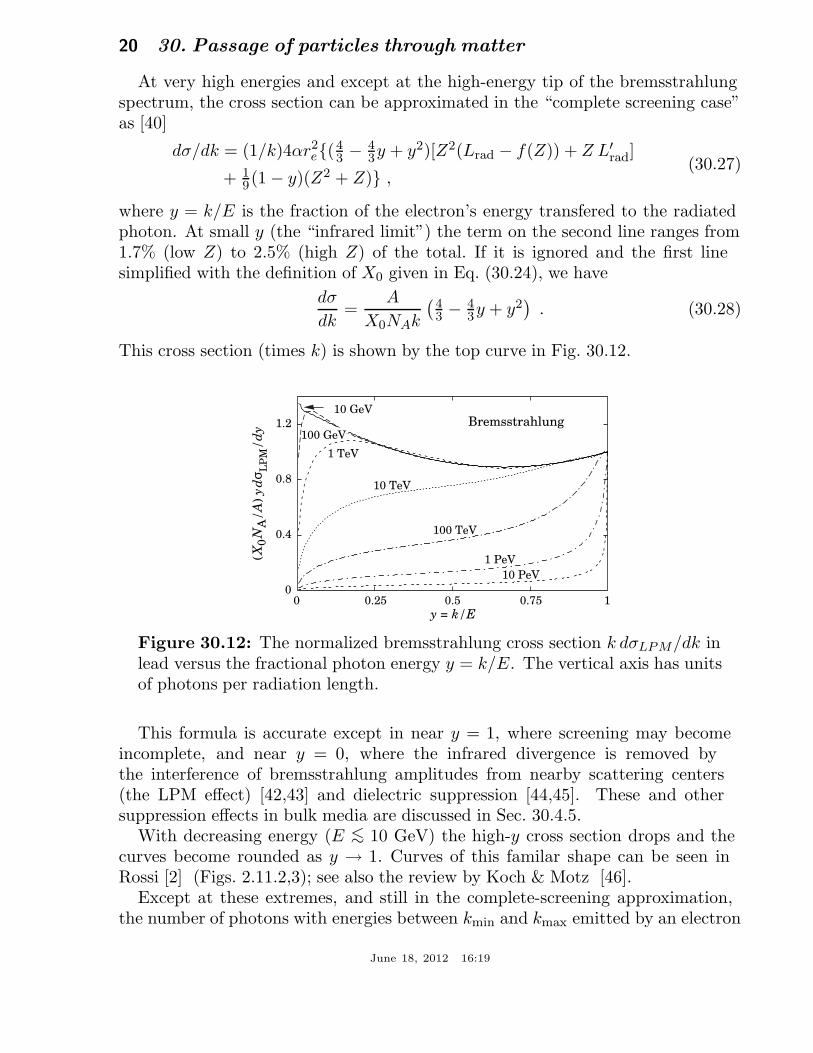
This cross section (times k) is shown by the top curve in Fig. 30.12.
0
0.4
0.8
1.2
0 0.25 0.5 0.75 1
y = k/E
Bremsstrahlung
(X0
NA
/A
) y
dσ L
PM
/d
y
10 GeV
1 TeV
10 TeV
100 TeV
1 PeV
10 PeV
100 GeV
Figure 30.12: The normalized bremsstrahlung cross section k dσLPM/dk inlead versus the fractional photon energy y = k/E. The vertical axis has unitsof photons per radiation length.
This formula is accurate except in near y = 1, where screening may becomeincomplete, and near y = 0, where the infrared divergence is removed bythe interference of bremsstrahlung amplitudes from nearby scattering centers(the LPM effect) [42,43] and dielectric suppression [44,45]. These and othersuppression effects in bulk media are discussed in Sec. 30.4.5.
With decreasing energy (E <∼ 10 GeV) the high-y cross section drops and thecurves become rounded as y → 1. Curves of this familar shape can be seen inRossi [2] (Figs. 2.11.2,3); see also the review by Koch & Motz [46].
Except at these extremes, and still in the complete-screening approximation,the number of photons with energies between kmin and kmax emitted by an electron
June 18, 2012 16:19
30. Passage of particles through matter 21
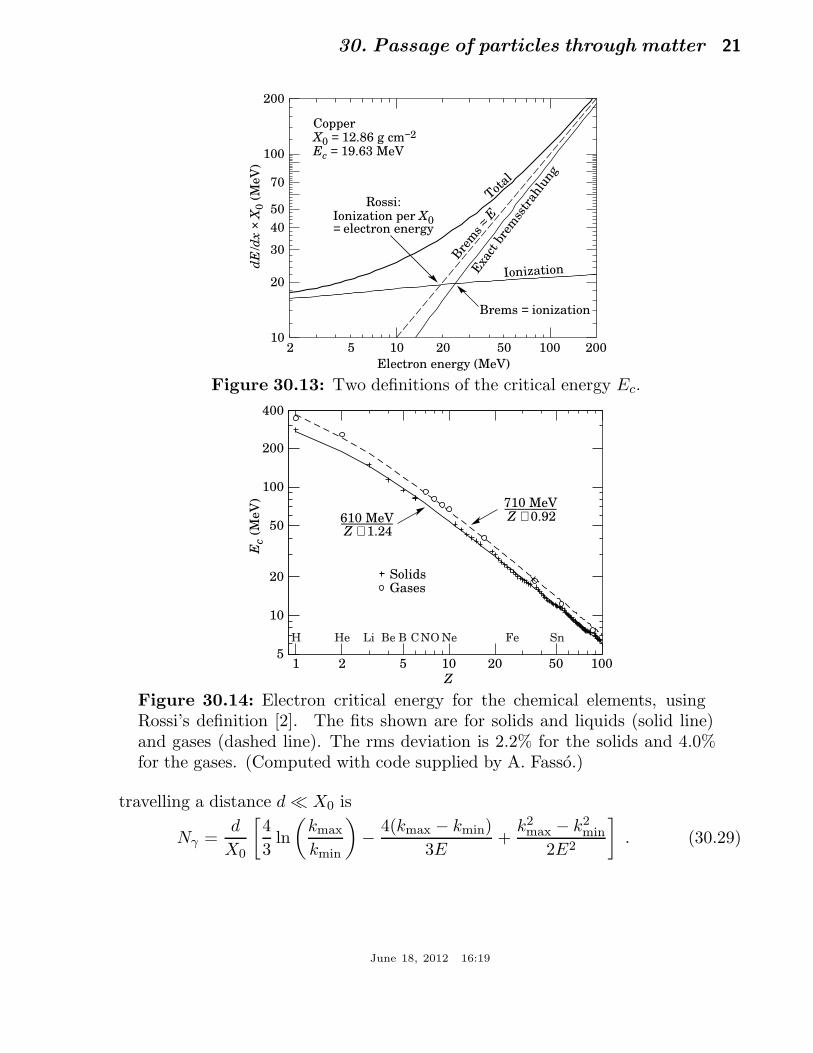
2 5 10 20 50 100 200
Copper X0 = 12.86 g cm−2
Ec = 19.63 MeV
dE
/dx ×
X0 (
MeV
)
Electron energy (MeV)
10
20
30
50
70
100
200
40
Brems = ionization
Ionization
Rossi: Ionization per X0 = electron energy
Total
Bre
ms
≈ EE
xact
brem
sstr
ahlu
ng
Figure 30.13: Two definitions of the critical energy Ec.
Ec
(MeV
)
Z
1 2 5 10 20 50 100 5
10
20
50
100
200
400
610 MeV________ Z + 1.24
710 MeV________ Z + 0.92
SolidsGases
H He Li Be B CNO Ne SnFe
Figure 30.14: Electron critical energy for the chemical elements, usingRossi’s definition [2]. The fits shown are for solids and liquids (solid line)and gases (dashed line). The rms deviation is 2.2% for the solids and 4.0%for the gases. (Computed with code supplied by A. Fasso.)
travelling a distance d ≪ X0 is
Nγ =d
X0
[
4
3ln
(
kmax
kmin
)
− 4(kmax − kmin)
3E+
k2max − k2
min
2E2
]
. (30.29)
June 18, 2012 16:19
22 30. Passage of particles through matter
30.4.3. Critical energy : An electron loses energy by bremsstrahlung at arate nearly proportional to its energy, while the ionization loss rate varies onlylogarithmically with the electron energy. The critical energy Ec is sometimesdefined as the energy at which the two loss rates are equal [47]. Amongalternate definitions is that of Rossi [2], who defines the critical energy asthe energy at which the ionization loss per radiation length is equal to theelectron energy. Equivalently, it is the same as the first definition with theapproximation |dE/dx|brems ≈ E/X0. This form has been found to describetransverse electromagnetic shower development more accurately (see below).These definitions are illustrated in the case of copper in Fig. 30.13.
The accuracy of approximate forms for Ec has been limited by the failureto distinguish between gases and solid or liquids, where there is a substantialdifference in ionization at the relevant energy because of the density effect. Wedistinguish these two cases in Fig. 30.14. Fits were also made with functions of theform a/(Z + b)α, but α was found to be essentially unity. Since Ec also dependson A, I, and other factors, such forms are at best approximate.
Values of Ec for both electrons and positrons in more than 300 materials can befound at pdg.lbl.gov/AtomicNuclearProperties.
30.4.4. Energy loss by photons : Contributions to the photon cross section in alight element (carbon) and a heavy element (lead) are shown in Fig. 30.15. Atlow energies it is seen that the photoelectric effect dominates, although Comptonscattering, Rayleigh scattering, and photonuclear absorption also contribute. Thephotoelectric cross section is characterized by discontinuities (absorption edges)as thresholds for photoionization of various atomic levels are reached. Photonattenuation lengths for a variety of elements are shown in Fig. 30.16, and data for30 eV< k <100 GeV for all elements is available from the web pages given in thecaption. Here k is the photon energy.
The increasing domination of pair production as the energy increases is shownin Fig. 30.17. Using approximations similar to those used to obtain Eq. (30.28),Tsai’s formula for the differential cross section [40] reduces to
dσ
dx=
A
X0NA
[
1 − 43x(1 − x)
]
(30.30)
in the complete-screening limit valid at high energies. Here x = E/k is thefractional energy transfer to the pair-produced electron (or positron), and k isthe incident photon energy. The cross section is very closely related to that forbremsstrahlung, since the Feynman diagrams are variants of one another. Thecross section is of necessity symmetric between x and 1 − x, as can be seen bythe solid curve in Fig. 30.18. See the review by Motz, Olsen, & Koch for a moredetailed treatment [50].
Eq. (30.30) may be integrated to find the high-energy limit for the total e+e−
June 18, 2012 16:19

30. Passage of particles through matter 23
Photon Energy
1 Mb
1 kb
1 b
10 mb10 eV 1 keV 1 MeV 1 GeV 100 GeV
(b) Lead (Z = 82)- experimental σtot
σp.e.
κe
Cro
ss s
ecti
on (
barn
s/at
om)
Cro
ss s
ecti
on (
barn
s/at
om)
10 mb
1 b
1 kb
1 Mb
(a) Carbon (Z = 6)
σRayleigh
σg.d.r.
σCompton
σCompton
σRayleigh
κnuc
κnuc
κe
σp.e.
- experimental σtot
Figure 30.15: Photon total cross sections as a function of energy in carbon andlead, showing the contributions of different processes [48]:
σp.e. = Atomic photoelectric effect (electron ejection, photon absorption)σRayleigh = Rayleigh (coherent) scattering–atom neither ionized nor excitedσCompton = Incoherent scattering (Compton scattering off an electron)
κnuc = Pair production, nuclear fieldκe = Pair production, electron field
σg.d.r. = Photonuclear interactions, most notably the Giant Dipole Reso-nance [49]. In these interactions, the target nucleus is broken up.
Original figures through the courtesy of John H. Hubbell (NIST).
June 18, 2012 16:19

24 30. Passage of particles through matter
Photon energy
100
10
10–4
10–5
10–6
1
0.1
0.01
0.001
10 eV 100 eV 1 keV 10 keV 100 keV 1 MeV 10 MeV 100 MeV 1 GeV 10 GeV 100 GeV
Abso
rpti
on
len
gth
λ (g
/cm
2)
Si
C
Fe Pb
H
Sn
Figure 30.16: The photon mass attenuation length (or mean free path) λ =1/(µ/ρ) for various elemental absorbers as a function of photon energy. Themass attenuation coefficient is µ/ρ, where ρ is the density. The intensity Iremaining after traversal of thickness t (in mass/unit area) is given by I = I0
exp(−t/λ). The accuracy is a few percent. For a chemical compound ormixture, 1/λeff ≈ ∑
elements wZ/λZ , where wZ is the proportion by weight ofthe element with atomic number Z. The processes responsible for attenuationare given in Fig. 30.11. Since coherent processes are included, not all theseprocesses result in energy deposition. The data for 30 eV < E < 1 keV areobtained from http://www-cxro.lbl.gov/optical constants (courtesy ofEric M. Gullikson, LBNL). The data for 1 keV < E < 100 GeV are fromhttp://physics.nist.gov/PhysRefData, through the courtesy of John H.Hubbell (NIST).
pair-production cross section:
σ = 79(A/X0NA) . (30.31)
Equation Eq. (30.31) is accurate to within a few percent down to energies as lowas 1 GeV, particularly for high-Z materials.
June 18, 2012 16:19
30. Passage of particles through matter 25
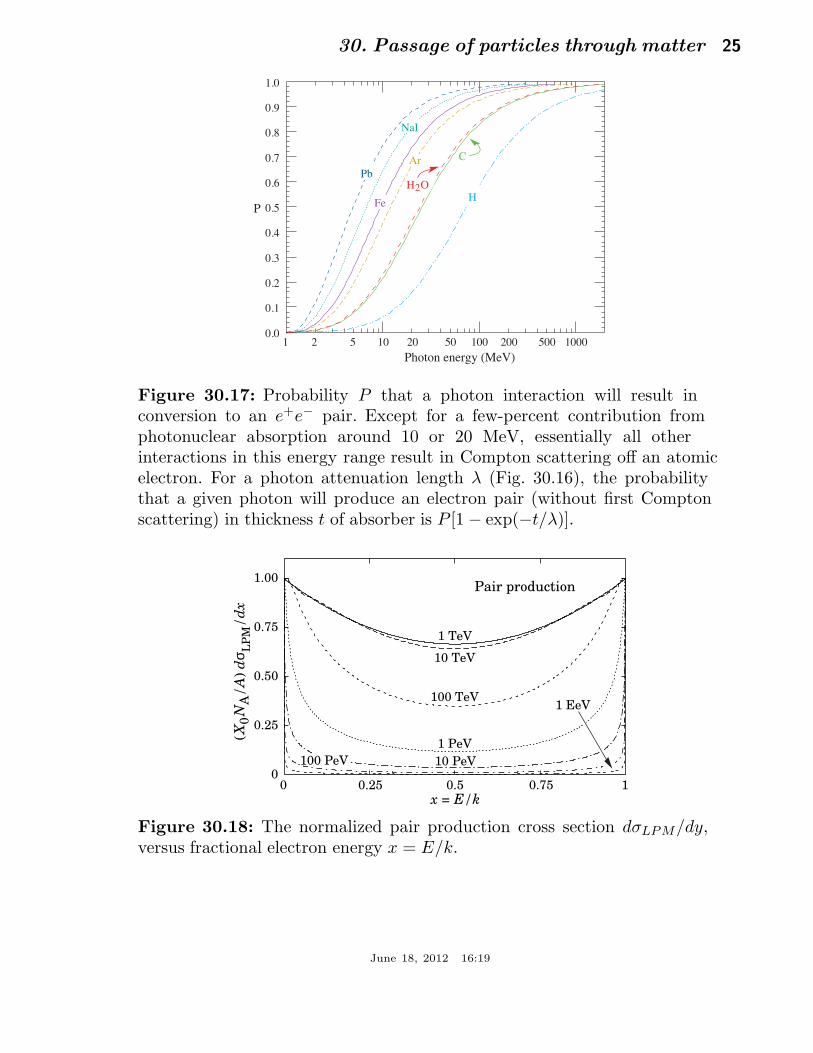
Figure 30.17: Probability P that a photon interaction will result inconversion to an e+e− pair. Except for a few-percent contribution fromphotonuclear absorption around 10 or 20 MeV, essentially all otherinteractions in this energy range result in Compton scattering off an atomicelectron. For a photon attenuation length λ (Fig. 30.16), the probabilitythat a given photon will produce an electron pair (without first Comptonscattering) in thickness t of absorber is P [1 − exp(−t/λ)].
0 0.25 0.5 0.75 10
0.25
0.50
0.75
1.00
x = E/k
Pair production
(X0
NA
/A
) d
σ LP
M/
dx
1 TeV
10 TeV
100 TeV
1 PeV
10 PeV
1 EeV
100 PeV
Figure 30.18: The normalized pair production cross section dσLPM/dy,versus fractional electron energy x = E/k.
June 18, 2012 16:19

26 30. Passage of particles through matter
30.4.5. Bremsstrahlung and pair production at very high energies : At ul-trahigh energies, Eqns. 30.27–30.31 will fail because of quantum mechanicalinterference between amplitudes from different scattering centers. Since thelongitudinal momentum transfer to a given center is small (∝ k/E(E − k), inthe case of bremsstrahlung), the interaction is spread over a comparatively longdistance called the formation length (∝ E(E − k)/k) via the uncertainty principle.In alternate language, the formation length is the distance over which the highlyrelativistic electron and the photon “split apart.” The interference is usuallydestructive. Calculations of the “Landau-Pomeranchuk-Migdal” (LPM) effectmay be made semi-classically based on the average multiple scattering, or morerigorously using a quantum transport approach [42,43].
In amorphous media, bremsstrahlung is suppressed if the photon energy k is lessthan E2/(E + ELPM) [43], where*
ELPM =(mec
2)2αX0
4π~cρ= (7.7 TeV/cm) × X0
ρ. (30.32)
Since physical distances are involved, X0/ρ, in cm, appears. The energy-weightedbremsstrahlung spectrum for lead, k dσLPM/dk, is shown in Fig. 30.12. Withappropriate scaling by X0/ρ, other materials behave similarly.
For photons, pair production is reduced for E(k − E) > k ELPM . Thepair-production cross sections for different photon energies are shown in Fig. 30.18.
If k ≪ E, several additional mechanisms can also produce suppression. Whenthe formation length is long, even weak factors can perturb the interaction. Forexample, the emitted photon can coherently forward scatter off of the electrons inthe media. Because of this, for k < ωpE/me ∼ 10−4, bremsstrahlung is suppressedby a factor (kme/ωpE)2 [45]. Magnetic fields can also suppress bremsstrahlung.
In crystalline media, the situation is more complicated, with coherentenhancement or suppression possible. The cross section depends on the electronand photon energies and the angles between the particle direction and thecrystalline axes [52].
30.4.6. Photonuclear and electronuclear interactions at still higher energies
: At still higher photon and electron energies, where the bremsstrahlung and pairproduction cross-sections are heavily suppressed by the LPM effect, photonuclearand electronuclear interactions predominate over electromagnetic interactions.
At photon energies above about 1020 eV, for example, photons usually interacthadronically. The exact cross-over energy depends on the model used for thephotonuclear interactions. At still higher energies (>∼ 1023 eV), photonuclearinteractions can become coherent, with the photon interaction spread over multiple
* This definition differs from that of Ref. 51 by a factor of two. ELPM scalesas the 4th power of the mass of the incident particle, so that ELPM = (1.4 ×10¹⁰ TeV/cm) × X0/ρ for a muon.
June 18, 2012 16:19
30. Passage of particles through matter 27
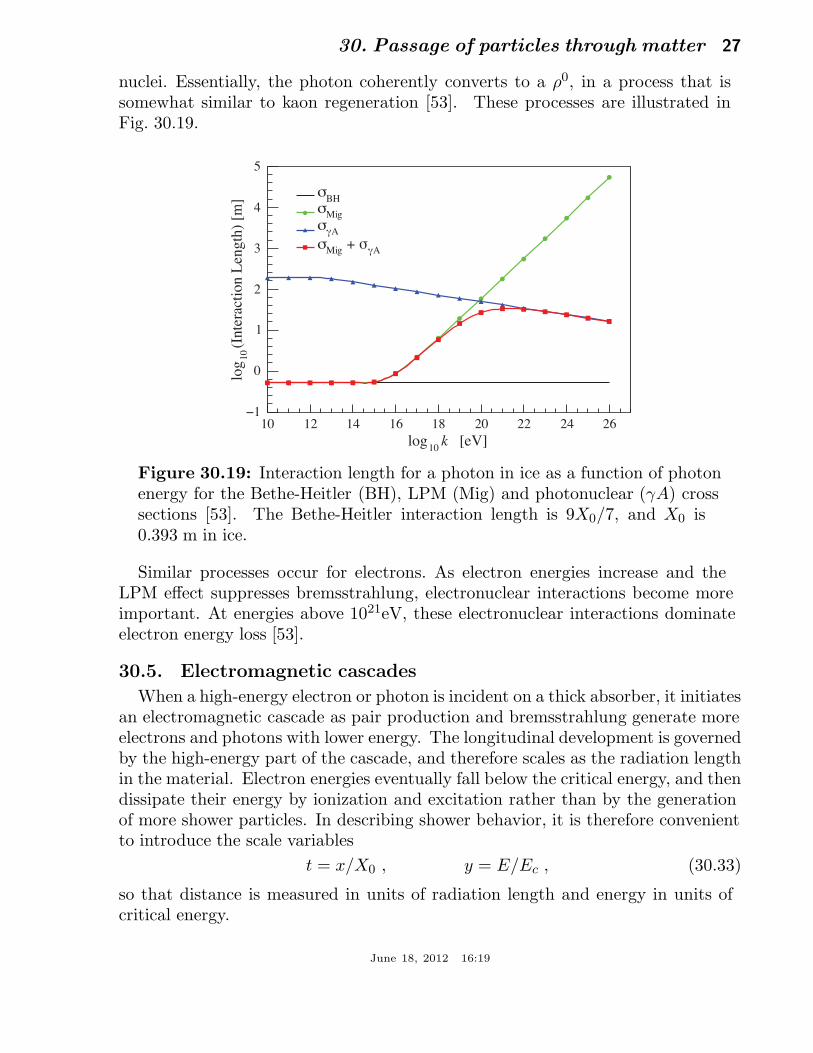
nuclei. Essentially, the photon coherently converts to a ρ0, in a process that issomewhat similar to kaon regeneration [53]. These processes are illustrated inFig. 30.19.
k [eV]10
log10 12 14 16 18 20 22 24 26
(In
tera
ctio
n L
ength
) [m
]1
0lo
g
−1
0
1
2
3
4
5
BHσ
Migσ
Aγσ
Aγσ +
Migσ
Figure 30.19: Interaction length for a photon in ice as a function of photonenergy for the Bethe-Heitler (BH), LPM (Mig) and photonuclear (γA) crosssections [53]. The Bethe-Heitler interaction length is 9X0/7, and X0 is0.393 m in ice.
Similar processes occur for electrons. As electron energies increase and theLPM effect suppresses bremsstrahlung, electronuclear interactions become moreimportant. At energies above 1021eV, these electronuclear interactions dominateelectron energy loss [53].
30.5. Electromagnetic cascades
When a high-energy electron or photon is incident on a thick absorber, it initiatesan electromagnetic cascade as pair production and bremsstrahlung generate moreelectrons and photons with lower energy. The longitudinal development is governedby the high-energy part of the cascade, and therefore scales as the radiation lengthin the material. Electron energies eventually fall below the critical energy, and thendissipate their energy by ionization and excitation rather than by the generationof more shower particles. In describing shower behavior, it is therefore convenientto introduce the scale variables
t = x/X0 , y = E/Ec , (30.33)
so that distance is measured in units of radiation length and energy in units ofcritical energy.
June 18, 2012 16:19
28 30. Passage of particles through matter
0.000
0.025
0.050
0.075
0.100
0.125
0
20
40
60
80
100
(1/
E0)d
E/
dt
t = depth in radiation lengths
Nu
mber
cross
ing p
lan
e
30 GeV electron incident on iron
Energy
Photons × 1/6.8
Electrons
0 5 10 15 20
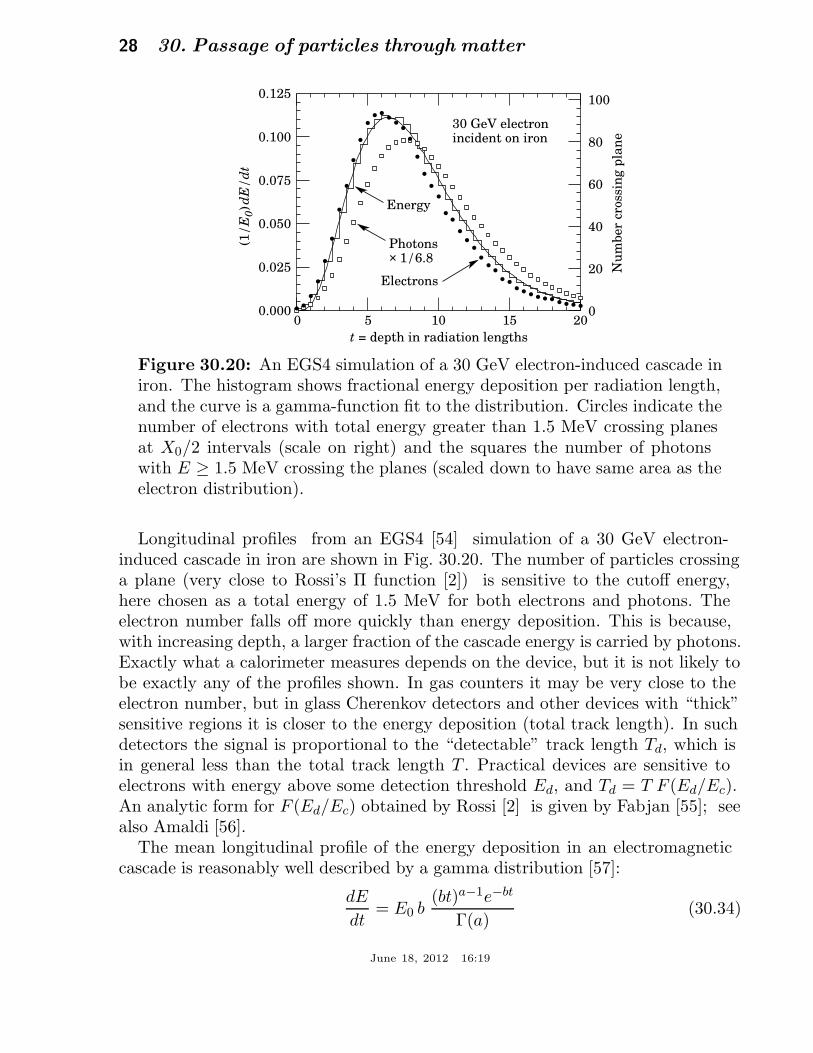
Figure 30.20: An EGS4 simulation of a 30 GeV electron-induced cascade iniron. The histogram shows fractional energy deposition per radiation length,and the curve is a gamma-function fit to the distribution. Circles indicate thenumber of electrons with total energy greater than 1.5 MeV crossing planesat X0/2 intervals (scale on right) and the squares the number of photonswith E ≥ 1.5 MeV crossing the planes (scaled down to have same area as theelectron distribution).
Longitudinal profiles from an EGS4 [54] simulation of a 30 GeV electron-induced cascade in iron are shown in Fig. 30.20. The number of particles crossinga plane (very close to Rossi’s Π function [2]) is sensitive to the cutoff energy,here chosen as a total energy of 1.5 MeV for both electrons and photons. Theelectron number falls off more quickly than energy deposition. This is because,with increasing depth, a larger fraction of the cascade energy is carried by photons.Exactly what a calorimeter measures depends on the device, but it is not likely tobe exactly any of the profiles shown. In gas counters it may be very close to theelectron number, but in glass Cherenkov detectors and other devices with “thick”sensitive regions it is closer to the energy deposition (total track length). In suchdetectors the signal is proportional to the “detectable” track length Td, which isin general less than the total track length T . Practical devices are sensitive toelectrons with energy above some detection threshold Ed, and Td = T F (Ed/Ec).An analytic form for F (Ed/Ec) obtained by Rossi [2] is given by Fabjan [55]; seealso Amaldi [56].
The mean longitudinal profile of the energy deposition in an electromagneticcascade is reasonably well described by a gamma distribution [57]:
dE
dt= E0 b
(bt)a−1e−bt
Γ(a)(30.34)
June 18, 2012 16:19
30. Passage of particles through matter 29
The maximum tmax occurs at (a − 1)/b. We have made fits to shower profiles inelements ranging from carbon to uranium, at energies from 1 GeV to 100 GeV.The energy deposition profiles are well described by Eq. (30.34) with
tmax = (a − 1)/b = 1.0 × (ln y + Cj) , j = e, γ , (30.35)
where Ce = −0.5 for electron-induced cascades and Cγ = +0.5 for photon-inducedcascades. To use Eq. (30.34), one finds (a− 1)/b from Eq. (30.35) and Eq. (30.33),then finds a either by assuming b ≈ 0.5 or by finding a more accurate valuefrom Fig. 30.21. The results are very similar for the electron number profiles, butthere is some dependence on the atomic number of the medium. A similar formfor the electron number maximum was obtained by Rossi in the context of his“Approximation B,” [2] (see Fabjan’s review in Ref. 55), but with Ce = −1.0 andCγ = −0.5; we regard this as superseded by the EGS4 result.
Carbon
Aluminum
Iron
Uranium
0.3
0.4
0.5
0.6
0.7
0.8
10 100 1000 10 000
b
y = E/Ec
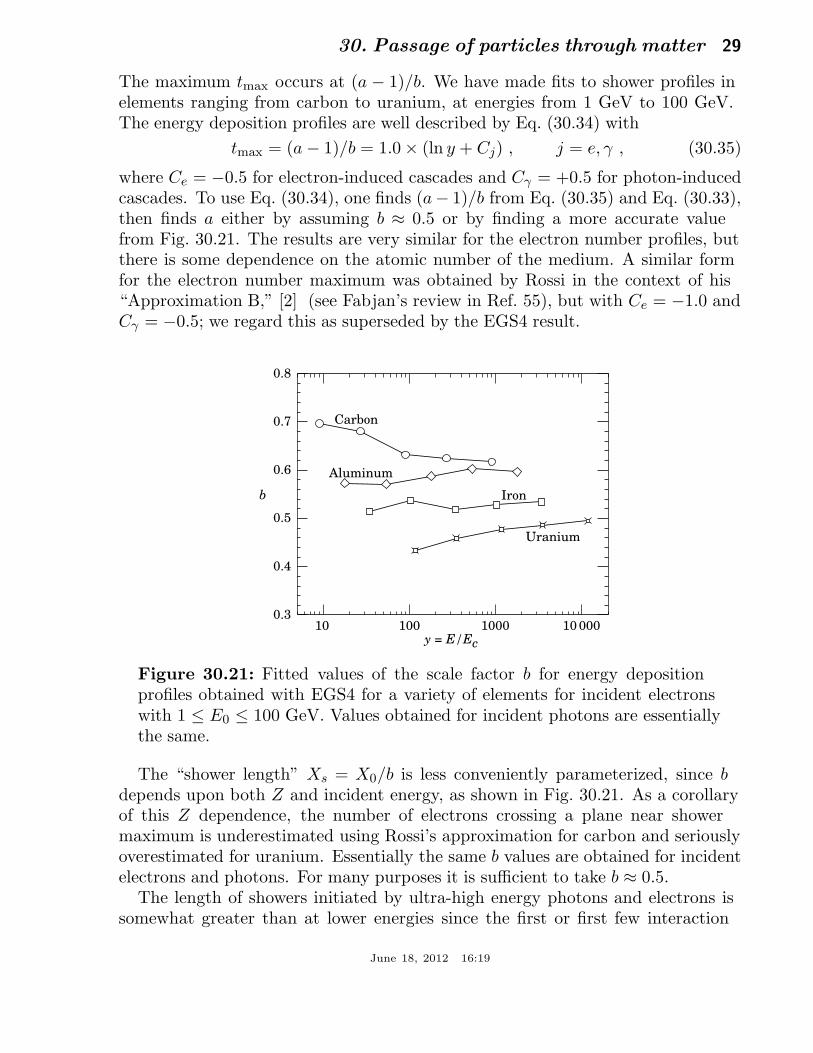
Figure 30.21: Fitted values of the scale factor b for energy depositionprofiles obtained with EGS4 for a variety of elements for incident electronswith 1 ≤ E0 ≤ 100 GeV. Values obtained for incident photons are essentiallythe same.
The “shower length” Xs = X0/b is less conveniently parameterized, since bdepends upon both Z and incident energy, as shown in Fig. 30.21. As a corollaryof this Z dependence, the number of electrons crossing a plane near showermaximum is underestimated using Rossi’s approximation for carbon and seriouslyoverestimated for uranium. Essentially the same b values are obtained for incidentelectrons and photons. For many purposes it is sufficient to take b ≈ 0.5.
The length of showers initiated by ultra-high energy photons and electrons issomewhat greater than at lower energies since the first or first few interaction
June 18, 2012 16:19
30 30. Passage of particles through matter
lengths are increased via the mechanisms discussed above.The gamma function distribution is very flat near the origin, while the EGS4
cascade (or a real cascade) increases more rapidly. As a result Eq. (30.34) failsbadly for about the first two radiation lengths; it was necessary to exclude thisregion in making fits.
Because fluctuations are important, Eq. (30.34) should be used only inapplications where average behavior is adequate. Grindhammer et al. havedeveloped fast simulation algorithms in which the variance and correlation ofa and b are obtained by fitting Eq. (30.34) to individually simulated cascades,then generating profiles for cascades using a and b chosen from the correlateddistributions [58].
The transverse development of electromagnetic showers in different materialsscales fairly accurately with the Moliere radius RM , given by [59,60]
RM = X0 Es/Ec , (30.36)
where Es ≈ 21 MeV (Table 30.1), and the Rossi definition of Ec is used.In a material containing a weight fraction wj of the element with critical energy
Ecj and radiation length Xj , the Moliere radius is given by
1
RM=
1
Es
∑ wj Ecj
Xj. (30.37)
Measurements of the lateral distribution in electromagnetic cascades are shownin Refs. 59 and 60. On the average, only 10% of the energy lies outside thecylinder with radius RM . About 99% is contained inside of 3.5RM , but at thisradius and beyond composition effects become important and the scaling with RM
fails. The distributions are characterized by a narrow core, and broaden as theshower develops. They are often represented as the sum of two Gaussians, andGrindhammer [58] describes them with the function
f(r) =2r R2
(r2 + R2)2, (30.38)
where R is a phenomenological function of x/X0 and ln E.At high enough energies, the LPM effect (Sec. 30.4.5) reduces the cross sections
for bremsstrahlung and pair production, and hence can cause significant elongationof electromagnetic cascades [43].
June 18, 2012 16:19
30. Passage of particles through matter 31
30.6. Muon energy loss at high energy
At sufficiently high energies, radiative processes become more important thanionization for all charged particles. For muons and pions in materials such as iron,this “critical energy” occurs at several hundred GeV. (There is no simple scalingwith particle mass, but for protons the “critical energy” is much, much higher.)Radiative effects dominate the energy loss of energetic muons found in cosmicrays or produced at the newest accelerators. These processes are characterized bysmall cross sections, hard spectra, large energy fluctuations, and the associatedgeneration of electromagnetic and (in the case of photonuclear interactions)hadronic showers [61–69]. As a consequence, at these energies the treatment ofenergy loss as a uniform and continuous process is for many purposes inadequate.
It is convenient to write the average rate of muon energy loss as [70]
−dE/dx = a(E) + b(E)E . (30.39)
Here a(E) is the ionization energy loss given by Eq. (30.4), and b(E) is the sumof e+e− pair production, bremsstrahlung, and photonuclear contributions. To theapproximation that these slowly-varying functions are constant, the mean rangex0 of a muon with initial energy E0 is given by
x0 ≈ (1/b) ln(1 + E0/Eµc) , (30.40)
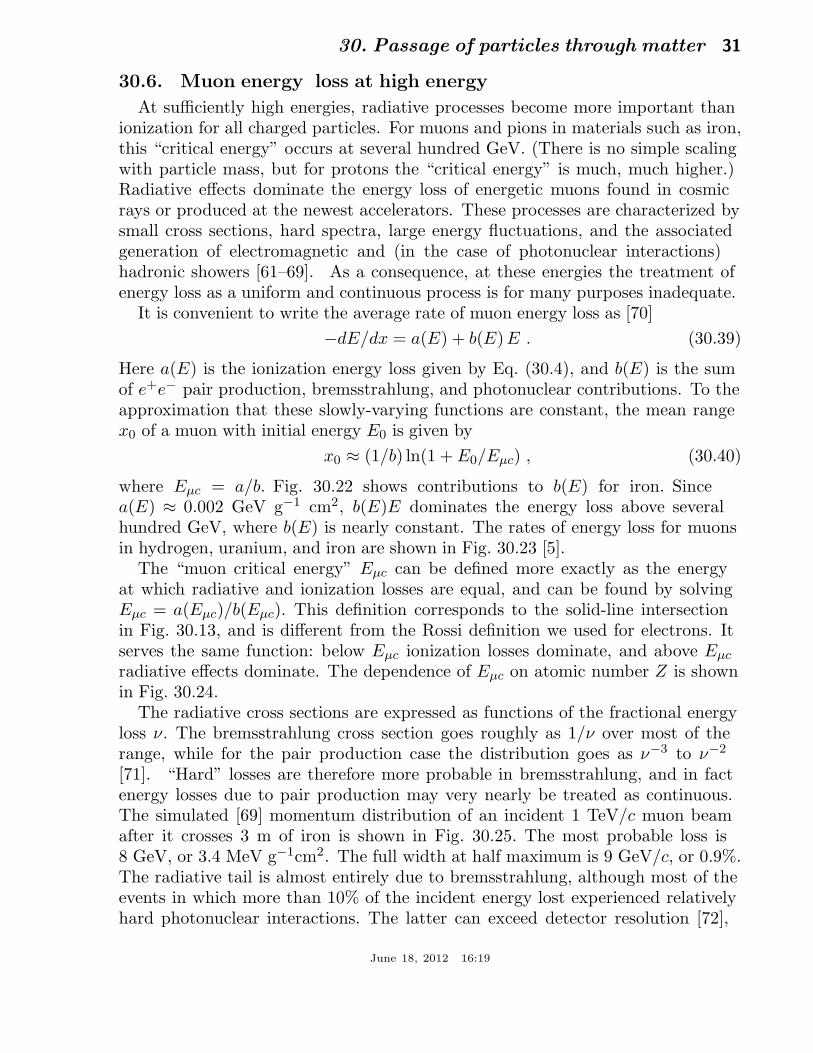
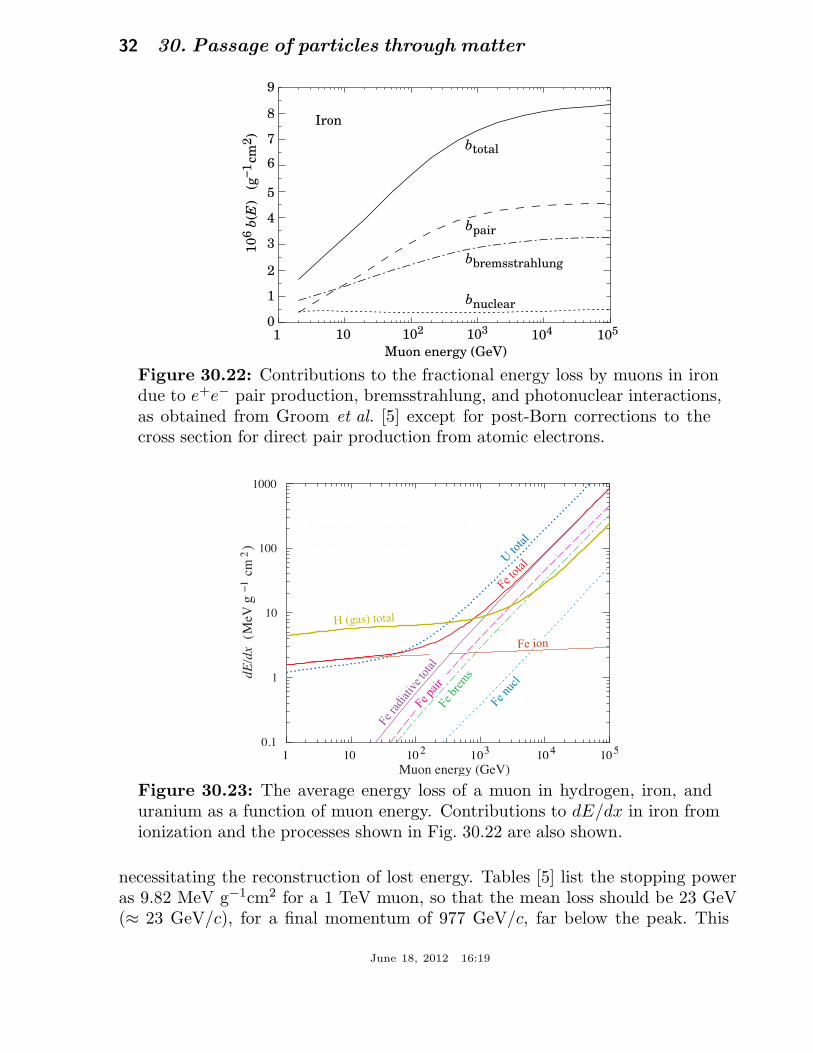
where Eµc = a/b. Fig. 30.22 shows contributions to b(E) for iron. Sincea(E) ≈ 0.002 GeV g−1 cm2, b(E)E dominates the energy loss above severalhundred GeV, where b(E) is nearly constant. The rates of energy loss for muonsin hydrogen, uranium, and iron are shown in Fig. 30.23 [5].
The “muon critical energy” Eµc can be defined more exactly as the energyat which radiative and ionization losses are equal, and can be found by solvingEµc = a(Eµc)/b(Eµc). This definition corresponds to the solid-line intersectionin Fig. 30.13, and is different from the Rossi definition we used for electrons. Itserves the same function: below Eµc ionization losses dominate, and above Eµc
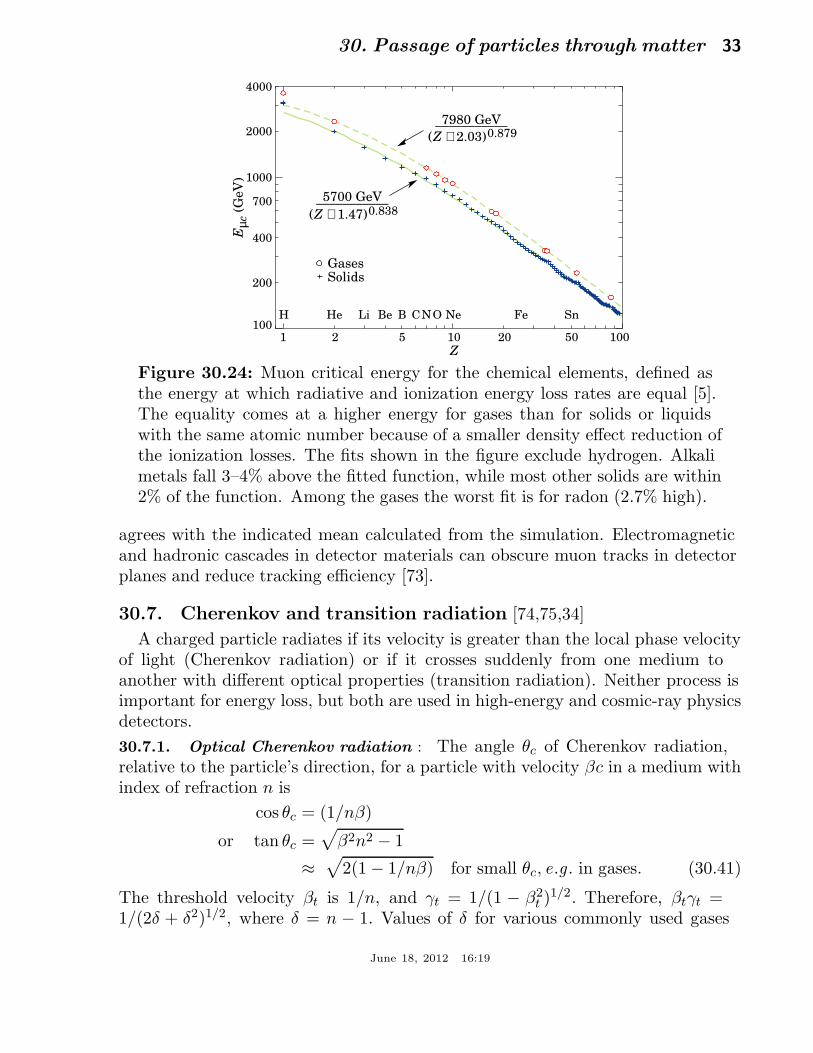
radiative effects dominate. The dependence of Eµc on atomic number Z is shownin Fig. 30.24.
The radiative cross sections are expressed as functions of the fractional energyloss ν. The bremsstrahlung cross section goes roughly as 1/ν over most of therange, while for the pair production case the distribution goes as ν−3 to ν−2
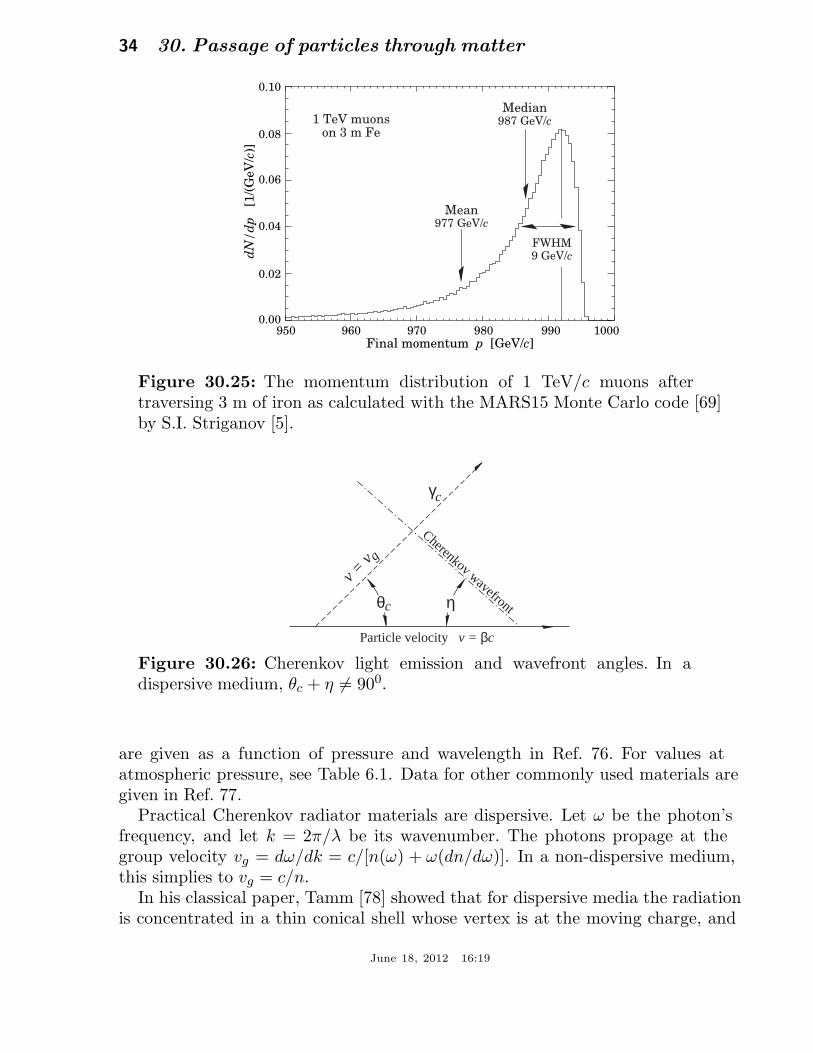
[71]. “Hard” losses are therefore more probable in bremsstrahlung, and in factenergy losses due to pair production may very nearly be treated as continuous.The simulated [69] momentum distribution of an incident 1 TeV/c muon beamafter it crosses 3 m of iron is shown in Fig. 30.25. The most probable loss is8 GeV, or 3.4 MeV g−1cm2. The full width at half maximum is 9 GeV/c, or 0.9%.The radiative tail is almost entirely due to bremsstrahlung, although most of theevents in which more than 10% of the incident energy lost experienced relativelyhard photonuclear interactions. The latter can exceed detector resolution [72],
June 18, 2012 16:19
32 30. Passage of particles through matter
Muon energy (GeV)
0
1
2
3
4
5
6
7
8
9
10
6 b
(E)
(g
−1cm
2)
Iron
btotal
bpair
bbremsstrahlung
bnuclear
102101 103 104 105
Figure 30.22: Contributions to the fractional energy loss by muons in irondue to e+e− pair production, bremsstrahlung, and photonuclear interactions,as obtained from Groom et al. [5] except for post-Born corrections to thecross section for direct pair production from atomic electrons.
Figure 30.23: The average energy loss of a muon in hydrogen, iron, anduranium as a function of muon energy. Contributions to dE/dx in iron fromionization and the processes shown in Fig. 30.22 are also shown.
necessitating the reconstruction of lost energy. Tables [5] list the stopping poweras 9.82 MeV g−1cm2 for a 1 TeV muon, so that the mean loss should be 23 GeV(≈ 23 GeV/c), for a final momentum of 977 GeV/c, far below the peak. This
June 18, 2012 16:19
30. Passage of particles through matter 33
___________
(Z + 2.03)0.879
___________
(Z + 1.47)0.838
100
200
400
700
1000
2000
4000
Eµc
(G
eV
)
1 2 5 10 20 50 100
Z
7980 GeV
5700 GeV
H He Li Be B CNO Ne SnFe
SolidsGases
Figure 30.24: Muon critical energy for the chemical elements, defined asthe energy at which radiative and ionization energy loss rates are equal [5].The equality comes at a higher energy for gases than for solids or liquidswith the same atomic number because of a smaller density effect reduction ofthe ionization losses. The fits shown in the figure exclude hydrogen. Alkalimetals fall 3–4% above the fitted function, while most other solids are within2% of the function. Among the gases the worst fit is for radon (2.7% high).
agrees with the indicated mean calculated from the simulation. Electromagneticand hadronic cascades in detector materials can obscure muon tracks in detectorplanes and reduce tracking efficiency [73].
30.7. Cherenkov and transition radiation [74,75,34]
A charged particle radiates if its velocity is greater than the local phase velocityof light (Cherenkov radiation) or if it crosses suddenly from one medium toanother with different optical properties (transition radiation). Neither process isimportant for energy loss, but both are used in high-energy and cosmic-ray physicsdetectors.
30.7.1. Optical Cherenkov radiation : The angle θc of Cherenkov radiation,relative to the particle’s direction, for a particle with velocity βc in a medium withindex of refraction n is
cos θc = (1/nβ)
or tan θc =√
β2n2 − 1
≈√
2(1 − 1/nβ) for small θc, e.g . in gases. (30.41)
The threshold velocity βt is 1/n, and γt = 1/(1 − β2t )1/2. Therefore, βtγt =
1/(2δ + δ2)1/2, where δ = n − 1. Values of δ for various commonly used gases
June 18, 2012 16:19
34 30. Passage of particles through matter
950 960 970 980 990 1000Final momentum p [GeV/c]
0.00
0.02
0.04
0.06
0.08
0.10
1 TeV muons on 3 m Fe
Mean 977 GeV/c
Median 987 GeV/c
dN
/d
p [
1/(
GeV
/c)]
FWHM 9 GeV/c
Figure 30.25: The momentum distribution of 1 TeV/c muons aftertraversing 3 m of iron as calculated with the MARS15 Monte Carlo code [69]by S.I. Striganov [5].
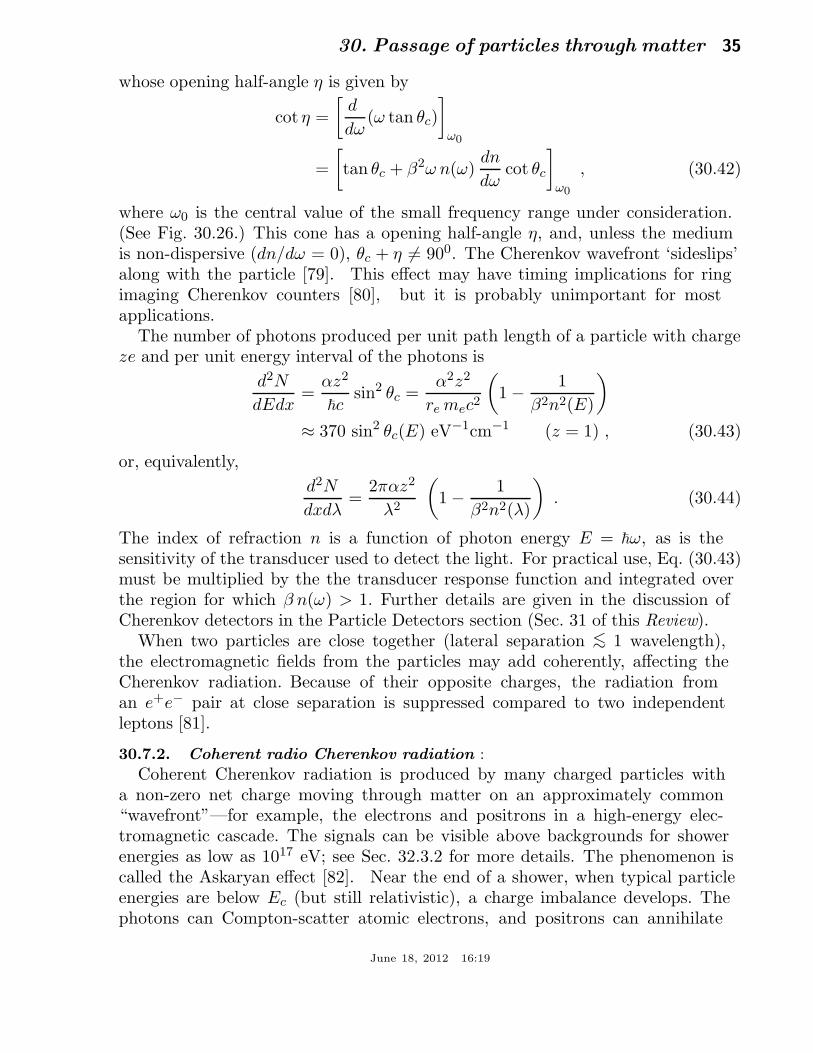
θc
γc
η
Cherenkov wavefront
Particle velocity v = βc
v = v g
Figure 30.26: Cherenkov light emission and wavefront angles. In adispersive medium, θc + η 6= 900.
are given as a function of pressure and wavelength in Ref. 76. For values atatmospheric pressure, see Table 6.1. Data for other commonly used materials aregiven in Ref. 77.
Practical Cherenkov radiator materials are dispersive. Let ω be the photon’sfrequency, and let k = 2π/λ be its wavenumber. The photons propage at thegroup velocity vg = dω/dk = c/[n(ω) + ω(dn/dω)]. In a non-dispersive medium,this simplies to vg = c/n.
In his classical paper, Tamm [78] showed that for dispersive media the radiationis concentrated in a thin conical shell whose vertex is at the moving charge, and
June 18, 2012 16:19
30. Passage of particles through matter 35
whose opening half-angle η is given by
cot η =
[
d
dω(ω tan θc)
]
ω0
=
[
tan θc + β2ω n(ω)dn
dωcot θc
]
ω0
, (30.42)
where ω0 is the central value of the small frequency range under consideration.(See Fig. 30.26.) This cone has a opening half-angle η, and, unless the mediumis non-dispersive (dn/dω = 0), θc + η 6= 900. The Cherenkov wavefront ‘sideslips’along with the particle [79]. This effect may have timing implications for ringimaging Cherenkov counters [80], but it is probably unimportant for mostapplications.
The number of photons produced per unit path length of a particle with chargeze and per unit energy interval of the photons is
d2N
dEdx=
αz2
~csin2 θc =
α2z2
re mec2
(
1 − 1
β2n2(E)
)
≈ 370 sin2 θc(E) eV−1cm−1 (z = 1) , (30.43)
or, equivalently,
d2N
dxdλ=
2παz2
λ2
(
1 − 1
β2n2(λ)
)
. (30.44)
The index of refraction n is a function of photon energy E = ~ω, as is thesensitivity of the transducer used to detect the light. For practical use, Eq. (30.43)must be multiplied by the the transducer response function and integrated overthe region for which β n(ω) > 1. Further details are given in the discussion ofCherenkov detectors in the Particle Detectors section (Sec. 31 of this Review).
When two particles are close together (lateral separation <∼ 1 wavelength),the electromagnetic fields from the particles may add coherently, affecting theCherenkov radiation. Because of their opposite charges, the radiation froman e+e− pair at close separation is suppressed compared to two independentleptons [81].
30.7.2. Coherent radio Cherenkov radiation :
Coherent Cherenkov radiation is produced by many charged particles witha non-zero net charge moving through matter on an approximately common“wavefront”—for example, the electrons and positrons in a high-energy elec-tromagnetic cascade. The signals can be visible above backgrounds for showerenergies as low as 1017 eV; see Sec. 32.3.2 for more details. The phenomenon iscalled the Askaryan effect [82]. Near the end of a shower, when typical particleenergies are below Ec (but still relativistic), a charge imbalance develops. Thephotons can Compton-scatter atomic electrons, and positrons can annihilate
June 18, 2012 16:19

36 30. Passage of particles through matter
with atomic electrons to contribute even more photons which can in turnCompton scatter. These processes result in a roughly 20% excess of electronsover positrons in a shower. The net negative charge leads to coherent radioCherenkov emission. The radiation includes a component from the decelleratingcharges (as in bremsstrahlung). Because the emission is coherent, the electric fieldstrength is proportional to the shower energy, and the signal power increases asits square. The electric field strength also increases linearly with frequency, upto a maximum frequency determined by the lateral spread of the shower. Thiscutoff occurs at about 1 GHz in ice, and scales inversely with the Moliere radius.At low frequencies, the radiation is roughly isotropic, but, as the frequency risestoward the cutoff frequency, the radiation becomes increasingly peaked around theCherenkov angle. The radiation is linearly polarized in the plane containing theshower axis and the photon direction. A measurement of the signal polarizationcan be used to help determine the shower direction. The characteristics of thisradiation have been nicely demonstrated in a series of experiments at SLAC [83].A detailed discussion of the radiation can be found in Ref. 84.
30.7.3. Transition radiation : The energy radiated when a particle with chargeze crosses the boundary between vacuum and a medium with plasma frequency ωp
isI = αz2γ~ωp/3 , (30.45)
where
~ωp =√
4πNer3e mec
2/α =√
ρ (in g/cm3) 〈Z/A〉 × 28.81 eV . (30.46)
For styrene and similar materials, ~ωp ≈ 20 eV; for air it is 0.7 eV.The number spectrum dNγ/d(~ω diverges logarithmically at low energies and
decreases rapidly for ~ω/γ~ωp > 1. About half the energy is emitted in the range0.1 ≤ ~ω/γ~ωp ≤ 1. Inevitable absorption in a practical detector removes thedivergence. For a particle with γ = 103, the radiated photons are in the soft x-rayrange 2 to 40 keV. The γ dependence of the emitted energy thus comes from thehardening of the spectrum rather than from an increased quantum yield.
The number of photons with energy ~ω > ~ω0 is given by the answer to problem13.15 in Ref. 34,
Nγ(~ω > ~ω0) =αz2
π
[
(
lnγ~ωp
~ω0− 1
)2
+π2
12
]
, (30.47)
within corrections of order (~ω0/γ~ωp)2. The number of photons above a fixed
energy ~ω0 ≪ γ~ωp thus grows as (ln γ)2, but the number above a fixed fractionof γ~ωp (as in the example above) is constant. For example, for ~ω > γ~ωp/10,Nγ = 2.519 αz2/π = 0.59% × z2.
The particle stays “in phase” with the x ray over a distance called theformation length, d(ω). Most of the radiation is produced in a distance
June 18, 2012 16:19

30. Passage of particles through matter 37
10−3
10−2
10−4
10−5101 100 1000
25 µm Mylar/1.5 mm airγ = 2 ×10⁴
Without absorption
With absorption
200 foils
Single interface
x-ray energy ω (keV)
dS/d
( ω
), d
iffe
rent
ial y
ield
per
inte
rfac
e (k
eV/k
eV)
Figure 30.27: X-ray photon energy spectra for a radiator consisting of 20025µm thick foils of Mylar with 1.5 mm spacing in air (solid lines) and for asingle surface (dashed line). Curves are shown with and without absorption.Adapted from Ref. 85.
d(ω) = (2c/ω)(1/γ2 + θ2 + ω2p/ω2)−1. Here θ is the x-ray emission angle,
characteristically 1/γ. For θ = 1/γ the formation length has a maximum atd(γωp/
√2) = γc/
√2 ωp. In practical situations it is tens of µm.
Since the useful x-ray yield from a single interface is low, in practical detectorsit is enhanced by using a stack of N foil radiators—foils L thick, where L istypically several formation lengths—separated by gas-filled gaps. The amplitudesat successive interfaces interfere to cause oscillations about the single-interfacespectrum. At increasing frequencies above the position of the last interferencemaximum (L/d(w) = π/2), the formation zones, which have opposite phase,overlap more and more and the spectrum saturates, dI/dω approaching zero asL/d(ω) → 0. This is illustrated in Fig. 30.27 for a realistic detector configuration.
For regular spacing of the layers fairly complicated analytic solutions for theintensity have been obtained [85]. (See also Ref. 86 and references therein.)Although one might expect the intensity of coherent radiation from the stack offoils to be proportional to N2, the angular dependence of the formation length
June 18, 2012 16:19
38 30. Passage of particles through matter
conspires to make the intensity ∝ N .
References:
1. H. Bichsel, Nucl. Instrum. Methods A562, 154 (2006).2. B. Rossi, High Energy Particles, Prentice-Hall, Inc., Englewood Cliffs, NJ,
1952.3. H.A. Bethe, Zur Theorie des Durchgangs schneller Korpuskularstrahlen durch
Materie, H. Bethe, Ann. Phys. 5, 325 (1930).4. “Stopping Powers and Ranges for Protons and Alpha Particles,” ICRU
Report No. 49 (1993);Tables and graphs of these data are available athttp://physics.nist.gov/PhysRefData/.
5. D.E. Groom, N.V. Mokhov, and S.I. Striganov, “Muon stopping-power andrange tables: 10 MeV–100 TeV,” Atomic Data and Nuclear Data Tables 78,183–356 (2001). Since submission of this paper it has become likely thatpost-Born corrections to the direct pair production cross section should bemade. Code used to make Figs. 30.22–30.24 included these corrections [D.Yu.Ivanov et al., Phys. Lett. B442, 453 (1998)]. The effect is negligible exceptat high Z. (It is less than 1% for iron.);More extensive printable and machine-readable tables are given athttp://pdg.lbl.gov/AtomicNuclearProperties/.
6. W.H. Barkas, W. Birnbaum, and F.M. Smith, Phys. Rev. 101, 778 (1956).7. J. Lindhard and A. H. Sorensen, Phys. Rev. A53, 2443 (1996).8. U. Fano, Ann. Rev. Nucl. Sci. 13, 1 (1963).9. J.D. Jackson, Phys. Rev. D59, 017301 (1999).
10. S.M. Seltzer and M.J. Berger, Int. J. of Applied Rad. 33, 1189 (1982).11. “Stopping Powers for Electrons and Positrons,” ICRU Report No. 37 (1984).12. http://physics.nist.gov/PhysRefData/XrayMassCoef/tab1.html.13. H. Bichsel, Phys. Rev. A46, 5761 (1992).14. W.H. Barkas and M.J. Berger, Tables of Energy Losses and Ranges of Heavy
Charged Particles, NASA-SP-3013 (1964).15. S.P. Møller et al., Phys. Rev. A56, 2930 (1997).16. H.H. Andersen and J.F. Ziegler, Hydrogen: Stopping Powers and Ranges in
All Elements. Vol. 3 of The Stopping and Ranges of Ions in Matter (PergamonPress 1977).
17. J. Lindhard, Kgl. Danske Videnskab. Selskab, Mat.-Fys. Medd. 28, No. 8(1954);J. Lindhard, M. Scharff, and H.E. Schiøtt, Kgl. Danske Videnskab. Selskab,Mat.-Fys. Medd. 33, No. 14 (1963).
18. J.F. Ziegler, J.F. Biersac, and U. Littmark, The Stopping and Range of Ionsin Solids, Pergamon Press 1985.
19. R.M. Sternheimer, Phys. Rev. 88, 851 (1952).
June 18, 2012 16:19
30. Passage of particles through matter 39
20. A. Crispin and G.N. Fowler, Rev. Mod. Phys. 42, 290 (1970).21. R.M. Sternheimer, S.M. Seltzer, and M.J. Berger, “The Density Effect for
the Ionization Loss of Charged Particles in Various Substances,” AtomicData and Nuclear Data Tables 30, 261 (1984). Minor errors are corrected inRef. 5. Chemical composition for the tabulated materials is given in Ref. 10.
22. R.M. Sternheimer and R.F. Peierls, Phys. Rev. B3, 3681 (1971).23. For unit-charge projectiles, see E.A. Uehling, Ann. Rev. Nucl. Sci. 4, 315
(1954). For highly charged projectiles, see J.A. Doggett and L.V. Spencer,Phys. Rev. 103, 1597 (1956). A Lorentz transformation is needed to convertthese center-of-mass data to knock-on energy spectra.
24. N.F. Mott and H.S.W. Massey, The Theory of Atomic Collisions, OxfordPress, London, 1965.
25. L.D. Landau, J. Exp. Phys. (USSR) 8, 201 (1944).26. P.V. Vavilov, Sov. Phys. JETP 5, 749 (1957).27. H. Bichsel, Rev. Mod. Phys. 60, 663 (1988).28. R. Talman, Nucl. Instrum. Methods 159, 189 (1979).29. H. Bichsel, Ch. 87 in the Atomic, Molecular and Optical Physics Handbook,
G.W.F. Drake, editor (Am. Inst. Phys. Press, Woodbury NY, 1996).30. S.M. Seltzer and M.J. Berger, Int. J. of Applied Rad. 35, 665 (1984). This
paper corrects and extends the results of Ref. 10.31. L.V. Spencer “Energy Dissipation by Fast Electrons,” Nat’l Bureau of
Standards Monograph No. 1 (1959).32. “Average Energy Required to Produce an Ion Pair,” ICRU Report No. 31
(1979).33. N. Hadley et al., “List of Poisoning Times for Materials,” Lawrence Berkeley
Lab Report TPC-LBL-79-8 (1981).34. J.D. Jackson, Classical Electrodynamics, 3rd edition, (John Wiley and Sons,
New York, 1998).35. H.A. Bethe, Phys. Rev. 89, 1256 (1953). A thorough review of multiple
scattering is given by W.T. Scott, Rev. Mod. Phys. 35, 231 (1963).However, the data of Shen et al., (Phys. Rev. D20, 1584 (1979)) show thatBethe’s simpler method of including atomic electron effects agrees betterwith experiment that does Scott’s treatment. For a thorough discussionof simple formulae for single scatters and methods of compounding theseinto multiple-scattering formulae, see W.T. Scott, Rev. Mod. Phys. 35, 231(1963). Detailed summaries of formulae for computing single scatters aregiven in J.W. Motz, H. Olsen, and H.W. Koch, Rev. Mod. Phys. 36, 881(1964).
36. V.L. Highland, Nucl. Instrum. Methods 129, 497 (1975); Nucl. Instrum.Methods 161, 171 (1979).
37. G.R. Lynch and O.I Dahl, Nucl. Instrum. Methods B58, 6 (1991).
June 18, 2012 16:19
40 30. Passage of particles through matter
38. M. Wong et al., Med. Phys. 17, 163 (1990).39. E. Segre, Nuclei and Particles, New York, Benjamin (1964) p. 65 ff.40. Y.S. Tsai, Rev. Mod. Phys. 46, 815 (1974).41. H. Davies, H.A. Bethe, and L.C. Maximon, Phys. Rev. 93, 788 (1954).42. L.D. Landau and I.J. Pomeranchuk, Dokl. Akad. Nauk. SSSR 92, 535
(1953); 92, 735 (1953). These papers are available in English in L. Landau,The Collected Papers of L.D. Landau, Pergamon Press, 1965; A.B. Migdal,Phys. Rev. 103, 1811 (1956).
43. S. Klein, Rev. Mod. Phys. 71, 1501 (1999).44. M.L. Ter-Mikaelian, SSSR 94, 1033 (1954);
M.L. Ter-Mikaelian, High Energy Electromagnetic Processes in CondensedMedia (John Wiley and Sons, New York, 1972).
45. P. Anthony et al., Phys. Rev. Lett. 76, 3550 (1996).46. H.W. Koch and J.W. Motz, Rev. Mod. Phys. 31, 920 (1959).47. M.J. Berger & S.M. Seltzer, “Tables of Energy Losses and Ranges of
Electrons and Positrons,” National Aeronautics and Space AdministrationReport NASA-SP-3012 (Washington DC 1964).
48. Data from J.H. Hubbell, H. Gimm, and I. Øverbø, J. Phys. Chem. Ref. Data9, 1023 (1980); parameters for σg.d.r. from A. Veyssiere et al., Nucl. Phys.A159, 561 (1970). Curves for these and other elements, compounds, andmixtures may be obtained from http://physics.nist.gov/PhysRefData.The photon total cross section is approximately flat for at least two decadesbeyond the energy range shown.
49. B.L. Berman and S.C. Fultz, Rev. Mod. Phys. 47, 713 (1975).50. J.W. Motz, H.A. Olsen, and H.W. Koch, Rev. Mod. Phys. 41, 581 (1969).51. P. Anthony et al., Phys. Rev. Lett. 75, 1949 (1995).52. U.I. Uggerhoj, Rev. Mod. Phys. 77, 1131 (2005).53. L. Gerhardt and S.R. Klein, Phys. Rev. D82, 074017 (2010).54. W.R. Nelson, H. Hirayama, and D.W.O. Rogers, “The EGS4 Code System,”
SLAC-265, Stanford Linear Accelerator Center (Dec. 1985).55. Experimental Techniques in High Energy Physics, ed. T. Ferbel (Addision-
Wesley, Menlo Park CA 1987).56. U. Amaldi, Phys. Scripta 23, 409 (1981).57. E. Longo and I. Sestili, Nucl. Instrum. Methods 128, 283 (1975).58. G. Grindhammer et al., in Proceedings of the Workshop on Calorimetry for the
Supercollider, Tuscaloosa, AL, March 13–17, 1989, edited by R. Donaldsonand M.G.D. Gilchriese (World Scientific, Teaneck, NJ, 1989), p. 151.
59. W.R. Nelson et al., Phys. Rev. 149, 201 (1966).60. G. Bathow et al., Nucl. Phys. B20, 592 (1970).61. H.A. Bethe and W. Heitler, Proc. Roy. Soc. A146, 83 (1934);
H.A. Bethe, Proc. Cambridge Phil. Soc. 30, 542 (1934).
June 18, 2012 16:19

30. Passage of particles through matter 41
62. A.A. Petrukhin and V.V. Shestakov, Can. J. Phys. 46, S377 (1968).63. V.M. Galitskii and S.R. Kel’ner, Sov. Phys. JETP 25, 948 (1967).64. S.R. Kel’ner and Yu.D. Kotov, Sov. J. Nucl. Phys. 7, 237 (1968).65. R.P. Kokoulin and A.A. Petrukhin, in Proceedings of the International
Conference on Cosmic Rays, Hobart, Australia, August 16–25, 1971, Vol. 4,p. 2436.
66. A.I. Nikishov, Sov. J. Nucl. Phys. 27, 677 (1978).67. Y.M. Andreev et al., Phys. Atom. Nucl. 57, 2066 (1994).68. L.B. Bezrukov and E.V. Bugaev, Sov. J. Nucl. Phys. 33, 635 (1981).69. N.V. Mokhov, “The MARS Code System User’s Guide,” Fermilab-FN-628
(1995);N.V. Mokhov et al., Radiation Protection and Dosimetry, vol. 116, part 2,pp. 99 (2005);Fermilab-Conf-04/053 (2004);N.V. Mokhov et al., in Proc. of Intl. Conf. on Nuclear Data for Science andTech, (Santa Fe, NM, 2004), AIP C onf. Proc. 769, part 2, p. 1618;Fermilab-Conf-04/269-AD (2004);http://www-ap.fnal.gov/MARS/.
70. P.H. Barrett et al., Rev. Mod. Phys. 24, 133 (1952).71. A. Van Ginneken, Nucl. Instrum. Methods A251, 21 (1986).72. U. Becker et al., Nucl. Instrum. Methods A253, 15 (1986).73. J.J. Eastman and S.C. Loken, in Proceedings of the Workshop on Experiments,
Detectors, and Experimental Areas for the Supercollider, Berkeley, CA, July7–17, 1987, edited by R. Donaldson and M.G.D. Gilchriese (World Scientific,Singapore, 1988), p. 542.
74. Methods of Experimental Physics, L.C.L. Yuan and C.-S. Wu, editors,Academic Press, 1961, Vol. 5A, p. 163.
75. W.W.M. Allison and P.R.S. Wright, “The Physics of Charged ParticleIdentification: dE/dx, Cherenkov Radiation, and Transition Radiation,”p. 371 in Experimental Techniques in High Energy Physics, T. Ferbel, editor,(Addison-Wesley 1987).
76. E.R. Hayes, R.A. Schluter, and A. Tamosaitis, “Index and Dispersion ofSome Cherenkov Counter Gases,” ANL-6916 (1964).
77. T. Ypsilantis, “Particle Identification at Hadron Colliders,” CERN-EP/89-150 (1989), or ECFA 89-124, 2 661 (1989).
78. I. Tamm, J. Phys. U.S.S.R., 1, 439 (1939).79. H. Motz and L.I. Schiff, Am. J. Phys. 21, 258 (1953).80. B.N. Ratcliff, Nucl. Instrum Meth. A502, 211 (2003).81. S.K. Mandal, S.R. Klein, and J. D. Jackson, Phys. Rev. D72, 093003 (2005).82. G.A. Askaryan, Sov. Phys. JETP 14, 441 (1962).83. P.W. Gorham et al., Phys. Rev. D72, 023002 (2005).
June 18, 2012 16:19
42 30. Passage of particles through matter
84. E. Zas, F. Halzen, and T. Stanev, Phys. Rev. D 45,362(1992).85. M.L. Cherry, Phys. Rev. D10, 3594–3607 (1974);
M.L. Cherry, Phys. Rev. D17, 2245–2260 (1978).86. B. Dolgoshein, Nucl. Instrum. Methods A326, 434–469 (1993).
June 18, 2012 16:19
![27.Passageofparticlesthroughmatter 1pdg.lbl.gov/2009/reviews/rpp2009-rev-passage-particles-matter.pdf · in single collisions with energy losses E [1], leading to ionization, atomic,](https://static.fdocuments.us/doc/165x107/5ea62bb00c3dee7c06542687/27passageofparticlesthroughmatter-1pdglblgov2009reviewsrpp2009-rev-passage-particles-.jpg)


![33.Passageofparticlesthroughmatter 133.1. Notation The notation and important numerical values are shown in Table 33.1. 33.2. Electronic energy loss byheavy particles [1–33] 33.2.1.](https://static.fdocuments.us/doc/165x107/60c49fa126b4a17f7d7e70b5/33passageofparticlesthroughmatter-1-331-notation-the-notation-and-important-numerical.jpg)