
3012135
14
RETAIL RESEARCH Weekly Statistics Global Index 10-Apr 03-Apr Change (%) Sensex 28879 28260 +2.19 Nifty 8780 8586 +2.26 DJIA 18058 17763 +1.66 Nasdaq 4996 4887 +2.23 FTSE 7090 6834 +3.75 DAX 12375 11967 +3.40 Hang Seng 27272 25276 +7.90 Nikkei 19908 19435 +2.43 Bovespa 54214 53123 +2.05 Indonesia Jakarta 5491 5456 +0.64 Singapore – Strait 3472 3454 +0.54 MSCI Emerging Mkt 1035 994 +4.05 Mutual Fund Categories watch Category Name 1 Week Absolute 1 Month Absolute 3 Month Absolute 6 Month Absolute 1 Year CAGR 3 Year CAGR Arbitrage Funds 0.28 0.85 2.49 4.44 8.61 8.84 Balanced - Equity 1.88 1.29 5.86 14.21 39.03 21.22 Equity - Banking 1.05 -1.03 1.32 21.34 45.47 22.35 Equity - Div Yield 2.38 1.49 4.83 16.17 47.96 21.09 Equity - Infra 2.24 1.81 7.78 19.36 52.40 18.86 Equity - Large Cap 2.29 1.23 7.24 17.12 42.92 21.88 Equity - Mid Cap 2.72 2.67 7.89 22.60 69.37 32.65 Equity - MNC 2.77 3.53 14.74 38.85 87.95 34.68 Equity - Multi CAP 2.27 1.70 7.62 18.66 49.43 24.70 Equity - Small Cap 3.24 4.39 10.06 28.06 96.81 35.81 Equity - FMCG 4.71 2.60 6.16 16.53 34.67 24.17 Equity - Infotech 2.92 -0.99 5.54 9.86 36.97 25.74 Equity - Pharma 2.44 8.01 19.81 29.93 72.81 39.70 ELSS 2.05 1.48 7.39 18.82 49.63 24.94 Gold ETFs 1.30 2.36 -1.26 -0.65 -7.28 -2.93 Gilt Funds -0.12 0.27 2.54 8.73 15.95 9.84 Income Funds 0.01 0.45 2.30 6.78 12.83 9.43 Liquid Funds 0.15 0.71 1.99 4.05 8.35 8.62 MIP 0.65 0.75 3.14 8.04 17.31 11.02 Note: Trailing Returns up to 1 year are absolute and over 1 year are CAGR. NAV/index values are as on Apr 10, 2015. Equity Markets The market jumped last week after global rating agency Moody's revised India's sovereign outlook to positive from stable. Market also gained as a weak US jobs report spurred speculation the US Federal Reserve will keep interest rates low. In the week ended Friday, 10 April 2015, the 30-share S&P BSE Sensex gained 2.19% to settle at 28,879.38. The 50-unit CNX Nifty gained 2.26% to settle at 8,780.35. The S&P BSE Mid-Cap index advanced 3.19% to settle at 11,093.02. The S&P BSE Small-Cap index gained 6.28% to settle at 11,846.33. Both these indices outperformed the Sensex. Outlook for the current weeks Quarterly earnings of India Inc, macroeconomic data, trend in global markets, investment by foreign portfolio investors (FPIs), the movement of rupee against the dollar and crude oil price movement will dictate trend on the bourses in the near term. Next week is a truncated trading week. The stock market remains closed on Tuesday, 14 April 2015 on account of Dr. Baba Saheb Ambedkar Jayanti. Shares of public sector oil marketing companies (PSU OMCs) will be in focus as fuel price review is due at the middle of the month. PSU OMCs undertake review of fuel prices twice every month based on the average imported oil price in the preceding fortnight. The review takes place during the middle of the month and on the last day of the month based on the average imported oil price in the preceding fortnight. Stock-specific action will be seen as Indian companies start announcing their earnings for the quarter ended 31 March 2015 in the coming week. ACC and DCB Bank are slated to announce their quarterly results on Tuesday, 14 April 2015. Tata Consultancy Services (TCS), IndusInd Bank, Gruh Finance and MindTree are scheduled to announce their results on Thursday, 16 April 2015. Crisil and RS Software India announce their earnings on Friday, 17 April 2015. If in coming sessions Nifty trades above 8800 level then traders may see continuation of current trend, which could lead Nifty to 8930. If Nifty faces resistance at 8800 level then traders may see correction in Nifty up to 8670 level. Global Markets U.S. stocks ended a strong week with a broad rally on Friday as investors lauded GE's decision to divest most of its high-risk GE Capital business and repurchase up to $50 billion of its shares. For the week, the Dow is up 1.6%, S&P is up 1.7% and the Nasdaq is up 2.3%. Both the Dow and S&P notched their second straight week of gains, helped by a pickup in merger activity. RETAIL RESEARCH April 13, 2015 Weekly Mutual Fund and Debt Report
description
report
Transcript of 3012135

RETAIL RESEARCH
Weekly Statistics Global Index 10-Apr 03-Apr Change (%)
Sensex 28879 28260 +2.19
Nifty 8780 8586 +2.26
DJIA 18058 17763 +1.66
Nasdaq 4996 4887 +2.23
FTSE 7090 6834 +3.75
DAX 12375 11967 +3.40
Hang Seng 27272 25276 +7.90
Nikkei 19908 19435 +2.43
Bovespa 54214 53123 +2.05
Indonesia Jakarta 5491 5456 +0.64
Singapore – Strait 3472 3454 +0.54
MSCI Emerging Mkt 1035 994 +4.05
Mutual Fund Categories watch
Category Name 1 Week
Absolute 1 Month Absolute
3 Month Absolute
6 Month Absolute
1 Year CAGR
3 Year CAGR
Arbitrage Funds 0.28 0.85 2.49 4.44 8.61 8.84 Balanced - Equity 1.88 1.29 5.86 14.21 39.03 21.22 Equity - Banking 1.05 -1.03 1.32 21.34 45.47 22.35 Equity - Div Yield 2.38 1.49 4.83 16.17 47.96 21.09 Equity - Infra 2.24 1.81 7.78 19.36 52.40 18.86 Equity - Large Cap 2.29 1.23 7.24 17.12 42.92 21.88 Equity - Mid Cap 2.72 2.67 7.89 22.60 69.37 32.65 Equity - MNC 2.77 3.53 14.74 38.85 87.95 34.68 Equity - Multi CAP 2.27 1.70 7.62 18.66 49.43 24.70 Equity - Small Cap 3.24 4.39 10.06 28.06 96.81 35.81 Equity - FMCG 4.71 2.60 6.16 16.53 34.67 24.17 Equity - Infotech 2.92 -0.99 5.54 9.86 36.97 25.74 Equity - Pharma 2.44 8.01 19.81 29.93 72.81 39.70 ELSS 2.05 1.48 7.39 18.82 49.63 24.94 Gold ETFs 1.30 2.36 -1.26 -0.65 -7.28 -2.93 Gilt Funds -0.12 0.27 2.54 8.73 15.95 9.84 Income Funds 0.01 0.45 2.30 6.78 12.83 9.43 Liquid Funds 0.15 0.71 1.99 4.05 8.35 8.62 MIP 0.65 0.75 3.14 8.04 17.31 11.02 Note: Trailing Returns up to 1 year are absolute and over 1 year are CAGR. NAV/index values are as on Apr 10, 2015.
Equity Markets
The market jumped last week after global rating agency Moody's revised India's sovereign outlook to positive from stable. Market also gained as a weak US jobs report spurred speculation the US Federal Reserve will keep interest rates low. In the week ended Friday, 10 April 2015, the 30-share S&P BSE Sensex gained 2.19% to settle at 28,879.38. The 50-unit CNX Nifty gained 2.26% to settle at 8,780.35. The S&P BSE Mid-Cap index advanced 3.19% to settle at 11,093.02. The S&P BSE Small-Cap index gained 6.28% to settle at 11,846.33. Both these indices outperformed the Sensex.
Outlook for the current weeks Quarterly earnings of India Inc, macroeconomic data, trend in global markets, investment by foreign portfolio investors (FPIs), the movement of rupee against the dollar and crude oil price movement will dictate trend on the bourses in the near term. Next week is a truncated trading week. The stock market remains closed on Tuesday, 14 April 2015 on account of Dr. Baba Saheb Ambedkar Jayanti. Shares of public sector oil marketing companies (PSU OMCs) will be in focus as fuel price review is due at the middle of the month. PSU OMCs undertake review of fuel prices twice every month based on the average imported oil price in the preceding fortnight. The review takes place during the middle of the month and on the last day of the month based on the average imported oil price in the preceding fortnight. Stock-specific action will be seen as Indian companies start announcing their earnings for the quarter ended 31 March 2015 in the coming week. ACC and DCB Bank are slated to announce their quarterly results on Tuesday, 14 April 2015. Tata Consultancy Services (TCS), IndusInd Bank, Gruh Finance and MindTree are scheduled to announce their results on Thursday, 16 April 2015. Crisil and RS Software India announce their earnings on Friday, 17 April 2015. If in coming sessions Nifty trades above 8800 level then traders may see continuation of current trend, which could lead Nifty to 8930. If Nifty faces resistance at 8800 level then traders may see correction in Nifty up to 8670 level.
Global Markets U.S. stocks ended a strong week with a broad rally on Friday as investors lauded GE's decision to divest most of its high-risk GE Capital business and repurchase up to $50 billion of its shares. For the week, the Dow is up 1.6%, S&P is up 1.7% and the Nasdaq is up 2.3%. Both the Dow and S&P notched their second straight week of gains, helped by a pickup in merger activity.
RETAIL RESEARCH
April 13, 2015
Weekly Mutual Fund and Debt Report
RETAIL RESEARCH
10 Year G sec Benchmark move:
Liquidity:
Debt Securities Benchmarks watch
Debt (%) 10-Apr 03-Apr Change (bps)
Call Rate 7.58 11.21 -363 CBLO 7.45 9.25 -181 Repo 7.5 7.5 0 Reverse Repo 6.5 6.5 0 10 Year G sec 7.80 7.74 6 LIBOR – UK 0.56 0.56 0 LIBOR – USA 0.27 0.27 0 LIBOR – Europe 0.27 0.27 0
7.68
7.70
7.72
7.74
7.76
7.78
7.80
7.82
10-M
ar
12-M
ar
14-M
ar
16-M
ar
18-M
ar
20-M
ar
22-M
ar
24-M
ar
26-M
ar
28-M
ar
30-M
ar
1-Ap
r
3-Ap
r
5-Ap
r
7-Ap
r
9-Ap
r
-1,000
,0
1,000
2,000
3,000
Jul-1
3
Aug-
13
Sep-
13
Nov
-13
Dec-
13
Feb-
14
Mar
-14
May
-14
Jun-
14
Aug-
14
Sep-
14
Nov
-14
Dec-
14
Feb-
15
Mar
-15
Repo Reverse RepoTerm Repo Term Reverse Repo
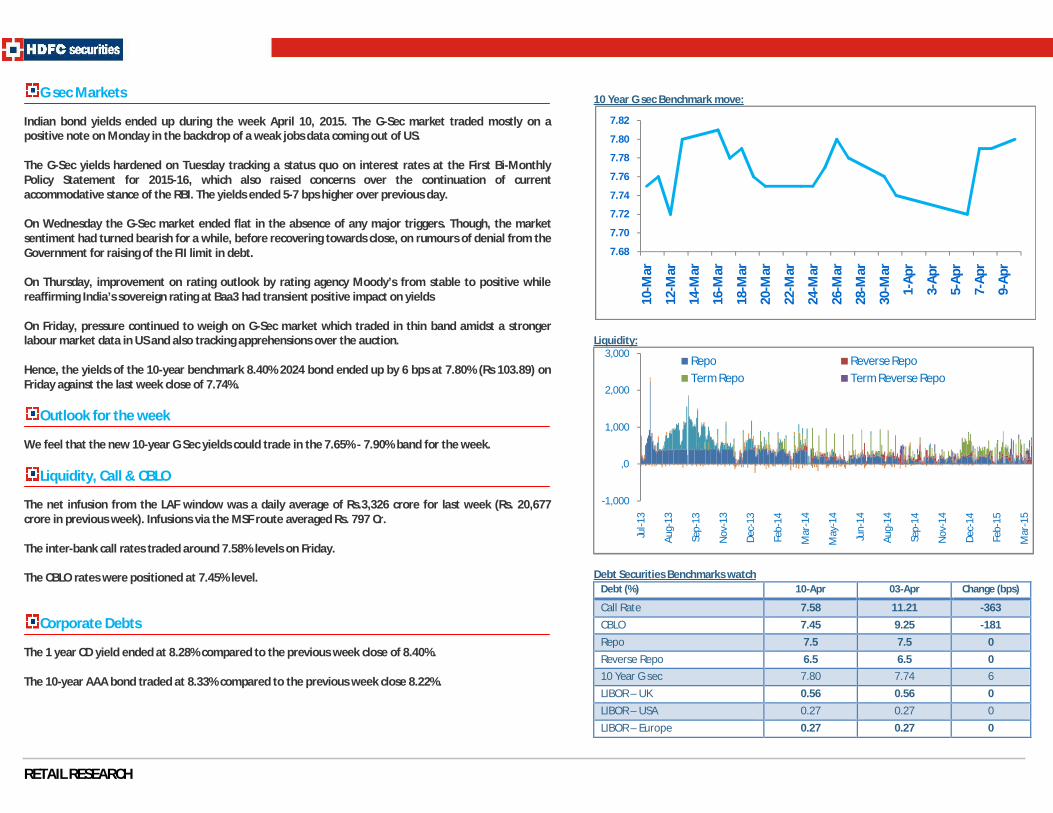
G sec Markets Indian bond yields ended up during the week April 10, 2015. The G-Sec market traded mostly on a positive note on Monday in the backdrop of a weak jobs data coming out of US. The G-Sec yields hardened on Tuesday tracking a status quo on interest rates at the First Bi-Monthly Policy Statement for 2015-16, which also raised concerns over the continuation of current accommodative stance of the RBI. The yields ended 5-7 bps higher over previous day. On Wednesday the G-Sec market ended flat in the absence of any major triggers. Though, the market sentiment had turned bearish for a while, before recovering towards close, on rumours of denial from the Government for raising of the FII limit in debt. On Thursday, improvement on rating outlook by rating agency Moody’s from stable to positive while reaffirming India’s sovereign rating at Baa3 had transient positive impact on yields On Friday, pressure continued to weigh on G-Sec market which traded in thin band amidst a stronger labour market data in US and also tracking apprehensions over the auction. Hence, the yields of the 10-year benchmark 8.40% 2024 bond ended up by 6 bps at 7.80% (Rs 103.89) on Friday against the last week close of 7.74%.
Outlook for the week We feel that the new 10-year G Sec yields could trade in the 7.65% - 7.90% band for the week.
Liquidity, Call & CBLO The net infusion from the LAF window was a daily average of Rs.3,326 crore for last week (Rs. 20,677 crore in previous week). Infusions via the MSF route averaged Rs. 797 Cr. The inter-bank call rates traded around 7.58% levels on Friday. The CBLO rates were positioned at 7.45% level.
Corporate Debts The 1 year CD yield ended at 8.28% compared to the previous week close of 8.40%. The 10-year AAA bond traded at 8.33% compared to the previous week close 8.22%.

RETAIL RESEARCH
AAA Corporate Bond Spread over Gsec:
AAA Corporate Bond Spread over Gsec Security 10-Apr 31-Mar 1 Year 40 34 3 Year 6 22 5 Year 44 36 10 Year 38 33 Forthcoming Auctions; Security Date of Auction Value (Rs. Crs) State Development Loans 13-Apr-15 7,480 91 Day T-Bill 15-Apr-15 8,000 364 Day T-bill 15-Apr-15 6,000 Certificates of Deposits: Maturity 10-Apr 31-Mar
3 Months 8.2 8.2 6 Months 8.2 8.5 1 Year 8.3 8.3 Commercial Papers: Maturity 10-Apr 31-Mar
3 Months 8.6 9.00 6 Months 8.8 9.3 1 Year 8.9 9.1 Commodity Update: Commodity 10-Apr 02-Apr Change (%)
NYMEX Crude Oil ($/bbl) 51.64 49.14 +5.09 Gold (oz/$) 1204.60 1,200.9 +0.31
Currency The USD appreciated against the Euro by 3.52 % for week ended 10th April 2015. The dollar appreciated against the yen by 1.04% for the week. The USD appreciated against the pound by 1.94%.
Gold & Crude oil International crude oil prices (WTI) gained by 5.09% for the week ended 10th April, 2015 to close at USD 51.64 per barrel. International gold prices fell for the week ended 10th April, 2015 to close at USD 1204.6 per troy ounce.
10 Yr G sec Benchmark Yields Movements in last one month.
7.73
7.83
7.93
8.03
8.13
8.23
8.33
91 Day182 Day 1 Yr 2 Yr 3 Yr 4 Yr 5 Yr 7 Yr 10 Yr 15 Yr 20 Yr 25 Yr 30 Yr
10-Apr-2015 3-Apr-2015 27-Mar-2015 20-Mar-2015
RETAIL RESEARCH
Scheme Analysis IDFC Premier Equity- G
RETAIL RESEARCH
Unit Growth of investments Vs. Benchmark(Rebased to 100)
Fund Performance Vis-a-vis Benchmark (Excess return):
-10
-5
0
5
10
15Monthly Fund Return +/-BSE 500
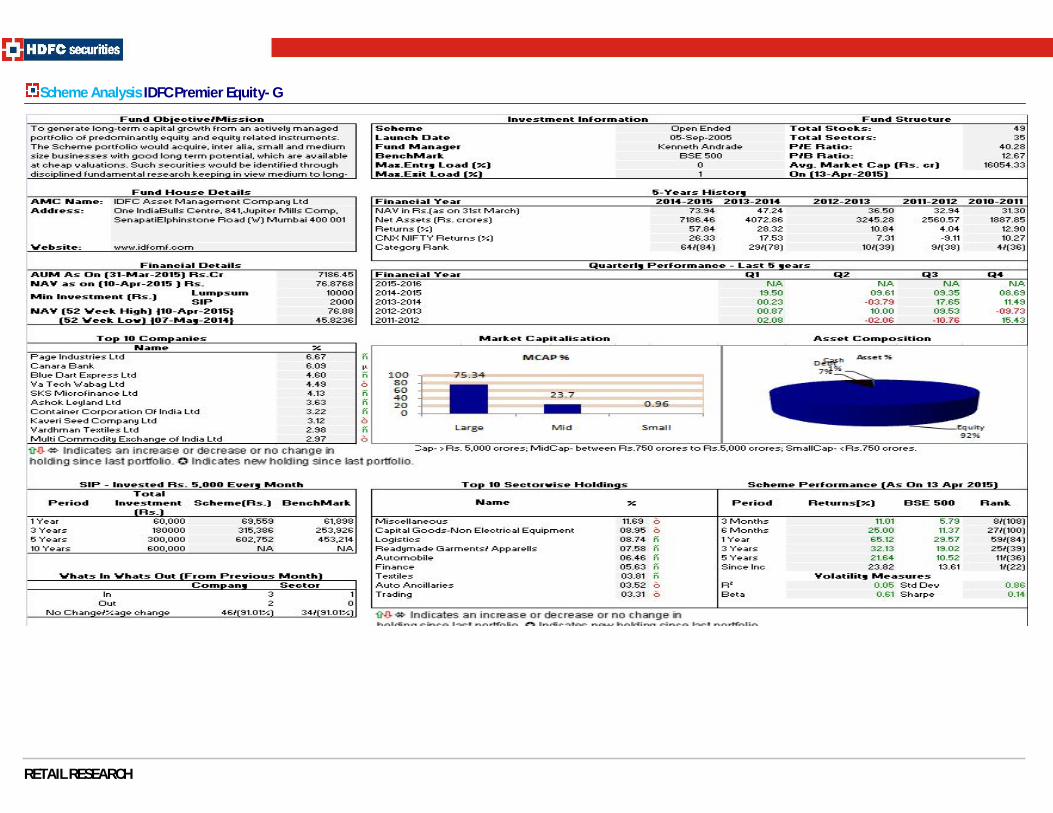
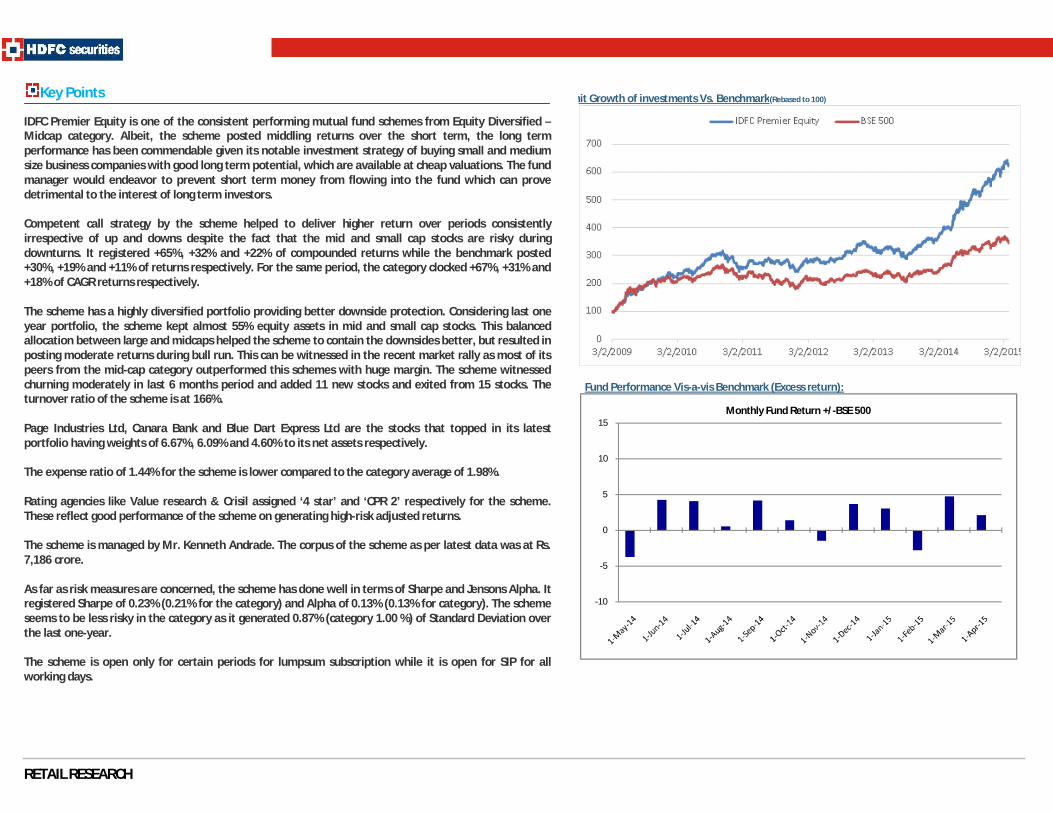
Key Points IDFC Premier Equity is one of the consistent performing mutual fund schemes from Equity Diversified – Midcap category. Albeit, the scheme posted middling returns over the short term, the long term performance has been commendable given its notable investment strategy of buying small and medium size business companies with good long term potential, which are available at cheap valuations. The fund manager would endeavor to prevent short term money from flowing into the fund which can prove detrimental to the interest of long term investors. Competent call strategy by the scheme helped to deliver higher return over periods consistently irrespective of up and downs despite the fact that the mid and small cap stocks are risky during downturns. It registered +65%, +32% and +22% of compounded returns while the benchmark posted +30%, +19% and +11% of returns respectively. For the same period, the category clocked +67%, +31% and +18% of CAGR returns respectively. The scheme has a highly diversified portfolio providing better downside protection. Considering last one year portfolio, the scheme kept almost 55% equity assets in mid and small cap stocks. This balanced allocation between large and midcaps helped the scheme to contain the downsides better, but resulted in posting moderate returns during bull run. This can be witnessed in the recent market rally as most of its peers from the mid-cap category outperformed this schemes with huge margin. The scheme witnessed churning moderately in last 6 months period and added 11 new stocks and exited from 15 stocks. The turnover ratio of the scheme is at 166%. Page Industries Ltd, Canara Bank and Blue Dart Express Ltd are the stocks that topped in its latest portfolio having weights of 6.67%, 6.09% and 4.60% to its net assets respectively. The expense ratio of 1.44% for the scheme is lower compared to the category average of 1.98%. Rating agencies like Value research & Crisil assigned ‘4 star’ and ‘CPR 2’ respectively for the scheme. These reflect good performance of the scheme on generating high-risk adjusted returns. The scheme is managed by Mr. Kenneth Andrade. The corpus of the scheme as per latest data was at Rs. 7,186 crore. As far as risk measures are concerned, the scheme has done well in terms of Sharpe and Jensons Alpha. It registered Sharpe of 0.23% (0.21% for the category) and Alpha of 0.13% (0.13% for category). The scheme seems to be less risky in the category as it generated 0.87% (category 1.00 %) of Standard Deviation over the last one-year. The scheme is open only for certain periods for lumpsum subscription while it is open for SIP for all working days.
RETAIL RESEARCH
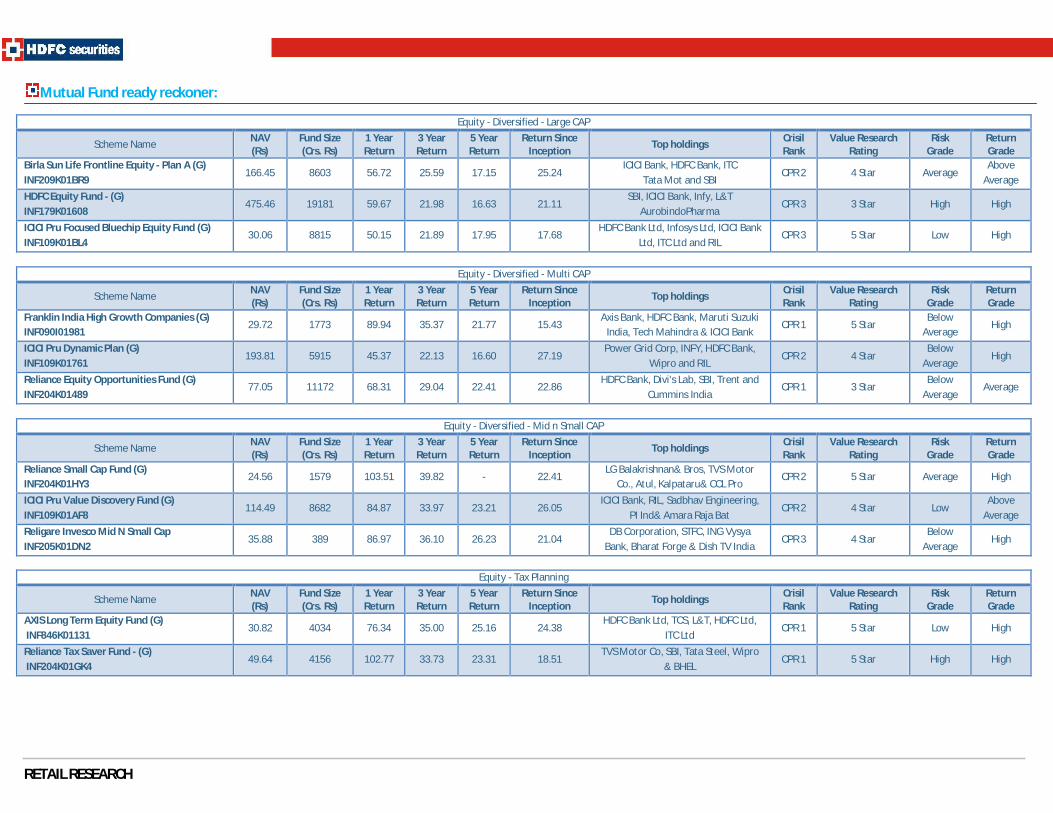
Mutual Fund ready reckoner:
Equity - Diversified - Large CAP
Scheme Name NAV (Rs)
Fund Size (Crs. Rs)
1 Year Return
3 Year Return
5 Year Return
Return Since Inception
Top holdings Crisil Rank
Value Research Rating
Risk Grade
Return Grade
Birla Sun Life Frontline Equity - Plan A (G) INF209K01BR9
166.45 8603 56.72 25.59 17.15 25.24 ICICI Bank, HDFC Bank, ITC
Tata Mot and SBI CPR 2 4 Star Average
Above Average
HDFC Equity Fund - (G) INF179K01608
475.46 19181 59.67 21.98 16.63 21.11 SBI, ICICI Bank, Infy, L&T
AurobindoPharma CPR 3 3 Star High High
ICICI Pru Focused Bluechip Equity Fund (G) INF109K01BL4
30.06 8815 50.15 21.89 17.95 17.68 HDFC Bank Ltd, Infosys Ltd, ICICI Bank
Ltd, ITC Ltd and RIL CPR 3 5 Star Low High
Equity - Diversified - Multi CAP
Scheme Name NAV (Rs)
Fund Size (Crs. Rs)
1 Year Return
3 Year Return
5 Year Return
Return Since Inception
Top holdings Crisil Rank
Value Research Rating
Risk Grade
Return Grade
Franklin India High Growth Companies (G) INF090I01981
29.72 1773 89.94 35.37 21.77 15.43 Axis Bank, HDFC Bank, Maruti Suzuki
India, Tech Mahindra & ICICI Bank CPR 1 5 Star
Below Average
High
ICICI Pru Dynamic Plan (G) INF109K01761
193.81 5915 45.37 22.13 16.60 27.19 Power Grid Corp, INFY, HDFC Bank,
Wipro and RIL CPR 2 4 Star
Below Average
High
Reliance Equity Opportunities Fund (G) INF204K01489
77.05 11172 68.31 29.04 22.41 22.86 HDFC Bank, Divi's Lab, SBI, Trent and
Cummins India CPR 1 3 Star
Below Average
Average
Equity - Diversified - Mid n Small CAP
Scheme Name NAV (Rs)
Fund Size (Crs. Rs)
1 Year Return
3 Year Return
5 Year Return
Return Since Inception
Top holdings Crisil Rank
Value Research Rating
Risk Grade
Return Grade
Reliance Small Cap Fund (G) INF204K01HY3
24.56 1579 103.51 39.82 - 22.41 LG Balakrishnan& Bros, TVS Motor
Co., Atul, Kalpataru& CCL Pro CPR 2 5 Star Average High
ICICI Pru Value Discovery Fund (G) INF109K01AF8
114.49 8682 84.87 33.97 23.21 26.05 ICICI Bank, RIL, Sadbhav Engineering,
PI Ind& Amara Raja Bat CPR 2 4 Star Low
Above Average
Religare Invesco Mid N Small Cap INF205K01DN2
35.88 389 86.97 36.10 26.23 21.04 DB Corporation, STFC, ING Vysya
Bank, Bharat Forge & Dish TV India CPR 3 4 Star
Below Average
High
Equity - Tax Planning
Scheme Name NAV (Rs)
Fund Size (Crs. Rs)
1 Year Return
3 Year Return
5 Year Return
Return Since Inception
Top holdings Crisil Rank
Value Research Rating
Risk Grade
Return Grade
AXIS Long Term Equity Fund (G) INF846K01131
30.82 4034 76.34 35.00 25.16 24.38 HDFC Bank Ltd, TCS, L&T, HDFC Ltd,
ITC Ltd CPR 1 5 Star Low High
Reliance Tax Saver Fund - (G) INF204K01GK4
49.64 4156 102.77 33.73 23.31 18.51 TVS Motor Co, SBI, Tata Steel, Wipro
& BHEL CPR 1 5 Star High High

RETAIL RESEARCH
Hybrid - Equity Oriented (Atleast 60% in equity)
Scheme Name NAV (Rs)
Fund Size (Crs. Rs)
1 Year Return
3 Year Return
5 Year Return
Return Since Inception Top holdings
Crisil Rank
Value Research Rating
Risk Grade
Return Grade
HDFC Balanced Fund (G) INF179K01392
107.50 3284 51.84 22.77 19.03 17.85 SBI, ICICI Bank, Axis Bank, AurobindoPharma& L&T
CPR 1 4 Star Below
Average High
ICICI Pru Balanced Fund - (G) INF109K01480
93.20 1633 50.32 24.29 18.94 15.68 HDFC Bank, MothersonSumi, City
Union Bank, Maruti Suzuki Ind& ICICI CPR 1 5 Star
Below Average
Above Average
Hybrid - Monthly Income Plan - Long Term (About 15% to 20% in equity)
Scheme Name NAV (Rs)
Fund Size (Crs. Rs)
1 Year Return
3 Year Return
5 Year Return
Return Since Inception Top holdings
Crisil Rank
Value Research Rating
Risk Grade
Return Grade
Reliance Monthly Income Plan (G) INF204K01FD1
33.37 2521 26.84 13.12 10.97 11.40 Eq: Sundaram-Clayton, Federal Mogul
Goetze, HDFC Bank. CP: PFC CPR 2 4 Star
Above Average
Above Average
HDFC Monthly Income Plan - LTP (G) INF179K01AE4
34.66 3818 27.25 12.90 10.95 11.77 Eq: SBI, Infy, ICICI Bank, L&T. Debt:
TATA Power, HindalcoInds CPR 2 3 Star Average Average
Liquid Funds
Scheme Name NAV (Rs) Fund Size (Crs. Rs)
1 Year Return
2 Year Return
3 Year Return
Return Since Inception Top Holdings Crisil
Rank Value Research
Rating Risk
Grade Return Grade
HDFC Liquid Fund (G) INF179K01KG8
27.35 14666 9.05 9.20 9.24 7.25 CP: National Bank Agr. Rur. Devp, CD: National Bank Agr. Rur, Union Bank.
CPR 3 3 Star Below
Average Above
Average SBI Magnum InstaCash - Cash Plan INF200K01LJ4
3064.08 1134 8.96 9.20 9.19 7.34 CP: M&M Financial Services, Kotak
Mahindra Prime, PFC, CD: SIDBI 2014 CPR 3 4 Star
Below Average
Above Average
Ultra Short Term Funds
Scheme Name NAV (Rs)
Fund Size (Crs. Rs)
1 Year Return
2 Year Return
3 Year Return
Return Since Inception Top Holdings
Crisil Rank
Value Research Rating
Risk Grade
Return Grade
ICICI Pru Flexible Income Plan - Regular (G) INF109K01746
260.58 11913 9.50 9.55 9.52 7.49 CD: NABARD, Canara Bk, T Bill, CP:
HDFC, Debt: TCFSL CPR 1 4 Star
Below Average
Above Average
SBI Mag Income FRP - Savings Plus Bond (G) INF200K01636
21.50 842 8.90 9.03 9.26 7.47 CD: HDFC, ICICI, IDBI. Debt: LIC Hou,
HDFC. CP: Sesaste CPR 3 3 Star Low Average
Short Term Income Funds
Scheme Name NAV (Rs)
Fund Size (Crs. Rs)
1 Year Return
2 Year Return
3 Year Return
Return Since Inception Top Holdings
Crisil Rank
Value Research Rating
Risk Grade
Return Grade
Sundaram Select Debt - STAP (G) INF903J01FG3
24.00 985 10.83 9.95 10.28 7.27 FD: J&K Bank, D: 11.6% DHFL. 2015,
CD: Central Bank of India 2013, CPR 3 3 Star Average
Above Average
Franklin India Short Term Income (G) INF090I01304
2847.73 10332 12.25 10.57 10.36 8.33 PTC: 11.85% Adani Enterprises. Debt:
Dewan Housing Fin CPR 1 4 Star Average
Above Average

RETAIL RESEARCH
Income Funds
Scheme Name NAV (Rs)
Fund Size (Crs. Rs)
1 Year Return
2 Year Return
3 Year Return
Return Since Inception Top Holdings
Crisil Rank
Value Research Rating
Risk Grade
Return Grade
Birla Sun Life Medium Term Plan (G) INF209K01603
16.88 3683 12.27 11.32 11.20 9.24 Debenture: DLF, Tata Mot, IL&FS
Transport, RHC Holdings CPR 3 4 Star Low
Above Average
ICICI Pru Long Term Plan - Retail (G) INF109K01712
31.84 349 20.97 14.98 12.89 9.38 Bonds: EXIM Bk, 8.28% GOI 9-21, 8.4%
GOI 7-28 & Cash - 5 Star Low High
Gilt Funds
Scheme Name NAV (Rs)
Fund Size (Crs. Rs)
1 Year Return
2 Year Return
3 Year Return
Return Since Inception Top Holdings
Crisil Rank
Value Research Rating
Risk Grade
Return Grade
Tata Gilt Mid Term Fund (G) INF277K01LH6
15.30 129 17.96 11.83 11.24 9.52 SDL: 8.94% Maharashtra, GOI: 8.28%
GOI 9-21 CPR 3 4 Star Low High
Sundaram Gilt Fund - (G) INF903J01FA6
23.61 40 13.07 15.67 14.90 6.41 8.83% GOI 2023, 8.28% GOI 2027, 8.6% GOI 2028 & 8.15% GOI 2026
- 5 Star Low High
Notes:
NAV value as on Mar 23, 2015. Portfolio data as on Feb2015. Returns are trailing and annualized (CAGR). The notations '5 Star & CPR 1' (used by VR &Crisil respectively) are considered as top in respective rating and ranking scales. The performance of the funds are rated and classified by Value Research in the following ways. Top 10% funds in each category were classified ‘*****’ funds, the next 22.5% got a ‘****’ star,
while the middle 35% got a ‘***’, while the next 22.5% and bottom 10% got ‘**’ and ‘*’ respectively. The criteria used in computing the CRISIL Composite Performance Rank are Superior Return Score, based on NAVs over the Quarter Ended Dec ‘14, Based on percentile of number of schemes
considered in the category, the schemes are ranked as follows: CPR 1- Very Good performance, CPR 2 - Good performance, CPR 3 - Average performance, CPR 4 - Below average and CPR 5 - Relatively weak performance in the category.
Schemes shortlisted based on the corpus and age. Final picks arrived from return score (respective weightage given for rolling returns for 1m, 3m, 6m, 1yr, 2yr & 3yr) and risk score. Schemes from Quantum, Mirae and JM Mutual Funds have not been considered.
NFO:
Scheme name Tenure Open Date Close Date Minimum Investments
Balanced AXIS Hybrid Fund - Series 22 (G) 1278 Days 21-Apr-15 05-May-15 5000
AXIS Hybrid Fund - Series 22 - Direct (G) 1278 Days 21-Apr-15 05-May-15 5000
HSBC CPO Fund - Sr.II - Plan II (G) 1173 Days 06-Apr-15 13-Apr-15 5000
ICICI Pru Capital Protection Orient. VIII-B Dir(G) 1103 Days 06-Apr-15 20-Apr-15 5000
Equity
Birla Sun Life Emerging Leaders Fund - Sr.6 (G) 1277 Days 30-Mar-15 13-Apr-15 5000

RETAIL RESEARCH
Dividend Scheme Name Record Date Gross (%) Date
Sahara Tax Gain Fund (D) 3/31/2015 25.00 4/1/2015
SBI Magnum Tax Gain Scheme (D) 3/27/2015 55.00 3/27/2015
BNP Paribas Dividend Yield Fund (D) 3/27/2015 1.00 3/27/2015
DSP BR Small And Mid Cap Fund (D) 3/27/2015 23.00 3/30/2015
DWS Alpha Equity Fund (D) 3/27/2015 10.00 3/30/2015
Franklin India Flexi Cap Fund (D) 3/27/2015 17.50 3/30/2015
UTI-Top 100 Fund (D) 3/26/2015 30.00 3/27/2015
Edelweiss ELSS Fund (D) 3/26/2015 5.00 3/27/2015
Religare Invesco Growth Fund (D) 3/26/2015 85.00 3/27/2015
DWS Large Cap Fund - Series 3 (G) 1281 Days 10-Apr-15 20-Apr-15 5000
HDFC Focused Equity Fund - Plan B (G) 1100 Days 26-Mar-15 24-Apr-15 5000
Fixed Maturity Plans
Birla Sun Life FTP - Series MO (G) 1099 Days 09-Apr-15 15-Apr-15 5000
DSP BR Dual Advantage Fund - Sr.37 - 36Mth (D) 36 Months 06-Apr-15 20-Apr-15 5000
ICICI Pru FMP - Series 76 - 1134Days Plan Y-Dir(D) 1134 Days 10-Apr-15 15-Apr-15 5000
Reliance Dual Advantage FTF - VII - Plan E (D) 1102 Days 15-Apr-15 29-Apr-15 5000
Reliance Fixed Horizon - XXVIII - Sr.16 (G) 1151 Days 09-Apr-15 15-Apr-15 5000
Tata FMP - Sr.49 - Scheme C (G) 1099 Days 10-Apr-15 15-Apr-15 5000
Income Funds
Birla Sun Life Corporate Bond Fund (G) 30-Mar-15 13-Apr-15 5000
Mutual Fund NEWS:
UTI Mutual Fund has announced change in exit load structure under the following schemes, with effect from 06 April 2015. If exited less than one year, the exit load will be 1.00% and the exit load will be Nil. Edelweiss Mutual Fund has announced change in exit load structure under Edelweiss Diversified Growth Equity Top 100 (E.D.G.E. Top 100) Fund and Edelweiss Select Midcap Fund, with effect from 10 April 2015. If the units are redeemed / switched-out on or before 365 days from the date of allotment, the exit load charge will be 1.00%. If the units are redeemed / switched-out after 365 days from the date of allotment, the revised exit load structure will be nil. Indiabulls Mutual Fund has announced change in exit load under Indiabulls Income Fund (an open ended debt scheme) and Indiabulls Gilt Fund (an open ended gilt scheme), with effect from 13 April 2015. If redeemed / switched out within 1 year from the date of allotment, the exit load will be 1% and if redeemed / switched out after 1 year from the date of allotment, the exit load will be Nil.

RETAIL RESEARCH
Global Updates: (Source: AMC Newsletters) India:
• Rating agency Moody’s has affirmed India’s sovereign rating at BAA3, but raised the rating outlook to ‘positive’ from ‘stable’. However it cautioned that unless the country’s banking system woes were resolved, its credit profile would remain constrained.
• Reserve Bank of India (RBI) Governor Raghuram Rajan kept policy rate status quo (repo rate,cash reserve ratio stay unchanged).The repo rate, at which RBI lends to the banking system, will continue to be at 7.50 per cent and the cash reserve ratio, which is the amount of deposits parked with the central bank, will remain at 4 per cent
• Services sector growth in India eased marginally due to rise in input costs during March, but new business orders showed improvement and staffing levels of the companies also increased. The HSBC India Services Business Activity Index, which tracks changes in activity at Indian service companies on a monthly basis, eased to 53.0 in March from 53.9 in February, indicative of a moderate rate of expansion that was slightly weaker than in the prior month.
• India’s industrial production grew 5% from a year earlier, accelerating from a 2.8% increase in January and topping market expectations of a 3.3% increase. • India's foreign exchange reserves surged for the third consecutive week as overseas investors betting heavily on India growth story and pouring in dollars, prompting Reserve Bank of India
tobuy it from open market to keep the local currency within a tight band. RBI added $1.628 billionin the forex coffer in the week to April 3 to take the total reserves to $343 billion. Asia:
• China's price pressures held steady at the consumer end but continued the deflation trend for wholesalers overall without weakening the likelihood of additional government stimulus. The
consumer price index increased 1.4% from a year earlier in March. • The Bank of Japan has kept monetary policy on hold even as its initial two-year deadline for increasing inflation to 2 per cent passed with price rises stuck at zero. • Japan’s current account balance posted its biggest surplus in more than three years in February, as the sharp depreciation of the yen boosted income from abroad while a downturn in global
crude oil prices pushed down imports. • The surplus stood at 1,440.1 billion yen, the largest since 1,614.5 billion yen registered in September 2011 — six months after a devastating quake tsunami disaster triggered the Fukushima
nuclear crisis. • Japan’s foreign-currency reserves dipped in March and snapped a three-month-long series of increases, as the central bank’s gold holdings and foreign investments declined during the period. • Producer price inflation in the euro zone rose for the first time in five months in February, easing concerns over the threat of deflation. Producer prices fell 1.1% in January, whose figure was
revised from a previouslyreported decline of 0.9%. US:
• The number of Americans seeking first-time unemployment benefits rose last week but remained at historically low levels that are consistent with job growth. Initial jobless claims increased by 14,000 to a seasonally adjusted 281,000 in the week ended April 4.
• Consumer confidence increased last week to an almost eight-year high as Americans viewed the U.S. economy in a more favorable light and said it was better time to spend. The Bloomberg Consumer Comfort Index climbed to 47.9 in the period ended April 5, the highest level since May 2007, from 46.2.
• The US services sector expanded in March at its fastest pace since September. Markit's reading of new business at service companies in March roseto 58.3 from 57.1 in February. • The expansion in the U.S. nonmanufacturing sector continued, but at a slightly slower pace lastmonth, according to data released by the Institute for Supply Management. The ISM’snon-
manufacturing purchasing managers index came in at 56.5 in March from 56.9 in February. • U.S. job openings rose to a 14-year high of 5.1 million in February and beat estimates. • U.S. import prices fell in March as rising petroleum costs were offset by declining prices for other goods, a sign of muted inflation that supports the view the Federal Reserve will probably
notraise interest rates in June UK:
• The eurozone services business activity index for March - a key survey of activity in the sector -reached 54.2, lower than an earlier "flash" reading of 54.3 but up from 53.7 the previous month. • The final reading for the French services PMI was 52.4, down from an initial flash reading of 52.8and lower than 53.4 in February although still firmly in growth territory. • The German services PMI, at 55.4 for March, was also lower than a flash reading of 55.3,although the rate of expansion was the strongest in six months.

RETAIL RESEARCH
• UK industrial production edged up by a lower-than-expected 0.1 per cent month on month inFebruary, following a disappointing start to the year, suggesting slower GDP growth in the firstquarter of this year. Industrial output contracted 0.1 per cent in January, disappointing themarket which had been anticipating a 0.2 per cent gain.
• U.K. manufacturing production rose to a seasonally adjusted 0.4%, from -0.6% in the precedingmonth whose figure was revised down from -0.5%.
Economic Calendar: Date Country Event Period Frequency Unit Previous
13-04-2015 India CPI Inflation - Combined (YoY Chg) Mar Monthly pct 13-04-2015 13-04-2015 India Foreign merchandise trade Exports (YoY Chg) Mar Monthly pct 13-04-2015 13-04-2015 India Foreign merchandise trade Imports (YoY Chg) Mar Monthly pct 13-04-2015 13-04-2015 India GSM mobile subscriber Mar Monthly Million 13-04-2015 14-04-2015 India WPI Inflation (YoY Chg) New Series (Base 2004-05) Mar Monthly pct 14-04-2015 15-04-2015 India 91 day T- Bills auction of Rs 80 bln (cut-off yld) Weekly pct 15-04-2015 15-04-2015 India Reserve Money (change on year) Wk to Apr 10 Weekly pct 15-04-2015 15-04-2015 India M3 (YoY Chg) Wk to Apr 3 Fortnightly pct 15-04-2015 17-04-2015 India FX reserve (change on wk) Wk to Apr 10 Weekly $ mln 17-04-2015 13-04-2015 Japan BoJ MPB Minutes Mar,2015 Monthly 13-04-2015 13-04-2015 Japan Machine Orders (M/M Change) Feb, 2015 Monthly Percent 13-04-2015 13-04-2015 Japan Producer Price Index (Month over Month) Mar, 2015 Monthly Percent 13-04-2015 20-04-2015 Japan Tertiary Index (Year over Year) Feb, 2015 Yearly Percent 20-04-2015 14-04-2015 UK CPI (Month over Month) Mar, 2015 Monthly Percent 14-04-2015 17-04-2015 UK Labour Market Report (ILO Unemployment) Mar, 2015 Monthly Percent 17-04-2015 13-04-2015 US Treasury Budget (Treasury Budget - Level) Mar, 2015 Monthly Billion 13-04-2015 14-04-2015 US Redbook (Store Sales Y/Y change) wk4/11, 2015 Yearly Percent 14-04-2015 14-04-2015 US Business Inventories (Inventories - M/M change) Feb, 2015 Monthly Percent 14-04-2015 15-04-2015 US MBA Purchase Applications wk4/10, 2015 Weekly 15-04-2015 15-04-2015 US Empire State Mfg Survey (General Business Conditions Index - Level) Apr, 2015 Monthly 15-04-2015 15-04-2015 US Industrial Production (Manufacturing - M/M) Mar, 2014 Monthly Percent 15-04-2015 15-04-2015 US Housing Market Index (Housing Market Index) Apr, 2015 Monthly 15-04-2015 15-04-2015 US EIA Petroleum Status Report wk4/10, 2015 Weekly 15-04-2015 16-04-2015 US Jobless Claims wk4/11, 2015 Weekly 16-04-2015 16-04-2015 US Bloomberg Consumer Comfort Index (Level) wk4/12, 2015 Weekly 16-04-2015 16-04-2015 US EIA Natural Gas Report wk4/10, 2015 Weekly 16-04-2015 17-04-2015 US Fed Balance Sheet wk4/15, 2015 Weekly 17-04-2015 17-04-2015 US Money Supply wk4/6, 2015 Weekly 17-04-2015 17-04-2015 US Consumer Sentiment Apr, 2015 Monthly 17-04-2015 17-04-2015 US Consumer Sentiment (Sentiment Index - Level) Apr, 2015 Monthly 17-04-2015 17-04-2015 US Leading Indicators Mar, 2015 Monthly 17-04-2015 20-04-2015 US Chicago Fed National Activity Index (3 Month Moving Average) Mar, 2015 Monthly 20-04-2015
RETAIL RESEARCH
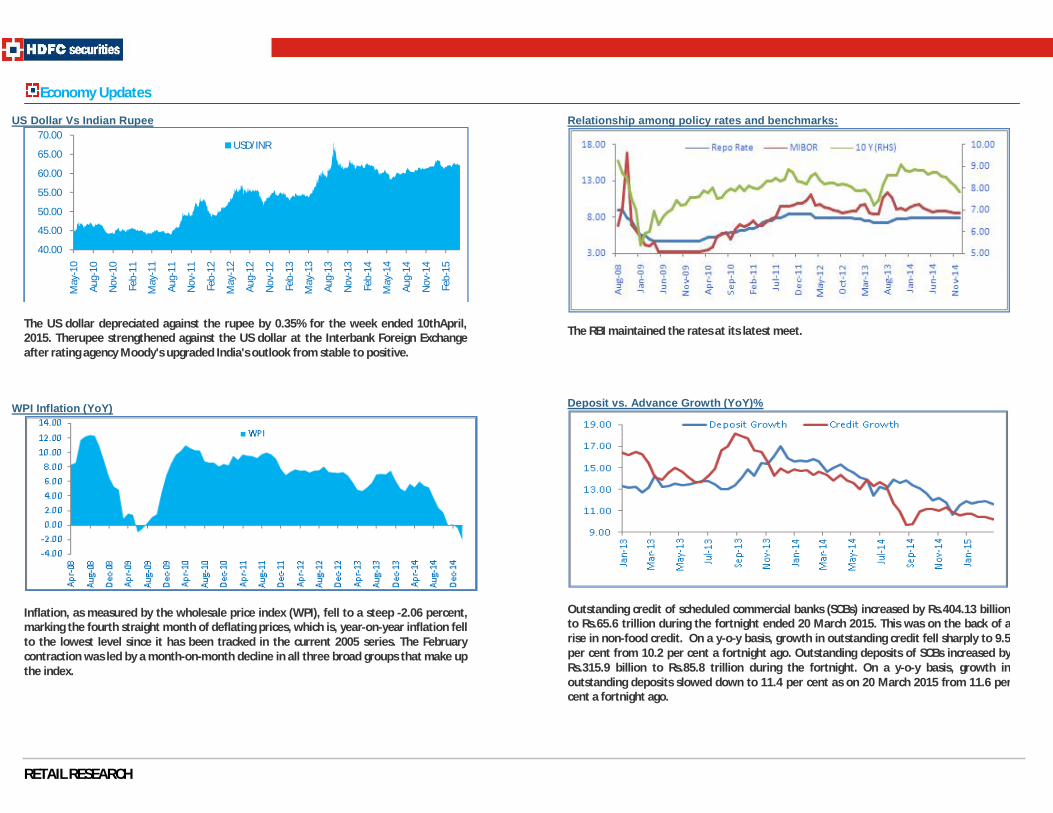
Relationship among policy rates and benchmarks:
The RBI maintained the rates at its latest meet. Deposit vs. Advance Growth (YoY)%
Outstanding credit of scheduled commercial banks (SCBs) increased by Rs.404.13 billion to Rs.65.6 trillion during the fortnight ended 20 March 2015. This was on the back of a rise in non-food credit. On a y-o-y basis, growth in outstanding credit fell sharply to 9.5 per cent from 10.2 per cent a fortnight ago. Outstanding deposits of SCBs increased by Rs.315.9 billion to Rs.85.8 trillion during the fortnight. On a y-o-y basis, growth in outstanding deposits slowed down to 11.4 per cent as on 20 March 2015 from 11.6 per cent a fortnight ago.
Economy Updates
US Dollar Vs Indian Rupee
The US dollar depreciated against the rupee by 0.35% for the week ended 10thApril, 2015. Therupee strengthened against the US dollar at the Interbank Foreign Exchange after rating agency Moody's upgraded India's outlook from stable to positive.
WPI Inflation (YoY)
Inflation, as measured by the wholesale price index (WPI), fell to a steep -2.06 percent, marking the fourth straight month of deflating prices, which is, year-on-year inflation fell to the lowest level since it has been tracked in the current 2005 series. The February contraction was led by a month-on-month decline in all three broad groups that make up the index.
40.00
45.00
50.00
55.00
60.00
65.00
70.00
May
-10
Aug-
10
Nov
-10
Feb-
11
May
-11
Aug-
11
Nov
-11
Feb-
12
May
-12
Aug-
12
Nov
-12
Feb-
13
May
-13
Aug-
13
Nov
-13
Feb-
14
May
-14
Aug-
14
Nov
-14
Feb-
15
USD/INR

RETAIL RESEARCH
Corporate Bonds Spread Vs Gilt Securities:
Corporate bond yields rose last week. The one year and 5 year AAA credit spreads fell by 9 basis points each. Liquidity support from RBI (Bn. Rs)
The net infusion from the LAF window was a daily average of Rs.3,326 crore for last week (Rs. 20,677 crore in previous week). Infusions via the MSF route averaged Rs. 797Cr.The inter-bank call rates traded around 7.58% levels on Friday.The CBLO rates were positioned at 7.45% level.
7.00
7.50
8.00
8.50
9.00
9.50
0
50
100
150
200
Jul…
Se…
No… Ja
…
M…
M…
Jul…
Se…
No… Ja
…
M…
M…
Jul…
Se…
No… Ja
…
M…
1 Year AAA 2 Year AAA 5 Year AAA 10 Y Yield (%) (RHS)
-1,000
,0
1,000
2,000
3,000
Jul-1
3
Aug-
13
Sep-
13
Nov
-13
Dec-
13
Feb-
14
Mar
-14
May
-14
Jun-
14
Aug-
14
Sep-
14
Nov
-14
Dec-
14
Feb-
15
Mar
-15
Repo Reverse RepoTerm Repo Term Reverse Repo
Money Stock (M3) (YoY) (%)
Money Supply M3 in India increased to 105321.20 INR Billion in March of 2015 from 104155.85 INR Billion in February of 2015. Fortnightly data ended March 20, 2015 shows India M3 Money Supply dipped from previous 11.3% to 11.1% (YoY).
Foreign Exchange Reserves (mn of USD)
India's foreign exchange reserves increased by $1.63bn to $343.0bn for the week ended April 03.
RETAIL RESEARCH
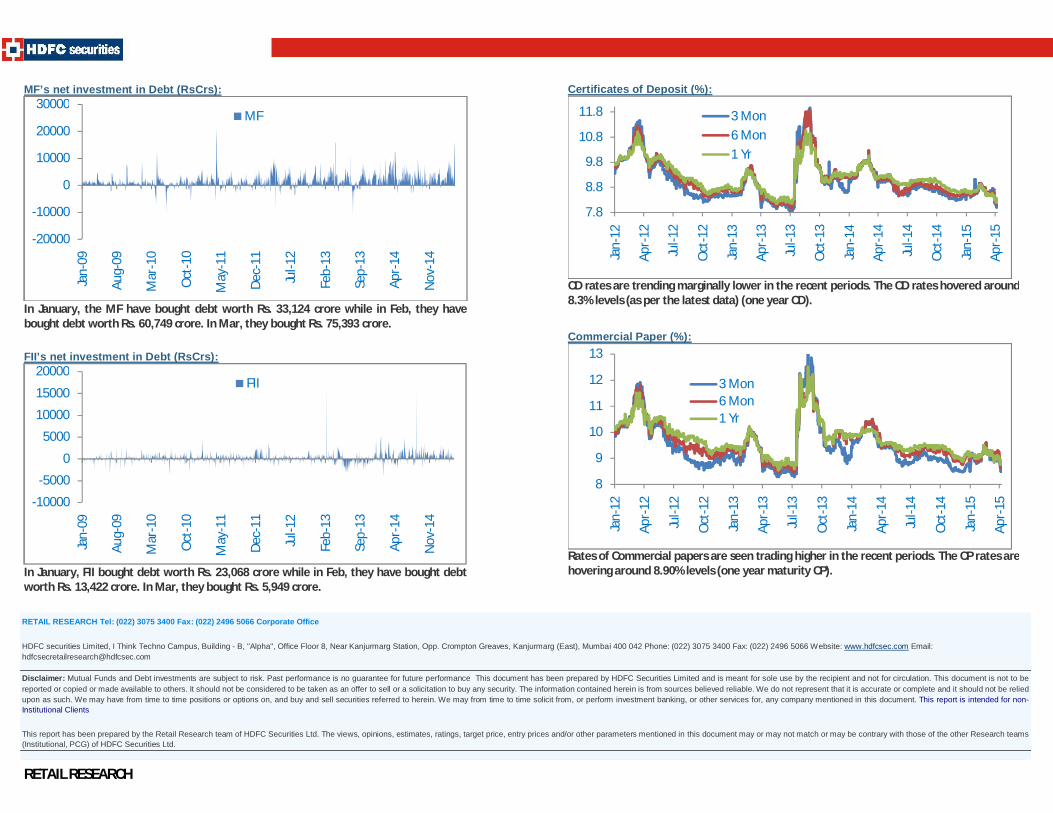
Certificates of Deposit (%):
CD rates are trending marginally lower in the recent periods. The CD rates hovered around 8.3% levels (as per the latest data) (one year CD). Commercial Paper (%):
Rates of Commercial papers are seen trading higher in the recent periods. The CP rates are hovering around 8.90% levels (one year maturity CP).
7.8
8.8
9.8
10.8
11.8
Jan-
12
Apr-
12
Jul-1
2
Oct
-12
Jan-
13
Apr-
13
Jul-1
3
Oct
-13
Jan-
14
Apr-
14
Jul-1
4
Oct
-14
Jan-
15
Apr-
15
3 Mon6 Mon1 Yr
8
9
10
11
12
13
Jan-
12
Apr-
12
Jul-1
2
Oct
-12
Jan-
13
Apr-
13
Jul-1
3
Oct
-13
Jan-
14
Apr-
14
Jul-1
4
Oct
-14
Jan-
15
Apr-
15
3 Mon6 Mon1 Yr
MF’s net investment in Debt (RsCrs):
In January, the MF have bought debt worth Rs. 33,124 crore while in Feb, they have bought debt worth Rs. 60,749 crore. In Mar, they bought Rs. 75,393 crore.
FII’s net investment in Debt (RsCrs):
In January, FII bought debt worth Rs. 23,068 crore while in Feb, they have bought debt worth Rs. 13,422 crore. In Mar, they bought Rs. 5,949 crore.
-20000
-10000
0
10000
20000
30000
Jan-
09
Aug-
09
Mar
-10
Oct
-10
May
-11
Dec-
11
Jul-1
2
Feb-
13
Sep-
13
Apr-
14
Nov
-14
MF
-10000
-5000
0
5000
10000
15000
20000
Jan-
09
Aug-
09
Mar
-10
Oct
-10
May
-11
Dec-
11
Jul-1
2
Feb-
13
Sep-
13
Apr-
14
Nov
-14
FII
RETAIL RESEARCH Tel: (022) 3075 3400 Fax: (022) 2496 5066 Corporate Office
HDFC securities Limited, I Think Techno Campus, Building - B, "Alpha", Office Floor 8, Near Kanjurmarg Station, Opp. Crompton Greaves, Kanjurmarg (East), Mumbai 400 042 Phone: (022) 3075 3400 Fax: (022) 2496 5066 Website: www.hdfcsec.com Email: [email protected]
Disclaimer: Mutual Funds and Debt investments are subject to risk. Past performance is no guarantee for future performance This document has been prepared by HDFC Securities Limited and is meant for sole use by the recipient and not for circulation. This document is not to be reported or copied or made available to others. It should not be considered to be taken as an offer to sell or a solicitation to buy any security. The information contained herein is from sources believed reliable. We do not represent that it is accurate or complete and it should not be relied upon as such. We may have from time to time positions or options on, and buy and sell securities referred to herein. We may from time to time solicit from, or perform investment banking, or other services for, any company mentioned in this document. This report is intended for non-Institutional Clients
This report has been prepared by the Retail Research team of HDFC Securities Ltd. The views, opinions, estimates, ratings, target price, entry prices and/or other parameters mentioned in this document may or may not match or may be contrary with those of the other Research teams (Institutional, PCG) of HDFC Securities Ltd.


