30.07.2007 InVision Software AG Research Note fileVodafone, Deutsche Telekom or IKEA are testimony...
40
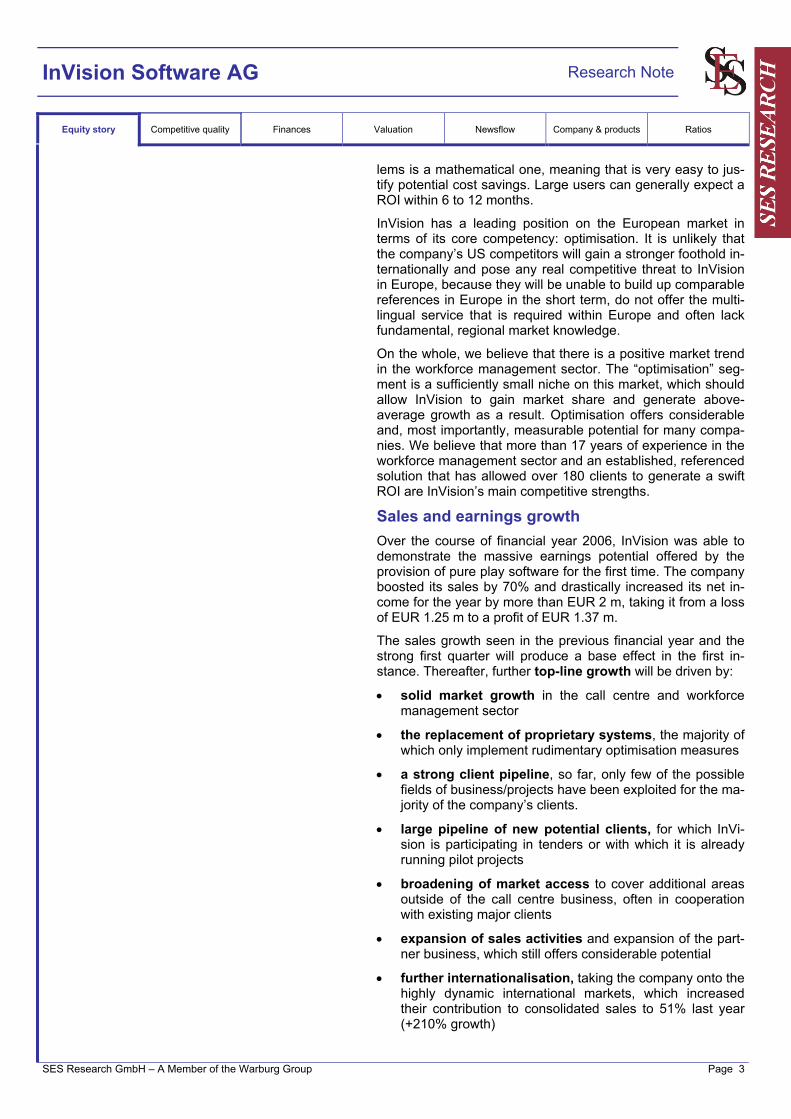
30.07.2007 InVision Software AG Research Note SES Research GmbH – A Member of the Warburg Group Page 1 Buy Price target: EUR 40.0 (initial coverage) The ideal time to get the show on the road InVision is a genuine pure play software provider for workforce management solutions (with royalties accounting for 57% of sales in 2006). The key strength of InVision’s solution lies in staffing requirement forecasts and the subsequent flexible optimisation of staff deployment. The software tackles mathematical optimisation issues that are extremely difficult to solve. Product specifications of this nature clearly set InVision apart from the competition and explain the com- pany’s strong growth. Over 180 clients, including top names such as Vodafone, Deutsche Telekom or IKEA are testimony to the high competitive quality of InVision’s solutions, which generally provide a return on investment within 6-12 months. InVision’s solutions allow its clients to: • cut costs by reducing instances of excess cover, • boost productivity by reducing instances of insufficient cover, • increase employee satisfaction, for example by implementing flexible schedules that employees have a say in Growth is driven primarily by: the replacement of proprietary sys- tems; a strong client pipeline; the broadening of market access to cover additional areas; the expansion of the company’s sales activi- ties and of the partner business; further internationalisation, taking the company onto the very dynamic international markets, and the planned strengthening of the company’s capital base as a growth catalyst. In financial year 2006, InVision reported growth of around 70% and an EBIT margin of 18% (EUR 1.95 m). This means that the company’s operating result was boosted by EUR 3.6 m as against the prior-year, when it still reported a loss. This highlights a key issue for pure play software providers: InVision has completed the main development work for its product and has a strong client basis that guarantees regu- lar maintenance income. Further increases in sales will have a clearly above-average impact on the EBIT margin, with even this year’s figures expected to confirm this trend (extremely high scalability). As a result, we expect the EBIT margin to increase from 18.2% to 23.0% (EUR 4.15 m) in financial year 207, with sales growth of 68%. The figures for Q1/07 support this assumption. On June 14, 2007, InVision was listed successfully at the stock exchange which will support further growth. The calculated valuation range for the share is EUR 38 to EUR 46. We initiate the coverage of InVision with the rating “BUY”. Our PT is EUR 40. Bloomberg: IVX GR Price: 32.65 Reuters: IVXG.DE Tech-All: 1091.79 ISIN DE00585969 Internet: www.InVision.de Segment: Prime Standard Sector: Software 30,5 31 31,5 32 32,5 33 33,5 34 34,5 35 35,5 06/07 07/07 07/07 InVision Software Tech-All (relativ) Share data: Bloomberg 27.07.2007 / Closing price High /Low 52 w: EUR 34.59 / 32.00 Market cap. EUR 72.97 m No. of shares: 2.24 m Shareholders: Peter Bollenbeck 17,00% Matthias Schroer 17,00% Armand Zohari 17,00% InVision Holding GmbH 6,29% Free Float 4,71% Calendar: H1/2007 14.08.2007 Figures Q3/07 14.11.2007 Analysis: SES Research Publication: 30.07.2007 Felix Ellmann (Analyst) +49-(0)40 309537-12 Institutional Client Contact: M.M.Warburg & CO +49-(0)40 3282-2636 Institutional Equity Sales Christian Alisch +49-(0)40 3282-2667 Thomas Dinges +49-(0)40 3282-2635 Matthias Fritsch +49-(0)40 3282-2696 Dr. James F. Jackson +49-(0)40 3282-2664 Oliver Jürgens +49-(0)40 3282-2666 Benjamin Kassen +49-(0)40 3282-2630 Marina Konzog +49-(0)40 3282-2669 Linn Lenné +49-(0)40 3282-2695 Dirk Rosenfelder +49-(0)40 3282-2692 Marco Schumann +49-(0)40 3282-2665 Andreas Wessel +49-(0)40 3282-2663 Sales Trading Oliver Merckel +49-(0)40 3282-2634 Thekla Struve +49-(0)40 3282-2668 Gudrun Bolsen +49-(0)40 3282-2679 Nils Carstens +49-(0)40 3282-2701 Jörg Treptow +49-(0)40 3282-2658 Patrick Schepelmann +49-(0)40 3282-2700 Sales Assistance Wiebke Möller +49-(0)40 3282-2703 Barbara C. Effler (Head of Equities) Fiscal year ending 12/05 12/06 12/07e 12/08e 12/09e Key figures per share in EUR, all other in m. EUR, Price: 32,65 EUR Sales 6.4 10.7 18.0 25.6 32.1 Gross margin 92.2% 99.2% 99.0% 99.0% 99.0% EBITDA -1.5 2.0 4.3 7.2 9.6 EBITDA-margin -24.3% 18.9% 23.8% 28.0% 29.8% EBIT -1.6 1.9 4.2 7.0 9.3 EBIT-margin -25.6% 18.2% 23.0% 27.2% 29.0% Net Income -1.2 1.4 2.6 4.6 6.4 Operating Cash Flow -0.6 0.61 1.19 2.08 2.87 DPS 0.00 0.00 0.00 0.00 0.00 Dividend Yield 0.0% 0.0% 0.0% 0.0% 0.0% EV/Sales 8.09 4.81 2.86 2.02 1.61 EV/EBITDA n.m. 25.46 12.02 7.22 5.40 EV/EBIT n.m. 26.50 12.44 7.43 5.55 PER n.m. 53.52 27.44 15.70 11.38 ROCE -877.2% 187.6% 28.9% 24.1% 26.8% Adj. Free Cash Flow Yield -2.1% 2.6% 8.2% 13.7% 18.3%
Transcript of 30.07.2007 InVision Software AG Research Note fileVodafone, Deutsche Telekom or IKEA are testimony...

30.07.2007 InVision Software AG Research Note
SES Research GmbH – A Member of the Warburg Group Page 1
Buy Price target: EUR 40.0
(initial coverage) The ideal time to get the show on the road
InVision is a genuine pure play software provider for workforce management solutions (with royalties accounting for 57% of sales in 2006). The key strength of InVision’s solution lies in staffing requirement forecasts and the subsequent flexible optimisation of staff deployment. The software tackles mathematical optimisation issues that are extremely difficult to solve. Product specifications of this nature clearly set InVision apart from the competition and explain the com-pany’s strong growth. Over 180 clients, including top names such as Vodafone, Deutsche Telekom or IKEA are testimony to the high competitive quality of InVision’s solutions, which generally provide a return on investment within 6-12 months. InVision’s solutions allow its clients to:
• cut costs by reducing instances of excess cover,
• boost productivity by reducing instances of insufficient cover,
• increase employee satisfaction, for example by implementing flexible schedules that employees have a say in
Growth is driven primarily by: the replacement of proprietary sys-tems; a strong client pipeline; the broadening of market access to cover additional areas; the expansion of the company’s sales activi-ties and of the partner business; further internationalisation, taking the company onto the very dynamic international markets, and the planned strengthening of the company’s capital base as a growth catalyst.
In financial year 2006, InVision reported growth of around 70% and an EBIT margin of 18% (EUR 1.95 m). This means that the company’s operating result was boosted by EUR 3.6 m as against the prior-year, when it still reported a loss. This highlights a key issue for pure play software providers: InVision has completed the main development work for its product and has a strong client basis that guarantees regu-lar maintenance income. Further increases in sales will have a clearly above-average impact on the EBIT margin, with even this year’s figures expected to confirm this trend (extremely high scalability). As a result, we expect the EBIT margin to increase from 18.2% to 23.0% (EUR 4.15 m) in financial year 207, with sales growth of 68%. The figures for Q1/07 support this assumption.
On June 14, 2007, InVision was listed successfully at the stock exchange which will support further growth. The calculated valuation range for the share is EUR 38 to EUR 46. We initiate the coverage of InVision with the rating “BUY”. Our PT is EUR 40.
Bloomberg: IVX GR Price: 32.65Reuters: IVXG.DE Tech-All: 1091.79ISIN DE00585969 Internet: www.InVision.de Segment: Prime Standard Sector: Software
30,5
31
31,5
32
32,5
33
33,5
34
34,5
35
35,5
06/07 07/07 07/07
InVision Software Tech-All (relativ)
Share data: Bloomberg 27.07.2007 / Closing price High /Low 52 w: EUR 34.59 / 32.00Market cap. EUR 72.97 mNo. of shares: 2.24 m Shareholders: Peter Bollenbeck 17,00% Matthias Schroer 17,00% Armand Zohari 17,00%
InVision Holding GmbH 6,29% Free Float 4,71% Calendar: H1/2007 14.08.2007 Figures Q3/07 14.11.2007 Analysis: SES Research Publication: 30.07.2007Felix Ellmann (Analyst) +49-(0)40 309537-12 Institutional Client Contact: M.M.Warburg & CO
+49-(0)40 3282-2636Institutional Equity SalesChristian Alisch +49-(0)40 3282-2667Thomas Dinges +49-(0)40 3282-2635Matthias Fritsch +49-(0)40 3282-2696Dr. James F. Jackson +49-(0)40 3282-2664Oliver Jürgens +49-(0)40 3282-2666Benjamin Kassen +49-(0)40 3282-2630Marina Konzog +49-(0)40 3282-2669Linn Lenné +49-(0)40 3282-2695Dirk Rosenfelder +49-(0)40 3282-2692Marco Schumann +49-(0)40 3282-2665Andreas Wessel +49-(0)40 3282-2663Sales TradingOliver Merckel +49-(0)40 3282-2634Thekla Struve +49-(0)40 3282-2668Gudrun Bolsen +49-(0)40 3282-2679Nils Carstens +49-(0)40 3282-2701Jörg Treptow +49-(0)40 3282-2658Patrick Schepelmann +49-(0)40 3282-2700Sales AssistanceWiebke Möller +49-(0)40 3282-2703
Barbara C. Effler (Head of Equities)
Fiscal year ending 12/05 12/06 12/07e 12/08e 12/09e
Key figures per share in EUR, all other in m. EUR, Price: 32,65 EURSales 6.4 10.7 18.0 25.6 32.1Gross margin 92.2% 99.2% 99.0% 99.0% 99.0%EBITDA -1.5 2.0 4.3 7.2 9.6EBITDA-margin -24.3% 18.9% 23.8% 28.0% 29.8%EBIT -1.6 1.9 4.2 7.0 9.3EBIT-margin -25.6% 18.2% 23.0% 27.2% 29.0%Net Income -1.2 1.4 2.6 4.6 6.4Operating Cash Flow -0.6 0.61 1.19 2.08 2.87DPS 0.00 0.00 0.00 0.00 0.00Dividend Yield 0.0% 0.0% 0.0% 0.0% 0.0%EV/Sales 8.09 4.81 2.86 2.02 1.61EV/EBITDA n.m. 25.46 12.02 7.22 5.40EV/EBIT n.m. 26.50 12.44 7.43 5.55PER n.m. 53.52 27.44 15.70 11.38ROCE -877.2% 187.6% 28.9% 24.1% 26.8%Adj. Free Cash Flow Yield -2.1% 2.6% 8.2% 13.7% 18.3%

InVision Software AG Research Note
Equity story Competitive quality Finances Valuation Newsflow Company & products Ratios
SES Research GmbH – A Member of the Warburg Group Page 2
Company background InVision AG was formed in 1995. The two members of the company’s current Executive Board are also the company’s founders. The company is a pure play software provider with income components that are typical for this sector: royalties (57%), maintenance (22%) and services (21%). Over the past few years, the company has demonstrated strong growth, and was able to report top-line growth of around 70% in 2006 fol-lowing a year of consolidation in 2005. The EBIT margin climbed to just shy of 20%.
As a product provider, InVision offers unique technology for the optimisation of corporate staff deployment. The core ele-ment of this technology is a complex solution that can auto-matically produce rotas with a high degree of optimisation us-ing various optimisation procedures. The solutions are particu-larly valuable in sectors in which staff deployment optimisation on the basis of concrete requirements and demand forecasts is exceptionally important. As a result, InVision is active on a clear niche market that allows the company to generate high returns.
A large number of top-name clients show that InVision is a leader on this niche market. Its clients include absolute blue chips such as Deutsche Telekom, Vodafone, IKEA or freenet. In addition to attracting new clients, the expansion of the com-pany’s business with its existing clients alone offers enormous potential for InVision.
Competitive and business quality Personnel planning is a traditional field of activity in the IT sec-tor. Since this market is generally divided and the growth rates are only moderate in the industrialised nations, the only com-panies that can report strong growth are those that offer sub-stantially superior solutions for highly specific areas of applica-tion. This applies in InVision’s case.
InVision specialises in a specific personnel planning segment, namely the (mathematical) optimisation of staff development. There is considerable cost-cutting potential in this area through the implementation of optimisation solutions. Clear evidence of this potential can be provided to competitors and potential clients, because the solution to the optimisation prob-
InVision
2006 2007e 2008e 2009eFiscal year end 31.12.2006 31.12.2007 31.12.2008 31.12.2009
Sales 10,733 18,049 25,581 32,077change yoy 68.1% 68.2% 41.7% 25.4%Gross Profit 10,647 17,869 25,326 31,756in % of Sales 99.2% 99.0% 99.0% 99.0%EBITDA 2,029 4,296 7,155 9,559EBIT 1,949 4,151 6,950 9,302Net Income 1,374 2,648 4,643 6,407
Table 1; Source: SES Research
InVision Software AG Research Note
Equity story Competitive quality Finances Valuation Newsflow Company & products Ratios
SES Research GmbH – A Member of the Warburg Group Page 3
lems is a mathematical one, meaning that is very easy to jus-tify potential cost savings. Large users can generally expect a ROI within 6 to 12 months.
InVision has a leading position on the European market in terms of its core competency: optimisation. It is unlikely that the company’s US competitors will gain a stronger foothold in-ternationally and pose any real competitive threat to InVision in Europe, because they will be unable to build up comparable references in Europe in the short term, do not offer the multi-lingual service that is required within Europe and often lack fundamental, regional market knowledge.
On the whole, we believe that there is a positive market trend in the workforce management sector. The “optimisation” seg-ment is a sufficiently small niche on this market, which should allow InVision to gain market share and generate above-average growth as a result. Optimisation offers considerable and, most importantly, measurable potential for many compa-nies. We believe that more than 17 years of experience in the workforce management sector and an established, referenced solution that has allowed over 180 clients to generate a swift ROI are InVision’s main competitive strengths.
Sales and earnings growth Over the course of financial year 2006, InVision was able to demonstrate the massive earnings potential offered by the provision of pure play software for the first time. The company boosted its sales by 70% and drastically increased its net in-come for the year by more than EUR 2 m, taking it from a loss of EUR 1.25 m to a profit of EUR 1.37 m.
The sales growth seen in the previous financial year and the strong first quarter will produce a base effect in the first in-stance. Thereafter, further top-line growth will be driven by:
• solid market growth in the call centre and workforce management sector
• the replacement of proprietary systems, the majority of which only implement rudimentary optimisation measures
• a strong client pipeline, so far, only few of the possible fields of business/projects have been exploited for the ma-jority of the company’s clients.
• large pipeline of new potential clients, for which InVi-sion is participating in tenders or with which it is already running pilot projects
• broadening of market access to cover additional areas outside of the call centre business, often in cooperation with existing major clients
• expansion of sales activities and expansion of the part-ner business, which still offers considerable potential
• further internationalisation, taking the company onto the highly dynamic international markets, which increased their contribution to consolidated sales to 51% last year (+210% growth)

InVision Software AG Research Note
Equity story Competitive quality Finances Valuation Newsflow Company & products Ratios
SES Research GmbH – A Member of the Warburg Group Page 4
• the strengthening of the capital basis has the ability to act as a growth catalyst.
Earnings growth is determined primarily by the high scalabil-ity of income in the software licensing business. The following factors play a key role in explaining the bottom-line develop-ment:
• Reduction of key relative cost items (e.g. development, overheads, others). InVision’s product has already been developed. Further licence sales will now no longer be offset by development costs on a comparable scale to that seen in the past.
• Expansion of the partner business and, as a result, the realisation of higher margins due to a relatively high pro-portion of royalties
• Ongoing expansion of the installed base, and as a result, increase in maintenance income.
As a result, we have arrived at the following sales and earn-ings forecast:
Valuation The calculated valuation range of between EUR 38 m and EUR 46 m is based on the following valuation methods (under consideration of capital inflow of IPO, post-money):
• The adjusted Free Cash Flow Yield for 2008e points to-wards a fair value of EUR 41 m with substantial upside potential in subsequent years (2009e: EUR 52,20 m)
• The DCF model, based on a beta of 1.5, a risk-free rate of 4.09%, a WACC of 11.5% and a perpetual growth rate of 2% signals a value of EUR 38 m. Nevertheless, we expect
InVision - P&L
2006 2007e 2008e 2009e
Sales 10,733 18,049 25,581 32,077Change yoy 68.1% 68.2% 41.7% 25.4%
- thereof licenses 6,103 10,387 15,093 18,279- thereof maintenance 2,347 3,549 5,145 7,214- thereof services 2,283 4,113 5,343 6,584
Total Sales 10,733 18,049 25,581 32,077
Gross Profit 10,647 17,869 25,326 31,756in % of Total Sales 99.2% 99.0% 99.0% 99.0%
EBIT 1,949 4,151 6,950 9,302
Net Income 1,374 2,648 4,643 6,407Change yoy n.m. 92.7% 75.3% 38.0%in % of Total Sales 12.8% 14.7% 18.1% 20.0%
Table 2; Source: SES Research

InVision Software AG Research Note
Equity story Competitive quality Finances Valuation Newsflow Company & products Ratios
SES Research GmbH – A Member of the Warburg Group Page 5
the margin to drop in the long term and also predict a con-siderable slowdown in growth (market saturation).
This valuation approach is supported by three peer groups (comparison on EV basis, the calculated fair values include net financial item:
• The comparison with listed German pure play software providers indicates an EV of EUR 40 m (2007 EV/EBIT)
• The comparison with listed US competitors points towards an EV of EUR 42 m (2007 EV/EBIT)
• The comparison with transaction multiplies for takeovers in the sector indicates an EV of EUR 46 m (2007 EV/EBIT).
Newsflow We expect InVision to report considerable sales growth and a clearly above-average increase in earnings this year. The fourth quarter, which is traditionally strong in this sector, should provide particular momentum.
The most recent transactions executed by US peer companies have had a positive effect on the valuation. InVision should also continue to benefit from this.
In the medium term, the company could even make a number of smaller acquisitions, which could also raise InVision’s pro-file.

InVision Software AG Research Note
Equity story Competitive quality Finances Valuation Newsflow Company & products Ratios
SES Research GmbH – A Member of the Warburg Group Page 6
IT in personnel planning
Personnel planning is a traditional field of activity in the IT sec-tor. Staff planning and time management (the recording, struc-turing and processing of personnel-relevant data) is already offered by a large number of companies (e.g. ATOSS). ERP software providers (e.g. SAP), providers of access control sys-tems (e.g. Primion) or payroll system providers (e.g. P&I) also work in the segments of this market that are relevant to per-sonnel planning, at least in part.
Since this market is generally divided and the growth rates are now only moderate in the industrialised nations, the only com-panies that can report strong growth are those that have spe-cialised in particular market segments and offer substantially superior solutions in these segments. This applies in InVi-sion’s case.
The InVision solution
InVision specialises in a highly specific segment of personnel planning, namely the optimisation of personnel deployment in certain segments that fulfil the following two core require-ments:
• Personnel requirements can be easily forecasted and, where appropriate, can be tracked via models (e.g. call centres)
• Personal deployment is considerable, meaning that rela-tively minor optimisation successes can have a relatively large impact in terms of savings (large clients)
If these two requirements are met, the use of optimisation so-lutions can produce substantial cost-cutting potential. After all, while any switch from manual to IT-based personnel deploy-ment optimisation (using solutions produced by the company’s competitors) could reduce costs in principle, InVision’s highly complex mathematical optimisation methods produce results that, according to information released by the company itself, outperform those offered by the competition.
Where it is possible to plan and forecast personnel deploy-ment as precisely as possible, InVision supplies the required methods and results. The subsequent optimisation of per-sonnel deployment is generally greater than the sort of optimi-sation that the company’s competitors could offer.
This means that there is considerable demand for InVision’s solutions, particularly among large clients. While these clients already optimise their personnel deployment, InVision allows them to further increase the extent of optimisation. The larger the systems, the higher the absolute cost savings as a result of relatively small optimisation measures. This is why there is particular demand for InVision’s solutions among large clients.
InVision’s solutions allow clients to deploy personnel in an ef-fective manner and, as a result, to achieve the following in particular:
• To cut costs but reducing instances of excess cover,
ROI value drivers
Increased operating performance
Reduction in operating costs• Fewer instances of excess coverage and surcharges
Lower personnel costs
• Automation of workflows and calculationsLower form and process costs
• Integration of employees into planning processReduced recruitment and training costs
• Fewer instances of insufficient coverageMore sales thanks to better service
Chart 1; Source: InVision
Client benefits
Company management, operations, finance and management accounting
Reduzierung der Betriebskosten
• Increased operating performance
• Lower personnel costs
• Increased productivity and motivation
• Faster and better decisions
• Lower administrative costs
Employees• Better work/life balance
• Interesting work
• More fairness
Personnel department• Standard tasks automated to a considerable degree
• Reduction of fluctuations
IT department• Lower IT costs
• Simple administration
• Comprehensive expandability
Chart 2; Source: InVision
Client benefits
Company management, operations, finance and management accounting
Reduzierung der Betriebskosten
• Increased operating performance
• Lower personnel costs
• Increased productivity and motivation
• Faster and better decisions
• Lower administrative costs
Employees• Better work/life balance
• Interesting work
• More fairness
Personnel department• Standard tasks automated to a considerable degree
• Reduction of fluctuations
IT department• Lower IT costs
• Simple administration
• Comprehensive expandability
Chart 2; Source: InVision

InVision Software AG Research Note
Equity story Competitive quality Finances Valuation Newsflow Company & products Ratios
SES Research GmbH – A Member of the Warburg Group Page 7
• To boost productivity by reducing instances of insuf-ficient cover,
• To increase employee satisfaction, for example by implementing flexible schedules that employees have a say in, the “Infothek” (info centre) principle (employ-ees can set, plan and exchange working hours them-selves).
Users can generally achieve a ROI within 6 to 12 months. The solution also offers further key advantages such as the reduc-tion of planning costs and increased employee flexibility (see box on the left).
Although the high degree of specialisation clearly limits this field of business, it nevertheless explains why InVision is growing at a considerably faster rate than its competitors.
References as a competitive advantage
In the software sector, references are a key competitive ad-vantage. They underline the quality of the solution and justify its cost-effectiveness. This is explained using a few projects as examples:
InVision has a total of more than 180 clients in 19 countries. The following table provides an overview of references (ex-cerpt):
Invision’s clients (excerpt)
Banks
• Postbank• Sparda-Bank• RBS• ABN AMRO• ...
Insurance companies
• AXA• Allianz• AOK• ...
Telecommunications
• Deutsche Telekom• Vodafone• Swisscom• ...
Energy
• Eon• Vattenfall• RheinEnergie• EnBW• ...
Other
• BMW• IKEA• NORDSEE• ...
Chart 4; Source: InVision AG
Invision’s clients (excerpt)
Banks
• Postbank• Sparda-Bank• RBS• ABN AMRO• ...
Insurance companies
• AXA• Allianz• AOK• ...
Telecommunications
• Deutsche Telekom• Vodafone• Swisscom• ...
Energy
• Eon• Vattenfall• RheinEnergie• EnBW• ...
Other
• BMW• IKEA• NORDSEE• ...
Chart 4; Source: InVision AG
Royal Automobile Club ABN AMRO Freenet customer care AG
- - -
Royal Automobile Club, UKMore than 4,500 employees24-hour service for over 6 m members 6
--
Financial services provider, NLMore than 110,000 employees worldwide
-
-
Internet and telecommunicationsproviderm GermanyOver 1 m broadband clients
InVision solution - Deployment optimisation in the following areas: road-side assistance, breakdown assistance & call centre
- Deployment optimisation and analysisand monitoring for approx. 1,200 employes in 5 service centres
- Deployment optimisation, time management and employee integration for more than 1,000 service centre employees
Client benefit -
-
16% increase in operating performance , corresponds to annual savings of GBP 1.3 mCoverage of 56 planning rules, thereof 32 fairness guidelinesPlanning input reduced by 90%
-
-
Personnel costs cut by 7.5%Planning input reduced by over 50%
-
-
-
The extent to which employee wishes are fulfilled(i.e. employees can choose their own working hours) averages between 70% and 85%Fewer employees call in sick due to unwanted working hoursLess fluctuation
Chart 3; Source SES Research
InVision - reference projects
InVision Software AG Research Note
Equity story Competitive quality Finances Valuation Newsflow Company & products Ratios
SES Research GmbH – A Member of the Warburg Group Page 8
National and international dimension of competition
We believe that InVision has a leading position in Europe in terms of its core competency of “Planning/Optimisation”. In the other areas of personnel deployment planning and time man-agement, the company’s major European competitors (e.g. In-terflex, Torexretail or IGSUS) certainly have solutions that could be superior to InVision’s in part. Nevertheless, when it comes to projects dealing with a very high level of optimisa-tion, the solutions offered by the company’s European com-petitors appear less focused than InVision’s. As a result, we believe that InVision can continue to grow in Europe despite intense competition on the staff planning and time manage-ment markets.
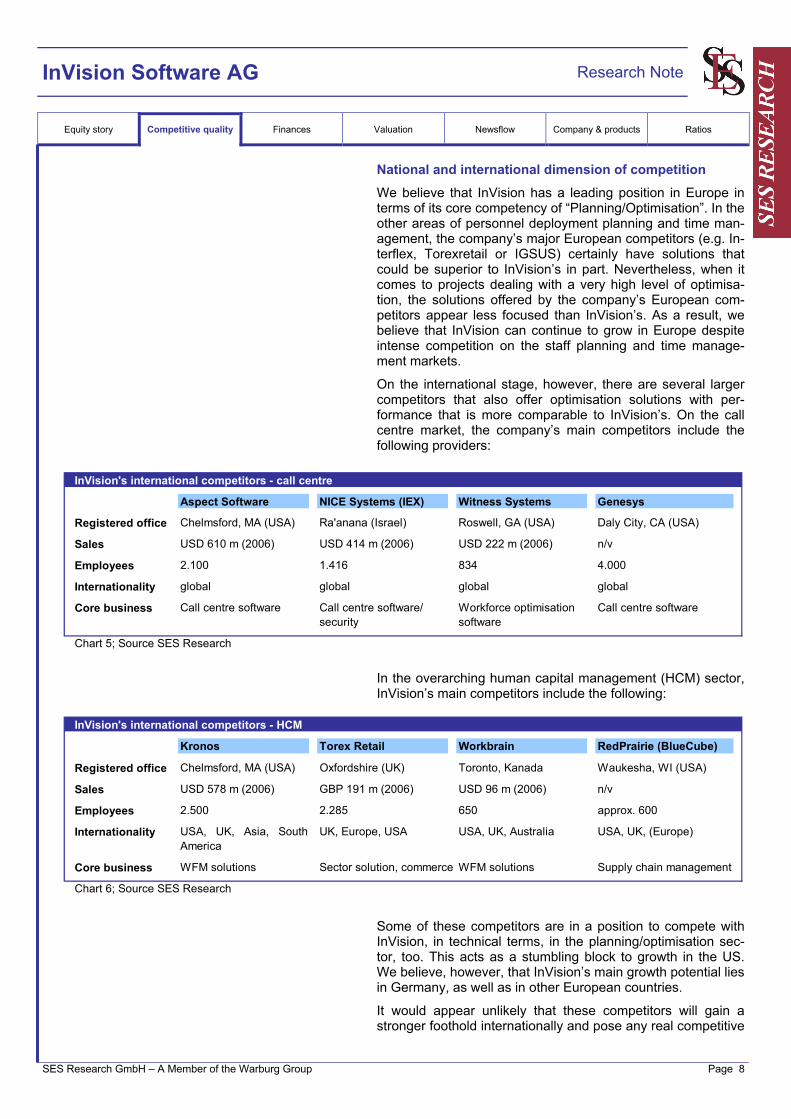
On the international stage, however, there are several larger competitors that also offer optimisation solutions with per-formance that is more comparable to InVision’s. On the call centre market, the company’s main competitors include the following providers:
In the overarching human capital management (HCM) sector, InVision’s main competitors include the following:
Some of these competitors are in a position to compete with InVision, in technical terms, in the planning/optimisation sec-tor, too. This acts as a stumbling block to growth in the US. We believe, however, that InVision’s main growth potential lies in Germany, as well as in other European countries.
It would appear unlikely that these competitors will gain a stronger foothold internationally and pose any real competitive
InVision's international competitors - call centre
Aspect Software NICE Systems (IEX) Witness Systems Genesys
Registered office Chelmsford, MA (USA) Ra'anana (Israel) Roswell, GA (USA) Daly City, CA (USA)
Sales USD 610 m (2006) USD 414 m (2006) USD 222 m (2006) n/v
Employees 2.100 1.416 834 4.000
Internationality global global global global
Core business Call centre software Call centre software/security
Workforce optimisation software
Call centre software
Chart 5; Source SES Research
InVision's international competitors - HCM
Kronos Torex Retail Workbrain RedPrairie (BlueCube)
Registered office Chelmsford, MA (USA) Oxfordshire (UK) Toronto, Kanada Waukesha, WI (USA)
Sales USD 578 m (2006) GBP 191 m (2006) USD 96 m (2006) n/v
Employees 2.500 2.285 650 approx. 600
Internationality USA, UK, Asia, SouthAmerica
UK, Europe, USA USA, UK, Australia USA, UK, (Europe)
Core business WFM solutions Sector solution, commerce WFM solutions Supply chain management
Chart 6; Source SES Research

InVision Software AG Research Note
Equity story Competitive quality Finances Valuation Newsflow Company & products Ratios
SES Research GmbH – A Member of the Warburg Group Page 9
threat to InVision in Europe. This is because the company’s international competitors are flawed by typical weaknesses:
• They do not have any comparable references in Europe,
• They do not offer any comparable multilingual ser-vices, which are required on the European market,
• The complex and highly diverse employment law situation in Europe is often underestimated and
• The US competitors often lack fundamental under-standing of the differences in European working prac-tices, remuneration, etc.
As a result, we believe that US competitors only pose a very limited threat.
All in all, we therefore believe that InVision is well focused and that its chosen specialisation makes sense in a comparison with its competitors.
Optimisation niche market as a selling point and growth driver
We believe that there is a positive market trend in the work-force management sector on the whole. “Optimisation” is a sufficiently small niche in this sector, which should allow InVi-sion to continue to gain market share and, as a result, gener-ate above-average growth. Optimisation offers considerable and, most importantly, measurable potential for many compa-nies. We believe that InVision’s key strength in the competitive environment lies in its 17 years of experience in the workforce management sector and an established, referenced solution that has allowed over 180 clients to generate a swift ROI.

InVision Software AG Research Note
Equity story Competitive quality Finances Valuation Newsflow Company & products Ratios
SES Research GmbH – A Member of the Warburg Group Page 10
Recent performance In financial year 2006, InVision boosted its sales by 70% and drastically increased its earnings, which rose by more than EUR 2 m from EUR –1.25 m to EUR 1.37 m. This trend con-tinued in Q1.
Compared to the previous year sales almost doubled in Q1, while earnings increased by EUR 0.6 m from EUR-0.9 m to EUR-0.3 m. The fact that earnings remained in the red is nor-mal for the sector. Q2 and Q4 are normally the strong quarters for licence-driven business models. We expect InVision to generate just under 60% of its income in the fourth quarter alone.
Although the first quarter is generally of limited informational value for the year as a whole, two key points are worth noting. Sales doubled year-on-year. The assumption that this trend will continue is explained below. We expect to see sales in-crease by 68% in this financial year.
Earnings improved by EUR 0.6 m year-on-year. If we extrapo-late this improvement, our forecast of a EUR 2.2 m increase in earnings in 2007 appears absolutely justified and borders on the conservative. If we assume further, realistic economies of scale in the course of the year, our forecast would appear to be too low.
In the first two quarters, preparations for the raising of capital had a negative impact on earnings. This measure is expected to start bearing fruit in the second half of the year.
On the whole, we believe that the first quarter supports our earnings forecast.
InVision - Q1/2007Q1/07 Q1/06 change yoy 2007e 2006 change yoy
Sales 2,645 1,360 94.4% 18,049 10,733 68.2%
Total Sales 2,645 1,360 94.4% 18,049 10,733 68.2%
Gross Profit 2,614 1,331 96.5% 17,869 10,647 67.8%in % of Total Sales 98.8% 97.8% 99.0% 99.2%
EBIT -289 -846 65.91% 4,151 1,949 113.0%in % of Total Sales -10.9% -62.2% 23.0% 18.2%
Net Income -122 -958 87.2% 2,648 1,374 92.7%in % of Total Sales -4.6% -70.4% 14.7% 12.8%
Table 3; Source: SES Research

InVision Software AG Research Note
Equity story Competitive quality Finances Valuation Newsflow Company & products Ratios
SES Research GmbH – A Member of the Warburg Group Page 11
Growth in sales Any assessment of sales growth must first of all differentiate between the three types of sales:
Licence sales (one-off licence fee for unlimited use, in terms of both location and timeframe) lie at the core of any software company and should increase further in line with successful sales activities. Existing client relationships act as a catalyst in this respect (subsequent licences and expansion of sales to cover other business areas of major clients).
Service sales form the basis for the licensing business, be-cause each project has a set service requirement (mainly im-plementation and training). The fact that the company’s ser-vices are performed by its own employees means that these sales are not as scalable as the licence sales. The latter can also be boosted by strong partner business, as well as by subsequent or new licences.
Maintenance sales result directly from the licences sold (in-stalled base). They amount to 15% of the respective installed basis per year, depending on the licence amount.
Top-line growth will be supported by:
• solid market growth
• the replacement of proprietary systems
• strong client pipeline
• broadening of market access
• expansion of sales activities and expansion of the partner business
• internationalisation
• possible strengthening of the capital base as a growth catalyst
InVision - Sales per brand
2006 2007e 2008e 2009e
Sales 10,733 18,049 25,581 32,077Change yoy 68.1% 68.2% 41.7% 25.4%
Licenses 6.103 10.387 15.093 18.279Change yoy 121,0% 70,2% 45,3% 21,1%in % of Sales 56,9% 57,5% 59,0% 57,0%
Maintenance 2.347 3.549 5.145 7.214Change yoy 6,2% 51,2% 45,0% 40,2%in % of Sales 21,9% 19,7% 20,1% 22,5%
Services 2.283 4.113 5.343 6.584Change yoy 61,4% 80,2% 29,9% 23,2%in % of Sales 21,3% 22,8% 20,9% 20,5%
Table 4; Source: SES Research

InVision Software AG Research Note
Equity story Competitive quality Finances Valuation Newsflow Company & products Ratios
SES Research GmbH – A Member of the Warburg Group Page 12
Solid market growth
In principle, the market for human capital management sys-tems is believed to offer high growth potential. According to AMR, the global market is expected to grow by 10% a year, reaching a volume of USD 8.7 bn in 2010.
In the call centre systems sector, workforce management sys-tems are standard. In addition to the growth of the call centre market, growth is expected to come from system profession-alization, as many companies are still using outdated technol-ogy for optimisation purposes (e.g. EXCEL files).
Datamonitor expects the “Workforce Optimisation Technology” market to display annual growth of 12.1%, reaching a volume of USD 1.4 bn in 2009. The workforce management sub-segment is expected to chart annual growth of 10.1% and ac-count for USD 366 m in 2009.
Frost & Sullivan expects market growth in the segment for workforce management solutions for call centres totalling 13.7% annually and reaching USD 433 m in 2010. The firm expects the EMEA market share to increase to 30% of the global market, producing a significantly higher growth rate of 20.5% p.a. on this particular market. This is due to the fact that the market for solutions of this nature has yet to undergo liberalisation in Europe. InVision's main comparable competi-tors originate from the US, and we believe that the company occupies a unique position in Europe.
InVision is considerably outperforming the market in terms of growth. Over the past few years, the company has grown by around 30% p.a. Last year, sales grew by as much as almost 70%.
Similarly, in addition to base effects due to InVision’s small size, there are a number of key growth drivers that have fos-tered, and will continue to foster substantial growth at InVi-sion:
Replacement of proprietary systems
Particularly in Europe, the workforce management market is characterised to a considerable degree by proprietary or very straightforward systems. Often, smaller call centres still per-form manual optimisation. Furthermore, optimisation is still seen as being less important than advanced time manage-ment and personnel planning systems. This means that there is still considerable potential for optimisation using profes-sional solutions as far as the replacement of sub-optimum systems is concerned. This market structure, which is advan-tageous for InVision, represents a key growth driver which, in our view, is actually more important to the company than mar-ket growth itself. This is because InVision’s systems are usu-ally employed during a later investment cycle, namely when the company in question has already set up the infrastructure, when the latter is up and running, and when the company starts asking questions with respect to improved optimisation.

InVision Software AG Research Note
Equity story Competitive quality Finances Valuation Newsflow Company & products Ratios
SES Research GmbH – A Member of the Warburg Group Page 13
Strong client pipeline
As mentioned above, InVision has over 180 clients. Follow-up business is a key pillar of InVision’s business model. This is highlighted in the following examples:
These projects show how much potential still lies in InVision’s client base. The company should be able to exploit this poten-tial at a relatively low marketing cost. In this respect, one fac-tor that is particularly important is that InVision has been fo-cusing on large clients for several years now and is expending the business areas with these clients from merely call centres, to cover other areas with similar requirements. This is particu-larly relevant with respect to a client like IKEA. This issue will be examined in further detail in the next section.
Broadening of market access
In principle, workforce management solutions can be em-ployed in a whole range of sectors and business areas, pro-vided that the necessary conditions for planning and optimisa-tion (see above) are met. Although InVision has its roots in the call centre market, the relative proportion of sales attributable to this segment has fallen over the past few years (although the proportion is on the rise in absolute terms). This shows that the solution can obviously also work well in sectors out-side of the call centre industry. The chart below shows the ar-eas which could act as potential business areas for InVision (the areas in boxes have been localised as target markets):
Share of call centre projects in total sales
in %
0
10
20
30
40
50
60
70
80
90
100
2004 2005 2006 2007e
Call Center Projekte Andere Projekte
Chart 8; Source: InVision
Deutsche Telekom (T-Mobile) Mannesmann Mobilfunk IKEA
The German mobile telephony provider uses an InVision solution for 1,500 call centre employees
The German mobile telephony provider uses an InVision solution for 2,500 call centre employees
IKEA Germany uses anInVision solution for 100 call centre employees.
Follow-up business Follow-up business Follow-up businesswith international group subsidiariesand equity interests
- New areas: T-Com VC, T-Com TK - Vodafone Omnitel (Italy) - IKEA International- Upgrades to release 4 ar T-Mobile, T-Com - SFR/Cegetel (France) - 50,000+ employees- International group subsidiaries: T-Mobile AT,
HT Telecom, Htmobile--
Swisscom Mobile (Switzerland)Safaricom (Kenya)
--
100+ home furnishings stores in 11 countriesVarious international call centres
- Domestic group subsidiaries: Vivento Customer Services
--
Various international logistics centresFunctional scope: requirement forecasting,
- Expansion of area of application: back office deployment optimisation, time management- Functional expansion:
Capacitor, TrainingPlannerand analysis and monitoring
- Client-specific developments: SAP integration, data warehouseinterface, among others
- Increase in benefits due to various subsequent user licence purchases
Chart 7; Source: InVision
InVision's reference clients

InVision Software AG Research Note
Equity story Competitive quality Finances Valuation Newsflow Company & products Ratios
SES Research GmbH – A Member of the Warburg Group Page 14
We believe that the expansion of market access also consti-tutes a key top-line growth driver. In the first instance, this re-lates to the commerce, transport and logistics.
Expansion of sales activities and the partner business
One key factor for pure play software providers is whether or not they can manage to focus on licence sales without having to provide the associated, low-margin services themselves, meaning that they can focus on further developing their solu-tions. Implementation partners that can perform this work within the framework of the company’s projects are merely supplied with software licences, which is very attractive for In-Vision from a margin point of view.
At present, the company works with the following partners:
Business model
Other
Transport & logistics
Wholesale & retail
Supply & waste management
Telecommunications
Financial services providers
Sector
External salesProductionLogistics
Sales organisationBack officeCall centres
Area of application
Sales focus “call centres“ and “back office”
Sales focus “retail”
Sales focus “transport & logistics”
Chart 9; Source: InVision
Ideal conditions for deployment optimisation Good conditions for deployment optimisation

InVision Software AG Research Note
Equity story Competitive quality Finances Valuation Newsflow Company & products Ratios
SES Research GmbH – A Member of the Warburg Group Page 15
Sales by region in million EUR
0
2
4
6
8
10
12
2004
2005
2006
DACH ROW
Chart 11; Source: InVision
These partners are involved in InVision’s projects, which ex-plains the high contribution made by licence sales and the relatively low service sales. InVision has already stated that expanding its partner business is one of its objectives, be-cause at present, its partners still do not generate their own leads (client acquisitions) and InVision does not pur-sue any active partner management policy. This offers considerable potential. This issue is to be tackled and should result in additional sales growth, along with above-average margins.
Internationalisation
The reorientation of the company’s sales activities in 2004/05 to focus on major international clients, company-wide work-force management and management restructuring (account managers were entrusted with managerial duties) reduced the company’s sales activities in the Germany/Austria/Switzerland (GAS) region (decline in sales in 2005: –12%). The strategic shift, as well as the establishment of increased sales capacity considerably boosted sales in 2006, particularly abroad. In the GAS region, sales grew by 12%, while they increased by 210% in the rest of the world (ROW). Foreign markets (ROW) now account for 51% of consolidated sales.
The fact that the market momentum for the company’s foreign business is far higher than in Germany and that the contribu-tion made to total sales already stands at above 50% following spectacular growth rates shows the enormous potential that internationalisation offers for top-line growth.
Implementation partners
Type of resources
• Application consultants
• Software developers
• Application consultants
• IT consultants
• Application consultants
• Application consultants
• Application consultants
• Application consultants
Deployment regions
FR, IT, NL, NO, SE, ES,
PL, RU, UK, US
UK, FR, MA
FR, DE, PL
IT
South America
Chart 10; Source: InVision

InVision Software AG Research Note
Equity story Competitive quality Finances Valuation Newsflow Company & products Ratios
SES Research GmbH – A Member of the Warburg Group Page 16
Possible strengthening of the capital base as a growth catalyst
We believe that the strengthening of InVision’s capital base should have an above-average impact on the company’s suc-cess:
• The technology is developed and established, any moves to step up the company’s sales activities should have a very clear impact on earnings (scaling). To put things simply: once the technology has been developed, each additional licence sold = profit.
• The same applies to the rapid adaptation of the prod-uct to suit other segments. Here, too, the company can enter into new fields of activity at a low adaptation cost and the situation set out above applies by means of analogy.
• In the medium term, we could also see the company acquiring implementation competence. This would also produce considerable up-selling potential.
• The improvement of the company’s balance sheet quality is also advantageous in terms of its external image.
Strong sales growth justified
The factors set out above highlight the fact that InVision should be able to display strong sales growth in the future.
Earnings growth With average annual top-line growth for the period 2006-2009 of 44%, we expect to see an above-average increase in the operating result. The above-average nature of this increase is due, in our view, to the company’s licence-driven business model.
The following factors largely explain the bottom-line develop-ment:
• Below-average development in key cost positions (e.g. development, overheads, other), i.e. these fall in relation to sales
• The expansion of the partner business and the asso-ciated increase in margins due to a higher proportion of licence sales in relative terms
• The ongoing expansion of the installed base and, as a result, of the high-margin recurring maintenance in-come

InVision Software AG Research Note
Equity story Competitive quality Finances Valuation Newsflow Company & products Ratios
SES Research GmbH – A Member of the Warburg Group Page 17
Personnel expenses in million EUR, as a % of sales
0
2
4
6
8
10
12
14
2004
2005
2006
2007
e
2008
e
2009
e
30,0%
40,0%
50,0%
60,0%
70,0%
80,0%
Chart 12; Source: InVision
Other operating expenses in million EUR, as a % of sales
0
2
4
6
8
10
2004
2005
2006
2007
e
2008
e
2009
e
20,0%
30,0%
40,0%
50,0%
Chart 13; Source: InVision
Maintenance fees in million EUR, as a % of sales
0
2
4
6
8
2004
2005
2006
2007
e
2008
e
2009
e
10,0%
20,0%
30,0%
40,0%
50,0%
Chart 14; Source: InVision
Below-average increase in cost items vis-à-vis sales
Personnel expenses and other operating expenses are by far InVision’s main cost items. This means that both of these items have the greatest impact on the bottom line.
Personnel expenses
Personnel expenses have increased considerably over the past few years. In the restructuring year, 2005, which saw key structural changes within the company (see above) the ratio increased considera-bly. In 2006, personnel expenses returned to a normal ratio of 53% and are expected to decrease further (2009e: 44%).
51% of personnel expenses are attributable to devel-opment, 26% to services, 16% to sales and 7% to other areas. The high development expense, in par-ticular, is expected to fall in relation to sales. The pro-portion of expenses relating to services is likely to re-main constant on the back of a steady project flow. The fact that the only 16% of the company’s person-nel expenses are attributable to sales, and that it is nevertheless reporting strong growth, shows just how much potential is offered by the expansion of this area. We therefore expect sales and marketing costs to increase slightly in relation to sales, which means a considerable increase in absolute terms.
The personnel expense ratio on the whole, however, is likely to fall due to the expectations of high top-line growth.
Other operating expenses
Other operating expenses consist primarily of rental, marketing, travel and vehicle costs. In this case, too, we expect to see a decline in costs in relation to sales.
Both cost items are impacted by a key effect. It is estimated that InVision can already generate around 50% of its business with its existing clients. Only 20% of the company’s sales po-tential has been exploited for 80% of its clients (estimates).
Expansion of the partner business
The section above (top line growth) mentioned that the partner business should have a positive impact on sales. The impact on earnings, however, is much greater. This is because a functional partner business means:
• Lead generation by the partner (hardly any sales ex-pense for InVision)
• Services provided by the partner (no personnel ex-penses relating to services for InVision)
• Considerable increase in royalties, which has a direct impact on earnings.
At present, only 30-45% of projects are implemented with the help of partners, which still do not generate leads. The im-provement of its partner business is one of InVision’s strategic

InVision Software AG Research Note
Equity story Competitive quality Finances Valuation Newsflow Company & products Ratios
SES Research GmbH – A Member of the Warburg Group Page 18
EBIT in million EUR, as a % of sales
-4,00
-2,00
0,00
2,00
4,00
6,00
8,00
10,00
12,00
2004
2005
2006
2007
e
2008
e
2009
e
-30,0%
-20,0%
-10,0%
0,0%
10,0%
20,0%
30,0%
Chart 15; Source: InVision
objectives. We believe that this strategy offers considerable earnings potential (this has not yet been explicitly accounted for in our pre-money scenario).
Ongoing expansion of the installed base and, as a result, maintenance income
Maintenance income continues to rise at InVision. In the first instance, this income charts slower growth than licence sales, because it follows the latter. 15% of the installed base/licences can be booked as annual maintenance income. We believe that in as early as 2009, maintenance income alone will cover the company’s development costs in full. In principle, the installed base can be seen as a hidden re-serve at software companies.
Earnings situation
In financial year 2006, InVision was able to demonstrate the massive earnings potential offered by a pure play software provider for the first time. The company boosted its sales by 70% and drastically increased its earnings, which rose by more than EUR 2 m from EUR-1.25 m to EUR 1.37m. Accord-ing to our estimates and on the basis of these factors, the earnings situation is as follows:

InVision Software AG Research Note
Equity story Competitive quality Finances Valuation Newsflow Company & products Ratios
SES Research GmbH – A Member of the Warburg Group Page 19
The balance sheet InVision’s balance sheet (Q1/2007) can be explained quickly and briefly. Its assets consist more or less exclusively of re-ceivables (trade receivables, 60% of total assets) and de-ferred tax assets (30% of total assets). InVision has not
InVision - P&L
2006 2007e 2008e 2009e
Sales 10,733 18,049 25,581 32,077Change yoy 68.1% 68.2% 41.7% 25.4%
- thereof licenses 6,103 10,387 15,093 18,279- thereof maintenance 2,347 3,549 5,145 7,214- thereof services 2,283 4,113 5,343 6,584
Changes in Inventory / Other 0 0 0 0
Total Sales 10,733 18,049 25,581 32,077Change yoy 68.1% 68.2% 41.7% 25.4%
Material Expenses 86 180 256 321Change yoy -82.8% 110.7% 41.7% 25.4%in % of Total Sales 0.8% 1.0% 1.0% 1.0%
Gross Profit 10,647 17,869 25,326 31,756in % of Total Sales 99.2% 99.0% 99.0% 99.0%
Other Operating Income 138.5 361.0 511.6 641.5Change yoy -59.9% 160.6% 41.7% 25.4%in % of Total Sales 1.3% 2.0% 2.0% 2.0%
Personnel Expenses 5,742 8,700 11,519 14,178Change yoy 15.3% 51.5% 32.4% 23.1%in % of Total Sales 53.5% 48.2% 45.0% 44.2%
Depreciation 80 144 205 257Change yoy -3.1% 80.2% 41.7% 25.4%in % of Total Sales 0.7% 0.8% 0.8% 0.8%
Other Operating Expenses 3,014 5,234 7,163 8,661Change yoy 7.6% 73.7% 36.8% 20.9%in % of Total Sales 28.1% 29.0% 28.0% 27.0%
EBIT 1,949 4,151 6,950 9,302Change yoy n.m. 113.0% 67.4% 33.8%in % of Total Sales 18.2% 23.0% 27.2% 29.0%
Financial Result -68 -620 -760 -760
EBT 1,881 3,531 6,190 8,542Change yoy n.m. 87.7% 75.3% 38.0%in % of Total Sales 17.5% 19.6% 24.2% 26.6%
Taxes 454 883 1,548 2,136Tax Rate 24.1% 25.0% 25.0% 25.0%
Net Income 1,374 2,648 4,643 6,407Change yoy n.m. 92.7% 75.3% 38.0%in % of Total Sales 12.8% 14.7% 18.1% 20.0%
Table 5; Source: SES Research

InVision Software AG Research Note
Equity story Competitive quality Finances Valuation Newsflow Company & products Ratios
SES Research GmbH – A Member of the Warburg Group Page 20
capitalised its own software, which produces a massive hidden reserve.
90% of the liabilities side of the balance sheet comprises cur-rent liabilities. The majority of these liabilities are deferred charges and prepaid expenses (maintenance) and trade pay-ables.
Equity is low at only EUR 174,000 and the current liabilities to banks of EUR 0.8 m considerably exceed the company’s cash and cash equivalents. At present, this means that the balance sheet is in a critical state and it would certainly make sense for the company to raise further capital.
We believe that this is the mark left by the high growth that InVision generated in 2006. Furthermore, InVision has spent a lot of capital on software development over the past few years. A certain amount of debt financing has proven to have made sense from a strategic point of view and is bound to have been more valuable to InVision than the superficial ap-pearance of its balance sheet.
On June 14, 2007 InVision was listed successfully at the stock exchange. The InVision share is allocated at EUR 32.00. The 1.077.000 InVision shares were placed successfully. Including greenshoe the issue volume was EUR 34.5 m. The company accrued gros roughly EUR 22.9 m. Thus, the company is ab-solutely adequate capitalised and the mentioned weakness is eliminated.
Balance sheet InVision
Balance sheet (in EUR m) 2005 2006 2007e 2008e 2009e
ASSETS
Long-Term Assets 0.1 0.1 0.2 0.2 0.2
Current Assets 2.3 5.6 30.0 35.3 42.5
Total Assets 2.4 5.7 30.1 35.5 42.7
LIABILITIES AND SHAREHOLDERS' EQUITY
Total Equity -1.1 0.2 24.0 28.6 35.0
Minority Interest 0.0 0.0 0.0 0.0 0.0
Provisions 0.4 1.3 1.5 1.8 2.2
Total Liabilities 3.5 5.5 6.2 6.9 7.7
Total Liabilites and Shareholders' Equity 2.4 5.7 30.1 35.5 42.7
Table 6; Sources: InVision (reported data), SES Research (estimates)

InVision Software AG Research Note
Equity story Competitive quality Finances Valuation Newsflow Company & products Ratios
SES Research GmbH – A Member of the Warburg Group Page 21
Balance sheet InVision
Balance sheet (in % of Balance Sheet Total) 2005 2006 2007e 2008e 2009e
ASSETS
Long-Term Assets 6.2% 2.5% 0.5% 0.5% 0.5%
Current Assets 93.8% 97.5% 99.5% 99.5% 99.5%
Total Assets 100.0% 100.0% 100.0% 100.0% 100.0%
LIABILITIES AND SHAREHOLDERS' EQUITY
Total Equity -46.8% 4.2% 79.5% 80.5% 82.0%
Minority Interest 0.0% 0.2% 0.0% 0.0% 0.0%
Provisions 15.5% 22.2% 5.0% 5.1% 5.1%
Total Liabilities 146.8% 95.7% 20.4% 19.4% 18.0%
Total Liabilites and Shareholders' Equity 100.0% 100.0% 100.0% 100.0% 100.0%
Table 6; Sources: InVision (reported data), SES Research (estimates)
The cash flow statement Our basic scenario assumes that additional working capital will be required to generate further growth. The expected cash flow shows that it would make sense for the company to raise additional capital (as set out above)
Statement of Cash Flows InVision
Statement of Cash Flows (in EUR m) 2005 2006 2007e 2008e 2009e
Cash Flow -1.7 1.9 3.0 5.2 7.0
Cash Flow from Operating Activities -0.3 -0.3 1.0 3.0 5.2
Cash Flow from Investing Activities -0.1 -0.1 -0.2 -0.2 -0.3
Cash Flow from Financing Activities 0.4 0.4 21.1 0.0 0.0
Net Changes of Cash and Cash Equivalents 0.0 0.0 21.9 2.8 4.9
Cash and Cash Equivalents, end of period 0.1 0.1 22.0 24.8 29.7
Table 7; Sources: InVision (reported data), SES Research (estimates)

InVision Software AG Research Note
Equity story Competitive quality Finances Valuation Newsflow Company & products Ratios
SES Research GmbH – A Member of the Warburg Group Page 22
Valuation range The range of EUR 38 m to EUR 46 m is based on the follow-ing valuation methods (under consideration of capital inflow of IPO, post-money):
• The adjusted free cash flow yield 2008e points towards a fair value of EUR 41 m with substantial upside potential in subsequent years (2009e: EUR 52.20 m)
• The DCF model, based on a beta of 1.5, a risk-free rate of 4.09%, WACC of 11.5% and a perpetual growth rate of 2%, points towards a value of EUR 38 m. Here, however, we expect to see a drop in the margin in the long term and a very substantial growth slowdown (market saturation).
The valuation approach is underlined by three peer groups (comparisons based on EV, the calculated fair values include net financial items):
• The comparison with German pure play software provid-ers points towards an EV of EUR 40 m (2007 EV/EBIT)
• The comparison with US competitors suggests an EV of EUR 42 m (2007 EV/EBIT)
• The comparison with transaction multiples for takeovers in the sector indicates an EV of EUR 46 m (2007 EV/EBIT)
We believe that a post-money valuation of EUR 40 m is ap-propriate for InVision, because this valuation takes account of the fact that earnings visibility remains low at present.
Free cash flow yield Our adjusted free cash flow yield is based on the assumption that investors buy an asset (in this case, the enterprise value) at a price that means that the free cash flow return (free cash flow = net income for the year + depreciation and amortisation - maintenance capex + taxes - (1-t) interest) on the EV ex-ceeds the opportunity costs. In order to simplify matters, we have based our assumptions on a value of 10%.
In as early as the current 2007 financial year, the adjusted free cash flow doubles due to the dynamic top-line and above-average bottom-line growth. For 2008e, this corresponds to a fair value of EUR 70 m, and a value of EUR 93 m for 2009e.

InVision Software AG Research Note
Equity story Competitive quality Finances Valuation Newsflow Company & products Ratios
SES Research GmbH – A Member of the Warburg Group Page 23
DCF model In order to calculate a value for InVision on the basis of the expected medium to long-term business success, we have applied a DCF model.
In the years leading up to 2009, we expect further sales growth at a high level, in particular in 2007. Due to the ex-tremely high scalability of the business, we expect to see a considerable increase in earnings, because the main devel-opment work on the software has already been performed. It is possible for InVision to expand into further areas of activity and the company has already started to do so.
Sales and, in particular, earnings growth will be supported by the further expansion of the partner business and ongoing growth in maintenance income, which we estimate will cover the company’s development costs in full by as early as 2009.
It is particularly worth mentioning that InVision already has an extremely renowned client base and that the potential has not yet been anywhere near exploited for individual clients.
We expect sales to increase by 42% a year in the period lead-ing up to 2009, with the EBIT margin likely to increase from 18% to 29%.
From 2011 onwards, we expect sales growth to decline con-siderably to 5% and also expect the EBIT margin to gradually fall to 20%. This assumption is designed to take account of the fact that no long-term forecast can be made for the dy-namic markets for software solutions.
We have assumed a perpetual growth rate of 2%.
2005 2006 2007e 2008e 2009e 2010e
Net Income -1,241.1 1,374.3 2,648.5 4,642.9 6,406.7 7,625.6+ Depreciation + Amortisation 83.0 80.0 144.4 204.7 256.6 282.9- Net Interest Income -19.0 -67.7 -620.0 -760.0 -760.0 -760.0+ Taxes -409.7 454.0 882.8 1,547.6 2,135.6 2,541.9- Maintenance Capex 23.1 32.9 53.9 81.9 102.7 113.2
+/- Others 0.0 0.0 0.0 0.0 0.0 0.0= Adjusted Free Cash Flow -1,571.8 1,943.1 4,241.8 7,073.3 9,456.2 11,097.3
Adjusted Free Cash Flow Yield -2.1% 2.6% 8.2% 13.7% 18.3% 21.5%Fair Free Cash Flow Yield 10.0% 10.0% 10.0% 10.0% 10.0% 10.0%
= Actual Enterprise Value 73,337.8 73,709.8 51,651.8 51,651.8 51,651.8 51,651.8
= Fair Enterprise Value -15,718.2 19,431.4 42,418.0 70,732.5 94,561.9 110,972.6
- Net Debt (Cash) 365.0 737.0 -21,321.0 -21,321.0 -21,321.0 -21,321.0- Pension Liabilities 0.0 0.0 0.0 0.0 0.0 0.0- Off Balance Sheet 0.0 0.0 0.0 0.0 0.0 0.0= Fair Market Capitalisation -16,083.2 18,694.4 63,739.0 92,053.5 115,882.9 132,293.6
Table 8; Source: SES Research
Free Cash Flow Yield

InVision Software AG Research Note
Equity story Competitive quality Finances Valuation Newsflow Company & products Ratios
SES Research GmbH – A Member of the Warburg Group Page 24
We have assumed a beta of 1.5 and a risk-free rate of 4.09%. Our assumed market yield stands at 9%. Based on these fig-ures, and assuming full self-financing in the long term, this produces a WACC of 11.5%.
Peer group comparison InVision’s valuation on the basis of a peer group comparison uses three peer groups.
• Comparable US companies
• Listed German pure play software providers (product business of over 60% with top-line growth of over 20%)
• Multiplier comparison based on previous transactions
We believe that the EV/EBIT multiplier for financial year 2007 is of primary importance with respect to the valuation. Al-though financial year 2008 produces considerably higher val-ues, we have discarded these due to the low earnings visibility for 2008. It is worth taking into account that InVision is likely to grow at a far faster rate than its peer group, which is what makes the company particularly interesting from a valuation point of view (see below).
We have based our comparative analysis on the following companies:
DCF Model2007e 2008e 2009e 2010e 2011e 2012e 2013e 2014e 2015e 2016e 2017e 2018e 2019e 2020e
Sales 18.0 25.6 32.1 35.4 37.1 39.0 40.9 43.0 45.1 47.4 49.8 52.2 54.9 57.6Change 68.2% 41.7% 25.4% 10.2% 5.0% 5.0% 5.0% 5.0% 5.0% 5.0% 5.0% 5.0% 5.0% 5.0%
EBIT 4.2 7.0 9.3 10.9 10.4 10.9 11.5 12.0 9.0 9.5 10.0 10.4 11.0 11.5EBIT-Margin 23.0% 27.2% 29.0% 30.9% 28.0% 28.0% 28.0% 28.0% 20.0% 20.0% 20.0% 20.0% 20.0% 20.0%
Tax rate 25.0% 25.0% 25.0% 25.0% 25.0% 25.0% 25.0% 25.0% 25.0% 25.0% 25.0% 25.0% 25.0% 25.0%
Depreciation 0.1 0.2 0.3 0.3 0.2 0.2 0.2 0.2 0.2 0.2 0.2 0.3 0.3 0.3in % of Sales 0.8% 0.8% 0.8% 0.8% 0.5% 0.5% 0.5% 0.5% 0.5% 0.5% 0.5% 0.5% 0.5% 0.5%
Change in Liquidity from- Working Capital -2.0 -2.1 -1.8 -0.9 2.6 -0.4 -0.4 -0.4 -0.4 -0.5 -0.5 -0.5 -0.5 -0.5- Capex -0.2 -0.2 -0.3 -0.3 -0.2 -0.2 -0.2 -0.2 -0.2 -0.2 -0.2 -0.3 -0.3 -0.3Capex in % of Sales 0.9% 0.9% 0.9% 0.9% 0.5% 0.5% 0.5% 0.5% 0.5% 0.5% 0.5% 0.5% 0.5% 0.5%
Other 0.0 0.0 0.0 0.0 -1.0 0.0 0.0 0.0 0.0 0.0 0.0 0.0 0.0 0.0
Free Cash Flow 1.0 3.1 5.1 7.2 9.4 7.8 8.2 8.6 6.3 6.7 7.0 7.3 7.7 8.1(WACC-Model)
Valuation (EUR mln) Model parameter Sensitivity Value per Share (EUR) Terminal Growth
Present values 2020e 43.8 Debt ratio 0.00% WACC 1.25% 1.50% 1.75% 2.00% 2.25% 2.50% 2.75%
Terminal Value 20.0 Costs of Debt n.a. 12.46% 34.78 34.93 35.09 35.26 35.44 35.62 35.82
Liabilities -0.9 Market return 9.00% 11.96% 36.05 36.23 36.41 36.61 36.81 37.03 37.26
Liquidity 22.2 Risk free rate 4.09% 11.71% 36.73 36.92 37.12 37.33 37.56 37.79 38.04
Equity Value 85.1 11.46% 37.44 37.65 37.87 38.10 38.34 38.59 38.87
Beta 1.50 11.21% 38.19 38.41 38.65 38.90 39.16 39.44 39.74
WACC 11.46% 10.96% 38.97 39.22 39.48 39.75 40.04 40.34 40.66
Terminal Growth 2.00% 10.46% 40.68 40.97 41.27 41.60 41.94 42.30 42.69

InVision Software AG Research Note
Equity story Competitive quality Finances Valuation Newsflow Company & products Ratios
SES Research GmbH – A Member of the Warburg Group Page 25
Comparable US companies
Genesys
The US company based in Daly City employs a global work-force of around 4000 and its core business concentrates on call centre software. The company is globally active.
NICE Systems
NICE Systems has its headquarters in Ra’anana in Israel and currently employs a global workforce of 1,416. In its core business area, the company focuses on call centre software and security.
Verint Systems
This US company is based in Melville, New York and focuses on the provision of business and security software. Verint Sys-tems is globally active.
German pure play software providers
SAF
The Swiss company SAF AG has its headquarters in Täger-wilen and concentrates on scheduling and planning software. In addition to Switzerland and Germany, the company also has locations in the US and Slovakia.
Update software
Update is a listed company with its registered office in Vienna. At present, the leading European provider of CRM software employs a workforce of around 186.
Utimaco Safeware
Ultimaco a global manufacturer of professional data protection solutions. The company is based in Oberursel near Frankfurt am Main and currently employs around 270 people.
Recent transactions in the sector (company takeovers)
Kronos Inc
The US-firm Kronos Inc is based in Chelmsford and employs a workforce of around 2,500. The company is active in the US, the UK, Asia and South America and markets WFM solutions.
Witness Systems Inc
The US-company based in Roswell deals with workforce op-timisation software. It employs a global workforce of 834.
Workbrain Corp.
Workbrain Corp. is based in Canada and employs around 650 people. The company focuses on workforce management so-lutions and its products are marketed in the US, the UK and Australia.
The following table sets out the consensus estimates for the listed peer groups:

InVision Software AG Research Note
Equity story Competitive quality Finances Valuation Newsflow Company & products Ratios
SES Research GmbH – A Member of the Warburg Group Page 26
Company LC Price MC EVin LC in LC m in LC m 06e 07e 08e 06e 07e 08e 06e 07e 08e 06e 07e 08e
Workforce ManagementGenesys EUR 1.35 94.3 121.9 13.50 n.a. n.a. 0.86 0.86 0.86 n.a. n.a. n.a. 5.19 5.86 5.67NICE Systems ILs 14,970.00 7,745.9 7,068.4 30.27 25.15 21.76 4.04 3.36 2.98 n.a. n.a. n.a. 26.04 17.58 13.85Verint Systems USD 31.35 1,009.1 744.8 25.32 24.70 21.74 2.12 1.71 1.24 23.13 17.71 12.28 15.50 13.21 7.43
Average 23.03 21.12 19.00 2.34 1.98 1.69 23.13 17.71 12.28 15.58 12.22 8.98
German Pure Play SoftwareanbieterSAF EUR 25.01 138.5 135.0 30.17 19.54 12.99 10.05 6.63 4.73 28.66 20.10 12.81 27.13 18.55 11.87Update software EUR 4.58 52.2 44.0 15.27 13.47 10.90 1.86 1.40 1.20 16.28 11.57 8.45 13.32 10.47 6.98Utimaco EUR 13.20 194.6 161.8 22.72 23.53 19.67 3.87 3.26 2.71 18.17 17.30 13.40 16.42 14.28 11.27
Average 22.72 18.85 14.52 5.26 3.76 2.88 21.04 16.32 11.55 18.96 14.43 10.04
Average Total 22.87 19.98 16.76 3.80 2.87 2.29 21.56 16.67 11.73 17.27 13.33 9.51
Median Total 24.02 21.53 16.59 3.00 2.48 1.97 20.65 17.51 12.54 15.96 13.74 9.35
Invision EUR 32.65 72.97 51.65 53.52 27.44 15.70 4.81 2.86 2.02 26.50 12.44 7.43 25.46 12.02 7.22
Fair Value (EV) Peer Group Workforce Management 25.12 35.69 43.30 45.08 73.53 85.36 31.60 52.48 64.28
Fair Value (EV) Peer Group German Software 56.48 67.90 73.75 41.01 67.76 80.30 38.47 62.01 71.84
Table 10; Sources: SES Research, Bloomberg
Peer Group Fair Value (EV) Peer Group Workforce ManagementP/E EV/Sales EV/EBIT EV/EBITDA
This produces the following multiples:
If we apply the EV/EBIT multiples in the peer group for 2007, we arrive at appropriate valuations (EV) of between EUR 68 m and EUR 74 m (EUR 40-42 per share), depending on the peer group. For 2008, the values already stand at around EUR 80-85 m (EUR 45-48 per share). The value per share are to be understood as a total value (incl. financial funds).
Valuation of comparable transactions
The valuation of comparable transactions includes three transactions among competitors that were all executed in Feb-ruary/March of this year. As a result, there is substantial scope for comparability:
Company LC Price Buyer EVper share in LC in LC m 06e 07e 08e 06e 07e 08e 06e 07e 08e
Kronos Inc USD 55.00 Hellman & Friedman 1,777.4 578.20 655.69 706.00 82.59 90.72 101.36 113.57 126.22 136.96Witness Systems Inc USD 27.50 Verint Systems 880.1 214.35 252.82 292.13 22.22 52.60 66.75 59.48 59.40 74.32Workbrain Corp. USD 12.50 Infor 168.1 93.63 106.30 119.18 -1.14 4.27 6.67 1.83 6.39 9.45
Invision EUR 10.73 18.05 25.58 1.95 4.15 6.95 2.03 4.30 7.16Table 11; Sources: SES Research, Bloomberg
Peer Group InVision - Acquisitions Workforce Management
Company LC Price MC EVin LC in LC m in LC m 06e 07e 08e 06e 07e 08e 06e 07e 08e 06e 07e 08e
Workforce ManagementGenesys EUR 1.35 94.3 121.9 0.10 n.a. n.a. 141.90 141.00 141.80 n.a. n.a. n.a. 23.50 20.80 21.50NICE Systems ILs 14,970.00 7,745.9 7,068.4 4.95 5.95 6.88 1,750.47 2,106.73 2,371.44 #WERT! #WERT! #WERT! 271.49 402.03 510.26Verint Systems USD 31.35 1,009.1 744.8 1.24 1.27 1.44 350.57 435.15 601.69 32.20 42.05 60.65 48.05 56.40 100.26
German Pure Play SoftwareanbieterSAF EUR 25.01 138.5 135.0 0.83 1.28 1.93 13.43 20.35 28.52 4.71 6.72 10.54 4.98 7.28 11.37Update software EUR 4.58 52.2 44.0 0.30 0.34 0.42 23.60 31.50 36.50 2.70 3.80 5.20 3.30 4.20 6.30Utimaco EUR 13.20 194.6 161.8 0.58 0.56 0.67 41.80 49.68 59.68 8.90 9.35 12.08 9.85 11.33 14.35
Invision EUR 10.73 18.05 25.58 1.95 4.15 6.95 2.03 4.30 7.16
Table 9; Sources: SES Research, Bloomberg
Peer Group InVisionEPS Sales EBIT EBITDA

InVision Software AG Research Note
Equity story Competitive quality Finances Valuation Newsflow Company & products Ratios
SES Research GmbH – A Member of the Warburg Group Page 27
Company LC Price Buyer EVper share in LC in LC m 06e 07e 08e 06e 07e 08e 06e 07e 08e
Kronos Inc USD 55.00 Hellman & Friedman 1,777.4 3.07 2.71 2.52 21.52 19.59 17.54 15.65 14.08 12.98Witness Systems Inc USD 27.50 Verint Systems 880.1 4.11 3.48 3.01 39.62 16.73 13.19 14.80 14.82 11.84Workbrain Corp. USD 12.50 Infor 168.1 1.80 1.58 1.41 n.a. 39.41 25.19 91.82 26.30 17.80
Average 2.99 2.59 2.31 30.57 25.24 18.64 40.75 18.40 14.21
Median 3.07 2.71 2.52 30.57 19.59 17.54 15.65 14.82 12.98
Fair Value (EV) by multiples EUR 32.11 46.77 59.19 59.58 81.33 129.53 82.70 79.04 101.65
(median)
Table 12; Sources: SES Research, Bloomberg
Peer Group InVision - Acquisitions Workforce Management
The takeover prices paid produce the following multiples:
The EV/EBIT multiples (2007/08) produce enterprise values of EUR 81 m and EUR 103 m respectively for InVision. This means that the scenario here is similar to that produced by the previous peer group comparison.
Conclusion We believe that the InVision post-money valuation of EUR 40 m is fair, although the peer group analyses and the FCF model point towards higher values. The DCF model should be viewed as the central valuation method in this case, because it values the company-specific factors and allows reasonable consideration to be given to the relatively low visibility for earnings from 2008 onwards on the risk side (BETA of 1.5).
InVision grew by around 70% in the previous financial year and achieved an EBIT margin of 18% (EUR 1.95 m). This means that earnings increased by EUR 3.6 m as against the prior year, when the company still generated a loss. This high-lights something that is key to pure play software providers: InVision has performed the main development work on its product and has a strong client base that ensures regular maintenance income. Further increases in sales will have a significantly above-average impact on the EBIT margin.
The raising of capital has to the potential to act as a growth driver for InVision. Capital that is currently being ploughed into the development of the company and measures to attract fur-ther clients should pay off several times over in the current situation, given that the main development work has been completed.

InVision Software AG Research Note
Equity story Competitive quality Finances Valuation Newsflow Company & products Ratios
SES Research GmbH – A Member of the Warburg Group Page 28
The company’s recent newsflow has been positive and was characterised by the figures for Q1 2007 (as at 31 March 2007) and the 2006 annual report:
We expect the high top-line growth to continue and predict that InVision will drastically increase its sales and earnings this year. This should become evident in as early as the first half of the year. Due to the IPO, however, the second half and, in particular, the fourth quarter, which is traditionally strong in this sector, will provide the main impetus.
The most recent transactions concluded by comparable US companies will have a positive impact on the valuation. These included the following:
• In February 2007, Infor bought Workbrain Corp, which was making a substantial loss, paying 1.4 times its expected sales for 2007.
• In February 2007, Verint Systems purchased Witness Systems Inc. for 17 times its 2007 EBIT (based on EV).
• In March 2007, Hellman & Friedman bought Kronos Inc. for 20 times its 2007 EBIT (based on EV).
These transactions show the considerable attention focused on this market segment at present. InVision, too, should bene-fit from this attention in the future (these transactions are set out in the section entitled “Valuation” in this study).
In the medium term, InVision could well make smaller acquisi-tions. In the first instance, however, we expect to see further organic growth, the attraction of further blue chip clients and the increasing visibility of InVision’s success story on the mar-ket.
InVision - Q1/2007Q1/07 Q1/06 change yoy 2007e 2006 change yoy
Sales 2,645 1,360 94.4% 18,049 10,733 68.2%
Total Sales 2,645 1,360 94.4% 18,049 10,733 68.2%
Gross Profit 2,614 1,331 96.5% 17,869 10,647 67.8%in % of Total Sales 98.8% 97.8% 99.0% 99.2%
EBIT -289 -846 65.91% 4,151 1,949 113.0%in % of Total Sales -10.9% -62.2% 23.0% 18.2%
Net Income -122 -958 87.2% 2,648 1,374 92.7%in % of Total Sales -4.6% -70.4% 14.7% 12.8%
Table 13; Source: SES Research

InVision Software AG Research Note
Equity story Competitive quality Finances Valuation Newsflow Company & prod-ucts Ratios
SES Research GmbH – A Member of the Warburg Group Page 29
Company background InVision AG develops, markets and implements workforce management solutions. The company specialises in solutions for effective personnel deployment (requirement forecasting, staff planning and optimisation, time management and analy-sis and management). This means that, in general, the com-pany is active on a market that is already occupied by many competitors of different sizes and types. The unique thing about InVision’s solution, however, is the technology allowing the planning/optimisation of work schedules. This technology makes InVision’s solution superior in certain fields of activity where there is a high demand for flexible schedules (e.g. in call centres). Another key feature of InVision’s technology is what is as known as the “Infothek” (info centre), which allows employees to create their own schedules based on availabil-ity, qualifications and other planning rules. At the core of this feature is a complex solution that can automatically create schedules with a high degree of optimisation by means of various optimisation procedures. These results are particularly valuable in sectors where the optimisation of workforce de-ployment based on concrete guidelines and requirement fore-casts is exceptionally important. As a result, InVision is active on a niche market. A large number of renowned clients show, however, that InVision is a leader on this niche market.
As a pure play software provider, InVision’s main field of activ-ity is product development. Professional Services still ac-counts for a relatively small proportion of the company’s busi-ness, because the solution requires relatively few implementa-tion services and is implemented, in part, by partners. The company’s sales activities are also relatively limited at present and are set for expansion as the company goes public. The fact that the licence business accounts for almost 60% of In-Vision’s business, resulting in an EBIT margin of almost 20% within the group, is already impressive. As a result, the com-pany’s main income is generated from licences, maintenance and services (implementation and training).
In 2006, the company generated highly profitable sales of EUR 10.4 m with 119 employees (currently: 122), although the company still has some way to go before its sales potential has been fully exploited. Today, more than 180 clients in 19 countries use InVision’s solutions.
Company history InVision has its roots in InVision Software GmbH, which was formed in 1995 by the company’s current Executive Board members, Peter Bollenbeck and Mathias Schroer, together with Armand Zohari. The company’s founders were working together on initial projects in as early as 1989. The first pilot projects using InVision solutions were implemented in 1995. In 1997, the company focused on the call centre market and started to move towards internationalisation in 1999. In 2004, the company opted to concentrate on large clients and now generates considerable licence income with this client group, which reaps particular benefits from the use of InVision solu-tions. Now, in 2007, the company is to go public.
InVision AG’s employee structure 2006, total: 119 employess
Sonstige7%
Professional Services
26%
Vertrieb16%
Entwicklung51%
Chart 16; Source: InVision
InVision AG‘s sales structure 2006, total: EUR 10.4 m
Lizenzen57% Wartung
22%
Dienst-leistungen
21%
Chart 17; Source: InVision

InVision Software AG Research Note
Equity story Competitive quality Finances Valuation Newsflow Company & prod-ucts Ratios
SES Research GmbH – A Member of the Warburg Group Page 30
Company structure The following chart shows the structure of InVision AG. All of the company’s major international activities are performed from companies based in the country in question:
Product structure InVision’s product covers the complete workforce manage-ment process chain.
The product structure is split into the following areas: forecast-ing, scheduling, time management and analysis and monitor-ing, each of which contain several sub-modules.
The Forecasting area is split into three modules: the Fore-castPro module enables short and medium-term staffing re-quirement planning. It uses historical data to provide detailed forecasts of a company’s future volume of work. The Capaci-tor module allows companies to plan long-term staffing re-quirements and their long-term personnel structure. Cam-paignPro allows companies to plan one-off or regular cam-paigns and projects, and to determine the staff required.
The Scheduling area is divided into five modules: Sched-ulePro is the core module for staff scheduling and combines personnel requirements, employees and planning rules to create a schedule (e.g. shift plan). The AutoScheduler mod-ule is an optimisation model that can perform staff scheduling and optimisation tasks on a fully automatic basis. Infothek comprises two sub-models. Infothek Interactive Schedule al-lows employees to participate in the planning process them-selves by entering their preferred work times online. The In-fothek Inform module provides a range of functions to inform
Company structure
InVision Software AGRatingen/DE
InVision Software,Inc.Chicago/USA (100%)
InVision Software ABStockholm/SE (100%)
InVision Software GmbHZürich/CH (100%)
InVision IT Systems GmbHVienna/AT (100%)
InVision Software B.V.Utrecht/NL (100%)
InVision Software SAS Paris/FR (100%)
InVision Software OÜ Tallinn/EE (100%)
InVision Software S. L.Madrid/ES (100%)
InVision Software Systems S. r. L. Milan/IT (100%)
InVision South Africa (Pty) Ltd. Cape Town/ZA (100%)
Invision Software Ltd.London/UK (100%)
Chart 18; Source: InVision

InVision Software AG Research Note
Equity story Competitive quality Finances Valuation Newsflow Company & prod-ucts Ratios
SES Research GmbH – A Member of the Warburg Group Page 31
affected employees of changes to their schedule automati-cally. The TrainingsPlaner module supports the effective planning and implementation of employee training pro-grammes. DeskManager complements workforce manage-ment by assigning employees to workstations and tools and includes these in the optimisation process.
The third area is Time Management, which is split into three segments: TimeKeeper can allow companies to organise the real-time compilation, verification and management of time account transactions. The TimeManager module automati-cally manages and calculates time accounts and expenses for various different accounting periods. The Infothek Time Re-cording module allows employees to record their working hours on the intranet and Internet.
The fourth and final area is Analysis and Monitoring, which is divided into three modules: OnlineCockpit consolidates target versus actual data from internal and external sources in real time and calculates consolidated key operational indica-tors. The AdherenceMonitor module enables companies to evaluate any deviation from the working hours and activities that employees were scheduled for. Reports is a module for the printing and electronic dissemination of reports and analy-ses in PDF, HTML and XML format.
In addition to the enterprise server, the technological platform consists of the following elements: the Xlink Suite, which en-sures the connection to external systems, the SDK (software development kit) to support individual in-house developments and the AdminPro module for the administration of master data.
Product structure
Time management
Infothek TimeRecordingCampaignPro
Capacitor
Forecast Pro
AdherenceMonitor
OnlineCockpit
Infothek
AutoScheduler
SchedulePro
Forecast Deployment optimisation Analysis & monitoring
TimeKeeper
TimeManager
TrainingPlaner
DeskManager
Xlink SuiteEnterprise server SDK AdminPro
Workforce management process
InVision Enterprise WFM modules
InVision Enterprise WFM plat form
Chart 19; Source: InVision
Reports

InVision Software AG Research Note
Equity story Competitive quality Finances Valuation Newsflow Company & prod-ucts Ratios
SES Research GmbH – A Member of the Warburg Group Page 32
Sales process and project procedure At InVision, the sales process corresponds to a clear pattern that is typical for the software sector:
Professional Services supports the sales employees/clients for the duration of the project:
Sales process
Lead generation Pre-sales
- 15-25 international trade fairs per year
- Internet marketing(advertising, google etc.)
- Mailings, telemarketing
- In-house events for clients and interested parties
- Client recommendations
- Qualification, solution development and presentation
- Supporting activities such as reference client visits and “clicking sessions” as well as pilot projects were appropriate
- Tender
- Duration: up to 12 months(or more for large projects)
- Commercial and legal contractual negotiation
- Signing of contract and/or order
- Handover to project management
Pre-sales
Chart 20; Source: InVision
Project procedure
Sales support Implementation
- Preparation of technically complex offerings
- Participation in sales presentations
- Implementation of pilot optimisation projects
- Successful and high-quality project implementation
- Establishment, consolidation and development of reusable knowledge
- Ensuring high client satisfaction following commissioning
- Development of additional sales potential
Customer care
Chart 21; Source: InVision

InVision Software AG Research Note
Equity story Competitive quality Finances Valuation Newsflow Company & prod-ucts Ratios
SES Research GmbH – A Member of the Warburg Group Page 33
Internationalisation InVision’s solutions are marketed internationally. The propor-tion of foreign business has risen substantially over the past few years from 25% to 51%. InVision has 11 subsidiaries and guarantees country-specific software coverage thanks to ver-sions in 11 languages. The solution is used in 19 countries and takes country-specific overall conditions (e.g. employment law) into account.
Research and development Product development is the most important component of In-Vision’s value chain. The solutions are released every 1-2 years. The company’s products are developed in line with the following principle:
In principle, R&D department is divided into four areas:
Product Development Management: identification of profes-sional specifications in cooperation with clients and employ-ees
Software Development: establishment of the technical speci-fications, function programming and rectification of errors
Product Documentation: Translation of the interface texts, online help and manuals in all supported languages
Quality Assurance: Quality assurance during the develop-ment phase and integration tests with acceptance test for new product versions
In addition to Ratingen, the company’s main development lo-cations are in Londonderry, Tallinn and Leipzig.
Management Executive Board
Peter Bollenbeck (CEO) formed InVision Software GmbH in 1995 with Armand Zohari and Matthias Schroer. Mr. Bollen-back started laying the foundations for this career even back in his schooldays, when he worked as a freelance consultant for staff scheduling, production control and management in-formation systems. He abandoned his studies in economics at the distance learning-based Fernuniversität Hagen after five semesters in order to concentrate in full on his entrepreneurial activities. In 1991, Peter Bollenbeck formed pep/Systeme GbR along with Armand Zohari. This company specialised in the development and marketing of workforce management software. In 1993, Mr. Bollenbeck was involved in the forma-tion of Dieter Thörmer Datentechnik GmbH, a company that focused on process visualisation and workforce management. Finally, he was one of the co-founders of InVision Software GmbH. As CEO of InVision, Peter Bollenbeck is responsible for strategy, corporate finance, sales and professional ser-vices.
Matthias Schroer (CTO) studied electrotechnology in Bochum and abandoned his studies after four semesters to concen-trate on his career, which he launched back in 1987, while he was still studying, as a software developer on various scien-
Regional sales split Financial year 2006
DACH49%
Rest of the world51%
Chart 22; Source: InVision

InVision Software AG Research Note
Equity story Competitive quality Finances Valuation Newsflow Company & prod-ucts Ratios
SES Research GmbH – A Member of the Warburg Group Page 34
tific projects in the areas of medicine and electrotechnology. In 1988, Mr. Schroer joined forces with Armand Zohari to form MASC Datensysteme GbR, which developed a multi-user management information system for use in the food industry. Between 1989 and 1992, Matthias Schroer worked on various software projects on a freelance basis. After that, he became one of the co-founders of InVision, where he is responsible for research and development.
Supervisory Board
The Supervisory Board of InVision AG has three members.
The Chairman of the Supervisory Board of InVision is Dr. Thomas Hermes. Dr. Hermes, who has a PhD in law, is a partner in the law firm Holthoff-Pförtner in Essen and Berlin.
Dr. Christof Nesemeier has been a member of the Supervi-sory Board of InVision Software AG since 2004. In his main position as managing director of MBB Industries AG, he is re-sponsible for the strategic planning of the company, as well as for equity investment management.
The third member of the Supervisory Board is Prof. Dr. Wilhelm Mülder. Professor Mülder has been professor of commercial IT at Niederrhein University of Applied Sciences since 1991. Previously, he was employed in development and consultancy at two software companies.
Shareholder structure Prior to the IPO, 75% of the company’s share capital, which is divided into 1.5 m ordinary bearer shares (EUR 1.5 m) lies in the hands of the company’s founders Bollenbeck, Schroer and Zohari. The remaining 25% is held by InVision Holding GmbH, which has ceded a 1.21 percentage point interest to the com-pany’s employees as part of its employee share plan. This holding company is also owned, to an equal extent, by the three founders.
Shareholder structure InVision AG basis: pre IPO
Middle Management
1%Matthias Schroer
25%
Peter Bolleneck
25%
Armand Zohari25%
InVision Holding GmbH
24%
Chart 23; Source: InVision

InVision Software AG Research Note
Equity story Competitive quality Finances Valuation Newsflow Company & products Ratios
SES Research GmbH – A Member of the Warburg Group Page 35
Income Statement InVision
Income Statement (in EUR m) 2005 2006 2007e 2008e 2009e
Sales 6.4 10.7 18.0 25.6 32.1Change in Inventories / Assets Capitalised 0.0 0.0 0.0 0.0 0.0Total Sales 6.4 10.7 18.0 25.6 32.1COGS 0.5 0.1 0.2 0.3 0.3Personnel expenses 5.0 5.7 8.7 11.5 14.2Other operating income 0.3 0.1 0.4 0.5 0.6Other operating expenses 2.8 3.0 5.2 7.2 8.7EBITDA -1.5 2.0 4.3 7.2 9.6Depreciation on fixed assets 0.0 0.0 0.1 0.1 0.1EBITA -1.6 2.0 4.2 7.1 9.5Amortisation of intangible assets 0.1 0.1 0.0 0.1 0.2Impairment charges and Amortisation of goodwill 0.0 0.0 0.0 0.0 0.0EBIT -1.6 1.9 4.2 7.0 9.3Interest income 0.0 0.0 0.0 0.0 0.0Interest expense 0.0 0.1 0.5 0.6 0.6Other financial income / expenses 0.0 0.0 -0.1 -0.1 -0.1Financial Result 0.0 -0.1 -0.6 -0.8 -0.8Result from Ordinary Operations -1.7 1.9 3.5 6.2 8.5Extraordinary Result 0.0 0.0 0.0 0.0 0.0EBT -1.7 1.9 3.5 6.2 8.5Taxes -0.4 0.5 0.9 1.5 2.1Net Profit of continued operations -1.2 1.4 2.6 4.6 6.4Net Profit of discontinued operations 0.0 0.0 0.0 0.0 0.0Net Profit before Minorities -1.2 1.4 2.6 4.6 6.4Minority Interests 0.0 -0.1 0.0 0.0 0.0Net Profit -1.2 1.4 2.6 4.6 6.4
Income Statement (in % of Sales) 2005 2006 2007e 2008e 2009e
Sales 100.0% 100.0% 100.0% 100.0% 100.0%Change in Inventories / Assets Capitalised 0.0% 0.0% 0.0% 0.0% 0.0%Total Sales 100.0% 100.0% 100.0% 100.0% 100.0%COGS 7.8% 0.8% 1.0% 1.0% 1.0%General and Administrative expenses 78.0% 53.5% 48.2% 45.0% 44.2%Other operating income 5.4% 1.3% 2.0% 2.0% 2.0%Other operating expenses 43.9% 28.1% 29.0% 28.0% 27.0%EBITDA -24.3% 18.9% 23.8% 28.0% 29.8%Depreciation on fixed assets 0.2% 0.2% 0.8% 0.2% 0.2%EBITA -24.4% 18.7% 23.0% 27.7% 29.6%Amortisation of intangible assets 1.1% 0.5% 0.0% 0.6% 0.6%Impairment charges and Amortisation of goodwill 0.0% 0.0% 0.0% 0.0% 0.0%EBIT -25.6% 18.2% 23.0% 27.2% 29.0%Interest income 0.1% 0.0% 0.0% 0.0% 0.0%Interest expense 0.4% 0.9% 2.9% 2.5% 2.0%Other financial income / expenses 0.0% 0.2% -0.6% -0.5% -0.4%Financial Result -0.3% -0.6% -3.4% -3.0% -2.4%Result from Ordinary Operations -25.9% 17.5% 19.6% 24.2% 26.6%Extraordinay Result 0.0% 0.0% 0.0% 0.0% 0.0%EBT -25.9% 17.5% 19.6% 24.2% 26.6%Taxes -6.4% 4.2% 4.9% 6.0% 6.7%Net Profit of continued operations -19.4% 13.3% 14.7% 18.1% 20.0%Net Profit of discontinued operations 0.0% 0.0% 0.0% 0.0% 0.0%Net Profit before Minorities -19.4% 13.3% 14.7% 18.1% 20.0%Minority Interests 0.0% -0.5% 0.0% 0.0% 0.0%Net Profit -19.4% 12.8% 14.7% 18.1% 20.0%
Table 14; Sources: InVision (reported data), SES Research (estimates)

InVision Software AG Research Note
Equity story Competitive quality Finances Valuation Newsflow Company & products Ratios
SES Research GmbH – A Member of the Warburg Group Page 36
Balance sheet InVision
Balance sheet (in EUR m) 2005 2006 2007e 2008e 2009e
ASSETSIntangible Assets 0.1 0.0 0.1 0.1 0.1Fixed Assets 0.1 0.1 0.0 0.1 0.2Financial Assets 0.0 0.0 0.0 0.0 0.0Long-Term Assets 0.1 0.1 0.2 0.2 0.2Receivables and Other Current Assets 1.1 3.9 6.4 9.0 11.2Cash and Cash Equivalents 0.1 0.1 22.0 24.8 29.7Current Assets 2.3 5.6 30.0 35.3 42.5
Total Assets 2.4 5.7 30.1 35.5 42.7
LIABILITIES AND SHAREHOLDERS' EQUITYCommon Stock 0.4 0.4 2.2 2.2 2.2Additional Paid-In Capital 0.0 0.0 19.2 19.2 19.2Retained Earnings 1.2 1.2 -0.1 2.5 7.1Accumulated other Comprehensive Income -2.7 -1.4 2.6 4.6 6.4Total Equity -1.1 0.2 24.0 28.6 35.0
Minority Interest 0.0 0.0 0.0 0.0 0.0
Provisions 0.4 1.3 1.5 1.8 2.2Financial Liabilities 0.4 0.9 0.9 0.9 0.9Other Liabilities 2.7 3.3 3.8 4.2 4.6Total Liabilities 3.5 5.5 6.2 6.9 7.7
Total Liabilites and Shareholders' Equity 2.4 5.7 30.1 35.5 42.7
Table 15; Sources: InVision (reported data), SES Research (estimates)
Balance sheet InVision
Balance sheet (in % of Balance Sheet Total) 2005 2006 2007e 2008e 2009e
ASSETSIntangible Assets 2.1% 0.8% 0.4% 0.3% 0.2%Fixed Assets 4.0% 1.7% 0.1% 0.2% 0.4%Financial Assets 0.0% 0.0% 0.0% 0.0% 0.0%Long-Term Assets 6.2% 2.5% 0.5% 0.5% 0.5%Receivables and Other Current Assets 46.7% 67.5% 21.2% 25.2% 26.2%Cash and Cash Equivalents 3.1% 2.5% 73.1% 69.8% 69.6%Current Assets 93.8% 97.5% 99.5% 99.5% 99.5%
Total Assets 100.0% 100.0% 100.0% 100.0% 100.0%
LIABILITIES AND SHAREHOLDERS' EQUITYCommon Stock 15.8% 6.7% 7.4% 6.3% 5.2%Additional Paid-In Capital 0.0% 0.0% 63.8% 54.1% 45.0%Retained Earnings 51.4% 21.5% -0.5% 7.1% 16.7%Accumulated other Comprehensive Income -114.0% -24.0% 8.8% 13.1% 15.0%Total Equity -46.8% 4.2% 79.5% 80.5% 82.0%
Minority Interest 0.0% 0.2% 0.0% 0.0% 0.0%
Provisions 15.5% 22.2% 5.0% 5.1% 5.1%Financial Liabilities 18.3% 15.4% 2.9% 2.5% 2.1%Other Liabilities 113.0% 58.1% 12.5% 11.8% 10.8%Total Liabilities 146.8% 95.7% 20.4% 19.4% 18.0%
Total Liabilites and Shareholders' Equity 100.0% 100.0% 100.0% 100.0% 100.0%
Table 15; Sources: InVision (reported data), SES Research (estimates)

InVision Software AG Research Note
Equity story Competitive quality Finances Valuation Newsflow Company & products Ratios
SES Research GmbH – A Member of the Warburg Group Page 37
Statement of Cash Flows InVision
Statement of Cash Flows (in EUR m) 2005 2006 2007e 2008e 2009eNet Profit -1.2 1.4 2.6 4.6 6.4Depreciation on Fixed Assets 0.0 0.0 0.1 0.1 0.1Amortisation of Goodwill 0.0 0.0 0.0 0.0 0.0Amortisation of Intangible Assets 0.1 0.1 0.0 0.1 0.2Changes in Long-Term Provisions -0.2 0.9 0.0 0.0 0.0Other Non-Cash related payments -0.4 -0.4 0.2 0.3 0.4Cash Flow -1.7 1.9 3.0 5.2 7.0
Changes in Inventories 0.0 0.0 0.0 0.0 0.0Changes in Accounts Receivables 0.4 -2.7 -2.5 -2.6 -2.2Changes in Accounts Payable 0.7 -0.2 0.4 0.5 0.4Changes in other constituents of Working Capital 0.3 0.7 0.0 0.0 0.0
Changes in Working Capital 1.4 -2.3 -2.0 -2.1 -1.8Cash Flow from Operating Activities -0.3 -0.3 1.0 3.0 5.2CAPEX -0.1 -0.1 -0.2 -0.2 -0.3Cash Paid for Aquisitions 0.0 0.0 0.0 0.0 0.0Purchases of Marketable Securities 0.0 0.0 0.0 0.0 0.0Proceeds from Sale of Property and Equipment 0.0 0.0 0.0 0.0 0.0Cash Flow from Investing Activities -0.1 -0.1 -0.2 -0.2 -0.3Dividend payment 0.0 0.0 0.0 0.0 0.0Changes in Debt 0.4 0.4 0.0 0.0 0.0Repurchase of Stock 0.0 0.0 0.0 0.0 0.0Issuance of Common Stock 0.0 0.0 0.0 0.0 0.0Other 0.0 0.0 21.1 0.0 0.0Cash Flow from Financing Activities 0.4 0.4 21.1 0.0 0.0Effect of exchange rate changes 0.0 0.0 0.0 0.0 0.0Net Changes of Cash and Cash Equivalents 0.0 0.0 21.9 2.8 4.9
Cash and Cash Equivalents, end of period 0.1 0.1 22.0 24.8 29.7
Table 16; Sources: InVision (reported data), SES Research (estimates)

InVision Software AG Research Note
Equity story Competitive quality Finances Valuation Newsflow Company & products Ratios
SES Research GmbH – A Member of the Warburg Group Page 38
Financial Ratios InVision
2005 2006 2007e 2008e 2009e
Operational EfficiencyTotal Operating Costs / Sales (%) 125.6% 81.8% 77.0% 72.8% 71.0%EBIT-Margin (%) -25.6% 18.2% 23.0% 27.2% 29.0%Operating Return (%) -707.1% 64.6% 83.9% 98.0% 103.8%ROA (%) -838.6% 981.7% 1648.6% 2444.7% 2827.1%Efficiency of Capital EmploymentPlant Turnover 65.8 113.0 653.3 307.5 209.8Operating Assets Turnover 29.2 3.4 3.5 3.5 3.5Capital Employed Turnover -20.4 4.5 0.7 0.8 0.8Return on CapitalROCE -877.2% 187.6% 28.9% 24.1% 26.8%EBITDA / Average Capital Employed (%) -832.6% 195.3% 29.9% 24.8% 27.5%ROE 110.2% 577.4% 11.1% 16.2% 18.3%ROIC -168.8% 40.8% 9.6% 14.3% 16.3%SolvencyYE Net Debt 365.0 737.0 -21,130.4 -23,922.1 -28,823.5Net Gearing -32.4% 309.7% -88.2% -83.6% -82.3%Debt / Equity (%) -39.0% 369.3% 3.7% 3.1% 2.5%Current Ratio 0.7 1.3 6.5 6.9 7.7Acid Test Ratio 0.6 1.0 4.9 5.1 5.5EBITDA / Interest Paid 0.0 20.8 8.3 n.m. n.m.Interest Cover 0.0 19.9 8.0 n.m. n.m.Cash FlowFree Cash Flow (EURm) -394.1 -405.7 788.5 2,791.7 4,901.4Free Cash Flow / Sales (%) -6.2% -3.8% 4.4% 10.9% 15.3%Adj. Free Cash Flow (EURm) -1,571.8 1,943.1 4,241.8 7,073.3 9,456.2Adj. Free Cash Flow / Sales (%) -24.6% 18.1% 23.5% 27.6% 29.5%Free Cash Flow / Net Income 0.3 -0.3 0.3 0.6 0.8Interest Received / Average Cash (%) 10.5% 4.2% 0.0% 0.0% 0.0%Interest Paid / Average Debt (%) 5.9% 14.8% 59.2% 72.8% 72.8%Dividend Payout Ratio 0.0 0.0 0.0 0.0 0.0Funds ManagementCapex / Sales (%) -1.8% -0.8% -0.9% -0.9% -0.9%Maintenance Capex / Sales (%) 0.2% 0.2% 0.8% 0.2% 0.2%Capex / Depreciation (%) -138.6% -103.8% -114.3% -114.3% -114.3%Average Working Capital / Sales (%) 10.1% 14.8% 22.6% 24.1% 25.4%Trade Creditors / Trade Debtors (%) 115.1% 566.6% 568.2% 568.2% 568.2%Inventory processing period (days) 0.0 0.0 0.0 0.0 0.0Receivables collection period (days) 53.3 125.8 125.0 125.0 125.0Payables payment period (days) 46.3 22.2 22.0 22.0 22.0Cash conversion cycle (days) 7.0 103.6 103.0 103.0 103.0
Table 17; Sources: InVision (reported data), SES Research (estimates)

InVision Software AG Research Note
SES Research GmbH – A Member of the Warburg Group Page 39
Legal Disclaimer This research report was prepared by the SES Research GmbH, a subsidiary of the M.M.Warburg & CO KGaA. It contains selected informa-tion and does not purport to be complete. The report bases on publicly available information and data ("the Information") believed to be accu-rate and complete. SES Research GmbH neither does examine the Information to be accurate and complete, nor guarantees its accuracy and completeness. Possible errors or incompleteness of the Information do not constitute grounds for liability, neither with regard to indirect nor to direct or consequential damages. In particular, neither M.M.Warburg & CO KGaA nor the SES Research GmbH are liable for the statements, plans or other details contained in the Information concerning the examined companies, their associated companies, strategies, economic situations, market and competitive situations, regulatory environment, etc. Although due care has been taken in compiling this research report, it cannot be excluded that it is incomplete or contains errors. M.M.Warburg & CO KGaA and SES Research GmbH, their shareholders and employees are not liable for the accuracy and completeness of the statements, estimations and the conclusions derived from the Information contained in this document. Provided any research report is being transmitted in connection with an existing contractual relationship, i.e. financial advisory or similar services, the liability of M.M.Warburg & CO KGaA and SES Research GmbH shall be restricted to gross negligence and willful misconduct. Only in case of failure in essential tasks, M.M.Warburg & CO KGaA and SES Research GmbH are liable for normal negligence. In any case, the liability of M.M.Warburg & CO KGaA and SES Research GmbH is limited to typical, expect-able damages and the liability for any indirect damages is excluded. This research report does not constitute an offer or a solicitation of an offer for the purchase or sale of any security. Partners, directors or employees of M.M.Warburg & CO KGaA or SES Research GmbH may serve on the board of directors of companies mentioned in a report. Opinions expressed in this report are subject to change without notice. All rights reserved.
Copyright Notice This work including all its parts is protected by copyright. Any use beyond the limits provided by copyright law without permission is prohibited and punishable. This applies, in particular, to reproductions, translations, microfilming, and storage and processing on electronic media of the entire content or parts thereof.
Disclosure according to Section 34b of the German Securities Trading Act and FinAnV
- M.M.Warburg & CO KGaA or SES Research GmbH has been a member of a syndicate that has underw ritten securities of thecompany that is the subject of this analysis in the last 12 months.
- M.M.Warburg & CO KGaA is serving as a liquidity provider for securities of the company that is the subject of this analysis on thebasis of an existing designated sponsorship contract.
Section 34 b of the German Securities Trading Act in combination w ith the FinAnV requires an enterprise preparing a securities analysis to point out possible conflicts of interest w ith respect to the company that is the subject of the analysis. In this connection, w e point out that:
The valuation underlying the rating of the equity security analysed in this report is based on generally accepted and widely used methods of fundamental valuation, such as DCF model, Peer group comparison and – where applicable – a Sum-of-the-parts model. M.M.Warburg & CO KGaA and SES Research GmbH have set up effective organisational and administrative arrangements to prevent and avoid possible conflicts of interest and, where applicable, to disclose them. Valuations, ratings and target prices for the companies analysed by M.M.Warburg & CO KGaA and SES Research GmbH are subject to constant reviews and may therefore change, if any of the fundamental factors underlying these items do change. All share prices given in this equity analysis are closing prices, except where stated otherwise.
Neither M.M.Warburg & CO KGaA’s analysts nor SES Research GmbH's analysts do receive any payments directly or indirectly from any affiliates’ investment banking activity.
M.M.Warburg & CO KGaA and SES Research GmbH are under supervision of the BaFin – German Federal Financial Supervisory Authority.

InVision Software AG Research Note
SES Research GmbH – A Member of the Warburg Group Page 40
Investment recommendation: expected direction of the share price development for equity security up to the given Target price in the opinion of the analyst who covers the issue. B Buy: The price of the analysed equity security is expected to rise over the next 12 months. H Hold: The price of the analysed equity security is expected to remain mostly flat over the next 12 months. S Sell: The price of the analysed equity security is expected to fall over the next 12 months. “-“ Rating suspended: The available information does not currently permit an evaluation of the company. M.M.Warburg & CO KGaA and SES Research GmbH research universe by rating: Rating Number of stocks % of universeBuy 101 50%Hold 78 39%Sell 14 7%Rating suspended 9 4%Total 202
M.M.Warburg & CO KGaA and SES Research GmbH research universe by rating, looking only at companies for which a disclosure according to section 34b German Securities Trading Act has to be made: Rating Number of stocks % of universeBuy 80 58%Hold 45 33%Sell 7 5%Rating suspended 5 4%Total 137
30 31 32 33 34 35 36 37 38
5.07 6.07 7.07
Price and Rating History
Sources: Factset (prices) / SES Research (ratings)
Invision Software (IVXG.DE) as of 27.7.07
The boxes on the price and rating history chart indicate the date and rating of the Equity Alert issued by SES Research GmbH. Each box repre-sents a date on which an analyst made a change to a rating, except for the first box, which may represent the rating in place at the beginning of the period or the first Alert written on the issue in the past 12 months.