3.0 Theory of water electrolysis -...
25
Chapter 3 K. NAGA MAHESH Theory of water electrolysis 26 CHAPTER – 3 THEORY OF WATER ELECTROLYSIS 3.0 Theory of water electrolysis 3.1 Thermodynamics and kinetics Electrolysis of water is an electrochemical process, where water (H2O) is split into hydrogen (H2) and oxygen (O2) at their respective electrodes by passing electricity in a electrolysis cell. In this process the water is supplied to anode, to decompose into oxygen, protons, and electrons. The protons are transported through the proton conductive membrane (PEM) to the cathode, The schematic of the process has been given in Figure 3.1. The electrons are passed through the external circuit, which supplies the driving force (i.e. cell potential) for the reaction [P.Millet et al., 2010]. Anode : 2H2O → 4H + + O2 + 4e - 3.1 Cathode : 4H + + 4e - → 2H2 3.2 Overall cell : 2H2O → 2H2 + O2 3.3 The Gibbs free energy (∆G) for hydrogen and oxygen production through water electrolysis is give below: ∆G = µH2(g) + ½ µO2(g) – µH2O 3.4 2 2 1 0 2 ln( ) G RT pH pO =Δ + 3.5 Where ∆G is Gibbs free energy, µH2(g), µO2(g) and µH2O are chemical potentials of hydrogen, oxygen and water, pH2 and p02 are partial
Transcript of 3.0 Theory of water electrolysis -...

Chapter 3 K. NAGA MAHESH Theory of water electrolysis
26
CHAPTER – 3
THEORY OF WATER ELECTROLYSIS
3.0 Theory of water electrolysis
3.1 Thermodynamics and kinetics
Electrolysis of water is an electrochemical process, where water (H2O)
is split into hydrogen (H2) and oxygen (O2) at their respective
electrodes by passing electricity in a electrolysis cell. In this process
the water is supplied to anode, to decompose into oxygen, protons,
and electrons. The protons are transported through the proton
conductive membrane (PEM) to the cathode, The schematic of the
process has been given in Figure 3.1. The electrons are passed
through the external circuit, which supplies the driving force (i.e. cell
potential) for the reaction [P.Millet et al., 2010].
Anode : 2H2O → 4H+ + O2 + 4e- 3.1
Cathode : 4H+ + 4e- → 2H2 3.2
Overall cell : 2H2O → 2H2 + O2 3.3
The Gibbs free energy (∆G) for hydrogen and oxygen production
through water electrolysis is give below:
∆G = µH2(g) + ½ µO2(g) – µH2O 3.4
2 2
1
0 2ln( )G RT pH pO= ∆ + 3.5
Where ∆G is Gibbs free energy, µH2(g), µO2(g) and µH2O are chemical
potentials of hydrogen, oxygen and water, pH2 and p02 are partial

Chapter 3 K. NAGA MAHESH Theory of water electrolysis
27
pressures of hydrogen and oxygen at conditions 1 atm and
temperature 25°C.
The reversible potential to split water electrochemically can be
explained using Nernst equation:
rev GE
nF
∆= − 3.6
( )O
2 2
G RTln pH pO
nF nF
∆= − − 3.7
( )O
2 2
RTE ln pH pO
nF= − 3.8
Where n is the number of electrons involved, R is the universal gas
constant, T is temperature (K), F is the Faraday constant, and EO is
the standard potential. At standard conditions (298 K, 1 atm) Erev =
1.23V which constitutes the lowest possible applied potential between
any two electrodes in order to split water.
½
½
Figure 3.1: Schematic of PEM water electrolysis [Aaron Marshall, 2007]

Chapter 3 K. NAGA MAHESH Theory of water electrolysis
28
The energy balance for the cell reaction may also be written, with the
energy required to break and form molecular bonds and to bring the
reactants to their reference states being the enthalpy (∆H):
∆G = ∆H − T∆S 3.9
At standard conditions
Utn = H
nF
∆− 3.10
where Utn is the thermoneutral potential difference,
At the cell potential
Ecell < Utn (Cell absorbs heat from the environment)
whereas if
Ecell > Utn (Heat is lost from the cell)
Efficiencies for the overall reaction can also be written with the
thermal energy efficiency defined as:
tn
cell
UH
E
є ∆ = 3.11
and the energy efficiency based on Gibbs free energy defined as:
rev
cell
EG
E
є∆ = 3.12
Although thermodynamics gives the minimum potential required to
split water, due to the kinetics of electrochemical reactions there will
always be overpotentials decreasing the efficiency.
Ecell = Erev + η anode − η cathode + IR 3.13

Chapter 3 K. NAGA MAHESH Theory of water electrolysis
29
Where Ecell, η anode, η cathode, and IR represent actual cell potential,
anodic overpotential, cathodic overpotential and voltage gain due to
the cell ohmic resistance.
Both overpotentials and ohmic resistance vary with current density.
The resistance is given by Ohm’s law, whereas the overpotentials can
be given by the Tafel equation (which is a simplification of the Butler-
Volmer equation):
0
RTanode ln
a F
i
iη
αη = 3.14
0
C
RT | |cathode ln
F
i
iη
αη = − 3.15
The term RT/IηF is defined as the Tafel slope, which can be used to
determine the reaction mechanism. Both Tafel slope and exchange
current (i0) are material dependent, and are the principle measures of
specific electrocatalytic activity.
3.2 Faraday’s calculations for H2 production
The theoretical yield of hydrogen is calculated using faraday’s laws
equation (3.16) given below [Alshelyab M et al., 2008] at STP
conditions in cubic centimetre per minute (cc min-1).
Faraday’s laws equation (3.16):
2e
H
ItMW
FN= 3.16
Where W is the weight of the hydrogen produced at the cathode, I
applied current (A), t time (s), M the molecular weight of hydrogen (g

Chapter 3 K. NAGA MAHESH Theory of water electrolysis
30
mol-1), F the faraday’s constant (96485 C mol-1) and Ne the number of
electrons involved in the reaction.
3.3 Electrode reactions
3.3.1 Hydrogen evolution reaction (HER)
The standard potential of H2 is by definition zero, the electrochemical
activity of HER on different metals can be compared by using
“Vulcano-plot” shown in Figure 3.2 and it can be seen that the metals
of intermediate bond-strength energy is the most active towards the
HER represented by the noble metals [S.Trasatti et al., 1972]. On the
left side of the curve the metals with low bond-strength are seen, the
rate determining step shall be discharge of H atoms, whereas on the
right side metals with stronger bond length can be seen, the rate
determining step shall be the H desorption on the surface of the metal
[B.E.Conway et al., 2000]. The noble metals are more corrosion
resistant in acid solutions hence suitable for this kind of applications.
Attempts are being carried out worldwide to combine different metals
from the opposite branches of the “Vulcano-plot”, This means to
combine metals which have less than five d-electrons (hypo-electronic)
with metals which have more than five d-electrons (hyper-electronic)
in the outer shell to obtain better properties like intermediate bond
strengths. The choice of the metals are limited noble metals and its
oxides (Pt, Pd, RuO2, IrO2) and a few tungsten compounds (WO3, WC),
because of acidic environment of the membrane [S.Trasatti et al.,
1990].

Chapter 3 K. NAGA MAHESH Theory of water electrolysis
31
Hydrogen evolution on Palladium
Pd is considered as one of the most active catalyst for the HER
comparatively with Pt, even though the Pt is considered as one of the
best electrocatalyst commonly used in fuel cell for the catalysis (for
hydrogen oxidation and oxygen reduction). Pd, which is more
abundant than Pt, has been less extensively studied for such
applications despite interesting electrocatalytical properties [Grigoriev
S et al., 2006; Fenglei Li et al., 1997]. Reaction steps and Tafel slopes
of HER are given in table 3.1.
Figure 3.2: Vulcano-plot of HER on different metals [S.Trasatti, 1972]

Chapter 3 K. NAGA MAHESH Theory of water electrolysis
32
Table 3.1: Reaction steps and Tafel slopes of HER [J.Fournier et
al., 1995]
ba
low η
ba
high η
3 2adsM H O e M H H O+ − →+ + − +← 120 120 Volmer
3 2( ) 2ads gM H H O e M H H O+ − →− + + + +← 40 120 Heyrovsky
2( )2 2ads gM H M H→− +← 30 α Tafel
3.3.2 Oxygen evolution reaction (OER)
The oxygen evolution reaction (known as the oxygen reduction
reaction in fuel cell) is one of the most studied electrochemical
processes. Even though the reaction and mechanism is still not widely
understood, and is difficult to interpret [S.Trasatti et al., 1990] due to
the following reasons.
The reaction is very sensitive to the electrode surface properties
due to its high energy reaction intermediates and complex
pathways of high activation energy
The electrode surface can go dramatic changes at the different
potential ranges
The kinetics may also be time dependent
Many theories have been proposed on OER mechanisms, but very few
take into consideration the nature of the electrode surface [S.Trasatti
et al., 1990], which is critical for understanding the real reaction
mechanism. Most of the cases only oxide covered electrodes are
discussed in any mechanism. The reaction will always occur on an

Chapter 3 K. NAGA MAHESH Theory of water electrolysis
33
oxide surface, as the metal-oxygen (M-O) bond is always stronger than
the O–O dissolution energy. The OER involves the formation and
breakage of bonds between the metal and oxygen species, indicating
that the electrocatalysis process includes some material
transformation processes as well. This complex combination of
reactions involving surface species and material transformations has
lead to the formation of a so-called Volcano plot (Figure 3.3). The
ability of the oxide to undergo solid state redox transitions is clearly
important in respect to the materials electrocatalytic activity. suggest
The strength of the M–O bond in the various intermediates is critical
in determining the rate of desorption and/or adsorption steps in the
oxygen evolution mechanism [Matsumoto and Sato, 1986]. They also
suggest that rate of electron transfer follows the Franck-Condon
principle, in which the electron transfer is controlled by the density of
electron states at the Fermi level and the degree of orbital overlapping
of the active sites and adsorbed intermediates.
The Electrochemical Oxide path: [J.O.M.Bockris, 1956]
2 H eadsS H O S OH+ −→+ − + +← 3.17
H eadsS OH S O+ −→+ − + +← 3.18
( )22 2 gS O S O− → + 3.19
The Oxide path:
2 H eadsS H O S OH+ −→+ − + +← 3.20

Chapter 3 K. NAGA MAHESH Theory of water electrolysis
34
22 H OadsS OH S O S→− − + +← 3.21
( )22 2 gS O S O− → + 3.22
The Krasil’shchikov path:
2 H eadsS H O S OH+ −→+ − + +← 3.23
O + HadsS OH S− +→− −← 3.24
O O + eS S− −→− −← 3.25
( )22 2 gS O S O− → + 3.26
The reaction mechanism and rate determining step can be determined
from analysis of the Tafel slope found from steady state polarisation
measurements.
Figure 3.3 Electrocatalytic activities towards the oxygen evolution reaction
of various oxides as a function of the enthalpy of lower to higher oxide transition [S.Trasatti, 1984]

Chapter 3 K. NAGA MAHESH Theory of water electrolysis
35
3.4 The polymer electrolyte membrane
The polymer electrolyte membrane (PEM) is a solid polymer electrolyte
membrane used as electrolyte for fuel cells and water electrolysers.
These electrolyte membranes have high mechanical, chemical and
thermal stability, and shows high ionic conductivity and low
permeability to H2 and O2 gases. The perfluorosulfonated ionomer
(PFSI) membrane or PEM membrane consists of a
polytetrafluoroethylene backbone and perfluoronated pendant side
chains terminated by sulphonic groups. The perflouronated carbon
backbone chain is responsible for the mechanical and thermal
stability of these membranes and the sulphonic ionic groups are
responsible for the ionic conductivity. These membrane types are
developed for the chlor-alkali industry, several types of commercial
membranes are available and given in Table 3.2 below.
Table 3.2 Commercially available membranes
Commercial trade name
Manufacturer
Thickness (µm)
EW
(g.mol-1 3SO−)
Resistance (Ω.cm2)
Nafion 112 Dupont 50 1100 0.036
Nafion 115 Dupont 125 1100 0.168
Nafion 117 Dupont 175 1100 0.23
Flemion S Asahi Glass Co 80 1000 0.10
Aciplex –S Asahi Glass Co 120 1000 0.111
The Nafion membrane is today the most available type of membrane
and is commonly used in fuel cell and electrolysis research. The
polymer structures of the Nafion membrane from DuPont can be seen
in Figure 3.4. The different PFSI membranes typically differ in length
Chapter 3 K. NAGA MAHESH Theory of water electrolysis
36
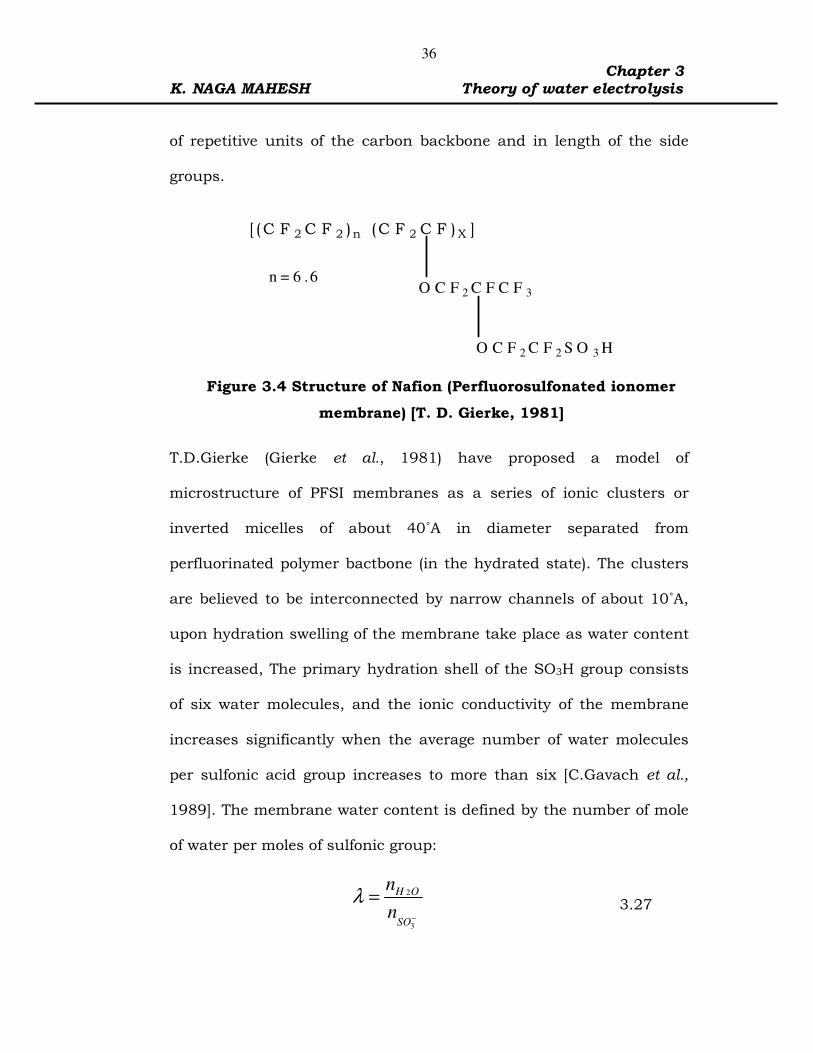
of repetitive units of the carbon backbone and in length of the side
groups.
T.D.Gierke (Gierke et al., 1981) have proposed a model of
microstructure of PFSI membranes as a series of ionic clusters or
inverted micelles of about 40˚A in diameter separated from
perfluorinated polymer bactbone (in the hydrated state). The clusters
are believed to be interconnected by narrow channels of about 10˚A,
upon hydration swelling of the membrane take place as water content
is increased, The primary hydration shell of the SO3H group consists
of six water molecules, and the ionic conductivity of the membrane
increases significantly when the average number of water molecules
per sulfonic acid group increases to more than six [C.Gavach et al.,
1989]. The membrane water content is defined by the number of mole
of water per moles of sulfonic group:
2
3
H O
SO
n
nλ
−
= 3.27
[ (C F 2 C F 2 )n (C F 2 C F )X ]
O C F 2 C F C F 3
O C F 2 C F 2 S O 3 H
n = 6 .6
Figure 3.4 Structure of Nafion (Perfluorosulfonated ionomer
membrane) [T. D. Gierke, 1981]

Chapter 3 K. NAGA MAHESH Theory of water electrolysis
37
Where n is number of moles. The ionic conductivity increases by
increasing the water content (λ) and reaches a value of 18 for 100%
relative humidity (RH) under fuel cell operation and approximately 22
when the membrane is swollen in water [T.A.Zawodzinski et al., 1995].
A certain number of water molecules are transferred per H+ ion by
electro-osmotic drag, during proton exchange. The drag coefficient, ξ,
has been found to be about 1 H2O/H+ and independent of current
density for less than 100% humidification and 2–3 H2O/H+ for a
Nafion membrane swollen in water [T.A.Zawodzinski et al., 1995]. The
equivalent weight (EW) is defined as weight of polymer per sulfonic
group and a lower EW represent more sulfonic groups and higher
specific ionic conductivity of the polymer. The membrane type must be
chosen according to the specific system. Gas permeation and risk of
membrane destruction must be taken into account.
3.5 Electrocatalysis and electrocatalysts
As mentioned in section 3.1 at standard conditions,
thermodynamically only 1.23V, are required to split water.
Unfortunately due to the kinetics of the reactions, some extra energy
(i.e. the overpotentials) is required in order to have the reaction
proceed at a reasonable rate. The overpotentials are strongly
dependent on the material used for the electrodes (i.e. the
electrocatalysts). Therefore the electrocatalysts are chosen in order to
decrease the overpotentials as well as to improve other important
aspects of the process.

Chapter 3 K. NAGA MAHESH Theory of water electrolysis
38
Requirements of electrocatalysts
High surface area
High electrical conduction
Good electrocatalytic properties
Long-term mechanical and chemical stability
Minimised gas bubble problems
Enhanced selectivity
Availability and low cost
Health safety
Factors influencing electrocatalysis
Chemical nature of the catalyst
Morphology (dispersion, crystal size, crystallinity, lattice
distortion etc.)
Non-stoichiometry (ionic defects, electronic defects, solid-state
redox etc.)
Magnetic properties
Band structure of the oxide
Bond strength of M–O
Number of d-electrons
Effective Bohr magneton
Surface electronic structure
Geometric factors
Crystal-field stabilization energy
Synergetic effects (mixed and doped oxides)

Chapter 3 K. NAGA MAHESH Theory of water electrolysis
39
The catalyst structure (particle size) is an important aspect, when
used as a catalytic layer consisting of catalytic particles (e.g. fuel cell
or PEM water electrolysis). These particle structures will influence the
dispersion or utilization of active material, the total available surface
area, layer morphology, product and reactant transport phenomena,
layer and particle electronic conductivity, and layer mechanical
stability. The particles with nano-sized structure also influence atomic
behavior and properties of the materials [D.D.Macdonald et al., 1991],
and different catalytic properties can be exhibited by metal-support
interactions [S.Trasatti et al., 1972].
3.6 Experimental and characterization methods
3.6.1 Polarization methods
By polarizing the electrode under equilibrium conditions, the steady
state polarization behaviour of the electrode reaction can be
measured. The measurement can be performed either by controlling
the current (galvanostatic control) or the potential (potentiostatic
control) and the response in potential or current is measured. The
steps are performed in small increments and the response is
measured typically after 10 minutes where equilibrium conditions of
the electrode reactions can be assumed. Steady state polarization
measurements include all polarization effects including the
thermodynamic potential, the overpotential due to the surface
reactions, ohmic losses and diffusion terms.
Chapter 3 K. NAGA MAHESH Theory of water electrolysis
40
To drive the reaction 3.1 at a practical rate, additional energy must be
applied to overcome the kinetic hindrance of the reaction and the
ohmic resistance. The potential which must be applied at a given rate
is given by:
Ucell = Erev + η + i · RΩ 3.28
Where RΩ is the ohmic resistance of electrolyte, cable connections and
wires. η can be divided into cathodic and anodic parts:
η = ηc − ηa 3.29
and are given by the Tafel equations above. By polarization of an
electrode, e.g. in anodic direction, and measuring the potential versus
a reference electrode the cathodic term can be neglected and equation
3.17 is written:
reva
0
E E b . log .i
i Ri
Ω = + + 3.30
a E' b . log .i i RΩ= + + 3.31
where
E’ = Erev + ba . log i0 3.32
At low current density (cd) where RΩ can be neglected, ba and E’ can
be found from the slope of the curve. For high cd the data must first
be corrected from iR-drop or, if proper knowledge about the reaction
exists, it can be found by fitting equation 3.19 to the measured data.
Figure 3.5 illustrates the efficiency of the electrolyser in a
characteristic I-V curve.

Chapter 3 K. NAGA MAHESH Theory of water electrolysis
41
3.6.2 Cyclic voltammetry
Cyclic voltammetry (CV) is a surface sensitive technique where each
material gives rise to a unique spectrum in a given medium. The
method is often applied for determination of the physio-chemical state
of an electrode surface. CV is useful to study the behaviour of
adsorbed species, participating as reaction intermediates in a given
reaction or as impurities, as well as redox couples in the solution and
at the electrode surface. Cycling the potential at different scan rates
can be performed to find diffusion coefficients of electroactive species
and the capacitance of an electrode (active surface area). Additionally,
CV can give information about the reversibility of the
charging/discharging process. In CV the potential is swept at a
Figure 3.5 Schematic of Current–voltage performances of a PEM water electrolyser [P.Millet, 2010]

Chapter 3 K. NAGA MAHESH Theory of water electrolysis
42
certain rate, ν, within the potential range of interest and the current
response is measured. The potential at a given time can be written
[A.J. Bard, 1980]:
Et = Et=0 ± ν · t 3.33
Where t is the time, Et is the controlled potential, Et=0 is the starting
potential, plus and minus indicates anodic and cathodic direction of
the sweep respectively. Table 3.3 shows some diagnostic criteria to
determine the reversibility of a charge transfer reaction without
diffusion or activation limitations where p indicate a point of interest
in the voltammogram, usually a peak or a point at fixed potential.
Table 3.3: Diagnostic criteria for reversible reactions
1. ip I ν
2. | / | 1
a ci ip p
=
3. Ep independent of ν
4. 59 a c
Ep E E mVp p n
∆ = − <
Capacitance
The double-layer capacitance, Cdl, arises from the potential
dependence of electrostatic charging of the electrode surface balanced
by dipole orientation of ions and water molecules in the solution near
the surface. Electrosorption of species at the surface of an electrode
give rise to a so-called pseudocapacitance, Cφ, where an intermediate
is formed that stores charge at the surface. In contrast to double layer

Chapter 3 K. NAGA MAHESH Theory of water electrolysis
43
charging, psuedocapacitance is a Faradaic process where the
electrons cross the double layer region. The total capacitance of an
electrode can be derived from CV by performing multiple scans at
different scan rates, ν [B.E.Conway et al., 1999]:
.dV
i C C vdt
= = 3.34
iC
v= 3.35
For a reversible process controlled by electrode kinetics, a plot of i
versus ν will give a straight line with slope equal to C.
Porous electrodes can give raise to a non-uniformity of
charging/discharging down the pores, due to ohmic effects which
makes potential penetration into the pores more difficult and may
result in a locally smaller potential range [B.E.Conway, 2001].
Integrated charge
The voltammetric charge of an electrode can be found from equation
3.35:
2
1*
E
E
iq dV
v∆ = ∫ 3.36
by integration between E1 and E2. q* is independent of ν in the
absence of ohmic drop, diffusion and/or kinetic limitations of the
charging process.

Chapter 3 K. NAGA MAHESH Theory of water electrolysis
44
A typical cyclic voltammogram of polished Palladium disk in N2
saturated 0.1 M H2SO4 solution at a sweep rate of 50 mV sec-1 has
been shown in Figure 3.6. The corresponding peaks observed shows
electrochemical activity of the Pd sample, a positive sweep started
from lower voltage values and moving right, the first peak at -0.1 V
(vs. SCE) is the hydrogen desorption peak. If the surface of the
catalyst is a thin film or very smooth and pure, multiple peaks could
be distinguished for desorption of monolayers of various strengths.
The reaction corresponding with the hydrogen desorption peak is:
adsH H e+ −→ + 3.37
Sweeping to higher voltages, formation of PdO takes place and
represented by the following chemical reaction:
Figure 3.6 CV of polished palladium disk in N2 saturated
0.1 M H2SO4 at a sweep rate 50 mVsec-1 [R.W.Reeve, 1998]

Chapter 3 K. NAGA MAHESH Theory of water electrolysis
45
2 2 2adsH O O H e+ −→ + + 3.38
The oxide formation region could be divided into two peaks that are
often distinguishable. At around 0.5 V SCE, the following reaction
occurred:
2Pd H O PdOH H e+ −+ → + + 3.39
A second small bump is seen around 0.8 V SCE. The second peak in
the oxide formation region corresponded to the following reaction:
PdOH PdO H e+ −→ + + 3.40
The voltage sweep then reached its set maximum of 1.0V and reversed
direction. At around 0.45 V SCE in Figure 3.6, the oxide reduction
region is reached. Here, PdO is reduced and the following general
reaction occurred:
22 2adsO H e H O+ −+ + → 3.41
At oxide 0.45 V SCE where the reduction peak occurred, both
reactions in Equations (3.39) and (3.40) occurred in reverse.
Finally, the cathodic hydrogen region peaks occurred at the same
potential as the hydrogen desorption peaks from the reaction in
Equation (3.37). The hydrogen adsorption reaction is:
adsH e H+ −+ → 3.42
The gap between the values for the positive sweep and the negative
sweep are the result of the electrical double-layer capacitance on the
surface of the catalyst.

Chapter 3 K. NAGA MAHESH Theory of water electrolysis
46
Figure 3.7 and 3.8 shows the typical CV of Pd/C and RuO2
respectively.
Figure 3.7 Cyclic voltammtery of (1) Pt40/Vulcan XC72 (2) PtPt0.5Pd0.540/Vulcan
XC72 and (3) Pd40/Vulcan XC72, v = 20 mVs-1 [S.A. Grigoriev, 2008]
Figure 3.8 Voltammogram of a RuO2 DSA electrode in 0.5 M H2SO4 [S. Ardizzone, 1990]

Chapter 3 K. NAGA MAHESH Theory of water electrolysis
47
The electrochemical surface area (ECSA) of the Pd/C catalysts can be
calculated using equation 3.43. It has been reported that Pd is entirely
oxidized to Pd oxide at potentials above 0.50V vs SCE. On the other
hand, Pd oxide is completely reduced to Pd below 0.30 V vs SCE
[S.I.Pyun et al., 1996]. Assuming that Pd oxide is composed of PdO or
Pd(OH)2, the amount of charge necessary for reduction of a monolayer
of Pd oxide on a smooth Pd electrode was reported to be
0.255 mC.cm-2. The hydrogen desorption and oxygen chemisorptions
peaks are shown in figure 3.6 (R.W.Reeve et al., 1998). ECSA of the
catalyst can be calculated using the following equation 3.43.
ECSA (m2 g-1) = 0.1 × Qr/m·c 3.43
Where
Qr = Area of Pd oxide reduction peak (C)
m = quantity of Pd loading (mg)
c = 0.255 mC cm-2
3.6.3 Inductive coupled plasma spectroscopy
Inductive coupled plasma (ICP) spectroscopy method is commonly
employed to determine the composition of the metal present in
sample. In the present work ICP technique has been used to
determine the weight percentage of Pd loaded on carbon support. A
known concentration of standard sample is introduced into the
plasma and the absorption frequency of the sample is recorded and
compared with prepared sample. Based on the absorption frequencies
the weight percentage of the sample has been calculated.

Chapter 3 K. NAGA MAHESH Theory of water electrolysis
48
3.6.4 Surface area measurement
The Surface area of the catalysts is determined by BET and Langmuir
isotherms, multilayer adsorption can be determined using BET
method. In the BET and Langmuir methods the adsorbed N2 gas is
measured, the adsorption process occurs by the formation of chemical
bonds (chemisorption), or by a weak vander Waals forces
(physisorption). The enthalpy for formation of the first monolayer is
assumed to be different and greater in magnitude than that of the
second and higher layers.
BET equation
( 1)1
1
oo
m m
o
C Cm
PP cPP
P V VV
P
−
= +
−
3.44
Where P is the equilibrium pressure, P0 is the vapour pressure of the
adsorbate at standard conditions, Vm is the volume required to cover
the adsorbent surface with a monolayer of adsorbate and c is a
temperature-dependent constant related to the enthalpies of
adsorption of the first and higher layers.
3.6.5 X-ray diffraction method
X-ray diffraction is a powerful technique that is commonly used to
determine the structures of new materials such as crystalline or
amorphous. However, the technique is limited by the ability to grow
nearly perfect crystals that are suitable for diffraction. For routine
structural characterization of materials, X-ray powder diffraction is far

Chapter 3 K. NAGA MAHESH Theory of water electrolysis
49
more common. The samples for powder diffraction may be large
crystals, or they may be in the form of a powder composed of
microcrystals that are too small to be seen by the human eye.
XRD is a non-destructive tool to characterize the electrode by
determining the material's crystal structure and the various phases.
XRD patterns of scattered x-ray photons showed peaks as specific
angles for crystalline materials. Peak patterns are specific to
individual materials. Peaks could be analyzed to determine average
crystal size using the Scherrer equation (3.46).
0.9
cost
B
λ
θ= 3.46
Where t is Average particle (crystalline) size of particle, B is the full
width half max (FWHM) of the diffraction peak, θ is the diffraction
angle, and λ is the wavelength of the x-rays, in all experiments fixed at
1.5406 A for CuK [S.L.Gojkovic et al., 2003].
The lattice parameter (α) has been calculated using the equation given
below.
αfcc = 2½ λ/sinθ 3.47
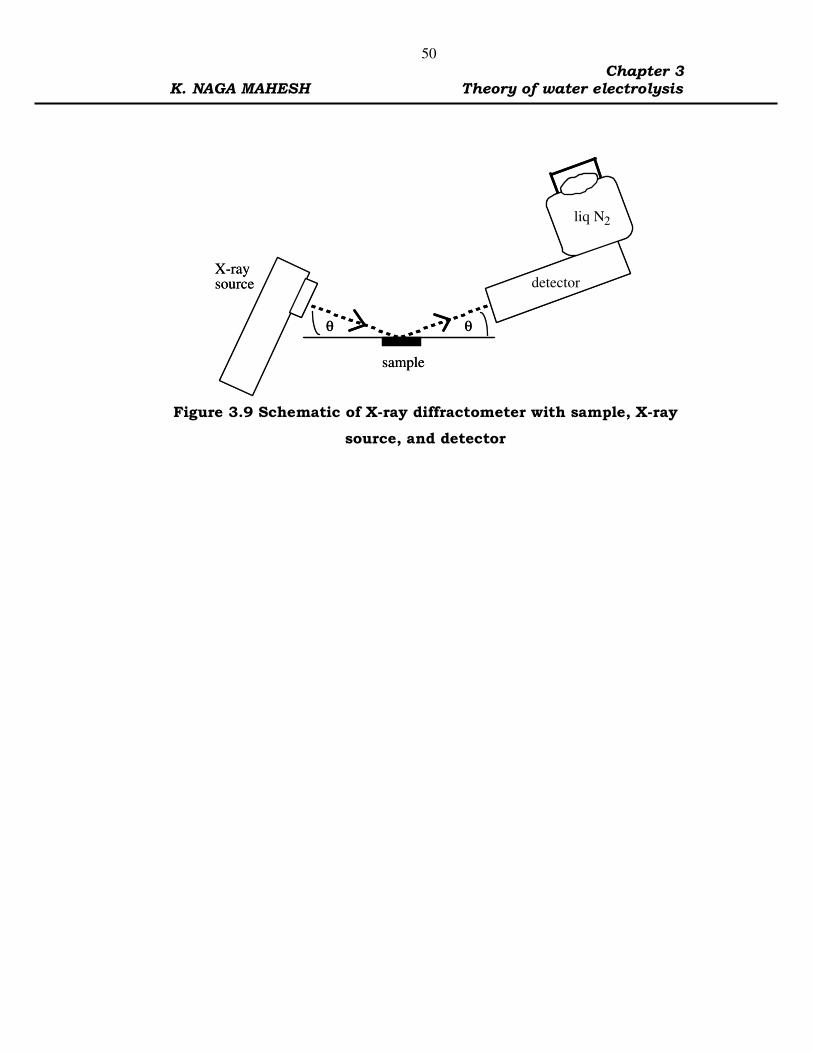
In the present study the prepared Pd/C electrocatalyst has been
characterized for its crystalline and structure orientation. The
schematic of the powder XRD has been represented in figure 3.9.
Chapter 3 K. NAGA MAHESH Theory of water electrolysis
50
sample
liq N2
detectorX-ray source
θ θ
Geometry of XDS 2000
sample
liq N2
detectorX-ray source
θ θ
Geometry of XDS 2000
Figure 3.9 Schematic of X-ray diffractometer with sample, X-ray
source, and detector