30 Days Outcome ACSIS 2013 - his-files.comhis-files.com/pdf/shaul.pdf · UAP 173 99.43 1 0.57 174...
34
30 Days Outcome – ACSIS 2013 Shaul Atar, MD Western Galilee Medical Center Nahariya
Transcript of 30 Days Outcome ACSIS 2013 - his-files.comhis-files.com/pdf/shaul.pdf · UAP 173 99.43 1 0.57 174...

30 Days Outcome –
ACSIS 2013
Shaul Atar, MD
Western Galilee Medical Center
Nahariya

Comments
Missing data – 39% to 75% (“smoking”
data).
“Other” category = Out of hospital sudden
death, VF, Hypothermia, etc.
30 days events = including index hosp.
Procedures = from discharge from
cardiology to 30 days

Re-hospitalization rates
ACS (n=1144)
Re-hosp. (n=162, 14.1%)
NSTEMI
(n=31, 2.7%)
Re-STEMI
(n=3, 0.26%)
Angina
(n=69, 6.03%)
Stent Thrombosis
(n=7, 0.61%)
Non-cardiac
(n=61)
cardiac
(n=101, 8.8%)

ACSIS 2010

Discharge Diagnosis 30 Days MORTALITY
Alive Died Total
STEMI 458
93.85
30
6.15
488
40.36
NSTEMI 493
97.05
15
2.95
508
42.02
UAP 173
99.43
1
0.57
174
14.39
OTHER 33
84.62
6
15.38
39
3.23
Total 1157
95.70
52
4.30
1209
100.00
Missing Data = 689
30 Days Mortality

ACSIS 2010

ACSIS – Mortality trends

RE-UAP/NSTEMI Discharge Diagnosis
STEMI NSTEMI UAP Total
NO 436
96.25
474
98.34
169
96.57
1113
97.29
YES 17
3.75
8
1.66
6
3.43
31
2.71
Total 453
39.60
482
42.13
175
15.30
1144
100.00
Missing Data = 717
P = ns

FU Cor.
angiography Discharge Diagnosis
STEMI NSTEMI UAP OTHER Total
NO 429
91.28
468
92.31
169
95.48
34
100.00
1100
92.59
YES 24
5.11
15
2.96
6
3.39
0
0.00
45
3.79
Total 470
39.56
507
42.68
177
14.90
34
2.86
1188
100.00
Missing data = 673
P = ns

FU CABG Discharge Diagnosis
STE
MI NSTEMI UAP OTHER Total
NO 434
95.81
447
92.36
165
94.29
31
91.18
1077
93.98
YES 19
4.19
37
7.64
10
5.71
3
8.82
69
6.02
Total 453
39.53
484
42.23
175
15.27
34
2.97
1146
100.00
Missing data = 715

Clinical Events – 30 Days FU
%
New AF 0.7
Aborted SCD 0.09
Major Bleeding 1.22
Revascularization 10.47
CABG 6.02
PCI* 4.45
CRTD/ICD 0.18
Pacemaker 0.35
* PCI = 2.6% in STEMI, 1.83% in NSTEMI

Medications at 30 days

At discharge
Clopidogrel
FU TREAT.
Clopidogrel
NO YES Total
NO 583
92.54
47
7.46
630
55.51
YES 69
13.66
436
86.34
505
44.49
Total 652
57.44
483
42.56
1135
100.00
At discharge
Prasugrel FU TREAT. Prasugrel
NO YES Total
NO 793
96.12
32
3.88
825
72.94
YES 28
9.15
278
90.85
306
27.06
Total 821
72.59
310
27.41
1131
100.00
At discharge
Ticagrelor FU TREAT. Ticagrelor
NO YES Total
NO 926
98.41
15
1.59
941
83.20
YES 35
18.42
155
81.58
190
16.80
Total 961
84.97
170
15.03
1131
100.00
Clopidogrel
Prasugrel
Ticagrelor
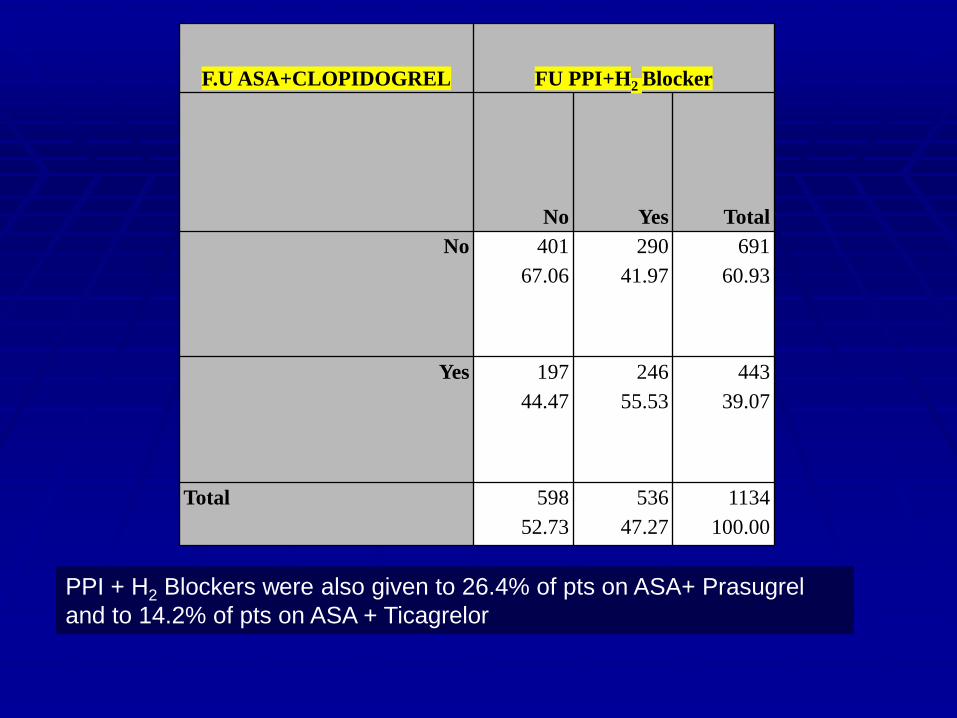
F.U ASA+CLOPIDOGREL FU PPI+H2 Blocker
No Yes Total
No 401
67.06
290
41.97
691
60.93
Yes 197
44.47
246
55.53
443
39.07
Total 598
52.73
536
47.27
1134
100.00
PPI + H2 Blockers were also given to 26.4% of pts on ASA+ Prasugrel
and to 14.2% of pts on ASA + Ticagrelor

OAC & NOAC
Warfarin – 6.44%
Dabigatran – 0.79%
Rivaroxaban – 0.44%

Rehabilitation
programs

Rehabilitation
Referral Discharge Diagnosis
STEMI NSTEMI UAP OTHER Total
NO 136
31.12
211
45.09
113
67.66
22
64.71
482
43.58
YES 301
68.88
257
54.91
54
32.34
12
35.29
624
56.42
Total 437
39.51
468
42.31
167
15.10
34
3.07
1106
100.00
Missing Data = 713 (39%)
P < 0.001
Referral to rehabilitation program

Rehabilitation Participation Discharge Diagnosis
STEMI NSTEMI UAP OTHER Total
NO 322
75.06
374
81.84
146
87.43
27
81.82
869
80.02
YES 107
24.94
83
18.16
21
12.57
6
18.18
217
19.98
Total 429
39.50
457
42.08
167
15.38
33
3.04
1086
100.00
Missing Data = 733
Participation in rehabilitation program
P = 0.0039

Rehabilitation Participation Gender
MALE FEMALE Total
NO 676
78.33
193
86.55
869
80.02
YES 187
21.67
30
13.45
217
19.98
Total 863
79.47
223
20.53
1086
100.00
Missing Data = 733
Rehabilitation participation by gender
P = 0.006

Rehabilitation Referral REGION
NORTH CENTER JERUSALEM SOUTH Total
NO 204
62.39
203
40.60
60
32.26
15
16.13
482
43.58
YES 123
37.61
297
59.40
126
67.74
78
83.87
624
56.42
Total 327
29.57
500
45.21
186
16.82
93
8.41
1106
100.00
Missing Data = 713
Referral to rehabilitation program by region
P < 0.001


Rehabilitation
Participation REGION
NORTH CENTER JERUSALEM SOUTH Total
NO 290
88.96
358
73.51
157
84.41
64
73.56
869
80.02
YES 36
11.04
129
26.49
29
15.59
23
26.44
217
19.98
Total 326
30.02
487
44.84
186
17.13
87
8.01
1086
100.00
Missing Data = 733
Participation in rehabilitation program by region
P < 0.001


Smoking cessation

Smoking status Discharge Diagnosis
STEMI NSTEMI UAP OTHER Total
quit smoking 95
41.85
61
36.31
18
33.33
5
55.56
179
39.08
smoking 132
58.15
107
63.69
36
66.67
4
44.44
279
60.92
Total 227
49.56
168
36.68
54
11.79
9
1.97
458
100.00
Smoking status at 30 days
Non smokers = 730, total = 1188
P = ns

Instruction on smoking cessation) Discharge Diagnosis
STEMI NSTEMI UAP OTHER Total
UNK 163
230
64
19
NO 117
38.11
150
54.15
69
61.06
9
60.00
345
48.46
YES 190
61.89
127
45.85
44
38.94
6
40.00
367
51.54
Total 307
43.12
277
38.90
113
15.87
15
2.11
712
100.00
P< 0.001

Referred to smoking
cessation program Discharge Diagnosis
STEMI NSTEMI UAP OTHER Total
UNK 165
233
64
19
NO 273
89.51
251
91.61
109
96.46
14
93.33
647
91.51
YES 32
10.49
23
8.39
4
3.54
1
6.67
60
8.49
Total 305
43.14
274
38.76
113
15.98
15
2.12
707
100.00
Frequency Missing = 1154

participating / participated in a smoking
cessation program Discharge Diagnosis
STEMI NSTEMI UAP OTHER Total
UNK 161
220
61
19
NO 302
97.73
283
98.61
113
97.41
15
100.00
713
98.07
YES 7
2.27
4
1.39
3
2.59
0
0.00
14
1.93
Total 309
42.50
287
39.48
116
15.96
15
2.06
727
100.00

Smoking status Level of education
ELEMENTARY
HIGH
SCHOOL
HIGHER EDUCATION /
ACADEMIC Total
N 157
210
202
quit smoking 38
29.23
63
39.62
44
50.57
145
38.56
smoking 92
70.77
96
60.38
43
49.43
231
61.44
Total 130
34.57
159
42.29
87
23.14
376
100.00
P = 0.0062
Smoking status by education

Smoking status Marital status
SINGLE MARRIED / ATTACHED DIVORCED Total
quit smoking 9
42.86
138
39.09
17
32.69
164
38.50
smoking 12
57.14
215
60.91
35
67.31
262
61.50
Total 21
4.93
353
82.86
52
12.21
426
100.00
Missing data = 1206
P = ns

Smoking status Ethnicity
ISRAELI
JEW
ISRAELI
ARAB Total
N 609
110
quit smoking 140
46.36
35
24.82
175
39.50
smoking 162
53.64
106
75.18
268
60.50
Total 302
68.17
141
31.83
443
100.00
Frequency Missing = 1318
P< 0.001
Conclusions
Complete data – at 6 months
Appears to be no significant difference
from ACSIS 2010
We are still lacking in the battle against
smoking

• Rehabilitation – low referral rates & severe
shortage of programs countrywide, mainly in
the periphery.
•There is an urgent need to identify specific
populations (ethnic, socio-economic, etc.) with
increased educational & medical needs.
Conclusions (2)

:תודה רבה
שלומי מטצקי' לפרופ
ר זאזא יעקבישוילי"ד
אילן גולדנברג' לפרופ
IACT לצוות ה
ACSISולכל מי שתמך בסקר