30-47 - IAEA
95
SD9900046 PREPARATION OF PHENACYLCHLORIDE, MORPHOLINOPHENACYL AND N-PIPERIDINOPHENACYL OXIMES AND STUDY OF THEIR COMPLEXATION WITH COPPERdD AND COBALT(II) IONS A THESIS SUBMITTED FOR THE DEGREE OF M.SC. BY:- KAMAL ELDIN AHMED ALI B.SC. (HONOURS) DEPARTMENT OF CHEMISTRY FACULTY OF SCIENCE UNIVERSITY OF KHARTOUM 30-47
Transcript of 30-47 - IAEA

SD9900046
PREPARATION OF PHENACYLCHLORIDE,MORPHOLINOPHENACYL AND N-PIPERIDINOPHENACYL
OXIMES AND STUDY OF THEIR COMPLEXATIONWITH COPPERdD AND COBALT(II) IONS
A THESIS SUBMITTEDFOR THE DEGREE OF M.SC.
BY:-KAMAL ELDIN AHMED ALI
B.SC. (HONOURS)
DEPARTMENT OF CHEMISTRYFACULTY OF SCIENCE
UNIVERSITY OF KHARTOUM
3 0 - 4 7
DISCLAIMER
Portions of this document may beillegible in electronic image products.Images are produced from the best
available original document.

TABLE OF CONTENTSAcknowledgement IVDedication VAbstract IVCHAPTER ONE1. Introduction 11.1 General Remarks 11.2 d-Block elements 11.3 General properties of d-block elements 11.4 Co-ordination chemistry of copper(II) complexes 21.5 Co-ordination chemistry of cobalt(II) complexes 31.6 Ligands 41.6.1 Classification of ligands 51.6.2 Chelate system 51.6.3 Factors which affect chelate formation 51.6.4 Oxime ligands 61.6.6 Oxime chelate complexes 61.7 Solvent extraction of metals 71.7.1 Choice of solvent for extraction 81.7.2 Stripping 81.7.3 Types of solvent extraction 91.7.4 Quantitative aspect of solvent extraction 91.7.5 Advantages of solvent extraction 101.8 Physicochemical methods for determination of
stoichiometry and stability constant 101.8.1 Colligative properties 101.8.2 Colourimetry and spectrophotometry 111.8.2.1 a-Continuous variation method 111.8.2.2 b-Mole ratio method 111.8.2.3 c-Slope ratio method 121.9 Method of determination of copper 121.10 Method of determination of cobalt 13CHAPTER TWO2. Experimental 142.1 Preparation of oxime ligands 142.1.1 Preparation of phenacyl chloride 142.1.2 Preparation of phenacyl chloride oxime 142.1.3 Preparation of morpholino-phenacyl oxime 152.1.4 Preparation of N-piperidino-phenacyl oxime 152.2 Reagents grade 162.2.1 pH-determining solutions 162.2.2 Acetate buffer solutions 162.2.3 Oxime solutions 162.2.4 Salt solutions 162.2.5 Organic solvent 172.2.6 Instruments 172.3 Study of oxime metal Ion complexes 172.3.1 Identifications of specific wavelength of
maximum absorbances 172.3.2 Effect of pH 17

2.3.3 Effect of time 182.3.4 Stoichiometry of metal ion-oxime complexes 182.3.4.1 Mole-ratio method 182.3.4.2 The continuous variation method 182.3.4.3 Determination of the formation constant 192.3.4.4 Slope ratio method 202.3.5 Effect of solvent 202.4 Determination of copper as diethyldithiocarbamate complex 212.5 Quantitative colourimetric determination of cobalt using
2-Nitrosonaphthol reagent 212.6 Study of copper(II) morpholinophenacyl oxime complex 222.7 Study of copper(II) N-piperidinophenacyl oxime complex 322.8 Study of phenacylchloride oxime copper(II) complex 432.9 Determination of copper (II) as diethyldithiocarbamate 532.9.1 Determination of extraction percent of morpholinophenacyl
oxime ligand 552.9.2 Determination of extraction percent of Copper (II) with
N -piperidinophenacyl oxime ligand 552.9.3 Determination of extraction percent of Copper (II) with
phenacylchloride oxime ligand 552.10 Study of morpholinophenacyl cobalt(II) oxime complex 562.11 Study of N-piperidinophenacyl cobalt(II) oxime complex 652.12 Quantitative colourimetric determination of cobalt using
2-Nitroso-l-naphthol reagent 762.12.1 Determination of percentage extraction of cobalt(II)
with phenacyl oxime ligands 782.12.2 Preparation of copper(II) and cobalt(II) complexes
in solid form 782.12.3 Physicochemical analysis of phenacyl oxime ligands 782.12.4 Physicochemical analysis of phenacyl oxime complexes 79CHAPTER THREE3. Discussion 804. References 83

ACKNOWLEDGMENT
My respectful gratitude goes to Professor G. M. Iskandar and Dr. S. B. Salainafor starting this work and their indispensable help I received from them duringthe course of this study.I am greatly indebted to my supervisor, Dr. Hassan A/Azizz, who has supervisedand continued this study and offered his directions, encouragement and guidancethroughout this work.I am indebted to the chemistry department ( U. Of K .) for offering laboratoryfacilities.I am also grateful to Mrs. Mariam Elsiddig and Mr. Saad Mahgoub, for theirassistance in the operation of the I. R. and U. V. Spectrophotometers,

DEDICATION
TO MY PARENTS

ABSTRACT
The aim of the present work is to prepare phenacyl chloride oxime andphenacyl oximes of N-piperidine and morpholine deravatives, and mainly tostudy their complexes with Cu(II) and Co(II) ions with objective ascertainingthat one of theses ligands can be used in quantitative extraction of the thesemetal ions from the aqueous solution.
Copper (II) salts form 1:1 complexes with the phenacyl oximes ofN-piperdine and morpholine and 1:2 complex with phenacyl chloride oxime.However, cobalt(II) salts form 1:2 complexes with phenacyl oxime of N-piperidine and morpholine but does not complex with phenacyl chloride oxime.
The stoichiometry of these complexes were determined by UV/VISspectrophotometry using the mole ratio, continuous variation and slope ratiomethods. The stability constants of the five complexes were calculated fromabsorbances using Job's method. They showed that the copper (II) and cobalt(II) complexes with N-piperidinophenacyl oxime are more stable than those withmorpholinophenacyl oxime. Copper(II) complexes with any of these two ligandsare more stable than those of cobalt (II).
IR spectra of the complexes of copper (II) and cobalt (II) with phenacyloximes of N-piperidine and morpholine show diminished peaks of hydrogenbonds between N and O atoms of the ligand.
Specific extractabilities using amylalcohol of copper (II) complexes withthe three ligands increase from pH 4 to reach its maximum at pH 8 . The highvalue for N-piperidinophenacyl oxime ligand (96-97%) indicates that, this ligandcan be used as analytical reagent for the quantitative spectrophotometricdetermination of copper (II) salts in aqueous media.
Cobalt (II) complexes were formed and extracted from solution only atpH 6 (specific pH). The extractabilities ranging from 81.6-87.2% warrants theuse of these ligands in quantitative spectrophotometric determination of cobalt(II).
VI

CHAPTER ONE
INTRODUCTION

MNTRODUCT1ON
1.1 General Remarks :-
Long before the Danish chemist S. M. Jorgensen (1837-1914) began his
extensive studies on the synthesis of complex compounds in which metal halides and
other salts could' give compounds with neutral molecules it was known that many of
these compounds could easily be formed in aqueous solutions.
The recognition of the true nature of complexes began with Alfred Werner
(1866-1914;, followed by the ideas of G. N. Lewis and N. V. Sidgwick. who proposed
that the chemical bond requires the sharing of an electron pair. This led to the idea
that a neutral molecule with an electron donor, Lewis base can donate these electrons
to a metal ion or an electron acceptor Lewis acid.
1.2 d- Block Element :-
The d-block elements are elements which have partly filled d- shell in many of
their commonly occurring oxidation states such as copper , silver and gold , (Cu (II)
has a 3d9 configuration, Ag(I) a 4d° configuration and Au (III) a 5d8 configuration).
Their chemical behavior is. on the whole , quite similar to (hat of other transition
elements.
1.3 General properties of d- block elements :-
They are all hard, with high melting and boiling points. They conduct heat and
electricity well, form alloys with one another and with other metallic elements. Many
of them are highly electropositive to dissolve in mineral acids, although a few are
noble i.e. have low electrode potentials and hence are unaffected by simple acids.
Many of them exhibit variable valency, and their ions and compounds are coloured }
The intense colour of metal chelates is due to charge transfer transitions. This
is simply the movement of electrons from the metal ion to the ligand or vice versa .
such transitions include promotion of electrons from levels in the ligand or from a

bonding orbital to the unoccupied orbitals of the metal ion. or promotion of o -
bonded electrons to unoccupied orbitals of Ihe ligand
1-4 Co-oruination chemistry of copper (11) complexes :-
The chemistry of copper in all its oxidation states is concerned with the
co-ordination properties of the various species because of Ihc slight tendency of
copper to form simple ions. '
Most Cu (II) sails dissolve readily in water and give the aqueous ion
[(Cu (l{2O)is)] ' where two of Ihe water molecules are further away from the metal
atom than the other four ' . Addition of ligands to such aqueous solutions leads to
the formation of complexes by successive displacements of water molecules. With
NH3, e.g. the species [(Cu (NH3 )(H2O)5 )]2+. [(Cu (NH3 ),t QhOh)]2*' are formed in
the normal way, but addition of the fifth and sixth molecules of NIl:i is difficult in
fact, the sixth can not be added to any significant extent in aqueous media but only in
liquid ammonia.(^
The reason for this unusual behaviour is connected with the Jahn - 'IV'H-
effect because of which the Cu (II) ion ?oes not bind fifth and the sixth ligands
strongly, even if the ligand is water . There is stepwise decrease of formation
constant; the formation constants k5 and k6 are very small indeed , (here for it was
found that with ethylenediamine [(Cu en (H2O),, )]"* and [(Cu ci^HiOh)]2 ' ' ' formed
readily, but [(Cu en3 )]~^ is fonned only at extremely high concentration of
ethylenediamine. Many other amine complexes of Cu (II) are much more intensely
blue than the aqueous ion. This is because the amines produce strong ligand -field,
which causes the absorption band to move from the far red to the middle of the red
region of the spectrum, i.e. in the aqueous ion \ho absorption maximum is at 800 tun.,
where as in [(Cu(NH3)4(H2O)2)]2" is at 600 tim. the reversal of the shifts with
increasing take up of ammonia for the liflh ammonia is fo be noted indicating the
weaker bonding of the fifth ammonia molecule. ('" '

Inspite of six - fold co-ordination, the typical co-ordination number of Cu (H)
is four and the arrangement of these four ligands is square planar as in
[(Cu (NH3)4)]2+, [(Cu(py)4)fand [(Cu(SCN)4)f.(3)
Distorted octahedral arrangement is shown by K2CuCL|2H2O which has a
central copper atom surrounded by two oxygen atoms at 2.01 A°, two chlorine atoms
at 2.31 A° and two further chlorine atoms at 2.98.A°.(8)
In addition to these typical arrangements, Cu (H) complexes may also exhibit
both three-fold and five-fold co-ordination . Recently three - co-ordination complexes
of Cu (II) are reported by Muto. *• '
A co-ordination number of five has also been found in several Cu (II)
complexes, although some of the individual cases may be disputed . These include
addition compounds of the chelating agent formed from Schiffs bases, of
salicylaldehyde and ethylenediamine ' , and the complex of cupric chloride with
terpyridyl. ^ , ethylacetoacetate with heterocyclic bases, ' and some crystalline
complexes such as that formed between ' Schiff base of salicylaldehyde and
ethylenediamine. ^ ' The latter complex has a dimeric structure in the solid state
which results from bonding between the copper atom of one unit and an oxygen atom
of the other. Here there is a pyramidal arrangement of ligands about the central copper
ion.
1.5 Co-ordination chemistry of cobalt: -
The complexes of cobalt were studied by a considerable number of workers ,
the most notable was S. M. Jorgensen. ' Cobalt can exhibit oxidation states of
0,1,2,3,4 and -2. Compounds with zero or negative oxidation states are primarily
carbonyls or their derivatives. The compounds of Co (1) are very few in number such
as [(Co(Dipyr. )f(16) [(Co (CN)5X)]5(17) and [(Co(CNCH3)5] CICv (1*}
Complexes of Co (II) are quite numerous and have been thoroughly studied.
They are generally labile and may exhibit co-ordination numbers of four, five and six.

Co-ordination number four is common for halogen complexes while six is suitable for
most amines. The Co (H) species is readily oxidized in basic media , especially if
suitable ligands are present, such as NH3 resulting in Co (III) complexes. The
occurrence of Co (IV) in binuclear complexes in which the assignment of formal
charges leads to the possibility of both Co (III) and Co (IV) being present, as in
[(NH3)5-Co-0-0-Co(NH3)5)]+5.(19)
The behaviour of Co (II) in aqueous solution is strongly dependent on the pH
of the solution and the nature of the ligands present/ '
The reaction of Co (II) with cyanide in aqueous solution produces
[(Co(CN)j(OH2)]"3 which is capable of slowly reducing hydrogen ion concentration
derived from water in the presence of more cyanide :
2[(Co(CN)5 (OH2) )]3" + 2CN + 2H+ 2 (Co(CN)6)
3' + H2+ 2H2O ( 2^
CoCl2 in the presence of water , form pink hexahydrate (Co(H2Q)6) CI2 that
changes to anhydrous blue material when water is removed. The change Which' tends
to favour the replacement of water by chloride or any other halogen results in the(21") •
formation of the blue complexes.
The hexaco-ordinate Co (III) complexes are among the most stable co-
ordination compounds . In general, the donor atoms found in these complexes include
N, S, C, P and O. A general procedure of preparation of Co (III) complexes is the
oxidation of Co (II) salt in the presence of the ligand in basic solution salt.
Barbieri ^ ' has shown that C0CO3 is oxidized by H2O2 in NaHCC>3 solutions to give
the green (Co2(CC>3)3) ion which can subsequently be converted to other Co (III)
complexes by treatment with the desired ligand .
Cobalt (III) acetylactetonate is obtained when a Co (III) solution is treated
with acetylacetone. This method has recently been extended.v
1.6 Ligands:-
A ligand can be defined as any molecule or ion that has at least one electron
pair that can be donated. Ligands may also be called Lewis bases or nucleophiles. • <

1.6.1 Classification of ligands :-
Ligands may be classified as follows; the one attached directly tlirough only
one co-ordination atom "or using only on co-ordination site on the metal" is called
monodentate " one - toothed " ligand, the ligand attached through more than one atom
is multidentate , the number of actual coordinating sites being indicated by the terms
bidentate , tridentate , tetradentate and so on .
1.6.2 Chelate System:-
Multidentate ligands attached to a central atom by more than one co-
ordinating atom are called chelating ligands. Their complexes are called chelates.
1.6.3 Factors which affect chelate formation :-
(a) The basic strength of the chelating group: There is a relationship between
the basicity of a chelating group , as measured by pkb and stability of the chelate it
forms, the increase in basic strength of a ligand increases pkb,
(b) The nature of the donor atoms in the chelatirtg agent: Ligands which
contain donor atoms of the soft base type form the most stable complexes with the
relatively small group of class (b) metal ions (soft acids),
This is illustrated by the reagent diphenylthiocarbazone which is used in
solvent extraction of metal ion such as Pd (II) , Ag (I) , Hg (II), Cu (II), Bi (III) , Pb
(II) andZn(II),
(c) Ring size: Five or six membered conjugated chelate rings are the most
stable and they have minimum strain, the functional groups of the ligand must be
situated to permit the formation of stable ring,
(d) Resonance: The stability of chelate structure is increased by the(25}
contributions of resonance structure of chelate ring.v ;

The chelate complexes are so numerous and have been studied thoroughly.
This is because complexes of chelating ligands are in general more stable
thermodynamically than those with an equivalent number of monodentate ligands i.e.
chelate stability increases with the number of water molecules displaced from the
metal co-ordination sphere by one molecule of polyfunctional reagent, this is called
chelate effect.
1.6.4 Oxime ligand :-
Preparation :-
Aldehydes and ketones combine by condensation with hydroxylamine to form
oximes
RCHO+NtLOH
•TY
H TT— HL" NHOH
Oximes are usually well defined crystalline solids , and may be used to
identify carbonyl compounds.
The absorption region of oximes (C=N stretch ) is at 1690-1693 cm"1 and that
for the O--H stretch is at SSOO^SOcm"1.(26)
1.6.5. Oxime chelate complexes :-
The known oximes are the cis-dioximes such as dimethylglyoxime , which
with Ni (II) in ammonia solution , gives red nickel complex.

O-H-O
Me
C = N N
Me
NL
C = N / \N - C/ ' \ / \
Me \ / Me
O-H-O
Oxime complexes have formed the basis for the construction ion of
encapsulating ligands in which three oxygen atoms of oxime ligands are capped by
a group such as BF3. (27,28)
Such compounds can be obtained by interaction of dimethylglyoxime with a
metal salt in the presence of BF3 or B(OH)3.(29>30)
Mono-oximes with a different functional group ' ' such as 2(2-hydroxyethyl )
imino-3-oximo butane) can give complexes such as :
Me
Me'
H
CHj|
CH,
Mes ^Me/)c-c
-0^ ^O-N^
o-
N
|
Me'C—C
Me
Oxime complexes are used commercially for the extraction of metal by
complexing and extracting into organic solvent. * '
1.7 Solvent extraction of metals :-
One of the most important applications of solvent extraction is the separation
of metal cations. This separation can be accomplished in several ways. The
uncharged organic molecules tend to dissolve in the organic layer, while the charged

anion from the ionized molecules remains in the polar aqueous layer, Like dissolve
like.
Metal ions do not tend to dissolve appreciably in the organic layer. For them
to become soluble their charge must be neutralized and so they should be treated to
make them organic like. There are two ways of doing this :-
(1) Ion -association complex in which the ion is incorporated into a bulky
molecule and then associates with another ion of the opposite charge to form an ion
pair.
(2) The metal ion associates with another ion of greater size. A chelating agent
which contains two or more complexing groups is used. Many of these reagents form
coloured chelates with metal ions and form the basis of spectrophotometric methods(2)
for their determination.
1.7.1 The choice of solvent for extraction :-
The choice of solvent for extraction is governed by the following
considerations:
(1) A high distribution ratio for the solute and a low distribution ratio for undesirable
impurities.
(2) Low solubility in the aqueous phase .
(3) Sufficiently low viscosity and sufficient density difference from the aqueous phase
to avoid the formation of emulsions .
(4) Low toxicity and inflammability .
(5) Ease of recovery of solute from the solvent for subsequent analytical processing .
(25)(6) The ease of stripping by chemical reagents .
1.7.2 Stripping:-
It is the removal of the extracted solute from the organic phase for further
preparation and estimation step of the analysis( . Many colourimetric procedures
involve the measuring of the optical-density of the coloured complex solution.

When the extracting solvent is non-volatile it is necessary to strip the solute
from the solvent by chemical means , the usual procedure being to shake the solvent
with a volume of water containing acids or other reagents under conditions whereby
the extractable complex is destroyed . The metal ions are then quantitatively back-
extracted into aqueous layer.
1.7.3 Types of solvent extraction :-
The three basic types of liquid-liquid extraction are batch, continuous and
countercurrent distribution methods. There are just few basic types of apparatus,
however an infinite number of modification of their basic design have been involved.
Batch extraction is the simplest and consists of extracting the solute from an
immiscible layer by shaking the two layers until equilibrium is attained. Then the
layers are allowed to settle and are separated.
Continuous extractions are particularly applicable when the distribution ratio
is relatively small, so that large number of batch extractions would normally be
necessary to affect quantitative separation.
Discontinuous countercurrent distribution extractions have been applied with
great success to the fractionation of organic compounds in particular where the
distribution ratios are nearly of the same order of magnitude.
1.7.4 Quantitative aspect of solvent extraction: -
If the original weight of a solute in an aqueous phase is (W) and after one
extraction decreased to W then the distribution ratio (D) is expressed by.
(WWVKW IVa
Vo volume of organic phase
Va volume of aqueous phase
The percent extraction (E) will be expressed by :-

W-WE = x 100 (2)
W
wE = (1 > x 100 (3)
WE = - x 100 (4)
D + \/Vo
1.7.5 Advantages of solvent extraction :-
Lyman ' stated the advantages of extraction to the analytical chemist as :-
1- Ease and speed of accomplishment due to selectivity .2- General applicability due to the vast amount of complexing agents, solvents and
mixed solvents available.
3- Amount of sample required is governed by the purity required or the concentration
factor desired; both of which can be calculated.
4- The ultimate overall selectivity which can be obtained .
5- Reproducibility regardless of different solute proportion and the presence of
extraneous materials.
6- The number of solutes that can be isolated simultaneously.
7- The apparatus is simple and cheap, separatory funnel.
1.8 Phvsicochemical method of determination of the stoichiometry
and stability constant :-
The reaction of organic reagents with inorganic metal ions are very important
in inorganic analysis. There are some methods which are used for the
determination of composition and stability of metal complexes :-
1.8.1 Colligative properties :-
Complex formation decreases the amount of solute particles which results in
changing all solution properties such as elevation of boiling point and depression of
freezing point. ^ '
10

1.8.2 Colourimetrv and spectrophotometry :-
Spectrophotometry is based on the measurement of the absorbance for
monochromatic light passing through the solution containing the substance to be
determined.
Spectrophotometric methods can particularly be used for studying
complexation equilibria and determination of the amount of complex-forming
constituents as it is suited to the selective determination of very small concentrations
of species without changing the composition of the solutions. There are tliree
methods frequently applied in the evaluation of spectrophotometric data.
1.8.2.1 Continuous variation method :-
The modification of the Job's * ^ continuous variation method performed by
Vesburge and Cooper * ^ was applied to find the stoichiometry and formation
constant of the complex.
The case of co-ordination may be described by ;-
mM + nL ^MmLn
A series of solutions are prepared in which the sum of total concentration of M
and L is kept constant but their proportions are continuously varied.
The absorbances of the series is plotted against the mole fraction of the ligand
. The ratio of the stoichiometric coefficients n/m is determined from the mole fraction
at the point of intersection formed by extrapolation of the two sides of the triangle .
Limitations of the method are :-
1- It is not applicable for complexes if n/m > 3 , this is because the percentage error
increases.
2- Results are unreliable if more than one complex species are formed.
3- Measurements must be made at low concentrations.
1.8.2.2 Mole ratio method :-
(39)This method was introduced by Yoe and Jones . v ;
11

A series of solutions are prepared in which the total concentration of the metal
is kept constant and the concentration of the ligand is varied under similar condition.
A plot is prepared of absorbance as a function of the ratio of moles of ligand to moles
of the metal.
This is expected to give straight line from the origin to the point where
equivalent amounts of the constituents are present, the curve will then become
horizontal if only one complex of high stability is formed.
The corresponding point at the molar ratio axis to each intersecting point gives
directly the ligand to metal ion ratio in each complex.
1.8.2.3 Slope - ratio method :-
Harvey and Manning proposed and worked out the details of the slope -
ratio method.
hi this method two sets of solution , set A and set B, are prepared. In set A, the
concentration of the ligand is kept constant, while that of the metal in solution is
varied, hi set B, the concentration of the metal was kept constant while that of the
ligand is varied.
In series A a plot is prepared of the absorbance against concentration of metal,
and in series B a plot is prepared of absorbance against concentration of ligand.
slope a
slope bgive metal to ligand ratio.
1.9 Method of determination of copper :-
Copper is chromogenic element and innumerable organic compounds give
sensitive colour reaction with it. Many colourimetric methods have been described
but are not in use, probably the most extensively used reagent at the present time is
diethyldithiocarbamic acid in the form of its sodium salt. The sensitivity is high and
the reagent is inexpensive .
Dibenzyldithiocarbamic acid is an even better reagent in a number of respects.
2,2-Biquinoline and its derivatives of 1,10-phenanthroline are reported to be specific
12
Cu (I) reagents. Their high cost may or may not be a factor of their use. Dithiazone is
one of the most sensitive copper reagents but it is not specific. All of these reagents
yield copper chelates extractable by organic solvents.
The blue colour given by ammonia vvitli Cu (II) salts *• • is not sufficiently
strong to be of much value in trace analysis. Various amines have been recommended
as more satisfactory than ammonia. One of these is tetr?ethylenepentaminer which
according to .T.B. Crumpler ' is 3.5 time as sensitive as ammonia for Cu (II).
Precipitation of Cu (II) by means of pyridine (py) and thiocyanate as a green
complex, of composition (Cu(py)2(SCN)2) has been recommended by Speau * ' for
the quantitative gravimeteric estimation of the element. The solubility of the
compound in solvents such as chloroform has been used by Biazzo and others ( as a
basis of colourimetric estimation of Cu (II).
Moeller and Richard studied * ' the system spectrophotometrically using
chloroform as solvent. The complex was characterized by a sharp and intense band at
415 nm.
1.10 Method of Determination of cobalt ;-
The most sensitive colourimetric methods for cobalt are based on its reaction
with compounds containing the grouping, = CNO — C = to give strongly coloured,
usually red, chelates. It is generally accepted that the reagents of tliis type form
complexes with trivalent cobalt, the reagent also serves as an oxidizing agent.
Cobalt(II) can be determined by addition of concentrated hydrochloric
acid * " ' to ammonia in the present of peroxide ^ ' and dimethylgloxime which
gives brown colour in a nearly neutral solution.
13

CHAPTER TWO
EXPERIMENTAL

2.1 Preparation of oxime ligands
2.1.1 Preparation of phenacylchloride : -
In a three necked round bottomed flask equipped with a reflux condenser,
separatory funnel and mechanical stirrer, finely powdered aluminum chloride (40g)
and benzene (1000 cm3) were placed. Through the separatory funnel redistilled
chloroacetyl chloride (60.Og, 0.53 mol) was added slowly during l/2hr with cooling
the mixture.
When all chloroacetyl chloride was introduced , the mixture was heated for
lhr at 80°C in order to complete the reaction where much hydrogen chloride gas was
evolved. The reaction mixture was cooled and poured into 250cm3 of water where
decomposition occurred with evolution of heat and the product extracted in benzene
layer. The lower aqueous layer was discarded, the organic phase was dried with
NazSQj and the solvent evaporated in vacuum leaving crystal of the product (70g),
yield was 90,5%, m.p. 95C (lit. 95). This was used directly for the next step. (51>59
+ CH2CICOC1 CeHjCOCHzCI + HC1
2.1.2 Preparation of the phenacvl chloride oxime:-
C6H5COCH2CI + H2NOH.HCI_J^V CeHjC (NOH)CH2CI + HC1
Phenacylchloride (7.0g, 0.04 mol), hydroxylaminehydrochloride(7.0g, 0.15
mol) water (2 cm3) and methanol (75 cm3) were stirred for 3'/2hrs. After that alcohol
was removed in vacuum. Water (17 cm3) was added where an oily product was
produced which solidified on cooling to give the oxime as colourless stout needles
(7.0g). This was filtered, washed with a small amount of ice-cooled water and dried
(m.p. is 85-87°C, lit. 86 °C, yield was 99.2%)(51>52).
14

2.1.3 Preparation of morpholinophenacyle ox hue :-
To a filtered solution of phenacylchloride oxime (1.7g, 0.01 tnol) in
dichloromethane (35cm3) was added morpholine (0.95g, 0.01 mol) and anhydrous
sodium carbonate (5g). The mixture was stirred magnetically at room temperature for
24hrs , after which water was added. The solids (carbonate and morpholine
hydrochloride) were dissolved . The organic layer was separated, washed once with
water, dried using sodium sulphate and evaporated in vacuum , to afford the oxime.
The oxime is a semi-solid mass (0.8g). It was crystallized from ethanol twice giving
hairy colourless needles, (m.p. is 115-116C, lit. 115-116°C, yield 36.4%)(53).
CL /—^ . / NOH i—^+NH 0 ' ^ ^ C A - C CH,-N O+ECL
2.1.4 Preparation of N-piperidinophenacvI oxime :-
To a filtered solution of phenacylchloride oxime (1.7g, 0.01 mol) in
dichloromethane (35cm3) was added piperidine (0.9g, 0.01 mol) and anhydrous
sodium carbonate (5g). The mixture was stirred magnetically at room temperature for
24hrs. after which water was added , the solids (carbonate and piperidine
hydrochloride) dissolved. Then it was processed in the same way as for the
morpholine-adduct. (yield 0.8g, 36.6%, m.p. 130 °C, lit. 130 °C)(54).
15

2.2 Reagent grades :-
2.2.1 pH determining solution :-
The following pH-determining solutions and buffer solutions were prepared.
0.1M HCI,O.5MHC1, IM HC1
2.2.2 Acetate buffer solutions :-
(i) pH 4 and pH 6 were prepared from acetic acid and sodium acetate :
pH 4 : 6cm3 of glacial acetic acid were added to a solution of sodium
acetate (13.59g), then the volume was made up to 100 cm3.
pH 6 : 4 cm3 of glacial acetic acid were added to a solution of sodium
acetate (15.99g), and the volume was made up to 100 cm3.
(ii) pH 8 : buffer, 2M sodium acetate solution was prepared by dissolving
16.4 g of anhydrous sodium acetate in 100cm3 of distilled water.
pH values were adjusted by addition of acetic acid or sodium acetate using
a pH meter.
2.2.3 Oximes :-
The following oximes were prepared by dissolving the exact weight in amyl
alcohol;
O.OlMMorphilinophenacyl oxime (0.22g/100 cm3)
0.01M N-piperidino-phenacyl oxime (Q218 g/100 cm3)
O.OlMPhenacyl chloride oxime :- (0.1695 g/100 cm3)
2.2.4 Salt solutions :-
0.01M of the following salt solutions were prepared by dissolving the exact
weight in double distilled water :-
0.01M CuCI2.2H2O (0,1717 g/100 cm3)
0.01M CoCI2.6H20 (02379 g/100 cm3)
16

2.2.5 Organic solvents :-
Amyl alcohol, chloroform and cyclohexane.
2.2.6 Instruments :-
(i) PERKIN - ELMER . 55OS U.V/ VIS spectrophotometer
(ii) PERKIN - ELMER . 13301R spectrophotometer.
2.3 Study of oxime metal ion complexes :-
2.3.1 Identification of specific wave length of maximum absorbances :-
A solution of Cu (II) ion = X Molar (M).
A solution of oxime = X Molar (M).
3 cm3 of metal ion (XM), and lcm3 of pH 8 buffer solution were added. The
solution was then extracted with 10 cm3 of oxime solution (XM). The two phases
were shaken thoroughly and allowed to separate. The organic layer was separated in
volumetric flask (25 cm3) and completed with amyl alcohol to the mrak.
Then the organic layer, metal ion solution (XM) and oxime solution (XM)
were scanned in the visible region of the spectrophotometer.
The specific wavelength of the new species was found.
2.3.2 Effect of pH :-
3 cm3 of metal ion solution (XM) and 8 cm3 of each of the following buffer
solutions (pH 4, pH 6, pH 8, 0.1M, HC1, 0.5MHC1) and 5 cm3 of distilled water
were placed in a series of 100 cm3 of separatory funnels. The solution was then
extracted with 10 cm3 of oxime solution (XM) in amyl alcohol. The two phases were
shaken thoroughly and allowed to separate. The organic layer was separated in
volumetric flasks (25cm3) and completed with amyl alcohol to the mark.
The absorbances were measured against solution of oxime in amyl alcohol as
a blank in lcm cells at X z nm.
17-

2.3.3 Effect of time :-
The effect of time on the coloured solution of the metal complex was studied
by measuring the absorbance of a series containing 3 cm3 of metal solution (XM)
extracted with 10 cm3 oxime (XM) in amyl alcohol in a series of 25 cm3 volumetric
flasks and completed to 25 cm3 with amyl alcohol.
Absorbance was measured at Xz run against a solution of ligand in amyl
alcohol as a blank at different time.
2.3.4 Stoichiometry of metal ion oxime complexes :-
Three methods were used to determine the stoichiometry of the complex , the
mole ratio, continuous variation and the slope ratio method.
2.3.4.1 Mole ratio method :-
The method was described by Yoe and Jones ( ' and it is applied as fojlows:-
In a series of 100 cm3 separatory funnels, 5 cm3 aliquot of the metal solution (XM)
were completed to 11 cm3 with the addition of 6 cm3 of pH 8 buffer and then
extracted with varying amounts of oxime solution (XM) in amyl alcohol. The organic
layer were transfered to volumetric flasks (25 cm3) and diluted to the mark with amyl
alcohol.
The absorbances were measured against solution of oxime in amyl alcohol as a
blank in lcm cells at X nm. and plotted against the mole ratio of oxime/copper.
The corresponding point at the molar ratio axis to intersecting point gives
directly the ligand to metal ion ratio.
2.3.4.2 The continuous variation method :-
The modification of the Job's continuous variation method performed by.
Vesburgh and Cooper was applied to find the stoichiometry and formation
constant, stability constant, of the complex formed between oxime and Cu (II) ion.
18

Stoichiometry:-
A series of extractions were carried out in which the mole fraction of metal ion
and oxime varied from 0.2M to 0.8M. The absorbance of the organic layer was
measured against a solution of oxime in amyl alcohol as a blank in lcm cell at X nm.
2.3.4.3 Determination of the formation constant:-(37)
The formation constant of the complex can be determined by Job's method. .
M411 + X oxime = (Moximex)+n
_ (Moximer+n)
(M+ n) (Oxime)"
The absorbances resulting from continuous variation method were plotted
against mole fraction of the metal. A triangular shaped curve was obtained.
The ratio of the stoichiometry was determined from the mole fraction at the.
point of intersection formed by the extrapolation of the legs of the triangle
K = (Moxime+n)f (M+ n) (oxime)*
The concentration of the species (MLx+n ), Cmand oxime shouldbeknown
and can be calculated from the point of maximum absorbance (A) observed in the
Job's plot.
(A)
Also :-
(B)
When no dissociation occur the equilibrium concentration of the complex
(Mlx+n) would be equal to the analytical concentration of the metal (Cm).
where A<.x is extrapolated absorbance
19

n ) e xAeJCisE L(Ml/n)e
A=E L
where A=observed absorbance
(ML/n) =A/A e xxCm (C)
substitute equation A, B, and C in equation (2)
+n •
K . - ( M L ' > (2)(M+ n)(L)x
Kf =
2.3.4.4 Slope - ratio method :-
Two sets (A and B) of solutions were prepared, hi set A the concentration of
oxime was kept constant , while that of metal ion was varied . In set B the
concentration of the metal ion was kept constant, while that of the oxime was varied .
After extraction the organic layers were transferred to 25 cm3 volumetric flaslt
and completed to the mark with amyl alcohol.
Absorbances were measured against the solution of oxime in amyl alcohol as a
blank in lcm cell at Xz nm. The result of the two sets were presented graphically.
The stoichiometry was determined by dividing the slope of set A by the slope
of set B.
2.3.6 Effect of solvent :-
The effect of three different organic solvents (chloroform, amyl alcohol and
cyclohexane) on the extraction of metal ion with oxime at pH 8 were studied.
To 2 cm3 of metal ion solution, 6 cm3 of pH 8 buffer were added in a series of
separatory funnels, the series were extracted with the oxime in different solvent.
20

2.4 Determination of Cu(II) as diethyldithiocarbamate complex :-
In a series of 100 cm1 separatory funnels 2, 4, 8, 12 and 14 cm3 of 5> 10"4 M
standard Cu (II) solution were mixed with 5 cm3 of 20% ammonium citrate solution
and made slightly alkaline with excess NH4OH. The volume was then completed to
50 cm3 with water, followed by 5 cm3 of 0.1% sodium diethyldithiocarbamate
solution. The complex was extracted with 10, 5 and 5cm3 of cliloroform. The extracts
were combined into a 50 cm3 volumetric flask and diluted to the mark with
chloroform.
The absorption spectra of the solutions were measured against chloroform as a
blank in lcm cells at X 435nm.
2.5. Quantitative colourimetric determination of Co(II) using 2-nitroso--l-
naphthol reagent :-
Procedure :-
2-nitroso -1-naphthol solution was prepared by dissolving 1.0 g of the solid in
100 cm3 glacial acetic acid, then l.Ogof activated carbon was added , the solution
was shaken and filtered.
Solution of 0.0034 M cobalt (II) chloride hexahydrate was prepared by
dissolving the solid in hydrochloric acid, treated with 15 cm3 of 40% (vv/v) sodium
citrate. The pH was adjusted to 3-4 using HC1 and NaOH then diluted to 75 cm3.
In a series of separatory funnels 0.63, 1.25, 3.13, 6.25, 12.5 and 25 cm3 of
Co (E) solution were added followed by addition of 3 cm3 of hydrogen peroxide.
After 3 minutes, 2 cm3 of the reagent solution were added to each one.
The resulting solutions were allowed to stand for 30 minutes after which they
were extracted twice with 10 cm3 portion of chloroform, the extracts were diluted to
25cm3 with chloroform and transfered to a clean separatory funnels.
To each funnel, 20 cm3 of 2M HC1 were added, shaken for 1 min and then the
chloroform layers were run into other separatory funnels, and were shaken for one
min with 20 cm3 2M NaOH. The absorbance of each clear chloroform phase was
determined by using chloroform as a blank in lcm cell.
21

2.6 Studv of copper (II) morpholinophenacvl oxime complex :-
Identification of specific wavelength of maximum absorbance :-
The spectra of copper (II) morpholino-phenacyl oxime complex (using
2*10"3M solutions of the metal ion and the ligand) were recorded in the visible
absorption region. The maximum absorbance was observed at 660 nm as shown in
Effect of pH:-
To a series of six separatory funnels, 3 cm3 of Cu (II) was added to 10 cm3 of
ligand in amyl alcohol and the solutions were adjusted by addition of 8 cm3 of each
pH buffer, these were shaken vigorously for about 2 min, and the two phases were
allowed to separate , the organic layer was separated and completed to 25 cm3 with
amyl alcohol. The results are shown in Table 1.
Table 1 : Effect ofpH on complex formation using l*10"3 M Cu(II) and
N-morpholinophenacyl oxime at X 660 nm.
M
pH
0.3
1.0
4.0
6.0
7.0
8.0
absorbances
0.002
0.001
0.008
0.102
0.098
0.187
Effect of time;-
To 10 cm3 of the ligands, 3cm3 of Cu(n), 5 cm3 of pH 8 buffer and 7 cm* of
distilled water were added. The mixture was shaken thoroughly and the organic layer
22

FIG. ( 1 )
VISIBLE SPECTRUM OF COPPER (11)
MORPHOLINO-PHENACYLOXIME CHELATE
0.6-
540 580 620 660 700 74) ?80 &20
Wave Length (nrrO
23

was allowed to separate and completed to 25 cm3 with amyl alcohol after separation.
The absorbances are measured against amyl alcohol as a blank in lcm cell at
X660nm.
Table 2 : The variation of absorbance with time on the stability of
l x i o 3 MN-Morpholinophenacyloxime-lxlO"3 MCu(II) complex :-
Time
ishr
Vihr
lHhrs
2hrs
3hrs
4hrs
5hrs
24hrs
72hrs
4 days
10 days
15 days
absorbances at X= 660nm.
0.148
0.171
0.189
0.195
0.198
0.198
0.197
0.198
0.200
0.201
0.197 •
0.195
Stoichiometry of Cu (II) morpholinophenacvl oxime complex :-
Mole - ratio method :-
To a series of separatory funnels 5 cm3 of 3X10"4 M Cu(H) was added
to 6 cm3 of pH 8 buffer, and extracted with varying volumes of 3xlO"4Mligand in
amyl alcohol. The volume of organic layer was completed to 12 cm3 with the same
24

solvent, these were well shaken, and allowed to separate. The organic layer was
completed to 25cm3 with amyl alcohol.
Table(3) Mole ratio method for the estimation of stoichiometry of Cu (II)-
N-morpholinophencyl oxime complex
oxime volume
(cm3)
2
3
4
5
6
7
8
9
10
12
Mole-ratio
IVCu+2
0.4
0.6
0.8
1.0
1.2
1.4
1.6
1.8
2.0
2.4
Absorbances
at X 660nm.
0.030
0.047
0.056
0.080
0.088
0.088
0.090
0.099
0.089
0.090
The absorbances were plotted against the mole ratio of oxime/Cu (II) as shown
in Fig. 2 which indicates that the point of intersection is at 1.2 mole ratio. This
prooves that the complex is a 1:1 complex.
Continuous variation method :-
A series of extractions were carried out in which the mole fraction of Cu(II)
and N-morpholinophenacyl oxime (using 2><10'4M solutions of the metal ion and the
ligand) were varied from 0.2M to 0.8M.
Absorbance of the organic extracts were measured against amyl alcohol as a
blank in lcm cells after diluted to 25 cm3 with the same solvent.
25

FIG(2)THE PLOT OF ABSORBANCE VERSUS MOLE RATIO
OF MORPHOLINO PHENACYL OXIME PER MOLE OF Cu2+
0.12
0.11
0.09
sa
1II
H
W
u
0.08
0.07
0.06
O0.05
0.04
0.03
0.02
0.01
MOLE RATIO OF OXIME / Cu 2 +
26

Table 4 : Continuous variation method for the estimation of stoichiometry of Cu (II)-
N-morpholinophencyl oxime complex
Cu(II)
Volume (cm3)
2
3
4
5
6
7
8
oxime
Volume (cm3)
8
7
6
5
4
3
2
Mole fraction
Cw+2
Cu"-2 + L
0.2
0.3
0.4
0.5
0.6
0.7
0.8
absorbances
at ?O$60nm.
0.023
0.036 . ;
0.046
0.054
0.040
0.020
0.004
The absorbances were plotted against mole fraction ofCu+2
in Fig. 3."T" jL-i
Determination of the formation constant:-
The fonnation constant of the chelate was calculated from the curve in the plat
Fig. 3.
Expression mentioned before :-
=f U
Kf = formation constant
A = observed absorbance = 0.054
Aex= extrapolated absorbance = 0.055
C L = concentration of the oxime ligand = 4.0><10"5 M.
Cm = concentration of the metal" copper " = 4.0>^10"5 M
X = 1, because 1:1 complex
0.054/0.055
( 1 - 0.054/ O.O55)4.OxlO~3(l- 0.054/0.055)= 7.58xlO7
27

FIG(3)THE PLOT OF ABSORBANCE VERSUS MOLE
FRACTION OF Cu2+
0.06
0.05
- °-0 4
sao
II
<<< 0.03w
0.02
0.01
Aex=0.055
A = 0.054
MOLE FRACTION OF CuJ *
28

Slope ratio method :-
Table 5 includes data for two sets of solutions (using 2xlO"4M solutions of the metal
ion and the ligand), set (A) and set (B). In set (A), 10 cm3 of pH 8 buffer was added to 10
cm3 of oxime ligand and extracted with varying amounts of Cu (II). In set (B), 10 cm3 of pH
8 buffer was added to 10 cm3 of same metal and extracted with varying amounts of oxime
ligand.
Each time the volume of the extracts was diluted to 25 cm3 with amyl alcohol,
absorbance was measured against amyl alcohol as a blank in lcm cell at X 660 run.
Table 5 : Slope-ratio method for the estimation of stoichiometry of Cu (II)-
N-morpholinophenacyl oxime complex
Two sets A and B :-
set (A)
Cu (II) concentration (M)
0.8x10"'
1.6x10"'
2.4xlO"5
3.2x10"'
4.0xl0"5
absorbances at X 660nm.
0.011
0.023
0.035
0.046
0.050
set(B)
Cu (It) concentration (M)
0.8x10"'
1.6x10"'
2.4x10"'
3.2x10"'
4.0x10"'
absorbances at X 660nm..
0.007
0.020
0.031
0.039
0.047
29

0.07
FIG (4)
THE PLOT OF ABSORBANCE VERSUS CONC.OF Cu2+ IN MOLE /LITRE
CONCENTRATION OF Cu2+ IN MOLE / L xlO5
Set A
30

FIG(5)THE PLOT OF ABSORBANCE VERSUS CONC.
OF OXIME IN MOLE /LITRE
0J07
CONCENTRATION OF OXIME IN MOLE / L XlO!
Set B
31

From Figs. 4 and 5
Slope (A) _ No. of moles of oxime
Slope (B) No. of moles copper(II)
0.014
0.0125
Effect of solvent :-
The effect of solvent was studied by adding 2 cm3 of 2x10'4 M Cu (II) to 6 cm3 of pH
8 buffer and extracted with 6 cm3 of 2><10"4 M oxime ligand.
High sensitivity obtained with the amyl alcohol as a solvent as shown in the results in
Table 6.
Table 6 : Effect of solvent on the extractability of Cu (II)
N-morpholinophenacyl oxime complex
Solvent
Cyclohexane
Chloroform
Amyl alcohol
absorbances at X660nm.
0.000
0.016
0.021
2.7. Study of the Cu (II) -N-piperdinophenacyl oxime complex :-
Identification of the specific wavelength of maximum absorbance :-
Spectrum 1 in Fig. 6 was recorded for the solution of 0.01 M Cu (II), using
water as a blank, spectrum II was recorded for solution of 0.01 M
N-piperidinophenacyl oxime and spectrum HI was recorded for the new complex
species which formed between ligand and Cu (II) using amyl alcohol as a blank.
The chelates shown maximum absorption at X = 630nm.
32

05
FIG.(6 )VISIBLE SPECTRUM 0F-._
I „ Copper ( n ) Solution using wateras blank
H_N_ Piperidino^phenacyl oxime usingamylalcohol as blank
B£_Comp{ex species (new species) usingsolution of oxime liaand as blank
04-
>
\
03-rI
\\
CD
oCD<
01-
520 SGO 600 6 ^ 680 720 760 800WAVE LEN3TH IN ( nm)
33

Effect of pH:-
3 cm3 of Cu (II) was added to 12 cm3 of varying pH buffers and extracted with
10 cm3 of N-piperidinophenacyl oxime hgand in amyl alcohol.
Table 7 : Effect of pH on complex formation of Cu (H)-N-piperidinophenacyl oxime
using 2x1 O^M solution of each
pH
0.3
1.0
4.0
6.0
7.0
8.0
absorbances at 630nm.
0.000
0.000
0.008
0.036
0.048
0.081
The maximum absorbance was found to be at pH 8.
Effect of time: -
To 3 cm3 of Cu(II) was added 6 cm3 of pH 8 buffer and 6 cm3 of distilled
water. The mixture was extracted with 10 cm3 of N-piperidinophencyl oxime' ligand
after shaking thoroughly. The organic layer was completed to 25 cm3 with amyl
alcohol.
The absorbances of organic extract were recorded after half an hour up to 15
days as shown in Table 8.
34

Table 8: The variation of absorbance with time on the stability of2><10"4MN-
piperidinophencyl oxime-Cu (II) complex.
Time
'/zhr
lhr
2hrs
3hrs
4hrs
5hrs
6hrs
24hrs
48hrs
4 days
10 days
15 days
absorbance s at A, 660nm.
0.048
0.081
0.084
0.083
0.083
0.084
0.085
0.082
0.083
0.082
0.081
0.080
Stoichiometrv of copperfll) N-piperidino-phenacyl oxime complex :-
Mole-ratio method :-
5 cm3 of 2x10"* M Cu (II) were added to a series of separatoiy funnels
containing 5cm3 of pH 8 buffer and the mixture was extracted with varying volumes
of 2><10"4 M oxime ligand. The volume of extract was completed to 25 cm3 in a
volumetric flask with amyl alcohol.
Absorbance of the organic layers were measured against the amyl alcohol as a
blank in lcm cell at A, 630 ran.
35

Table 9 : Mole-ratio method for the estimation of stoichiometry of Cu (II)-
N-piperidinophenacyl oxime complex
Mole ratio L/Cu+2
0.4
0.6
0.8
1.0
1.2
1.4
1.6
1.8
2.0
2.4
absorbances at A, 630 nm.
0.043
0.071
0.099
0.129
0.132
0.133
0.132
0.133
0.132
0.131
The absorbances were plotted against the mole ratio of oxime/Cu (II) in Fig. 7
The point of intersection indicates 1:1 metal to oxime ratio.
Continuous variation method :-
A series of solutions were prepared in which varying proportions of
2.0><10'4M Cu(H) and 2.0xl0"4M oxime ligands were mixed in amyl alcohol under
buffer control. The mole fraction of Cu(II) to ligand was varied from 0.2M to 0.8M.
The organic extracts were diluted to 25 cm3 with the amyl alcohol and the
absorbances were measured against the same solvent as a blank in lcm cell. Results
and curves for the Cu (II) N-piperidinophenacyl oxime complex are shown in Table
10 and represented graphically in Fig. 8.
36

FIG(7)THE PLOT OF ABSORBANCE VERSUS MOLE RATIO OFN-PIPERIDINO PHENACYL OXIME PER MOLE OF Cn21
0.16
0.15
0.14
0.01
MOLE RATIO OF OXIME / Cu2
37

Table 10 : Continuous variation method for the estimation of the stoichiometry of
Cu (II)-N-pipedinophenacyl oxime complex
Cu(H)
Volume (cm3)
2
3
4
5
6
7
8
oxime
Volume
(cm3)
8
7
6
5
4
3
2
r* +2CM
Cu+2 + L
0.2
0.3
0.4
0.5
0.6
0.7
0.8
absorbances at
X 630mn.
0.054
0.081
0.108
0.133
0.101
0.075
0.042
Determination of the formation constant :-
Aex and A were determined from the curve in Fig. 8.
Expression mentioned before :-
_f U -
A =0.133
Aes = 0.134
CV = 4.0xl0'5M
Cm = 4.0x10° M- 5 •
Kf =0.133/0.134
d-fc^oxio-o-*133-= 4.42xlO8
0.134 0.134
Slope ratio method :-
Two sets of solutions were prepared ( using 2xlO"4M solutions of the metal
ion and the ligand) set (A) and set (B). In set(A), 10 cm3 of pH 8 buffer and 10 cm3 of
38

0.14
0.13
FIG (8)THE PLOT OF ABSORBANCE VERSUS MOLE
FRACTION OF Cu2+
Aex = 0.1 34
MOLE FRACTION OF Cu3
39

oxime ligand in amy alcohol were added to varying volumes of Cu (II) solution. In set
(B), 10 cm3 of pH 8 buffer and 10 cm3 of Cu(II) were extracted with varying volumes
of oxime ligand in amyl alcohol. The extract was completed to 25 cm3, and the
absorbances were measured against the oxime solution.
Results were shown in Table 11 and represented graphically in Figs. 9 and 10.
Table 11 : Slope - ratio method for the estimation of stoichiometry of Cu (II)
N-piperidinophencyl oxime complex
Set A
Cu(H)
volume (cm3)
1
2
3
4
5
Cu (II) concentration
(M)
0.8xl0 J
1.6xlO5
2.4xlO"5
3.2xlO"5
4.0xl0-5
absorbances at
X 630 ran.
0.021
0.054
0.083
0.105
0.130
SetBoxime volume
(cm3)
1
2
3
4
5
Cu (II) concentration
(M)
0.8xl05
1.6xl0'5
2.4xl0"5
3.2xl0"5
4.0xl05
absorbances
at X 630nm.
0.018
0.049
0.072
0.102
0.125
40

FIG (9)THE PLOT OF ABSORBANCE VERSUS MOLE
CONC. OF Cu2+IN MOLE/LITRE
0.14
0.12
OJOS
52
OV}
OJ06
0J04
OJOZ
CONC. OF CuI+ IN MOLE/LITRE xlO !
SETA
41

0.14
FIG(IO)THE PLOT OF ABSORBANCE VERSUS CONC.
OF OXIME IN MOLE /LITRE
CONCENTRATION OF OXIME IN MOLE / L XlO s
SET B
42
From Figs. 9 and 10
Slope {A) _ No, of moles of oxime
Slope (B) No. of m oles copper {II)
_ 0.0325 _ 1
~O0305 ~ I
Effect of solvent:-
3 cm3 of 2xlO'4 M Cu (II) and 6 cm3 of pH 8 buffer were extracted with 6 cm3
of 2X10"4 M oxime ligand in different organic solvents. The extracts were completed
to 25 cm3 with the solvent. The absorbances were measured against each solvent as a
blank. The results are shown in Table 12 which shows that the high sensitivity was
obtained with amyl alcohol as a solvent.
Table 12 : Effect of solvent on the extractability of Cu (II)-
N-piperidinophenacyl oxime complex
Solvent
Cyclohexane
Chloroform
Amyl alcohol
absorbances at 630nm.
0.000
0.072
0.081
2-8 Study of the phenacylchloride oxime Cu (II) complex :-
Identification of the specific wavelength of maximum absorbaiice :-
The complex, prepared from 0.02M Cu (II) and 0.02 M oxime, was scanned in
the visible region.
The maximum wavelength of absorbance was observed at X 442nm. as shown
in Fig. 11.
43

UJ
CDorCD
FIG. (II )VISIBLE SPECTRUM OF COPPER 0 0
PHENACYL CHLORIDE CKIME CHELATE
0
0.1
410 450 *aO b30 b70 6W 650 690 730
Wave Length (nm)
44

Effect of P H : -
3 cm3of Cu (II), 10 cm3 of phenacyl chloride oxime ligand and 10cm3 of
different buffers were shaken thoroughly and allowed to stand. The extracts were
completed to 25 cm3 with amyl alcohol.
The absorbances were measured as shown in Table 13 against amyl alcohol as
a blank in lcm3 at X 442nm.
Table 13 : Effect of pH on complex formation of 2><10"2 M phenacyl chloride oxime
and2xlO"2MCu(II)
pH
0.3
1.0
4.0
6.0
7.0
8.0
absorbances at X 442nm.
-0.000
-0.000
0.000
0.0021
0.000
0.832
Effect of time: -
A solutions of phenacyl chloride oxime-Cu (II) complex were prepared by
adding 3 cm3 of Cu(II), 5 cm3 of pH 8 buffer and 7 cm3 of distilled water and
extracted with 10 cm3 of oxime ligand in amyl alcohol. The extract was completed to
25 cm3 with amyl alcohol and the absorbances were measured at different iteryals as
in Table 14.
45

Table 14 : The variation of absorbance with time on the stability of 4v-10"3M
phenacyl chloride oxime-4xlO"3 M Cu (II).
Time
'/ihr
lhr
2hrs
3hrs
4hrs
5hrs
24hrs
2 days
5 days
10 days
16 days
18 days
20 days
absorbances at X 442nm.
0.107
0.167
0.185
0.186
0.185
0.187
0.187
0.186
0.186
0.185
0.184
0.183
0.180
Stoichiometrv ofcopperflD phenacvl chloride oxime complex :-
Mole-ratio method :-
A series of nine solutions were prepared by adding 3 cm3 of 4><10"3 M Cu(II)
to 8 cm3 of pH 8 buffer and the ligand (4><10"3 M) was added at different volume (2,
3, 4, 5, 6, 7, 8, 9 and 10) in amyl alcohol. The absorbances were measured after
completing each solution to 25 cm3 with the same solvent using amyl alcohol as a
blank in lcm cell at X 442 nm. Results are shown in Table 15.
46

Table 15 : Mole-ratio method for the estimation of stoichiometiy of Cu (II)- phenacyl
chloride oxime complex
oxime
volume (cm3)
2
3
4
5
6
7
8
9
10
Mole ratio L/Cu (II)
0.67
1.00
1.33
1.67
2.00
2.33
2.67
3.00
3.33
absorbances
at X 442nm.
0.023
0.061
0.095
0.128
0.150
0.177
0.178
0.177
0.178
The absorbances were plotted against the mole ratio Fig. 12.
Continuous variation method :-
A series of solutions were prepared in which varying proportions of 4*1O'3 M
Cu(II) and 4xlO"3M of the oxime ligands were mixed, then 8 cm3 of pH 8 were added,
keeping the total concentration constant. The extracts were completed to 25 cm3 with
the amyl alcohol.
The absorbances were measured against the same solvent as a blank in lcm3
cell at X 442 run.
47

FIG(12)THE PLOT OF ABSORBANCE VERSUS MOLE RATIO
OF PHENACYL OXIME PER MOLE OF C«2+
MOLE RATIO OF OXIME / Cu2
48

Table 16 : Continuous variation method for the estimation of stoichiometry of
Cu (II) phenacyl chloride oxime complex
Cu (II) volumel (cm3)
1
2
3
4
5
6
7
8
oxime volume (cm3)
9
8
7
6
5
4
3
2
Cu'2 +L
0.1
0.2
0.3
0.4
0.5
0.6
0.7
0.8
absorbances
at X 442 ran.
0.070
0.140.
0.177 , !
0.155
0.130
0.111
0.094
0.060
Determination of the formation constant:-
The formation constant of chelate was calculated from the curve in Fig. 13.
_
X = number of moles of ligand per-mole of metal ion=2
A =0.177
Aex= 0.183
CL = 1.12xlO"3M
Cm = 4.8xlO"3M
K f=6.9*107
49

FIG(13)THE PLOT OF ABSORBANCE VERSUS MOLE
FRACTION OF Cu2+ .
0.18
0.16
0.14
A = 0.177
sc 0.12
0.1
W
0.08
o
90.06
0.04
0.02
Aex = 0.1 83
MOLE FRACTION OF Cu2+ (M/(M+L))
50

Slope ratio method :-
Table 17 includes data for two sets of solutions, set,(A) and set,(B). In
set(A), 12 cm3 of oxime ligand (4x10"3 M) and 16 cm3 of pH 8 buffer were added to
different volumes of Cu(II) (1, 2,3,4 and 5 cm3). In set (B), 12 cm3 of Cu(II) (4xlO3
M) and 16 cm3 of pH 8 buffer were extracted with different volumes of oxime ligand
(1, 2, 3,4 and 5 cm3) .The volume extract was completed to 25 cm3 with amyl
alcohol.
Table 17 : Slope - ratio method for the estimation of stoichiometry of Cu(II)-
phenacyl oxime complex
set (A)
Cu(II) volume(cm3)
1
2
3
4
5
Cu (II) concentration (mole/L)
1.6X10"4
3.2xlO'4
4.8xlO"4
6.4X10⁻⁴
8.0X10⁻⁴
absorbances at X 442nm.
0.074
0.145
0.175
0.229
0.268
From Fig. 14
set(B)
SlopejA) =
Slope (2?)0.037 _20.018 ~T
Cu(II) volume (cm3)
1
2
3
4
5
Cu (II) concentration (mole/L)
1.6X10"4
3.2X10"4
4.8X10"4
6.4xlO"4
8-OxlO"4
absorbances at X 442rum.
0.030
0.060
0.094
0.126
0.160
51

0.32
FIG(14)THE PLOT OF ABSORBANCE VERSUS CONC.
I.Set A_ Cone, of Cu2+in mole /litre2.Set B Cone, of oxime in mole/litre
52

Effect of solvent:-
2 cm3 of Cu(D) (4xlO'3 M) and 6cm3 of pH 8 buffer were extracted with 6cm3
of oxime ligand (4><10"3 M) in varing solvents (cyclohexane, chloiofbrm, and amyl
alcohol).The results are in Tablel8. They show the high sensitivity obtained with
amyl alcohol as a solvent.
Table 18 : Effect of solvent on the extractability of Cu(II)-phenacylchloride oxime
complex
Solvent
Cyclohexane
Chloroform
Amyl alcohol
absorbances at X 442nm.
0.000
0.130
0.143
2-9 Determination of Cu (II) as diethvldithiocarbamate :-
Table 19 : Estimation of extraction percent of Cu(II) ion
using diethyldithiocarbamate.
Cu (II) concentration (ppm)
1.3
2.6
3.9
5.2
6.5
7.8
absorbance at X 435
0.234
0.541
0.701
0.924
1.153
1.382
53

FIG(15)THE PLOT OF ABSORBANCE VERSUS CONC.
OF Cu2+ IN ppm
CONCENTRATION OF Cu2+ IN ppm
54

Determination of extraction percentage using diethvidithiocarbamate :-
In a series of 3x100 cm3 separatory funnels 12 cm3 of 5xlO~4 M standard
Cu(II) solution were mixed with 10 cm3 of 20% acetate buffer of pH 8 solution and
then extracted with 10 cm3 of 0.01M oxime in amyl alcohol.
The aqueous layers were complexed with diethyldithiocarbamate and
completed to50 cm3. The absorbance of the solution was read at 435 nm.
2-9-1 Determination of extraction of morpholinophenacyl oxime ligand :-
hi a series of 3x100 cm3 separatory funnels 12 cm3 of 5*10~4 M standard
Cu(II) solution were mixed with 10 cm3 of 20% acetate buffer of pH 8 solution and
then extracted with 10 cm3 of 0.01M oxime in amyl alcohol.
The aqueous layers were complexed with diethyldithiocarbamate and
completed to50 cm . The absorbance of the solution was read at 435 nm and found to
be equal to 0.108 which an extraction percent of 92.1%.
2-9-2 Determination of extraction percentage of Cu (II) with
N-piperidinophenacyl oxime ligand :-
hi a series of 3x100 cm3 separatory funnels 12 cm3 of 5* 10"4 M standard i
Cu(II) solution were mixed with 10 cm3 of 20% acetate buffer of pH 8 solution and
then extracted with 10 cm3 of 0.01M oxime in amyl alcohol.
The aqueous layers were complexed with diethyldithiocarbamate and
completed to50 cm3. The absorbance of the solution was read at 435 nm and foutid to
be equal to 0.07 which an extraction percent of 96.3%.
2-9-3 Determination of extraction percentage of Cu (II) with phenacylchloride
ligand :-
hi a series of 3x100 cm3 separatoiy funnels 12 cm3 of 5 xlO"4 M standard
Cu(II) solution were mixed with 10 cm3 of 20% acetate buffer of pH 8 solution and
then extracted with 10 cm3 of 0.01 M oxime in amyl alcohol.
55

The aqueous layers were complexed with diethyldithiocarbamate and
completed to50 cm3. The absorbance of the solution was read at 435 run and found to
be equal to 0.180 which an extraction percent of 87.0%.
2-10 Study of morpholinophenacyl CoflD oxime complex :-
Identification of specific wavelength of maximum absorbance :-
The spectra of Co (11) morpholinophenacyl oxime complex was recorded.
The maximum absorbance was observed at X 422nm.as in Fig. 16.
Effect of pH on complex formation :-
A mixture of 3 cm3 of 4xl0"3 M Co(H), 10 cm3 of 4*10"3 M oxime ligand in
amyl alcohol and 5 cm3 of varying pH buffer (pH 0.3, 1, 4, 6, 7 and 8) was shaken
thoroughly and allowed to stand for two hour. The extracted layer was completed to
25cm3 with same solvent.
The absorbances were measured against amyl alcohol as a blank in lcm cell at
X 422nm.
Table 20: Effect of pH on complex formation of 4xlO'3M morpholinophenacyl-
4xlO"3M Co (II) ion
PH
0.3
1.0
4.0
6.0
7.0
8.0
absorbances at X 422nm.
0.000
-0.001
-0.002
0.169
0.002
0.009
The formation of the complex was followed by pH meter. The brown colour of
the complex started to develop at pH 5.6 and completed at pH 6.
56

03-i
FIG. (16 )VISIBLE SPECTRUM OFCOBALT(ll)
MORPHOLINO-PHENACYLOXIME CHELATE
0.2-
UJo<PQ
CD
400 "440 480 520 560 600Wave Length (nm)
640
57

Effect of time:-
A mixture of 3 cm3 of Co(II), 7 cm3 of pH8 buffer and 5 cm3 of distilled water
were extracted with 10 cm3 of oxime ligand in amyl alcohol. The extract was
completed to 25 cm3 with same solvent. Absorbances of organic layers were
measured at X 422nm using amyl alcohol as a blank in lcm cell. Results are shown in
Table 21
Table 21: The variation of absorbance with time on the stability of 4xlO"3 M
morpholinophenacyl oxime- 4><10'3 M Co (II):-
Time
yjir
lhr
2hrs
3hrs
4hrs
5hrs
24hrs
48hrs
3 days
4 days
6 days
7 days
10 days
12 days
15 days
absorbances at X 422nm.
0.169
0.171
0.170
0.169
0.168
0.170
0.168
0.169
0.168
0.160
0.148
0.109
0.104
0.104
0.092
The complex started to decompose after 3 days.
58

The Stoichiometrv of cobalt(II) niorpholinophenacyl complex :-
Mole - ratio method :-
A mixture of 3 cm3 of 4*10~3M Co(It) and 6 cm3 of pH 6 buffer were
extracted with varied volumes of 4*10"3M oxime ligand in amyl alcohol. The
absorbances were measured at % 422 nm in lem cell using same solvent as a blank .
Results are shown in Table 22.
Table 22: Mole-ratio method for the estimation of stoichiometry of Co(II)-
morpholinophenacyl oxime complex.
Oxime volume (cm3)
2
3
4
5
6
7
8
9
10
11
12
Mole-ratio Co (II) /L
0.67
1.00
1.33
1.67
2.00
2.33
2.67
3.00
3.33
3.67
4.00
absorbances at X 422nm.
0.044
0.074
0.085
0.130
0.156
0.169
0.171
0.170
0.171
0.171
0.171
The absorbances were plotted against the mole ratio of Co(II) PL in Fig. 17.
59

FIG(17)THE PLOT OF ABSORBANCE VERSUS MOLE RATIO OFMORAHOLINO PHENACYL OXIME PER MOLE OF Co2+
0.25
MOLE RATIO OF (oxi me/Co2 + )
60

Continuous variation method :-
A series of extractions were carried out by addition of 8 cm3 of pH 6 buffer
and the mole fraction of 4xlO'3 M Co(H) to 4xlO"3 M oxime ligand were varied from
0.1M to 0.8M. The extracts were diluted to 25 cm3 with amyl alcohol .The
absorbances were measured against the amyl alcohol as a blank in lcm cell at X
422nm. The results are shown in Table 22.
Table 23 : Continuous variation method for the estimation of stoichiometry of
Co(II)-N-morpholinophenacyl oxime complex
Co(II)
volume (cm3)
1
2
3
4
5
6
7
8
Oxime
volume (cm3)
6
8
7
6
5
4
3
2
Mole fraction
Co(II) / Co(II) + L
0.1
0.2
0.3
0.4
0.5
0.6
0.7
0.8
absorbances at
X 422nm.
0.048
0.104
0.164
0.131
0.110
0.080
0.043
0.028
Determination of the formation constant :-
Expression mentioned before :-
K f= ^ ' ^ ,, - ^ - ^ -
61

FIG (18)THE PLOT OF ABSORBANCE VERSUS MOLE
FRACTION OF Co2+
0.18
0.16
0.14
aa
jjII
0.12
0.1
wu0X)8
OJ06
0J04
0J02
Aex = 0.174
A=0.164
MOLE FRACTION OF Co2+ (M/(M + L)
62

From Fig. 18
A =0.164
Aex = 0.174
CL =1.12xlO'3M
Cm =O.48xlO"3M
K f=3.68xl07
Slope ratio method :-
Two sets of solutions were prepared, set (A) and set(B). In set(A), 10
cm3 of pH 6 buffer, 10 cm3 of 4x10"3 M oxime ligand and varied volumes of
4xlO"3M Co(H) were mixed. In set(B), 10 cm3 of pH6 buffer and 10 cm3 of Co(II)
were extracted with various volumes of oxime ligand in amyl alcohol, hi the two sets
the extracts were completed to 25 cm3, and the absorbances were measured at-X
422nm. in lcm cell.
Table 24 : Slope - ratio method for the estimation of stoichiometry of Co(II)
morpholinophenacyl oxime complex,
set (A)
Co(II) volume (cm3)
1
2
3
4
5
concentration Co (II) (mole/L)
1.6xlO"4
3.2x10""
4.8xl0"4
6.4xlO'4
8.0xl0"4
absorbances aik 422nm.
0.048
0.095
0.167
0.180
0.267
set(B)
Oxime volume (cm3)
1
2
3
4
5
concentration Co (II) (mole/L)
1.6X10"4
3.2X10"4
4.8*10"4
6.4xlO-4
8.0X10"4
absorbances at A, 422nm..
0.018
0.029
0.086
0.098
0.120
63

0.32
0.28
FIG(19)THE PLOT OF ABSORBANCE VERSUS CONC.of
1. Set A _ Cone, of Co2+ in mole/Litre2. Set B Cone, of oxime in mole/Litre
64

From Fig. 19 :
Slope (A) = 0.0305 _ 2Slope (B) 0.015 " I
Effect of solvent:-
2 cm3 of Co(II) and 6 cm3 of pH 6 buffer were extracted with 6 cm3 of oxime
ligand in different organic solvents. The absorbances were measured against each
solvent as a blank separately in lcm cell at X 422nm.
The results in Table 25 show the high sensitivity with amyl alcohol as a
solvent.
Table 25 : Effect of solvent on the extractability of Co(II)
-morpholinophenacyl oxime complex.
Solvent
Cyclohexane
Chloroform
Amyl alcohol
absorbances at X 422nm.
0.001
0.161
0.168
2-11- Study of the N-piperidinophenacvl cobalt(H) oxime complex :-
Identification of the specific wavelength of maximum absorbance
of N-piperidinophenacyl cobaltflD complex:-
The spectra of Co (IT)-N-piperidinophenacyl oxime (using 6x10"3M solutions
of the metal ion and the ligand) complex was recorded.
The maximum absorbance was observed at X 420nm. as shown in Fig. 20.
Effect of pH on complex formation :-
A series of solutions were prepared in which 3 cm3 of Co(II) and 10cm3 of
N-piperidinophenacyl oxime (in amyl alcohol) and 5cm3 of various buffer (pH 0.3, 1,
4, 6, 7 and 8). The mixture was shaken thoroughly and allowed to stand for two
hours.
The extracts absorbances were measured against amy lalcohol as a blank at X
420 nm in 1 cm cell..The results shown in Table 26 shows that the pH 6 is specific
for complex formation.
65

FIG. (20 )
VISIBLE SPECTRUM OF COBALT 00N.PIPERIDINO-PHENACYLOXIME CHELATE
<ao 520 560, 700,ave frngih ( nm)
66

Table26 : Effect of pH on complex formation of 6x10"3 (M) N-piperidinophenacyl-
6xlO"3MCo(n)Ions
pH
0.3
1.0
4.0
6.0
7.0
8.0
absorbances at X 420nm.
-0.001
-0.002
0.000
0.719
0.018
0.000
Effect of time: -
3 cm3 of Co(II), 7 cm3 of pH 6 buffer and 5 cm3 of distilled water were
extracted with 10 cm3 of oxime Hgand in amyl alcohol.
Absorbances of organic layers were measured at X 420nm using the same
solvent as a blank in lcm cell. Results are shown in Table 27.
67

Table 27 : The variation of absorbance with time on the stability of
6xlO'3 MN-piperidinophenacyl oxime-6xlO*3 M Co(II) complex.
Time
!4hr
lhr
2hrs
3hrs
4hrs
5hrs
6hrs
24hrs
48hrs
3 days
4 days
5 days
6 days
7 days
10 days
15 days
absorbances at % 422nm.
0.687
0.712
0.710
0.713
0.713
0.712
0.714
0.712
0.714
0.713
0.712
0.710
0.711
0.712
0.710
0.712
Stoichiometrv of cobalt(II) of N-piperidinophenacyl oxime complex :-
Mole-ratio method :-
3 cm3 of 6xl0~3M Co(II) and 6cm3 of pH 6 were extracted with varied
volumes of 6xlO'3M oxime ligand in amyl alcohol.
At X 442nm. the absorbances were measured in lcm cell using same solvent as
a blank. Results were shown in Table (28).
68

Table 28 : Mole-ratio method for the estimation of stoichiormtry of Co(II) -
N-piperidinophenacyl oxime complex
Oxime volume in (cm3)
2
3
4
5
6
7
8
9
10
12
Mole ratio L/Co(II)
0.67
1.00
1.33
1.67
2.00
2.33
2.67
3.00
3.33
4.00
absorbances at K 420nm.
0.121
0.270
0.418
0.471
0.582
0.712
0.716
0.714
0.714
0.713
The absorbances were plotted against the mole ratio Co2+/L.
Continuous variation method :-
A series of extraction solutions was prepared by addition 8 cm3 of pH 6 buffer
and the mole fraction of 6x10"3MCo(II) to 6xlO"3M oxime ligand (in amyl alcohol)
were varied from 0.1M to0.8M. The extracts were diluted to 25 cm3 with the same
solvent. The absorbances were measured and the results were shown in Table 29.
69

FIG(21)THE PLOT OF ABSORBANCE VERSUS MOLE RATIO OF
N-PIPERDINO-PHENACYL OXIME PER OF Co2+
MOLE RATIO OF (oxime/Co2+)
70

Table 29 : Continuous variation method for the estimation of stoichiometry of
Co (II)- N-piperidinophenacyl oxime complex
Cu(II)
volume in (cm3)
1
2
3
4
5
6
7
8
oxime
volume in (cm3)
9
8
7
6
5
4
3
2
mole fraction
Co(II)/(Co(II)+ L
0.1
0.2
0.3
0.4
0.5
0.6
0.7
0.8
absorbances
at X 420nm.
0.230
0.401 '.
0.710
0.502 .
0.301
0.201 •
0.099
0.041 '
From Fig 22
Kf=3.85xl07
71

0.8 r-
0.7
0.6
FIG(22)THE PLOT OF ABSORBANCE VERSUS
MOLE FRACTION OF Co2+
Aex=0.730A=0.710
\
MOLE FRACTION OF Co* + (M/(M + L)
72

Slope ratio method :-
A series of two sets of solutions were earned out set(A) and set(B). hi set(A),
10 cm3 of 6xlO"3M oxime ligand (in amyl alcohol), 10cm3 of pH 6 buffer and varied
volumes of 6xl0'3M Co(II) were mixed, hi set(B), 10cm3 of pH 6 buffer and 10 cm3
of Co(II) were extracted with varied volumes of oxime ligand in the same solvent.
.The extracts were completed to 25 cm3 with amyl alcohol.
Results of absorbances at X 420nm. were shown in Table 30 and represented
graphically in Fig 23
Table 30 : Slope - ratio method for the estimation of stoichiometry of Co(II)
N-piperidinophenacyl oxime complex
Two sets A and B :-
set (A)
Co(II) volume (cm )
1
2
3
4
5
concentration (mole/L) Co (II)
2.4xlO-4
4.8X10"4
7.2xlO'4
9.6X10"4
12.0X10"4
absorbances at A,420nm.
0.290
0.410
0.710
0.850
0.981
set(B)
Oxime volume (cm3)
1
2
3
4
5
concentration of Co(II) (mole/ L)
2.4X10"4
4.8xlO"4
7.2X10"4
9.6X10"4
12-OxlO"4
absorbances atX420nm.
0.091
0.170
0.310
0.370
0.510
73

FIG (23)THE PLOT OF ABSORBANCE VERSUS
1-SETACONC. OFCu2+ IN MOLE/LITRE2-SET B CONC. OF OXIME IN MOLE/LITRE
74

From Fig 23
Slope (A) _ 0.090 21Slope (B) 0.0425
Effect of solvent:-
2 cm3 of 6xl0"3M Co(II) and 6 cm3 of pH 6 buffer were extracted with 6 cm3
of 6xlO"3M oxime ligand in different solvents.
Using each solvent as a blank the absorbances were measured in lcm cell at
X 420nm. .Results in Table 31 shows the high sensitivity obtained with amyl alcohol
as a solvent.
Table 31 : Effect of solvent on the extractability of Co(II)
N-piperidinophenacyl oxime complex
Solvent
Cyclohexane
Chloroform
Amyl alcohol
absorbances at A, 420nm.
0.000
0.213
0.702
75

2-12 Quantitative colourimetric determination of CofH)
ion using 2-nitroso-l-naphthol reagent:-
Table 32 : For the estimation of extraction present of Co(II)
ion using 2-nitroso-l-naphthol reagent:-
concentration of cobalt(II) ion (ppm)
5
10
25
50
100
150
200
Absorbances at X 53Omn.
0.060
0.088
0.196
0.401
0.640
0.950
1.302
Calibration curve shows that the absorbance is directly proportional to the
concentration. Fig 24
Determination of percentage extraction using 2-nitoso-l- naphthol reagent:-.
In a series of three separatory funnels (100cm3) 12.5 cm3 of 3.4xl0"3M
standard Co(II) solution were added , the pH was adjusted to 6 by addition of acetate
buffer, then extracted with 10cm3 of 0.01M oxime in amyl alcohol.
The aqueous layers were complexed with 2-nitroso-l-naphthol reagent and the
volume was completed to 50 cm3 and the absorbances were measured at 530 nm as
shown in Table 33.
76
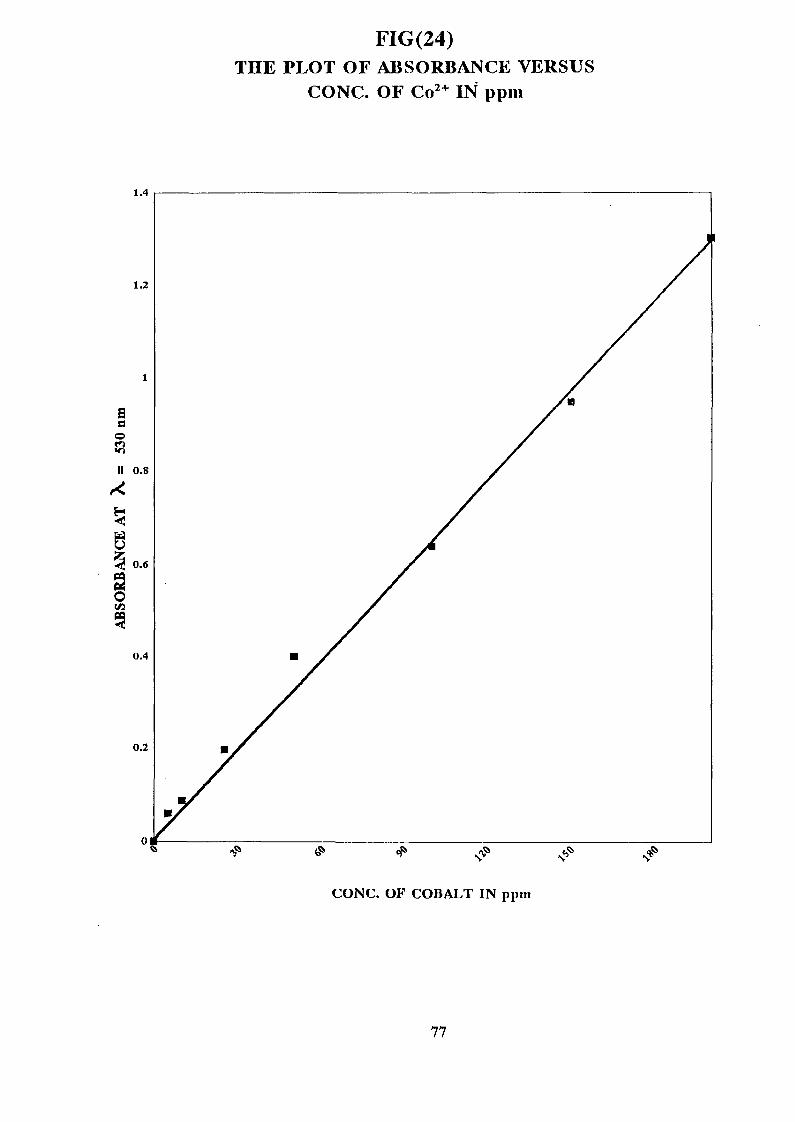
FIG(24)THE PLOT OF ABSORBANCE VERSUS
CONC. OF Co2+ IN ppm
CONC. OF COBALT IN ppm
77

2-12-1 Determination of percentage extraction of Co(II)
with phenacyl oxime ligands :~
The extraction percentage of different Co(II)-oxime complexes remained
constant as shown in Table 33.
Table 33 :
phenacyl oxime ligand
N-morpholinophenacyl oxime
N-piperidinophenacyl oxime
absorbance
0.121
0.083
extraction percentage of Co(II)
81.6%
87.2 %
2-12-2 Preparation of copper (II) and Co (II) complexes in solid form :-
Approximately 0.19g of the oxime were dissolved in methanol and warmed.
They were then added to 0.5g anhydrous copper(II) chloride or cobalt (II) chloride
hexahydrated filtered solution in methanol.
The pH of the medium was adjusted using acetic acid or sodium acetate to pH
8 (pH 6 in case of Co(II)). The complex was left for 24 hrs to settle and then filtered.
The solid complex was dissolved and extracted with four portions 10, 10, 5, 5
cm3 chloroform. Chloroform was then evaporated in vacuum to give a solid complex
which was used for further analysis.
2-12-3 Phvsicochemical analysis of phenacvl oxime ligands :-
a) Phenacyl chloride oxime :-
I.R. (Nujol) vmax 2800-1400, 1400-1500,600 cm'1.
U.V. spectra obtained A, max (256 nm),extinction coefficient (1974)
m.p. 85-87 °C.
b) Morpholinophenacyl oxime :-
I.R. (Nujol) vmax 2800-3000, 1400-1500,1100,600-800 cm1.
U.V. Xmax (247 nm)., €i (6119.7), ^2max (347 nm),s2(115).
78

m.p. 115-117 °C.
c) N-piperidinophenacyl oxime :-
LR. (Nujol) vmra 2800-3000, 1400-1500,600-800 cm1.
U.V. ^ m a x (245 nm)., Gi (10240)
X2 max (346 nm)., e 2(2400).
m.p. 130 °C.
2-12-4 Phvsicochemical analysis of phenacvl oxime complexes
a) Morpholinophenacyl oxime Cu (II) complex :-
I.R. (Nujol) vmax 3200,2800-3000, 1400-1500,1100,600-800 cm"1.
U.V. A, max (600 nm)., ex (1350).
b) N-piperidinophenacyl oxime Cu(II) complex :-
I.R. (Nujol) vmax 3200,2800-3000, 1400-1500 ,600-800 cm1.
U.V. Krnsx (630 nm)., Gi (3325).
c) Phenacylchloride oxime Cu (II) complex :-
I.R. (Nujol) vmra 2800, 1400, 1400-1500,600 cm"1.
U.V. X max 422 nm., ei (158).
d) Morpholinophenacyl oxime Co (II) complex :-
I.r. (Nujol) vmax 3200,2800-3000, 1400-1500,1100,600-800 cm"1.
U.V. A. max 422 nm., Gi (362.5).
e) N-piperidinophenacyl oxime Cu(II) complex :-
I.r. (Nujol) vmM 3200,2800-3000, 1400-1500 ,600-800 cm"1.
U.V. X max 420 nm., Gi (986.1).
79

CHAPTER THREEDISCUSSION

3 - DISCUSSION
The present work is mainly directed towards preparation of phenacyl chloride
oxime, R-N-morphoiino- and R-N-piperidino derivatives as ligands and their
complexes with copper(II) and cobalt(II) Ions. The melting points and percentage
product of each ligand was calculated and found in a good agreement with the
literature (51'54).
The specific extractabilities using amyl alcohol of copper(H) complexes with
the three ligands increase from pH 4 to reach its maximum range at pH 8. This is
analogous to the extraction of copper (II) with salicylodoxime and benzoin oxime in
amyl acetate in the pH range 3.5-9.5. Cobalt(II) complexes are formed and extracted
from solution at pH 6 only, which is similar to complex of nitros-R-salt cobalt(II) at
pH5.5 «55'4I).
The stoichiometry of these complexes was determined by UV7VIS
spectrophotometry using the molar ratio, continuous variation and slope ratio
methods. N-morpholino and N-piperidino phenacyl oximes form 1:1 complexes with
copper (II) but 1:2 complexes with cobalt(II). Although phenacyl chloride oxime
forms 1:2 metal-ligand complex with copper(II) and it does not complex with cobalt
(II). N-morpholino and N-piperidino phenacyl oxime ligands act as bidendate ligands
having two N-atoms available for co-ordination , whereas phenacyl chloride oxime
contains the chlorine atom, an electron withdrawing group, which has a decrease
ability of donating electrons for complex formation. Cobalt(II) ions are better
stabilized through coordinate bonds to form bidendate rather than bulky monodetate
ones.
The formation constants of the five complexes were calculated from
absorbances using Job's(37) method. The fprmation constant of N-morpholinophenacyl
oxime Cu(Ti) complex was found to be 7.58x10⁷, 4.42xlO8 for
N-piperidinophenacyloxime Cu(II) complex, 6.90x10 for phenacylchloride oxime
Cu(II) complex, 3.68xlO7 for N-morpholinophenacyl oxime Co(II) complex and
80

3.85x10 for N-piperidinophenacyloxime Co(II) complex. They showed that the
copper(II) and cobalt(II) complexes with N-piperidinophenacyl oxime are more stable
than those with N-morpholinophenacyl oxime.
NOH r ~ . NOH
H H ^ " ^ H H
N-piperidinophenacyl N-morpholinophenacyl
oxime oxime
The relatively high value of stability constant of N-piperidino-complexes
compared to that of N-morpholino analogue is attributed to the electron withdrawing
ability of oxygen atom in morpholino-group, which probably decreases the ability of
nitrogen atom to donate electrons i.e. the basicity of N-piperidino is more than
morpholino phenacyl oxime and hence increases the stability of complex formed.
Copper (II) complexes are more stable, with any of these two ligands, than those of
cobalt(II), a fact concordant with the stability constants of some nitrogen complexes
of metals with Melons, the stability constant increases in the order(56).
Mn < Fe < Co < Ni < Cu > Zn
Infrared spectra of the complexes of N-piperidino and N-morpholino phenacyl
oxime showed an additional band at 3200 cm"1 and disappearance of the broad
shoulder band in the range 2500-2750 cm"1 for the free oxime compounds, often
attributed to extensive inter and intra molecular hydrogen bonding of carboxylic or
analogous groups, which is lacking in the locked metal-ligand complexes because the
lone pair of electrons at the nitrogen and oxygen atoms are now involved in complex
formation with the copper (II) or Cobalt (II) ions.
81

N O H ^
H H *—' * ' H H
Morpholinophenacy] Morpholinophenacyl oxinic
oxime ligand copper(II) complex
The solutions of the morpholino- and piperidino ligand metal
complexes in amyl alcohol exhibited bands in the visible range from 630-660nm, as
compared to the copper(II) metal salts , and showed a mark blue shift of ca. 100-130
nm with increased extinction coefficients. Cobalt(II) complexes gave maximum at
420-422nm. The observed blue shift can be explained in terms of electron donation to
the metal ion thus producing higher excited states, and therefore a shift of absorbance
for the chelated metal ions to shorter wavelength.
The high value of extraction percentage obtained for copper(II) by N-
piperidinophenacyl oxime ligand (96.7%) , shows that this ligand can be used as an
analytical reagent for the quantitative spectrophotometric determination of copper(II)
salts in aqueous media.
82

REFERENCES
1. F. A. Cotton and G. Wilkinson, " Advanced Inorganic Chemistry " 4th Edn , Wiley,
London, (1980).
2. W. Christian "Analytical Chemistry" 3rd Edn, Wiley, London (1970).
3. M. M. Jones " Elementary Co-ordination Chemistry " (1964).
4. H. S. Maslen and T. N.Waters, Coord. Chem. Rev.17, 137, (1975).
5. A. H. AH, " Ph.D. Thesis, University of Khartoum" . 1986.
6. B.J.Hathway and D.E.Billing, Coord. Chem.Rev.5,143, (1970)
7. H. Sigel, Angew, Chem., Int.Ed., 13,394(1974).
8. A. F. Wells,.J. Chem. Soc, 1670 (1974).
9. Y. Muto, Bull.chem.Soc,. Jpn, 33 , 1242 (1960).
10. T.Ianaka, Bull.chem.Soc.Jpn, 29, 93 (1956).
11. D.E.C. Corbridge and E.G.Cox, J.Chem.Soc,594, (1956).
12. D.P. Graddon, Nature. 183, 1610 (1959).
13. M. G. Mellor, Nature, 159, 370, (1947).
14. D.Hall and T.N. waters, J. Chem. Soc. 2644 (1960).
15. O.HLBusch and R.S. Young, "Cobalt Chemistry" New York, (1960).
16. G.M. Waind and B.Martin , J. Inorg.Nuclear Chem., 8, 551 (1959).
17. N. .Marki, Nature, 185,227 , (1960)
18. A. F. Wells, "Structural Inorganic Chemistry", Oxford University Press, 4rth Ed.,
1975
19. LBernal, E.A.V. Ebsworth, and J.A.Weil, Proc, Chem.Soc.57 (1959).
20. D.N.Hume and I.M.Kalthoff,.J.Am, Chem Soc. 71,867 (1949).
21. G.A.Barbieri, Ahi accad. Lincie (6)J,747, (1928).
22. HF. Bauer and W.C.Drinkard, J.Am .Chem. Soc, 82,5031 (1960).
23. LBernal, E.A.N. Ebsworth, and J.A.Weil, Proc.Chem.Soc. 57 (1959).
24. F.P. Keith and J.C. Kotz, "Inorganic Chemistry " Holt-Saunders International Ed.,
Japan (1985).
83

25. A.I.Vogel, " Textback of Quantative Inorganic Analysis" , 4th Edn Longman Inc.,
London (1978).
26. LL.Finar " Organic Chemistry Vol.1 " 6th Edn., Longman Inc.London (1973).
27. R.C.Mehrotra, Inorg.Chim.Acta, 13,91 (1975).
28. A.Nakamura,_J. Chem. Soc., 488 (1979).
29. E. Iarsen, Inorg. Chem., 11 , 2652 (1972).
30. D.R.Boston and N.J.Rose, J.Am.Chem.Soc, 95, 4163, (1973).
31. J.A.Bertrand, J.H.Smith, and D.G. Eller, Inorg. Chem., 13,1649 (1974).
32. A.W.A.Ashworth, Coord. Chem. Rev., 16.285 (1975).
33. G.HMorrison and H.Frieser "Solvent Extraction in Analytical Chemistry " Wiley,
New York, (1957).
34. C. Craig, Rev. Anal.Chem., 28, 723 (1956).
35. D.E.Boltz., and M.G.Mellon, Anal.,Chem.,46, 227 (1974).
36. E.Fremy, Ann. Chem., Phys., 35, 257(1952).
37. P. Job, Ann, Chem., 9 , 113 (1928).
38. W.R., Vesburgh and G.R. Cooper. J. Am. Chem. Soc, 63,437 (1941).
39. J.RYoe and A.L.Jones, Ind. Eng. Chem., Anal. Ed., 16,111, (1944).
40. A.E.Harvey and D.L.Manning, J. Am. Chem. Soc, 72,4488 (1950),
41.E.B.Sandell " Colorimetric Determination of trace metals ", 3rd Ed. Interscience
Publisher, Inc., New York (1965).
42. T.B.Crumpler, Anal.Chem., 19, 325 (1974).
43. G.Z. speau, Anal.Chem., 67,27 (1925).
44. R.Biazzo, Ann. Chem. Applicata, 16 , 96 (1926).
45. T.Moeller and R.E.Zegg, Anal. Chem., 22, 612 (1950).
46. P.Giesecke,_Am.Inst. Mining Metal.Engrs.,Tech.PublicJ 1740 (1944).
47. G.KAyres and B.V.Glanville, Anal. Chem., 21, 931 (1949).
48. B.Sevens, Analyst, 50, 389 (1925).
49. WJHienz, Z Anal.Chem., 78, 432 (1929).
50. S.A.Braley and F.B.Hobart, J.Am,.Chem.Soc, 43 , 482 (1921).
51. A.I. Vogel "Practical Organic Chemistry ", 3rd Ed. Longman Inc. London (1970).
84

52. I. Heibron and H. M Bumbury " Dictionary of Organic Chemistry" 3rd., Ed., Vol.
2, Eyne and Spottiswoode, London, (1965).
53. I. Heibron and H. M. Bumbury " Dictionary of Organic Chemistry" 3rd., Ed., Vol.
4, Eyne and Spottiswoode, London, (1965).
54. I. Heibron and H. M. Bumbury " Dictionary of Organic Chemistry" 3rd., Ed., Vol.
5, Eyne and Spottiswoode, London, (1965).
55. S.H.Simoson and H.M.Burnett, Anal.Chem., 27, 1336(1955).
56. Irving and Williams, Nature, 162, 746 (1948).
85