3. US0 OM) [I Dirwt R2-12, 3 73-6 167/67531/metadc741983/m2/1/high_res_d/803704.pdf ·...
27
2. ECN Category (mort OM) Dirwt Revision Chap0 ECN stmy Srp.rs-req'%L Cbnce l/Voi d t1 Uepln*nt€il 1npor.w 12a. ~ l o d l f i c a t i o n York 5. Date 05/03/00 3. Originator's Name, Organization, WSIN, 4. US0 Rqired? and Telephone No. M. R. Adams, Data Development [I yes [XI NO and Interpretation, R2-12, 3 73-6 167 7. Eldg./Sys./Fac. No. 6. ProJect Title/No./Uork Order No. Tank 241-TX-118 241-TX-118 9. DoCunmt Nunbers Changed by this ECN 10. Related ECN NOCS). (includes sheet no. and rev.) HNF-SD-WM-ER-718, Rev. 1 ECNs: 647951 1Zb. Uork Package 1Zc. Modification Uork dnptete 12d. Resto E. Approval Designator No. [I Yam (fill Wt Elk. N/A 12b) N/A 11. R d b t c d W NO. tion (1- N/A [XI No (WA Elks. 1Zb. 1Zc. 1Zd) 140. Justification (msrk one) C r i t e r i e Change [XI Design lnprovnnnt [] Enviromntal 11 Facility Deactivation [I k-F& 11 Facilitate Const [] const. Error/anission [I Design Error/Omission [I 14b. Justification Details Electronic access t o information and data i s superseding hard copy document. Design Authority/Cog. Engineer Design Authoritylcog. EngiMnr Signature & Date SiPIY)tUrO & Dbtb 15. Distritution (include n e , MSIN, and no. of copies) See attached distribution. A-7900-013-2 (05/%) GEFW5 a* A-7KYMlSl
Transcript of 3. US0 OM) [I Dirwt R2-12, 3 73-6 167/67531/metadc741983/m2/1/high_res_d/803704.pdf ·...
2. ECN Category (mort OM)
Dirwt Revision Chap0 ECN
s t m y Srp.rs-req'%L Cbnce l /Vo i d t1
Uepln*nt€il
1npor.w
12a. ~ l o d l f i c a t i o n York
5. Date
05/03/00
3. Originator's Name, Organization, WSIN, 4. US0 R q i r e d ? and Telephone No.
M. R. Adams, Data Development [ I yes [ X I NO
and In te rpre ta t ion , R2-12, 3 73-6 167
7. Eldg./Sys./Fac. No. 6. ProJect Title/No./Uork Order No.
Tank 241-TX-118 241-TX-118 9. DoCunmt Nunbers Changed by t h i s ECN 10. Related ECN NOCS).
(includes sheet no. and rev.) HNF-SD-WM-ER-718, Rev. 1 ECNs: 647951
1Zb. Uork Package 1Zc. Modification Uork dnptete 12d. Resto
E. Approval Designator
No.
[I Yam ( f i l l Wt Elk. N/A 12b)
N/A 11. Rdbtcd W NO.
t i o n (1-
N/A [ X I No (WA Elks. 1Zb.
1Zc. 1Zd)
140. Jus t i f i ca t ion (msrk one) Cr i te r ie Change [ X I Design lnprovnnnt [ ] Env i romnta l 11 F a c i l i t y Deactivation [I k - F & 11 Fac i l i ta te Const [ ] const. Error/anission [ I Design Error/Omission [ I 14b. Jus t i f i ca t ion Detai ls E lec t ron ic access t o in format ion and data i s superseding hard copy document.
Design Authority/Cog. Engineer Design Authoritylcog. EngiMnr Signature & Date SiPIY)tUrO & Dbtb
15. D i s t r i t u t i o n (include n e , MSIN, and no. of copies)
See attached d i s t r i b u t i o n .
A-7900-013-2 (05/%) GEFW5
a*
A-7KYMlSl
ENGINEERING CHANGE NOTICE
Functional Design Cr i te r ia
Dperat ing Specif icat ion
C r i t i c a l i t y S p c i f i cat ion
1. ECN (use no. frm pg. 1)
Page 2 of 2 ECN-657286
Cmceptual Design Report
Equiprrnt spec.
Conrrt. spec.
Procurement Spec.
Vendor Inf orrnati on
CU Manual
FSARISAR
Safety Equipnent L i s t
Radiation Uotk Permit
Envirornantal Inpact statelwnt Emironrrntal Report
Envi rornrmtal Permit
16. Design 17. Cost Inpact ENGINEERING CONSTRUCTION Writ i c a t i m
R q i r e d
[ X I NO Savings $ Savings 11 [ I $ 11 $ [ I $ Additional Additional 11 yes
StresslDesign Report
Interface Contro l Drawing
Cali brat ion Procedure
18. schcdule Inpact (days)
l np rovmnt
Delay [ I 11
Instal lat ion Procedure
Maintenance Procedure
Engineering Procedure
Operating Instruct ion
Operating Procedure
operational Safety Requi rmnt IEFO Drawing
Cell A r r a n g m t Drawing
Essential Material Specification Fac. Proc. Serrp. Schedule
Inspection Plan
Inventory Adjustment
Tank Calibrat ion M a w 1
Health Physics Procedure spares Mult ip le U n i t l i s t i n g Test ProcsdureslSpeci f i ca t i o n CORpOnent Index
ASME Coded ltml
Hunan Factor Consideration carpl ter Software
E lec t r i c C i rcu i t Schedule ICRS Procedure
Process control Manua LIP l an Process Flou Chart
Purchase Requisition
Tickler F i l e
L J Request 20. other Affected Docwnts: (NOTE: Docunents l i s ted belou w i l l not be revised by th i s ECN.) signature% below
indicate that the signing organization has been no t i f ied of other affected docunents l i s ted below. Docunent Nu'berlRevision Docment NunberlRevision Docunent Nuher Revision
N/A
21. Approvals
Signature Design Authority
Cog. E M . . U. R. Adam
cog. nsr. J. G. Fie ld
PA
Safety
Environ.
Other
Mlha, 76 F a
Date Signature Design Agent
PE
QA
Safety
Design
Envi ron.
Other
Date
DEPARTMENT OF ENERGY
Signature or a Control N u ' b e r that tracks the Approval Signature
ADD1 TI DNAL
A-7900-013-3 (05196) GEF096
DISTRIBUTION SHEET
In te rpre ta t ion Project Tit leNork Order Tank Character izat ion Report f o r Single-Shell Tank 241-TX-118, HNF-SO-WM-ER-718, Rev. 1
Page 1 o f 2 I From Data Development and To
D i s t r i b u t i o n
EDT No. N/A ECN No. 657286
Text Text Attach./ With Only Appendix A1 1 Only Name MSIN
Attach.
EDT/ECN Only
Sandia National Laboratory P.O. Box 5800 MS-0744, Dept. 6404 Albuquerque, NM 87815
0. Powers
Nuclear Consult inq Services Inc. P. 0. Box 29151 Columbus, OH 43229-01051
J. L. Kovach
-mica1 Reaction Sub-TAP P.O. Box 271 Lindsborg, KS 67456
B. C . Hudson
s0.E 555 Quince Orchard Rd., Sui te 500 Gaithersburg, MD 20878-1437
H. Sut ter
Los Alam os L a w t
P. 0. Box 1663 Los Alamos, NM 87545
CST-14 MS-J586
S. F. Agnew
Advisorv Panel 102 Windham Road
X
X
X
X
X
Oak Ridge, TN 37830
0. 0. Campbell X
A-6000-135 (01193) YEF067
To From D i s t r i b u t i o n Data Development and
In te rpre ta t ion Project Title/Work Order Tank Character izat ion Report f o r Single-Shell Tank 241-TX-118, HNF-SD-WM-ER-718, Rev. 1
Of f i ce of River Protect ion W. S. L iou
Page 2 o f 2
Date 05/03/00
EDT No. N/A
ECN No. 657286
DOE Reading Room
F luor Hanford J. S. Hertzel
Text Text Attach./ Name MSIN With A l l Only Appendix
Attach. Only
HILL Hanf ord G r OUD. Inc. M. R. Adam
EDT/ECN Only
J. G. F i e l d J. W. Hunt G. D. Johnson R. E. Larson (SSTs Only) L. M. Sasaki B. C. Simpson R. R. Thompson ERC (Environmental Resource Center) T.C.S.R.C.
lockheed Mart in Services. Inc. B. G. Lauzon Central F i l e s EDMC
Numa tec Hanf ord Corooration J . S. Gar f i e ld D. L. Her t ing
H6-60 H2-53
A1-14
R2-12 R2-12 R2-12 R1-44 T4-07 R2-12 R2-12 R2-12 R1-51 R1-10
R1-08 81-07 H6-08
R3-73 T6-07
X X
X
X X X X X X X X X 5
X X X
X X
A-6000-135 (01193) UEF067
BIE # -'
HNF-SD-WM-ER-718, Rev. 1
Tank Characterization Report for Single-Shell Tank 241 -TX-1 18
U. R. Adam CH2M H i l l Hanford Group, Inc., Richland, WA 99352 U.S. Department o f Energy Contract 8023764-9-KO01
EDT/ECN: ECN-657286 UC: 2070 Org Code: 74B20 CACN/COA: 102227/A020 B&R Code: EW 3120074 Tota l Pages:
Key Words: Waste Characterization, Single-Shell Tank, SST, Tank 241-TX-118, Tank TX-118, TX-118, TX Farm, Tank Character izat ion Report, TCR, Waste Inventory, TPA Milestone M-44
Abstract: N/A
http://pctwins.pnl.gov:9397/twinsproto/default.htm
TRADEMARK DISCLAIMER. track nme, tredemrk, manufacturer, or otheruise, does not necessarily consti tute or inp ly i t s endorsent , r e c m n d a t i o n , o r favoring by the United States Goverrment or any agency thereof or I t s contractors or SUbcontractors.
Reference herein t o any specif ic connrrcial product, process. or service by
Printed in the United States of Amrice. To obtain copies of th is docunent. contact: UHClBCS D o c w n t Control Services, P.O. Box 1970, Mailstop H6-08, Richland UA 99352. Phone ( 5 0 9 ) 372-2420; Fax (509) 376-4989.
-
Approved for Public Release A-6400-073 (10/95) GEF321
(0 D o c u n t *ukr RECORD OF REVISION
HNF-SD-WH-ER-718
I (2) 15tla I Preliminary Tank Characterization Report for Single-Shell lank 241-TX-118: Best-Basis
~
- 1
I@ 1
I I I
Incorporate Per E8N-657286 M.R. Adam J . G . F i e l d MA&&+. 03 bL44 5-3-30
/
A-7320-005 (08/9l) UEF168
"F-SD-WM-ER-718, Rev. 1 This report prepared espeCiany for Archive TIR on 5/2/00
Some of the reports herein may contain data that has not been reviewed or edited. The data wi l l have been reviewed or edited as of the date that a Tank Interpretive Report (TIR) is prepared and approved. The TIR for this tank was approved on April 24,2000.
Tank: 241-TX-118
Sampling Events: 236 259 260
Reports: Tank Interpretive Report
Constituent Groups: Anions Inorganics Metals/Nonmetals
PCBs Physical Properties Radionuclides
organics
HNF-SD-WM-ER-718, Rev. 1 Table of Contents
Data Dictionary to Reports in this Document ................................................................. 1 Tank Interpretive Report For 24 1 -m- 1 18 . . . . . . . . . . . . . . . . . . . . . . . . . . . . . . . . . . . . . . . . . . . . . . . . . . . . . . . . . . . . . . . . . . . . 2
Tank Information Drivers . ... ... ... .. . ... . ... . ... ... .. . .. . ... ... , .. . ... .. ... ... .. ... .. .. ... .. .. .. .. .. ....... .. 2 6 Tank History ...... ... .. .. , .. ... ... .. . .. . .. . ... . ... . .. . .. . .. . .. . ... ... . .. ... ... ... .. ..... .. .. .. ... .. .. .. .........
Tank Compariso ................................................................................................ 7 Disposal Implications ........................................................................................... 8
8 Scientists Assessment of Data Quality and Quantity ....................................................... 13 Unique Aspects of the Tank.. . . . . . . . . . . . . . . . , . . . . . . . . . . . . . . . . . . . . . . . . . . . . . . . . . . . . . . . . . . . . . . . . . . . . . . . . . . . . . . . .
Best-Basis Inventory Derivation . . . . . . . . . . . . . . . . . . . . . , . . . . . . . . . . . . . . . . . . . . . . . , . . . . . . . . . . . . . . . . . . . . . . . . . . . . . . . 13 Reference List .................................................................................................. 17
ii
HNF-SD-WM-ER-718, Rev. 1
Data Dictionary to Reports in this Document
Report Field Description Tank Interpretive Report
_ _ _ _ _ ............................................................ ____________________...~..~...~..~~~..~~~..~~~.~~~~..~ Interprets information about the tank answering a series of seven questions covering areas such as information drivers, tank history, tank comparisons, disposal implications, data quality and quantity, and unique aspects of the tank.
1
HNF-SD-WM-ER-718, Rev. 1
Tank Interpretive Report For 241-TX-118
Tank Information Drivers
Question I : What are the information drivers applicable to this tank? What type of information does each driver require from this tank? (Examples of drivers are Data Quality Objectives, Mid-Level Disposal Logic, RPP Operation and Utilization Plan, test plans and Letters of Instruction.) To what extent have the i@ormation and data required in the driving document been satisfied to date by the analytical and interpretive work done on this tank?
The information drivers for tank 241-TX-118 include the Safety Screening Data Quality Objective (DQO) (Dukelow et al. 1995), the Organic Complexant Safety Issue Memorandum of Understanding (MOU) (Schreiber 1997), the Historical DQO (Simpson and McCain 1997), and the Pretreatment DQO (Slankas et al. 1995 and Kupfer et al. 1995).
Safety Screening DQO: Does the waste pose or contribute to any recognized potential safety problems?
The data needed to screen the waste in tank 241-TX-118 for potential safety problems are documented in Tank Sqfety Screening Data Quality Objective (Dukelow et al. 1995). These potential safety problems are exothermic conditions in the waste, flammable gases in the waste and/or tank headspace, and criticality conditions in the waste. Tank 241-TX-118 has been sufficiently sampled to meet the requirements of the Safety Screening DQO. The individual issues addressed in the DQO are discussed below.
Results obtained using differential scanning calorimetry (DSC) are used to determine if any portion of the sampled tank waste exceeds the safety screening decision threshold of 480 J/g (dry-weight basis). None of the 241-TX-118 core samples taken in 1998 and 1999 exhibited exothermic energy. Therefore, the concern regarding exothermic conditions in the 241-TX-118 waste are alleviated.
Under the direction of the Tank 241-IX-I18 Push Mode Core Sampling and Analysis Plan (Benar 1997) and the Tank 241-IX-I18 Rotary Mode Core Sampling and Analysis Plan (McCain 1998) headspace vapor measurements were taken during the 1998 and 1999 sampling events, respectively. AI1 results were 2 percent of the lower flammability limit (LFL) or less. The results from the combustible gas meter readings are reported in the ZH SnzrData Standard Report. Headspace vapor measurements were also taken in September and December of 1994, and the result of 0.24 percent of the LFL for hydrogen (97 ppmv) was the highest upper bounding concentration recorded for the sampling event (Huckaby and Bratzel 1995). These results are all well below the action level of 25 percent of the LFL.
The threshold value for the criticality issue is 1 g/L of plutonium. The total alpha activity is often the basis for the comparison of sample results to the threshold value. Assuming that all alpha activity is from 239pu, and using a maximum sample density of 1.88 g/mL, 1 g/L of 239Pu is equivalent to 32.7 pCilg. It was observed that the gross alpha results for samples from core 236, segment 1; core 259, segment 1; and core 260, segment 1 , exceeded this threshold. Analyses for the u9mPu
2
HNF-SD-WM-ER-718, Rev. 1 concentrations were performed in response to the notification of the high alpha results for these three segments, as required in the DQO. The primary result of 36.8 pCi/g from sample S99T001113 and the calculated upper limit to the 95 percent confidence interval on the mean of 56.5 pCi/g and 41.8 pCCilg for samples S99T001113 and S99Mo1376, respectively, exceeded the threshold value. In response to the notification of the high 239"40Pu results, Nuclear Safety Licensing commenced an investigation, and the findings were documented in Lipke (1999). The highest of the duplicate runs was chosen for both the Pu isotopic data and the specific gravity. The calculation determined that the highest 239mPu result of 36 WCilg, from core 260, segment 1, converts to 0.89 glL of plutonium, using a specific gravity of 1.5 glml. The Safety Screening DQO issue for criticality is not expected to be a concern because the highest value is less than the 1 glL criterion.
Organic Complexant Safety Issue MOU Does the possibility exist for a point source ignition in the waste followed by a propagation of the reaction in the solidlliquid phase of the waste?
The data required for the organic complexant issue are documented in Memorandum of Understanding for the Organic Complexant Safe@ Issue Data Requirement (Schreiber 1997). Differential scanning calorimetry and total organic carbon (TOC) analyses were performed on the core samples to address the organic complexant issue. DSC measurements found no exotherms in the sampled waste. TOC analyses were done on the 1998 segments and the 1999 composite samples. The results were below the organic complexant action level of 45,000 pg C/g (dry-weight basis). The highest individual result of 44,500 pg Clg (dry-weight basis) was from core 259, segment 2 upper half. The highest average sample result was 44,300 pg Clg (dry-weight basis) for core 236, segment 2 upper half. The relatively high TOC results combined with the absence of exotherms can be explained by the oxalate concentrations in those segments. The mean oxalate value of 87,400 pglg for core 259, segment 2 upper half, yields a TOC equivalent of 23,900 pg Clg. The comparison of the oxalate TOC equivalent with the core 259, segment 2 upper half mean TOC value of 25,000 pg Clg shows the oxalate accounts for the majority of the TOC measured. Because oxalate contributes little fuel value, the low exotherm measurement is expected (Meacham et al. 1998).
The organic complexant issue was closed for all tanks in December 1998 (Owendoff 1998).
Historical DQO: Is the waste inventory generated by a model based on process knowledge and historical information (Agnew et al. 1997a) representative of the current tank waste inventory?
The purpose of the historical evaluation is to determine whether the Hanford Defined Waste (HDW) model, based on process knowledge and historical information (Agnew et al. 1997a), agrees with current descriptions of tank inventories based on sampling. Historical DQO issues (Simpson and McCain 1997) have largely been replaced by the Best-Basis Inventory assessment (see Question 7). The following discussion of the historical DQO evaluation is presented for information.
The historical DQO identifies the waste type of interest for tank 241-TX-118 as SMMT2 saltcake. In the evaluation, a gateway analysis is performed by comparing analytical results with DQO-defined concentration levels for the key analytes in the SMMT2 saltcake waste type. If the analytical results are greater than 10 percent of the DQO-defined levels and the sum of the analyte masses is greater than 85 percent of the sum for the historical waste stream, the waste type and layer identification are considered acceptable (Simpson and McCain 1997).
3
HNF-SD-WM-ER-718, Rev. 1
According to Agnew et al. (1 997a), tank 24 1 -TX- 1 18 is expected to contain a layer comprised of four segments of SMMT2 saltcake waste. The push-mode core sampling event in 1998 yielded a total of two segments. In 1999, rotary-mode core sampling recovered one four-segment core and one five-segment core. As the 1999 event was more comprehensive, the analytical results from the 1999 solid segments for the key analytes were compared to the historical model evaluation DQO-predicted concentrations for these waste types.
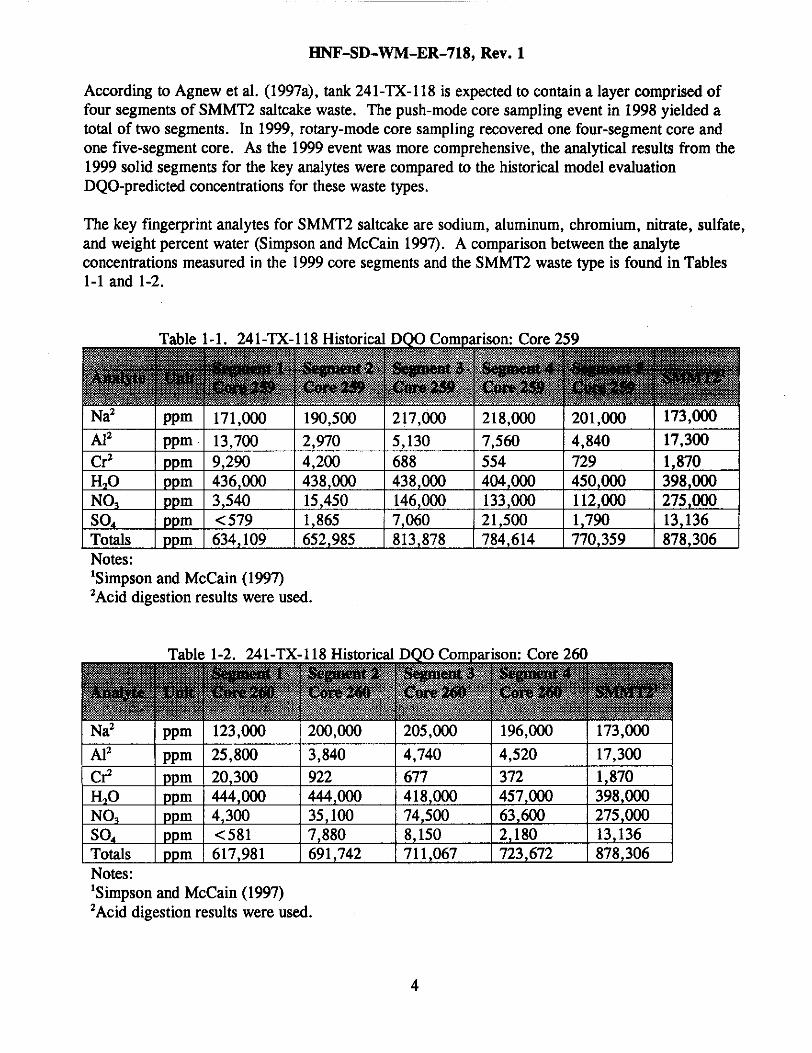
The key fingerprint analytes for SMMT2 saltcake are sodium, aluminum, chromium, nitrate, sulfate, and weight percent water (Simpson and McCain 1997). A comparison between the analyte concentrations measured in the 1999 core segments and the SMMT2 waste type is found in Tables 1-1 and 1-2.
Notes: 'Simpson and McCain (1997) 'Acid digestion results were used.
Notes: 'Simpson and McCain (1997) *Acid digestion results were used.
4
HNF-SD-WM-ER-718, Rev. 1 As shown in Tables 1-1 and 1-2, the lower three segments from each of the two co ra passed the gateway analysis for the 10 percent criterion when compared to the SMMT2 saltcake fingerprint analyte concentrations. To pass the 85 percent total mass criterion for the waste type the segments must have a total mass of at least 850,000 ppm for the same analytes. None of the segments from cores 259 and 260 passed the 85 percent total mass criterion. The gateway analysis for the 10 percent criterion failure for the upper segments for cores 259 and 260 may be attributed to the Z-Plant waste found in those segments. The Historical DQO SMMT2 saltcake fingerprint analytes overestimated the aluminum, chromium, nitrate, and sulfate concentrations in the core 259 and core 260 segments, causing the failure of all the segments in the 85 percent total mass criterion for the waste type.
Pretreatment DQO: What fraction of the waste is soluble when treated by sludge washing and leaching?
An archived solid composite sample of 150 grams (g) was requested for the Pretreatment DQO (Slankas et al. 1995 and Kupfer et al. 1995) in the Tank 241-E-118 Rotary Mode Core Sampling and Analysis Plan (McCain 1998). The request for the 150 g composite was based on the expectation of two seven-segment cores from tank 241-TX-118. However, the sampling event yielded a total of nine segments between the two cores retrieved. A 41.2 g composite from core 259 and a 49.2 g composite from core 260 were archived for future pretreatment analysis and evaluation to assess what fraction of the waste is soluble when treated by sludge washing and leaching. Approximately 450 g of segment sample material from the 1999 sampling event were also archived.
~
Cesium-137 Plutonium-239 Plutonium-240 Americium-24 1
Heat Load Estimate:
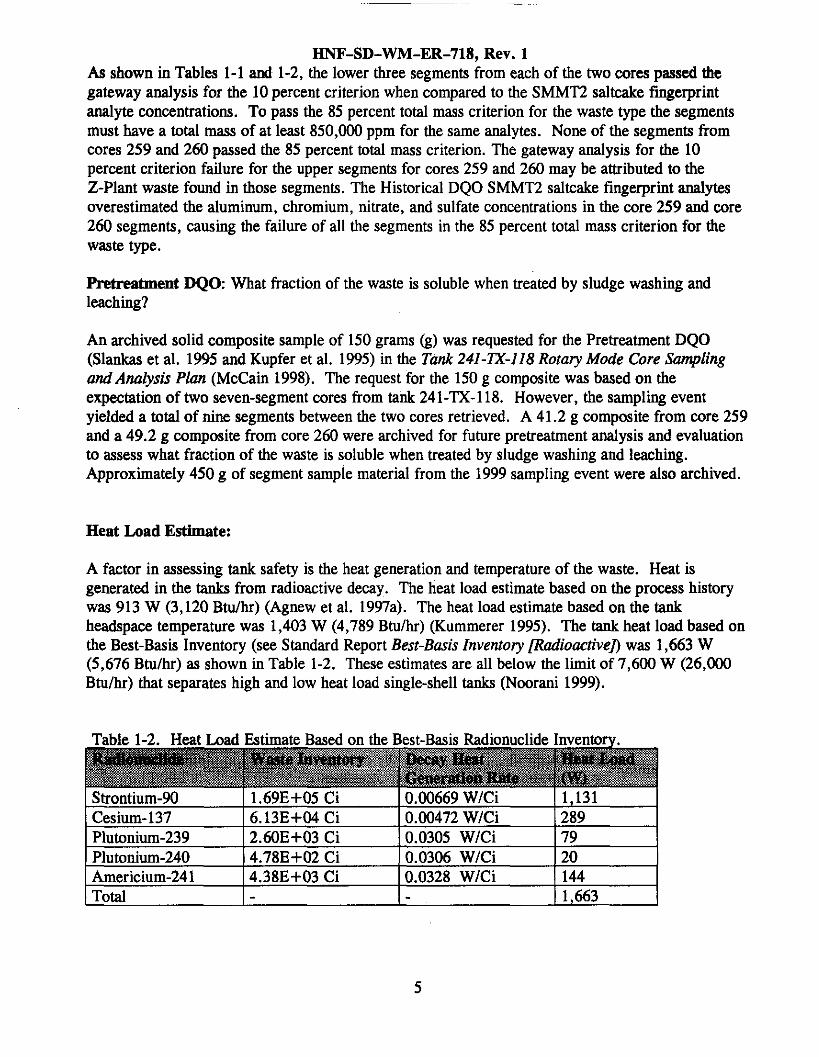
A factor in assessing tank safety is the heat generation and temperature of the waste. Heat is generated in the tanks from radioactive decay. The heat load estimate based on the process history was 913 W (3,120 Btdhr) (Agnew et al. 1997a). The heat load estimate based on the tank headspace temperature was 1,403 W (4,789 Btulhr) (Kummerer 1995). The tank heat load based on the Best-Basis Inventory (see Standard Report Best-Basis Inventory /Rudiouctivefi was 1,663 W (5,676 Btulhr) as shown in Table 1-2. These estimates are all below the limit of 7,600 W (26,000 Btuhr) that separates high and low heat load single-shell tanks (Noorani 1999).
6.13E+04 Ci 0.00472 WlCi 289 2.60E+03 Ci 0.0305 WlCi 79 4.78E+02 Ci 0.0306 WlCi 20 4.38E+03 Ci 0.0328 WlCi 144
1 Strontium-90 I1.69E+05 Ci 10.00669 WlCi 11,131
I Total - - I 1,663
5
HNF-SD-WM-ER-718, Rev. 1
Bounding Concentrations:
Sample results from tank 241-TX-118 were screened against the bounding concentration limits used to develop the authorization basis source term, derived from the Final Safety Analysis Review. These bounding concentration limits are found in Tables 4-1 and 4-2 in HNF-SD-PROC-021 Rev. 3, Section 18.0 (Adams 1999). One americium-241, four plutonium-239/240, and ten vanadium samples results exceeded the respective bounding concentration limits. Except for vanadium results from a core composite, all results in question originated from the top segments of three cores. Notifications to the on-call process engineer and the process control manager were made per Adams (1999) for further study concerning those samples exceeding the bounding concentration l i i t s .
Tank History
Question 2: What is known about the history of this tank as it relates to waste behavior?
The 241-TX Tank Farm was constructed during 1947 and 1948 in the 200 West Area. The TX Tank Farm contains eighteen 100-series tanks. The 100-series tanks have a capacity of 2869 kL (758 kgal), a diameter of 22.9 m (75.0 ft), and an operating depth of 7.3 m (23.94 ft). Tank 241-TX-118 is the third tank in a three tank cascade with tanks 241-TX-116 and 241-TX-117. Tank 241-TX-118 is listed as sound (Hanlon 2000) and currently contains 1,083 kL (286 kgal) of noncomplexed waste. Hanlon (2000) lists the waste volume for tank 241-TX-118 as 1136 kL (300 kgal). However, the waste volume of 1,083 (286 kgal) was calculated from the March 13, 2000 ENRAF measurement. The waste volume of 1,083 (286 kgal) will be reflected in a future Hanlon report update. Tank descriptions and figures are presented in standard reports Description of Tank, Tank Plan View, Tank Profile View, and Riser Configuration Table.
Tank 241-TX-118 went into service in 1951 when T plant bismuth phosphate process first decontamination cycle waste cascaded from tank 241-TX-117 and was received from tanks 241-T-104,241-T-105,241-T-108, and 241-T-109 (Agnew et al. 1997b). Between 1951 and 1955 tank 241-TX-118 was the feed tank for the 242-T Evaporator and received evaporator feed from tanks 241-T-105, 241-T-106, 241-T-107, 241-T-108, 241-T-109,241-TX-109, 241-TX-110, 241-TX-111, 241-TX-112, 241-TX-113, 241-TX-114, 241-TX-115, 241-TX-116, 241-TX-117, 241-TY-101, 241-TY-104, 241-TY-105, 241-TY-106, 241-U-110,241-U-111, and 241-U-112. Tank 241-TX-118 also received small additions of water on four occasions during the time period. Waste was sent from tank 241-TX-118 to various cribs and to tanks 241-T-109, 241-TX-103, 241-TX-113, 241-TX-116, 241-TX-117, and 241-TY-102. No activity in tank 241-TX-118 was recorded for 1956.
Activity in the tank resumed in 1957, when decontamination waste was received from U Plant. Tank 241-TX-118 received decontamination waste from U Plant and T Plant between 1957 and 1965. During that time period waste was sent from tank 241-TX-118 to tanks 241-TY-103,241-TY-104, 241-TX-108, 241-TX-114, 241-TX-116. Between 1965 and the first quarter of 1976, tank 24 1-TX- 1 18 was an active feed tank for the 242-T evaporator, and waste was transferred between tank 241-TX-118 and the seventeen other TX-farm tanks. Waste was also transferred between tank
241-U-103, 241-U-104, 241-U-105,241-U-108, 241-U-109,241-U-110, and various T-Farm and 241-TX-118 and 241-BX-106, 241-S-107, 241-SX-103, 241-SX-105, 241-U-101, 241-U-102,
6
HNF-SD-WM-ER-718, Rev. 1 TY-Farm tanks during that time period. Water from miscellaneous sources was added to the tank between 1971 and 1978. Between 1973 and 1976 Z Plant waste was also added to tank 241-TX-118.
In 1977 a partial neutralization (PN) process was applied to tank 241-TX-118. A portion of the residual liquors in the tank was converted into solids when the caustic in the slurry supernate was converted to sodium nitrate by reaction with nitric acid. This process was implemented to reduce the volume of liquors requiring double-shell tank storage (Christensen 1978). Between 1977 and 1978 acid neutralization was applied to the tank alternately with waste additions from various TX-farm tanks. Supernatant was transferred to tanks 241-SY-102 and 241-TX-103 during the same time period as the PN campaign. After the PN campaign, waste was added to tank 241-TX-118 from various T-Farm tanks in 1978, and waste was transferred from tank 241-TX-118 to tanks 241-SY-102, 241-SX-106 and 241-TX-103 between 1978 and 1980.
Tank 241-TX-118 was declared inactive in 1980. In April 1983, interim stabilization was completed after 75 kgals of saltwell liquor was pumped and sent to tank 241-SY-102. Intrusion prevention was completed in August 1984.
Tank Comparisons
Question 3: What other tanks have similar waste types and waste behaviors, and how does knowledge of the similar tanks contribute to the understanding of this tank?
According to Agnew et al. (1997a), tank 241-TX-118 currently contains T1 saltcake, SMMT2 saltcake, and Z Plant waste. It is the third tank in a three tank cascade with tanks 241-TX-116 and 241-TX-117. All three tanks have a significant layer of SMMT2 waste. Tanks 241-TX-116 and 241-TX-117 have considerable layers of T1 saltcake, and could contribute to the understanding of the small T1 saltcake layer at the bottom of tank 241-TX-118. Few other Hanford tanks have as comprehensive a layer of T1 saltcake as the first two tanks in the 241-TX-118 cascade. One tank, tank 241-T-109, has a volume of just 219.6 kL(58 kgal), but the entire inventory is comprised of T1 saltcake. The sample data from tank 241-T-109 may provide useful information regarding the tank 241-TX-118 T1 saltcake waste.
The SMMT2 waste type is relatively well defined and understood, and can be found in a number of other tanks. Inventories of greater than 1,136 kL (300 kgals) of SMMT2 waste exist in 241-TX-105,
241-U-102 also contains a sizable SMMl'2 waste layer. Knowledge from these tanks may contribute to the understanding of the SMMT2 inventory in tank 241-TX-118.
The Z Plant waste layer at the top of tank 241-TX-118 is unique in the Hanford tank farms. Tank 241-SY-102 and tank 241-TX-118, both active feed tanks for differing evaporator campaigns, received Z Plant waste that was generated during two different time periods. The Z Plant waste sent to tank 241-SY-102 was combined with precipitated salt accumulations from prior 242-S evaporator additions while the Z Plant waste sent to tank 241-TX-118 was co-mingled with S M M n saltcake (Agnew et al. 1997a). As the Z Plant waste was added to tank 241-TX-118 some of the sludge from the 2 Plant waste may have been distributed around the TX Farm bottoms receiver tanks. However, the only tanks Agnew et al. (1997a) attributes more than 3.8 kL (1 kgal) of Z Plant inventory to are
7
241-TX-106, 241-TX-110, 241-TX-111, 241-TX-112, 241-TX-113, and 241-TX-114. Tank
HNF-SD-WM-ER-718, Rev. 1 tanks 241-TX-118 and 241-SY-102. Therefore, there is little information available to contribute to the understanding of the Z Plant waste in tank 241-TX-118.
Disposal Implications
Question 4: Given what is known about the waste properties and waste behaviors in this tank, what are the implications of the waste properties and behaviors to the waste retrieval/processing methodologies and equipmeni selection?
Tank 241-TX-118 has been selected as a Phase I1 source tank for vitrification. The single-shell tank (SST) retrieval strategy (Kirkbride et al. 1999) lists tank 241-TX-118 as a Category 1 tank because of the low technetium inventory in the tank, the sound integrity of the tank, and the high percentage of saltcake in the waste inventory for the tank.
The tank contains 79 kL (21 kgal) of sludge on top of 1,004 kL (265 kgal) of saltcake. No drainable liquid was recovered during sampling events for the tank. A push-mode core sampling event in 1998 yielded only two segments from one riser because of high down forces encountered. Sampling from a second riser was attempted, with no success. The difficulty in sampling can be attributed to the hard nature of the waste. Rotary-mode core sampling in 1999 was successful in obtaining a full vertical profile of the tank waste. However, 35 percent was the average recovery of waste from each core segment. The poor recovery may be attributed to the nature of the waste. Bulk density measurements were not completed on the rotary-mode core samples from the 1999 sampling event because the dryness of the sludge samples and the large crystalline nature of the saltcake. This indicates that the waste will require softening to be retrieved, or retrieval will require equipment designed to remove hard solids.
Sample results from 1998 and 1999 showed that the top layer of sludge waste in the tank has a plutonium concentration of 0.89 g/L, which is below the Safety Screening DQO threshold value of 1 glL for criticality (Lipke 1999). However, the high alpha activity sludge may be a concern when assessing the retrieval/processing methodologies. Total organic carbon and differential scanning calorimetry results were well below the action level set for organic complexants, and are not a concern for retrieval. The flammable gas concentrations in the tank headspace measured 2 percent or less of the LFL prior to sampling events. The vapors were measured during steady state conditions; the waste may behave differently during retrieval operations such as sluicing, mixing, or pumping.
Assessments that could be conducted to better address disposal implications include evaluating pretreatment issues and estimating the number of glass logs that tank 241-TX-118 waste will produce. A 41.2 g composite from core 259 and a 49.2 g composite from core 260 were archived for future pretreatment analysis and evaluation to assess what fraction of the waste is soluble when treated by sludge washing and leaching. Approximately 450 g of segment sample material from the 1999 sampling event were also archived.
Scientists Assessment of Data Quality and Quantity
Question 5: Given the curreni state of understanding of the waste in this tank on the one hand and the information drivers on the other; should additional tank data be sought via sampling/analysis from a strictly technical point-of view? Can the waste behavior in this tank be adequately
a
HNF-SD-WM-ER-718, Rev. 1 understood by other means (eg. archive samples, tank grouping studies, modeling) without additional sampling and analysis? r f so, what characteristics of the tank waste lend themselves to a mn- sample alternative? Is the quality of the data from this tank adequate from afield sampling and analytical laboratory point-of view? Are there any clan#?cations or explanations needed for the data tables andfigures?
Sampling and Analysis
Two core samples were requested to be taken from tank 241-TX-118 (Benar 1997 and McCain 1998). Seven segments per core were expected from the tank to obtain a full core profile. The profile estimate was based on the waste volume estimate of 1,310 kL (347 kgal) found in Brevick et al. (1996). A recent (March 13, 2000) surface level measurement converts to a waste volume of 1,083 (286 kgal). The profile estimate based on the waste volume of 1,083 (286 kgal) is five full segments per core, assuming the waste surfaci is level.
A push mode core sampling event for tank 241-TX-118 yielded two segments for core 236 from tank riser 12B between April 1, 1998 and April 13, 1998. The sampling event included core 234 from tank riser 9B between March 23, 1998 and March 26, 1998. The attempt at recovering waste for core 234 resulted in an empty sampler for segments 1 and lA, and the sampling from that riser was suspended. The 1998 sampling event did not satisfy the applicable DQO requirements.
Rotary-mode core sampling in 1999 was successful in recovering two cores. Five segments for core 259 were taken from tank riser 12B between May 11, 1999 and May 19, 1999. A 17-inch deep depression in the waste was measured under riser 9B (see ZX-118 RMCS Core Profile Standard Report). This depression resulted in a yield of four segments for core 260 from riser 9B on June 2, 1999. The average recovery of waste from each core segment from the 1999 sampling event was 35 percent. The difficulty in sampling may be attributed to the dry nature of the waste. The recovery from this sampling event was sufficient for the characterization of the waste phases in the tank.
The following DQOs and waste issues have been addressed for this tank and accepted by the Project Hanford Management Contract River Protection Project (RPP): Safety Screening DQO (Dukelow et al. 1995), Organic Complexant MOU (Schreiber 1997), Historical DQO (Simpson and McCain 1997), and the Pretreatment DQO (Slankas et al. 1995 and Kupfer et al. 1995). No additional sampling or analyses are necessary to satisfy current safety issue requirements for this tank.
Data Quality
The data obtained from the core sampling events were collected and analyzed with approved and recognized sampling and laboratory procedures and in accordance with the sampling and analysis plans (Benar 1997 and McCain 1998). The laboratory procedures for the core sample analysis can be found in the Analytical Methoak and Procedures Standard Report. Quality Control (QC) parameters assessed in conjunction with tank 241-TX-118 samples included standard recoveries, spike recoveries, duplicate analyses, and blanks. Appropriate QC footnotes were applied to data outside QC parameter limits. Analytical results and data quality for the core samples are discussed in the tank 241-TX-118 data packages (Esch 1998 and Bell 1999). Vapor sampling results and a summary of the data quality are provided in Huckaby and Bratzel (1995).
9
HNF-SD-WM-ER-718, Rev. 1 The majority of QC results were within the boundaries specified in the sampling and analysis plans. Discrepancies noted in the analytical reports and footnoted in the Analytical Results Standard Report should not impact the data validity or use. A brief discussion of these discrepancies is presented below.
High relative percent difference (RPD) values were associated with all detected anions from sample S99TOO1008 (core 259, segment 3). Another digest was performed, and the second digested sample (S99T001373) also showed poor analytical precision. Material from this segment was saltcake, which was difficult to homogenize at the 0.5 g level (the quantity used in a water digest).
While the ion chromatography (IC) analyses were being performed for the 1999 samples, it was noted that two S99T001135 vials contained sediment and sample S99T001121 was cloudy. The samples were filtered following digestion, and it was suggested that cooling of the samples caused precipitation following the filtration.
The 1999 IC results included five nitrate samples and one sulfate sample with RPD values that were above the 20 percent limit (McCain 1998). The sample analyses were re-run, with the conclusion that high RPD values were due to sample heterogeneity.
An RPD of greater than 20 percent was reported for two sulfate samples (S98TOO1538 and S98TOO1539) from the 1998 sampling event. The high RPDs were attributed to decreased precision, since the sample results were less than five times the detection limit. No reanalyses were requested.
A second Inductively Coupled Plasma (ICP) acid digest was performed on segment 1 of cores 259 and 260 because of high RPD values on some metals that were not improved by re-analyzing the same digest. The RPD values for most analytes in the second digest were improved.
Analytes from the 1999 sampling event with RPD failures included individual AI, Fe, Li, Mn, and total uranium. The high RPD samples from segment 1 of cores 259 and 260 were not re-run because a second acid digest had been performed on the segment. Two Li samples from other segments that had RPDs greater than 20 percent were re-run, with little changes in the results. High RPD values were reported from the 1998 event ICP analyses for one AI and two Si results. The RPD failures were attributed to sample inhomogeneity and no reanalyses were requested. It was suggested that leaching of the glass during the digestion process could have caused the high RPDs for the Si samples.
Matrix spike recoveries outside of the 75 % to 125 % control limits (Benar 1997) were reported for the AI, Mn, and Na results from the 1998 sampling event ICP analyses. This was attributed to the high concentration of these analytes in the samples with respect to the amount of spike standard added. A post-digestion spike analysis and serial dilutions were performed with results within the required limits. High matrix spike recoveries were also reported from the 1999 sampling event (Bell 1999) for some Al, Cr, Fe, Mn, Na, and s i results from the ICP analyses. Post-digestion spike recoveries and serial dilutions for each of the samples were acceptable, with one exception. One serial dilution result for Si (S99T001117) differed by more than 10 percent from the sample result at 24.5 percent. The matrix spike recovery from this sample was 99.64 percent.
Standard recoveries associated with eight Na samples from the 1999 analyses were over 120 percent. These standard recoveries were within the laboratory control limits and were negligible compared to
10
HNF-SD-WM-ER-718, Rev. 1 the sample concentrations. All Si standard recoveries for the 1999 sampling event were outside the limits of 80% to 120%. The laboratory upper and lower control limits are much wider than the standard recovery limits because Si may be leached from glassware and/or lost as insoluble silicates or gaseous silicon tetrafluoride.
The preparation blanks for the 1999 ICP analysis showed AI, Fe, Na, Ni, and Si results above the detection level. The levels of these analytes in the preparation blank are inconsequential when compared to the results for the samples.
A small amount of contamination was detected in some preparation blanks while radionuclide analyses were performed. Detections occurred for the 1998 analyses of total uranium, total beta, and 90Sr. Contamination was noted in the 1999 preparation blanks for total alpha, total beta, "Sr, and 137Cs. It was determined for each of these preparation blanks that the level of contamination was insignificant when compared to the sample results, and does not affect the usability of the data.
High RPDs were reported for two of the fourteen subsamples submitted in 1998 for ugMPu analysis. The results were near the detection limit, and the high RPDs were attributed to the resulting decrease in the precision of the analysis.
Five total alpha samples, two '"Cs samples, and one 239R40Pu sample from the 1999 analyses had high RPDs. The samples were re-run with little improvement. The RPD from one "'Am sample taken in 1999 was just above the 20 percent limit (McCain 1998), at 20.1 percent. The sample was not re-run since the RPD for the sample '"Cs analysis was 10.7 percent.
A 1998 total alpha spike recovery was reported outside the required range. However, it was within the laboratory statistical control limits for the quality control (QC) standard, and no reanalysis was requested.
The core 260 composite percent water analyses yielded a higher percentage water measured than for any of the segments from which it was made. The same was true for the core 259 composite, with the exception of segment sample S99TOO1006. Preparing the core composites required additional sample handling compared to the other samples. It was suggested that the saltcake was hydroscopic and absorbed moisture from the atmosphere during this handling (Bell 1999).
No bulk density analyses were performed on the 1999 samples. The hardness of the sludge samples and the large crystalline nature of the saltcake samples were judged as incapable of yielding accurate bulk density measurements. Specific gravity measurements were made on selected samples as substitutes for bulk density values. The bulk density analysis was not performed on core 236, segment 2, lower half solids, taken in 1998, due to insufficient sample recovery.
Hydrostatic Head Fluid (HHF) with lithium bromide tracer was used in the 1998 push core sampling event with an additional 30 to 40 gallons used to wash down the drill string in each riser. The use of HHF in the 1998 sampling event is the source of the lithium and bromide detected in the upper segments of both 1999 cores and the 1999 core composite samples. There were no drainable liquids found in the core samples. The 1999 bromide results above the detection limits were reviewed and only the results in core 260 segment 1 reflect an HHF intrusion of greater than 10 percent of the TGA based on possible dilution of the solids from HHF used in 1998 (Hulse 2000). The HHF intrusion was below 50 percent and should not affect the validity of the core 260 segment 1 data.
11
HNF-SD-WM-ER-718, Rev. 1
Vapor data generated from Oregon Graduate Institute of Science and Technology (OGIST) and from Oak Ridge National Laboratories (ORNL) for tank 241-TX-118 should be considered secondary data. A WHC-approved quality assurance project plan was not in place at the time OGIST and ORNL were analyzing vapor samples from the tank.
Clarification and Explanation of Data Tables and Figures
Description of Tank Standard Report: The total waste volume of 1,083 kL (286 kgal) shown in this standard report does not agree with the Hanlon (2000) volume. The total waste volume was adjusted to reflect a recent ENRAF surface level reading for the tank. The waste phase volumes also differ between the standard report and Hanlon (2000) report. The drainable liquid volume in the standard report reflects the absence of liquid from the tank core sampling events. The standard report sludge volume was calculated from the average core extrusion results from both sampling events. The tank saltcake volume was derived by subtracting the sludge volume from the total tank volume. More information on the volume estimates is available in question #7. The updated volumes will be reflected in a future revision to Hanlon (2000).
Analytical Results and Sample Analysis Summary Standard Reports: Two core composites were created using solids from the 1999 sampling event. For core 259, the solid composite results listed are from the homogenization of approximately seven grams of material from each of the five segments, with the exception of segment 2. Core 259 segment 2 was divided into upper and lower halves, and each of these subsegments contributed seven grams of material to the core composite. The solid composite results listed for core 260 are from the homogenization of approximately twelve grams of material from each of the four segments recovered from the sampling event.
The 241-lX-118 Means and Confidence Intervals Standard Report: The means for each data set are listed separately in the 241-lX-118 Means and Confidence Intervals Standard Report. Immediately preceding each Tank 241-EX-118 95 Percent Wo-Sided Confidence Interval for the Mean Concentration table is a discussion of the method used to derive those means. The solids sample portion mentioned in the first paragraph of the discussion immediately preceding the Tank 241-lX-118 95 Percent Wo-Sided Confidence Interval for the Mean Concentration for Solid Core Composite Data refers to data generated from core 259 and core 260 composites. The solids sample portion mentioned in the first paragraph of the discussion immediately preceding the Tank 241-EX-118 95 Percent Wo-Sided Confidence Interval for the Mean Concentration for Solid Saltcake refers to data generated from core 259, segments three, four, five, and the lower half of segment two; core 260, segments two, three, and four; and the lower half of segment two for core 236. The solids sample portion mentioned in the first paragraph of the discussion immediately preceding the Tank 241-lX-118 95 Percent Wo-Sided Cor@dence Interval for the Mean Concentration for Solid Sludge refers to data generated from core 236, segment one and the upper half of segment two; core 259, segment one and the upper half of segment two; and core 260, segment one.
The 241-EX-I18 HTCE Sugkce Levels Standard Report: The data point for the year 1977 is suspect (Brevick et al. 1997, there is no explanation for the liquid surface level dropping below the solids level at that time. The 1982 liquid surface level drop below the solids level shown in the diagram was because of the saltwell pumping of the liquid waste to interim stabilize the tank. The diagram
12
HNF-SD-WM-ER-718, Rev. 1 shows the tank service start date as occurring in 1952. This date does not agree with the service date of 1951 reported in the Waste Status and Transaction Records Summary (Agnew et al. 1997b).
Unique Aspects of the Tank
Question 6: What are unique chemical, physical, historical, operational or other characteristics of this tank or its contents?
The Z Plant waste layer at the top of tank 241-TX-118 is unique in the tank farms. Two tanks, tank 241-SY-102 as well as tank 241-TX-118, received the Z Plant waste that was generated during two different time periods. However, the tanks were active feed tanks for differing evaporator campaigns. The Z Plant waste sent to tank 241-SY-102 was combined with precipitated salt accumulations from prior 242-S evaporator additions while the Z Plant waste sent to tank 241-TX-118 was co-mingled with SMMT2 saltcake (Agnew et al. 1997a).
The photographs of the tank 241-TX-118 interior taken December 19, 1979, show the waste surface as an opaque, tan to brown liquid. A large percentage of the liquid volume estimated as the tank inventory was pumped to tank 241-SY-102 in 1982, therefore the photographs from 1979 are not representative of the present appearance of the tank interior and its contents. As of March 14, 2000, the tank contained 21 kgal(79 kL) of sludge and 265 kgal(1,004 kL) of saltcake. No drainable liquid was retrieved during sampling events for the tank.
Based upon visual observations of the extrusion photographs, the waste in segment 1 of cores 236, 259 and 260 is a dry, dark brown or black sludge. The waste then transitions to a yellow or yellow-gray saltcake with varying moisture through the segments 2, 3 and 4 of the cores. Finally, core 259, segment 5, was a light-green dry salt.
I
Best-Basis Inventory Derivation
Question 7: What is the source data used to derive this tank's Best-Basis inventories by mass (kg) and activity (Ci) for the standard list of 25 chemicals and 46 radionuclides?
The Best-Basis Inventory (BBI) effort involves developing and maintaining waste tank inventories comprising 25 chemical and 46 radionuclide components in the 177 Hanford Site underground storage tanks. These best-basis inventories provide waste composition data necessary as part of the River Protection Program (WP) process flowsheet modeling work, safety analyses, risk assessments, and system design for waste retrieval, treatment, and disposal operations.
Development and maintenance of the best-basis inventory is an on-going effort. Since new sample data were recently made available for single-shell tank 241-TX-118, a re-evaluation of the best-basis inventories was performed and is documented in the following text. The following information was used in this evaluation:
0
236, 259, and 260) reviewed in February 2000 (see Means and Variances Standard Report). Tank 241-TX-118 statistical means based on the 1998 and 1999 core samples (cores
13
HNF-SD-WM-ER-718, Rev. 1 0
inventory estimate (Agnew et al. 1997a).
0
241-TX-118 TLM and SMM plutonium isotope ratios.
e
Hanford Defined Waste (HDW) model single-shell tank 241-TX-118 TLM sludge
Process knowledge combining sample data and HDW model single-shell tank
Best Basis Inventory combined T2/HDW template for saltcake solids waste.
The following table represents how the available data were used to derive best-basis inventories for tank 241-TX-118.
Table 7-1. Tank 24
-+ Saltcake
Total Tank
Mean concentrations for I 1.55 g/mL I 79 kL sludge segment solids (21 kgal) HDW model TLM solids I 1.73 g/mL composite inventory I I estimate Tank process knowledge I 1.55 glmL - calcuiated BBI Plutoniim concentrations Mean concentrations for 1.79 glmL 1,004 w. saltcake segment solids (265 kgal) T2 saltcake solids 1.67 g/mL template concentrations
1.083 kL I (286 bat)
The waste phase and waste type designations for Table 7-1 were based on core sampling extrusion results (see Core Profile Standard Report), analyte concentrations, and process history. The extrusions from cores 236 and 259 showed a dry sludge in segment one and the upper half of segment two, and an intermittently moist and dry saltcake as the waste phase in the rest of the segments. Core 260 showed a dry sludge in the first segment, and an intermittently moist and dry saltcake as the waste phase in the rest of the segments. The insoluble constituent concentrations supported the division between the two waste phases observed during extrusion. The waste type of salt-contaminated Z Plant waste was assigned to the sludge layer in tank 241-TX-118 based on the waste that was received from 1973 through 1976 (Agnew et al. 1997b). The sludge phase is on top of saltcake that is primarily SMMW waste generated from the 242-T evaporator from 1955 to 1965 (Agnew et al. 1997b).
The tank inventories were calculated from 1998 and 1999 core combined means, as no changes to the waste between sampling events were expected. Inventories of the sludge phase were calculated using sample solids means from the segments observed as sludge in the extrusion results. These are cores 236 and 259 segments 1 and upper half of segment 2, and core 260 segment 1. Inventories for
14
HNF-SD-WM-ER-718, Rev. 1 the saltcake phase are comprised of means from the remaining data, from core 236 segment 2, lower half, core 259 segments 2, lower half, through segment 5, and core 260 segments 2 through 4.
A drainable liquid volume is usually associated with tank waste. However, since tank 241-TX-118 was declared inactive in 1980, a saltwell pumping event removed most of the drainable liquid, and no liquid was recovered during the sampling events in 1998 and 1999. Therefore, for the purpose of the BBI, no separate liquid waste phase was assessed.
Sample data are available for all 25 best-basis nonradioactive chemicals, but not all radionuclide data are available. A process knowledge vector (Calculated BBI Pu Concentrations) was created to represent the zJ9Pu, uoPu, ='Pu, and "*Pu concentrations as they were calculated from the sludge sample vector *39mPu value. The HDW (Agnew et al. 1997a) Tank Layer Model (TLM) %:uoPu ratio for tank 241-TX-118 was applied to the sludge sample vector u9'uoPu value to determine the 239Pu and uoPu process knowledge values. The HDW tank Supernatant Mixing Model (SMM) ratios between 239Pu and ='Pu and uzPu were then used to calculate the =lPu and -'Pu process knowledge values. The HDW model (Agnew et al. 1997a) tank TLM solids inventory values wsre used for comparison or where sample data and process knowledge vector values were not available for the sludge phase.
The T2 saltcake solids template values were used for constituents not well represented in the saltcake sample vector. Templates are based on sampling data from tanks that contain the same waste type as tank 241-TX-118, supplemented with Hanford Defined Waste (HDW) model data. A multiplier is used to scale the template vector to the sample data using the sample weight percent water (44.9 percent) and density (1.79). A more detailed description of template data is found in Tran (1999).
The sludge density value (1.55 g/mL) and saltcake density value (1.79 g/mL) were derived from the mean specific gravity of the corresponding segments. The HDW model (Agnew et al. 1997a) tank TLM solids density was 1.73 g/mL. The "2 saltcake solids template density was 1.67 g/mL. The calculated BBI Pu concentration process knowledge vector assumes the sludge sample vector density (1.55 g/mL), as the values for the process knowledge vector were calculated from sample data.
The total tank volume of 1083 kL (286 kgal) was a calculated volume from the March 13,2000 ENRAF measurement. The ENRAF measurement also corresponds well with the volume reported in Agnew et al. (1997b), 1079 kL (285 kgal), following the 1982 saltwell pumping event. The total tank volume of 1083 kL (286 kgal), along with the updated phase and waste type volumes, will be reflected in a future Hanlon report update.
The tank 241-TX-118 sludge volume, 79 kL (21 kgal), was calculated from the core extrusion results. The three cores were taken from two separate risers, and the estimated heights of the sludge waste recovered from each individual core were averaged to represent the sludge waste height for the tank. The tank saltcake volume was derived by subtracting the sludge volume from the total tank volume.
Sample data were preferred for the BBI constituents in the sludge and saltcake phases, where available. However, when the sludge sample mean value for a constituent was below the detection limit and the HDW model (Agnew et al. 1997) TLM value was lower than the detection limit, or when no sample value was available, the HDW model TLM value was selected. The calculated BBI Pu concentrations process knowledge vector values were selected in the sludge phase, if available, as
15
"F-SD-WM-ER-718, Rev. 1 they were calculated from the sludge sample vector u91uloPu value. When the saltcake sample mean value for a constituent was below the detection limit and the T2 saltcake template value was lower than the detection limit, or when no sample value was available, the T2 saltcake template value was selected. All sample values in the BBI inventory were from acid digest where a choice existed between acid and water digest for the analyses, since water digest analyses were only performed on limited segments.
All inventory calculations were performed using the Best-Basis Inventory Maintenance (BBIM) Tool. The updated best-basis inventory values for tank 241-TX-118 can be found in the Best-Basis Inventory (Non-Radionuclides) and Best Basis Inventory (Radionuclides) Standard Reports.
16
HNF-SD-WM-ER-718, Rev. 1
Reference List
Adams, M. R., 1999, River Protection Process Engineering Desk Instruction and Guidance Manual, HNF-SD-WM-PROC-021, Rev. 3, Lockheed Martin Hanford Corp., Richland, Washington.
Agnew, S. F., J. Boyer, R. A. Corbin, T. B. Duran, J. R. Fitzpatrick, K. A. Jurgensen, T. P. Ortiz, and B. L. Young, 1997a, Hanford Tank Chemical and Radionuclide Inventories: HDWModel Rev. 4, LA-UR-96-3860, Los Alamos National Laboratory, Los Alamos, New Mexico.
Agnew, S. F., R. A. Corbin, T. B. Duran, K. A. Jurgensen, T. P. Ortiz, and B. L. Young, 19!97b, Waste Status and Transaction Records Summary (WSTRS) , Rev. 4, LA-UR-97-3 11, Rev. 0, Los Alamos National Laboratory, Los Alamos, New Mexico.
Bell, K. E., 1999, Tank 241-TX-118, Final Report for Rotary-Mode Core Samples 259 and 260, HNF-1681, Rev. 0, Fluor Daniel Hanford, Inc., Richland, WA.
Benar, C. J., 1997, Tank241-TX-118 Push Mode Core Sampling andAnalysis Plan, HNF-SD-WM-TSAP-123, Rev. 1, Lockheed Martin Hanford Corp. for Fluor Daniel Hanford, Inc., Richland, Washington.
Brevick, C., H., J. L. Stroup, and J. W. Funk, 1997, Historical Tank Content Estimate for the Northwest Quadrant of the Hanford 200 West Area, HNF-SD-WM-ER-351, Rev. 1, Fluor Daniel Hanford, Inc., Richland, Washington.
Christensen, W. R., 1978, Partial Neutralization, (Internal memorandum to D. G. Harlow, February 27), Rockwell International, Richland, Washington.
Dukelow, G. T., J. W. Hunt, H. Babad, and J. E. Meacham, 1995, Tank Safety Screening Data Quality Objective, WHC-SD-WM-SP-004, Rev. 2, Westinghouse Hanford Company, Richland, Washington.
Esch, R. A., 1998, Tank 241-TX-118, Core 236 Analytical Results for the Final Report, HNF-1651, Rev. 0, Waste Management of Hanford, Inc., Richland, Washington.
Hanlon, B. M., 2000, Waste Tank Summary Report for Month Ending January 31, 2000, HNF-EP-0182-142, CH2M HILL Hanford Group, Inc., Richland, Washington.
Huckaby, J. L., and D. R. Bratzel, 1995, Tank 241-lX-118 Headspace Gas and Vapor Characterization Results for Samples Collected in September 1994 and December 1994, WHC-SD-WM-ER-449, Rev. 1 A, Westinghouse Hanford Company, Richland, Washington.
Hulse, N. L., 2000, Disposition of "See Caveat-Awaiting Action" Review Status Comments for Tank 241-TX-118, (Memorandum to R.A. Bechtold, March 13), CH2M HILL Hanford Group, Inc., Richland, Washington.
17
"F-SD-WM-ER-718, Rev. 1 Kirkbride, R. A., G. K. Allen, R. M. Orme, R. S. Wittman, J. H. Baldwin, T. W. Crawford, J. Jo,
L. J. Fergestrom, T. M. Hohl, and D. L. Penwell , 1999, Tank Waste Remediation System Operation and Utilization Plan, HNF-SD-WM-SP-012, Rev. 1, Numatec Hanford Corporation, Richland, Washington.
Kummerer, M., 1995, Heat Removal Characteristics of Waste Storage Tanks, WHC-SD-WM-SARR-010, Rev. 1, Westinghouse Hanford Company, Richland, Washington.
Kupfer, M. J., W. W. Schulz and J. T. Slankas, 1995, Strategy for Sampling Hanford Site Tank Wastes for Development of Disposal Technology, WHC-S-WM-TA-154, Rev. 1, Westinghouse Hanford Company, Richland, Washington.
Lipke, E. J., 1999, Above Average Sample in 241-TX-118, (Internal memorandum 74F00-EJL-99028 to N. L. Hulse, October 1 l), Lockheed Martin Hanford Corp. for Fluor Daniel Hanford, Inc., Richland, Washington.
McCain, D. J., 1998, Tank 241-TX-118 Rotary Mode Core Sampling andAnalysis Plan, HNF-SD-WM-TSAP-123, Rev lA, Lockheed Martin Hanford Corp. for Fluor Daniel Hanford, Inc., Richland, Washington.
Meacham, J. E., W. L. Cowley, A. B. Webb, N. W. Kirch, J. A. Lechelt, D. A. Reynolds, L. A. Stauffer, D. B. Bechtold, D. M. Camaioni, F. G o , R. T. Hallen, P. G. H a l e r , J. L. Huckaby, R. D. Scheele, C. S . Simmons, J. J. Toth, L. M. Stock, 1998, Organic Complexant Topical Report, HNF-3588, Rev. 0, Duke Engineering and Services Hanford, Inc., for Fluor Daniel Hanford Corporation, Richland, Washington.
Noorani, Y.G., 1999, Tank Waste Remediation System Basis for Interim Operations, HNF-SD-WM-BIO-001, Rev. lC, Flour Daniel Hanford, Inc., Richland, Washington.
Owendoff, J. M., 1998, Approval to Close the Organic Complexant Safety Issue and Remove 18 Organic Complexant Tanks from the Watchlist, (Memorandum to J . Wagoner, December 9). U. S. Department of Energy, Washington, D. C.
Schreiber, R. D., 1991, Memorandum of Understanding for the Organic Complexant Sqfety Issue Data Requirements, HNF-SD-WM-RD-060, Rev. 0, Lockheed Martin Hanford Corp. for Fluor Daniel Hanford, Inc., Richland, Washington.
Simpson, B. C., and D. J, McCain, 1997, Historical Model Evaluation Data Requirements, HNF-SD-WM-DQO-018, Rev. 2, Lockheed Martin Hanford Corp. for Fluor Daniel Hanford, Inc., Richland, Washington.
Slankas, J. T., W. D. Berman, B. F. Campbell, M. J. Kupfer, D. J. McCain, W. W. Schulz, B. C. Simpson, and C. E. Whipple, 1995, Data Needs and Attendant Data Quality Objectbes for Tank Waste Pretreatment and Disposal, WHC-SD-WM-DQO-022, Rev. 0, Westinghouse Hanford Company, Richland, Washington.
18
HNF-SD-WM-ER-718, Rev. 1 Ran, T. T., 1999, Review and Approval of Fiscal Year 2000 Waste o p e Templates for Deriving
Best Basis Inventories, (internal memorandum 74B20-99-044 to J. G. Field, November 22), Lockheed Martin Hanford Cop., Richland, Washington.
19
![DH-SD8A840WA-HNF...| DH-SD8A840WA-HNF Certifications Certifications CE: EN55032/EN55024/EN50130-4 FCC: Part15 subpartB,ANSI C63.4- 2014 Port Video Interface 1 port(BNC, 1.0V[p-p],](https://static.fdocuments.us/doc/165x107/607906da58a56461d371c91a/dh-sd8a840wa-hnf-dh-sd8a840wa-hnf-certifications-certifications-ce-en55032en55024en50130-4.jpg)