3 rd Quarter 2002 Results Presentation
23
3 3 rd rd Quarter 2002 Quarter 2002 Results Results Presentation Presentation A member of the Li & Fung (Retailing) Group A member of the Li & Fung (Retailing) Group CRA Website: www.cr-asia.com CRA Website: www.cr-asia.com 31 October 2002 31 October 2002
-
Upload
hamilton-tanner -
Category
Documents
-
view
37 -
download
3
description
3 rd Quarter 2002 Results Presentation. CRA Website: www.cr-asia.com 31 October 2002. A member of the Li & Fung (Retailing) Group. Hong Kong Retail Value Change Year-on-Year % Change. * Source – HKSAR Census and Statistics Department. 3 rd Quarter 2002 Results Presentation Agenda. - PowerPoint PPT Presentation
Transcript of 3 rd Quarter 2002 Results Presentation

33rdrd Quarter 2002 Results Quarter 2002 ResultsPresentationPresentation
A member of the Li & Fung (Retailing) GroupA member of the Li & Fung (Retailing) Group CRA Website: www.cr-asia.comCRA Website: www.cr-asia.com31 October 200231 October 2002

Hong Kong Retail Value ChangeHong Kong Retail Value ChangeYear-on-Year % ChangeYear-on-Year % Change
-8.1%
3.8%
-1.2%
-4.2%
-12%
-10%
-8%
-6%
-4%
-2%
0%
2%
4%
6%
1999 2000 2001 Aug YTD 2002
* Source – HKSAR Census and Statistics Department* Source – HKSAR Census and Statistics Department

33rdrd Quarter 2002 Results Presentation Quarter 2002 Results PresentationAgendaAgenda
33rdrd Quarter 2002 Financial Results Highlights Quarter 2002 Financial Results Highlights
Update & 2002 OutlookUpdate & 2002 Outlook
Questions & AnswersQuestions & Answers

33rdrd Quarter 2002 Financial Results Highlights Quarter 2002 Financial Results HighlightsGroup Turnover 3Group Turnover 3rdrd Quarter 2002 Quarter 2002
972.9
1,140.7
1,305.1
350.4 366.8
0
500
1,000
1,500
HK
$ M
illio
n
1999 Total 2000 Total 2001 Total 3rd Qtr 2001 3rd Qtr 2002
No. of Store:No. of Store: 114114 123 123 146 146 141 141 157 157
+ 5%+ 5%

318.9
302.3
250
270
290
310
330
350
HK
$ M
illio
n
3rd Qtr 2001 3rd Qtr 2002
33rdrd Quarter 2002 Financial Results Highlights Quarter 2002 Financial Results Highlights121 Stores Comparable Sales121 Stores Comparable Sales
- 5%- 5%
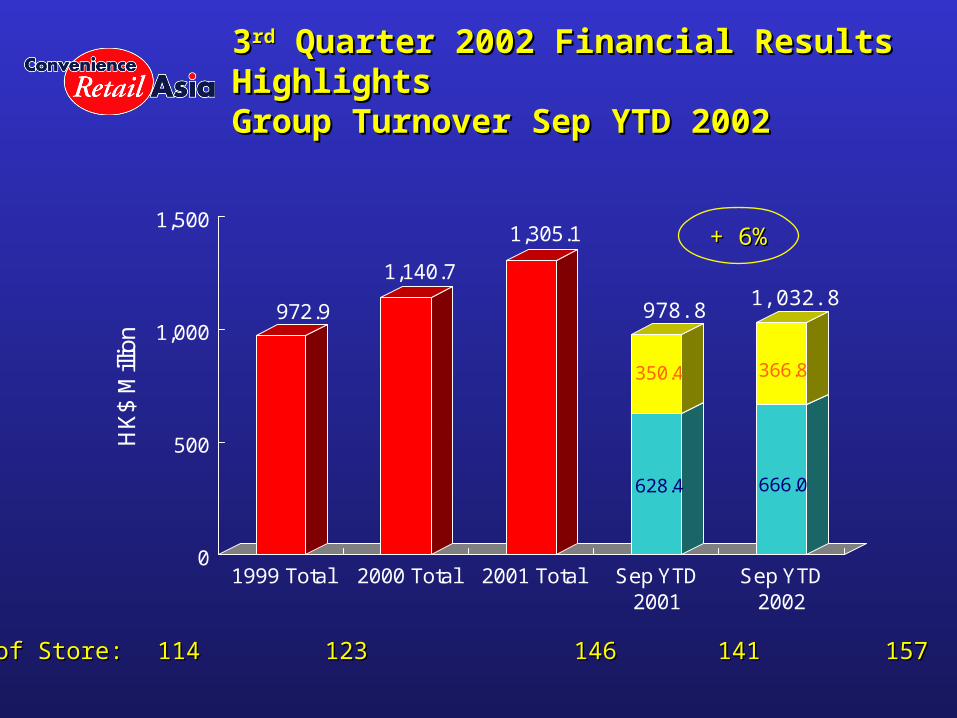
33rdrd Quarter 2002 Financial Results Highlights Quarter 2002 Financial Results HighlightsGroup Turnover Sep YTD 2002Group Turnover Sep YTD 2002
972.9
1,140.7
1,305.1
628.4
350.4
666.0
366.8
0
500
1,000
1,500
HK
$ M
illio
n
1999 Total 2000 Total 2001 Total Sep YTD2001
Sep YTD2002
No. of Store:No. of Store: 114 114 123 123 146 146 141 141 157 157
+ 6%+ 6%
978.81,032.8

33rdrd Quarter 2002 Financial Results Highlights Quarter 2002 Financial Results HighlightsGroup Net Profit – 3Group Net Profit – 3rdrd Quarter 2002 Quarter 2002
6.6
48.1
65.5
20.2 20.8
0
10
20
30
40
50
60
70
80
HK
$ M
illio
n
1999 Total 2000 Total 2001 Total 3rd Qtr 2001 3rd Qtr 2002
+ 3%+ 3%
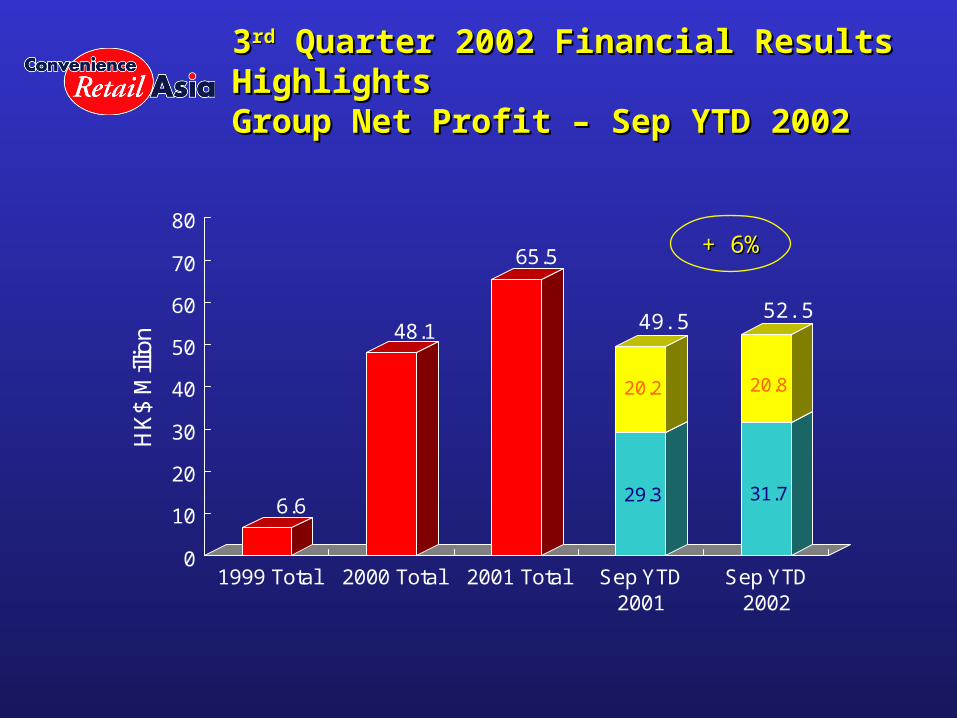
33rdrd Quarter 2002 Financial Results Highlights Quarter 2002 Financial Results HighlightsGroup Net Profit – Sep YTD 2002Group Net Profit – Sep YTD 2002
6.6
48.1
65.5
29.3
20.2
31.7
20.8
0
10
20
30
40
50
60
70
80
HK
$ M
illio
n
1999 Total 2000 Total 2001 Total Sep YTD2001
Sep YTD2002
+ 6%+ 6%
49.5 52.5

33rdrd Quarter 2002 Financial Results Highlights Quarter 2002 Financial Results HighlightsNet Profit as % of Sales – 3Net Profit as % of Sales – 3rdrd Quarter 2002 Quarter 2002
0.7%
4.2%
5.0%
5.8% 5.7%
0%
1%
2%
3%
4%
5%
6%
7%
8%
1999 Total 2000 Total 2001 Total 3rd Qtr 2001 3rd Qtr 2002
- 0.1%- 0.1%

33rdrd Quarter 2002 Financial Results Highlights Quarter 2002 Financial Results HighlightsNet Profit as % of Sales – Sep YTD 2002Net Profit as % of Sales – Sep YTD 2002
0.7%
4.2%
5.0% 5.1% 5.1%
0%
1%
2%
3%
4%
5%
6%
7%
8%
1999 Total 2000 Total 2001 Total Sep YTD2001
Sep YTD2002

33rdrd Quarter 2002 Financial Results Highlights Quarter 2002 Financial Results HighlightsBasic Earnings Per Share – 3Basic Earnings Per Share – 3rdrd Quarter 2002 Quarter 2002
1.3
9.8 10.1
3.1 3.1
0
2
4
6
8
10
12
14
HK
$ C
ents
1999 Total 2000 Total 2001 Total 3rd Qtr 2001 3rd Qtr 2002

33rdrd Quarter 2002 Financial Results Highlights Quarter 2002 Financial Results HighlightsBasic Earnings Per Share – Sep YTD 2002Basic Earnings Per Share – Sep YTD 2002
1.3
9.8 10.1
4.6
3.1
4.8
3.1
0
2
4
6
8
10
12
14
HK
$ C
ents
1999 Total 2000 Total 2001 Total Sep YTD2001
Sep YTD2002
7.7
+ 3%+ 3%
7.9

Why 3Why 3rdrd Quarter 2002 Favorable Results? Quarter 2002 Favorable Results?Higher Gross Margin/Other IncomeHigher Gross Margin/Other Income
30.4%
31.0%
31.6%31.5%
32.3%
30%
31%
32%
33%
1999 Total 2000 Total 2001 Total 3rd Qtr 2001 3rd Qtr 2002
+ 0.8%+ 0.8%

Why 3Why 3rdrd Quarter 2002 Favorable Results? Quarter 2002 Favorable Results?Offset By Higher Expenses as % of SalesOffset By Higher Expenses as % of Sales
Expenses as % of SalesExpenses as % of Sales 2002 vs 20012002 vs 2001
Store Operating ExpensesStore Operating Expenses (0.7%)(0.7%)
HigherHigher
China Start-up ExpensesChina Start-up Expenses (0.1%)(0.1%)
HigherHigher

33rdrd Quarter 2002 Financial Results Highlights Quarter 2002 Financial Results Highlights
33rdrd Qtr 2001 Qtr 2001 33rdrd Qtr 2002 Qtr 2002
Group Turnover (HK$ Million)Group Turnover (HK$ Million) 350.4350.4 366.8366.8 + +
5%5%
Group Net Profit (HK$ Million)Group Net Profit (HK$ Million) 20.220.2 20.820.8 + +
3%3%
Net profit as % of SalesNet profit as % of Sales 5.8%5.8% 5.7%5.7% - -
0.1%0.1%
Basic Earnings Per StoreBasic Earnings Per Store 3.1 Cents3.1 Cents 3.1 Cents3.1 Cents --

Sep YTD 2002 Financial Results HighlightsSep YTD 2002 Financial Results Highlights
Sep YTD 2001Sep YTD 2001 Sep YTD 2002Sep YTD 2002
Group Turnover (HK$ Million)Group Turnover (HK$ Million) 978.8978.8 1,032.81,032.8 + +
6%6%
Group Net Profit (HK$ Million)Group Net Profit (HK$ Million) 49.549.5 52.552.5 + +
6%6%
Net profit as % of SalesNet profit as % of Sales 5.1%5.1% 5.1%5.1% --
Basic Earnings Per StoreBasic Earnings Per Store 7.7 Cents7.7 Cents 7.9 Cents7.9 Cents + +
3%3%

Update & 2002 OutlookUpdate & 2002 Outlook

Update & 2002 OutlookUpdate & 2002 OutlookCircle K Hong KongCircle K Hong Kong
Rising Unemployment, Rising Unemployment,
Continuing Deflation, Continuing Deflation,
Declining Consumer ConfidenceDeclining Consumer Confidence
No Signs of RecoveryNo Signs of Recovery
Tough 4Tough 4thth Quarter 2002 Quarter 2002
-11.8%
7.2%
-3.7% -3.7%
-5.9%-7.7%
-4.1% -4.2%
-15%
-10%
-5%
0%
5%
10%
1/02 2/02 3/02 4/02 5/02 6/02 7/02 8/02
Month
Hong Kong Retail Value ChangeYear-on-year % change
* Source – HKSAR Census and Statistics Department* Source – HKSAR Census and Statistics Department

Update & 2002 OutlookUpdate & 2002 OutlookCircle K Hong Kong – Store GrowthCircle K Hong Kong – Store Growth
Beginning of YearBeginning of Year :: 146146
Opened So FarOpened So Far :: + 11+ 11
Construction in Progress/Construction in Progress/ :: + 8 + 8
Committed LeaseCommitted Lease
Target Store NumberTarget Store Number :: 170170
at End of the Yearat End of the Year

Update & 2002 OutlookUpdate & 2002 OutlookCircle K Hong Kong TacticsCircle K Hong Kong Tactics
Focus on Managing Pricing, Focus on Managing Pricing,
Gross Profit & Controlling Gross Profit & Controlling
ExpensesExpenses
Aggressive & Creative PromotionsAggressive & Creative Promotions
Develop Fast-growth Product Develop Fast-growth Product
Categories – Categories – Food Services, Food Services,
Phone Cards and Store ServicesPhone Cards and Store Services

Update & 2002 OutlookUpdate & 2002 OutlookCircle K ChinaCircle K China
Obtained Business LicenseObtained Business License
11stst Store Ready, Official Opening – Store Ready, Official Opening –
17 November 200217 November 2002
22ndnd Store Under Construction Store Under Construction
Grand Opening – 14 December 2002Grand Opening – 14 December 2002
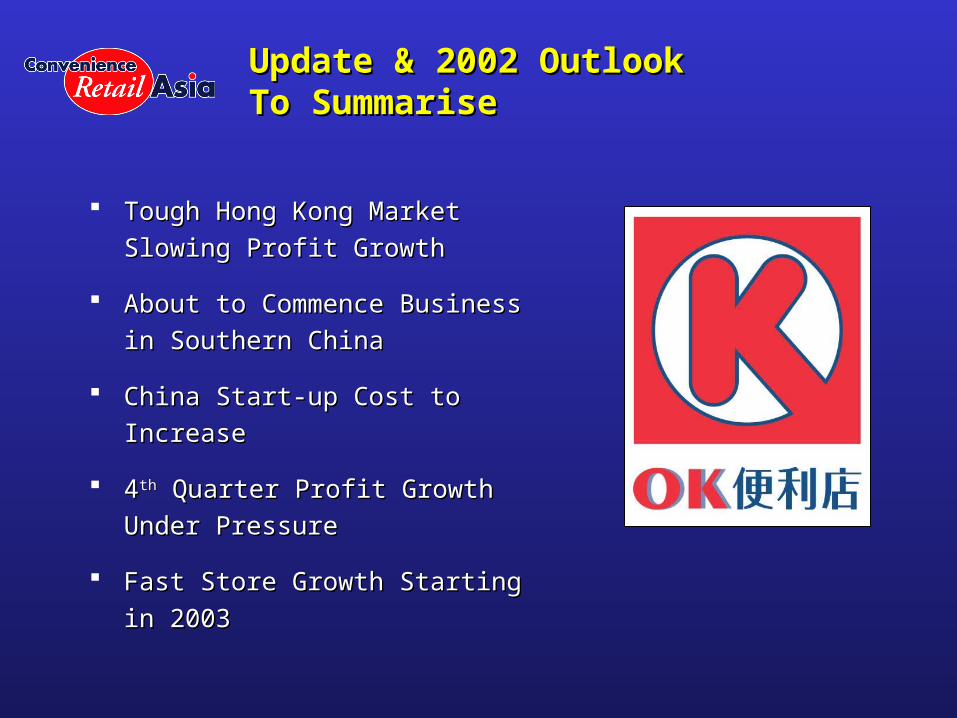
Update & 2002 OutlookUpdate & 2002 OutlookTo SummariseTo Summarise
Tough Hong Kong Market Slowing Tough Hong Kong Market Slowing
Profit GrowthProfit Growth
About to Commence Business in About to Commence Business in
Southern ChinaSouthern China
China Start-up Cost to IncreaseChina Start-up Cost to Increase
44thth Quarter Profit Growth Under Quarter Profit Growth Under
PressurePressure
Fast Store Growth Starting in 2003Fast Store Growth Starting in 2003

Convenience Retail Asia LimitedConvenience Retail Asia Limited
Best Under A BillionBest Under A Billion200 Companies200 Companies
for 2002for 2002
HKRMA 2002HKRMA 2002Service & CourtesyService & Courtesy
AwardAward
SuperbrandsSuperbrandsHong Kong 2002Hong Kong 2002