3 - - • Quarterly Reviewminneapolisfed.org/research/qr/qr2521.pdf · Quarterly Review articles...
29
Federal Reserve Bank of Minneapolis 3 - - • wm % % Spring 2001 Quarterly Review Competition at Work: Railroads vs. Monopoly in the U.S. Shipping Industry (p. 3) Thomas J. Holmes James A. Schmitz, Jr.
Transcript of 3 - - • Quarterly Reviewminneapolisfed.org/research/qr/qr2521.pdf · Quarterly Review articles...

Federal Reserve Bank of Minneapolis
3 - - • wm % %
Spring 2001 Quarterly Review
Competition at Work: Railroads vs. Monopoly in the U.S. Shipping Industry (p. 3) Thomas J. Holmes James A. Schmitz, Jr.

Federal Reserve Bank of Minneapolis
Quarterly Review vol 25, no. 2 ISSN 0271 -528-7
This publication primarily presents economic research aimed at improving policymaking by the Federal Reserve System and other governmental authorities.
Any views expressed herein are those of the authors and not necessarily those of the Federal Reserve Bank of Minneapolis or the Federal Reserve System.
Editor: Arthur J. Rolnick Associate Editors: Patrick J. Kehoe, Warren E. Weber
Economic Advisory Board: Peter J. Klenow, Edward C. Prescott Managing Editor: Kathleen S. Rolfe
Article Editor: Kathleen S. Rolfe Production Editor: Jenni C. Schoppers
Designer: Phil Swenson Typesetter: Mary E. Anomalay
Circulation Assistant: Elaine R. Reed
The Quarterly Review is published by the Research Department of the Federal Reserve Bank of Minneapolis. Subscriptions are available free of charge.
Quarterly Review articles that are reprints or revisions of papers published elsewhere may not be reprinted without the written permission of the original publisher. All other Quarterly Review articles may be reprinted without charge. If you reprint an article, please fully credit the source—the Minneapolis Federal Reserve Bank as well as the Quarterly Review—and include with the reprint a version of the standard Federal Reserve disclaimer (italicized above). Also, please send one copy of any publication that includes a reprint to the Minneapolis Fed Research Department.
Electronic files of Quarterly Review articles are available through the Minneapolis Fed's home page on the World Wide Web: http://www.minneapolisfed.org.
Comments and questions about the Quarterly Review may be sent to
Quarterly Review Research Department Federal Reserve Bank of Minneapolis P. O. Box 291 Minneapolis, Minnesota 55480-0291 (Phone 612-204-6455 / Fax 612-204-5515).
Subscription requests may also be sent to the circulation assistant at [email protected]; editorial comments and questions, to the managing editor at [email protected].
Federal Reserve Bank of Minneapolis Quarterly Review Spring 2001
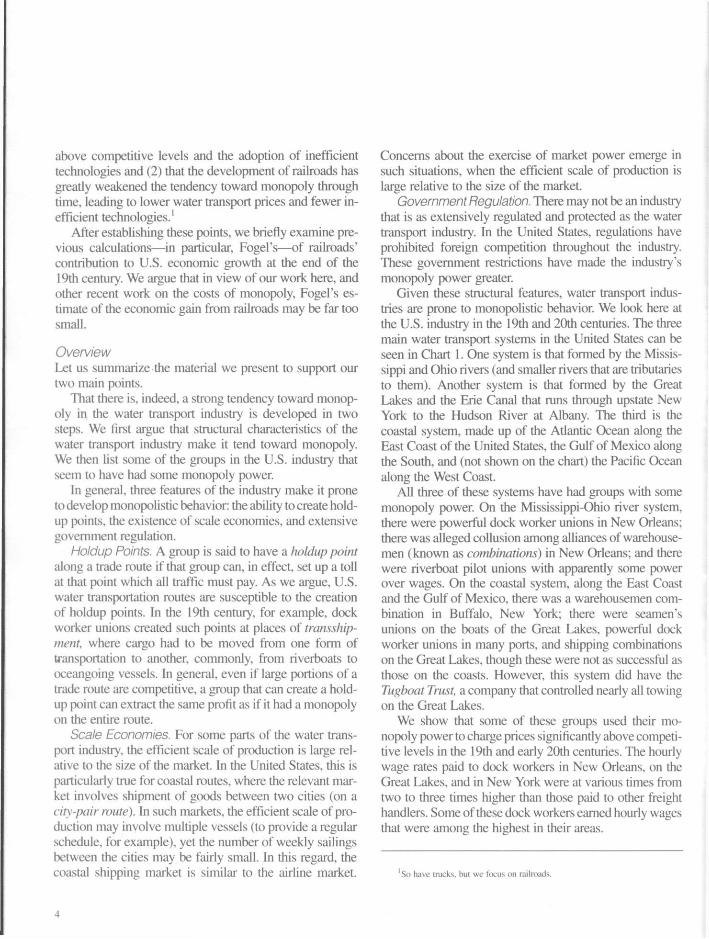
Competition at Work: Railroads vs. Monopoly in the U.S. Shipping Industry*
Thomas J. Holmes Visiting Scholar •Research Department Federal Reserve Bank of Minneapolis and Professor of Economics University of Minnesota
James A. Schmitz, Jr. Senior Economist Research Department Federal Reserve Bank of Minneapolis
By their nature, water transportation industries are often subject to monopolization. In some places, for example, geography produces ports through which all water traffic must flow. If groups can take control of those ports, they can charge traffic exorbitant rates. Because of this natural tendency toward monopoly, water shipment prices often are higher than they would be if the water transport industries were competitive. Also, though not generally recognized, the monopolistic tendency often leads to the adoption of inefficient technologies in these industries, as, for example, strong unions of dock workers put restric-tions on the use of particular equipment in their work.
Within the United States, for much of the nation's early history, the water transportation industry has had another force pushing toward monopoly: a lack of alternatives. Be-fore around 1840—and long after, in some parts of the country—water was the only affordable form of long-dis-tance transportation. Goods could be moved by wagon, but only at great cost. With no other good alternatives, and a natural tendency toward monopoly in the water transpor-tation industry, long-distance transportation in the United States often exhibited a great deal of monopolistic behav-ior.
Over the last 150 years or so, this behavior has been greatly reduced by the development of long-distance trans-portation alternatives to water—first trains and then trucks. The competition of railroads, especially, has led to lower long-distance transport prices and fewer inefficient trans-portation technologies in the United States.
Surprisingly, the huge literature that has quantified and debated the gains to the U.S. economy from the devel-opment of railroads has ignored this contribution of re-ducing the tendency toward monopoly in long-distance transportation. Fogel (1964), who pioneered the quantita-tive assessment of railroads' contribution to U.S. econom-ic growth, and virtually all the research following his, has assumed that if railroads had not been developed, the ex-isting long-distance transportation industry would have been competitive. It would not have been. The methods of these researchers thus fail to capture the gains from com-petition, of the lowering of prices and the dropping of in-efficient technologies, spurred by the railroads. And the resulting quantitative estimates from these studies thus are likely to significantly understate the gains from the devel-opment of railroads.
The main purpose of this article is to demonstrate com-petition at work in the long-distance transportation indus-try. We primarily establish two things: (1) that there is a strong tendency toward monopoly in the water transport industry which is evident in the United States in both the 19th and 20th centuries and which has resulted in prices
*The authors thank Kathy Rolfe for editorial assistance that has significantly im-proved the article; the librarians in the Research Department of the Federal Reserve Bank of Minneapolis—particularly Terry Maroney—for tracking down many historical documents; and Ben Bridgman for excellent research assistance. The authors also thank Pete Klenow, Ed Prescott, and Art Rolnick, who read several drafts and made many valuable comments. Finally, they thank Rody Manuelli and Bob Lucas for their com-ments.
3
above competitive levels and the adoption of inefficient technologies and (2) that the development of railroads has greatly weakened the tendency toward monopoly through time, leading to lower water transport prices and fewer in-efficient technologies.1
After establishing these points, we briefly examine pre-vious calculations—in particular, Fogel's—of railroads' contribution to U.S. economic growth at the end of the 19th century. We argue that in view of our work here, and other recent work on the costs of monopoly, Fogel's es-timate of the economic gain from railroads may be far too small.
Overview Let us summarize the material we present to support our two main points.
That there is, indeed, a strong tendency toward monop-oly in the water transport industry is developed in two steps. We first argue that structural characteristics of the water transport industry make it tend toward monopoly. We then list some of the groups in the U.S. industry that seem to have had some monopoly power.
In general, three features of the industry make it prone to develop monopolistic behavior: the ability to create hold-up points, the existence of scale economies, and extensive government regulation.
Holdup Points. A group is said to have a holdup point along a trade route if that group can, in effect, set up a toll at that point which all traffic must pay. As we argue, U.S. water transportation routes are susceptible to the creation of holdup points. In the 19th century, for example, dock worker unions created such points at places of transship-ment, where cargo had to be moved from one form of transportation to another, commonly, from riverboats to oceangoing vessels. In general, even if large portions of a trade route are competitive, a group that can create a hold-up point can extract the same profit as if it had a monopoly on the entire route.
Scale Economies. For some parts of the water trans-port industry, the efficient scale of production is large rel-ative to the size of the market. In the United States, this is particularly true for coastal routes, where the relevant mar-ket involves shipment of goods between two cities (on a city-pair route). In such markets, the efficient scale of pro-duction may involve multiple vessels (to provide a regular schedule, for example), yet the number of weekly sailings between the cities may be fairly small. In this regard, the coastal shipping market is similar to the airline market.
Concerns about the exercise of market power emerge in such situations, when the efficient scale of production is large relative to the size of the market.
Government Regulation. There may not be an industry that is as extensively regulated and protected as the water transport industry. In the United States, regulations have prohibited foreign competition throughout the industry. These government restrictions have made the industry's monopoly power greater.
Given these structural features, water transport indus-tries are prone to monopolistic behavior. We look here at the U.S. industry in the 19th and 20th centuries. The three main water transport systems in the United States can be seen in Chart 1. One system is that formed by the Missis-sippi and Ohio rivers (and smaller rivers that are tributaries to them). Another system is that formed by the Great Lakes and the Erie Canal that runs through upstate New York to the Hudson River at Albany. The third is the coastal system, made up of the Atlantic Ocean along the East Coast of the United States, the Gulf of Mexico along the South, and (not shown on the chart) the Pacific Ocean along the West Coast.
All three of these systems have had groups with some monopoly power. On the Mississippi-Ohio river system, there were powerful dock worker unions in New Orleans; there was alleged collusion among alliances of warehouse-men (known as combinations) in New Orleans; and there were riverboat pilot unions with apparently some power over wages. On the coastal system, along the East Coast and the Gulf of Mexico, there was a warehousemen com-bination in Buffalo, New York; there were seamen's unions on the boats of the Great Lakes, powerful dock worker unions in many ports, and shipping combinations on the Great Lakes, though these were not as successful as those on the coasts. However, this system did have the Tugboat Trust, a company that controlled nearly all towing on the Great Lakes.
We show that some of these groups used their mo-nopoly power to charge prices significantly above competi-tive levels in the 19th and early 20th centuries. The hourly wage rates paid to dock workers in New Orleans, on the Great Lakes, and in New York were at various times from two to three times higher than those paid to other freight handlers. Some of these dock workers earned hourly wages that were among the highest in their areas.
1 So have trucks, but we focus on railroads.
4

Thomas J. Holmes, James A. Schmitz, Jr. Competition at Work
Chart 1 The Three Main U.S. Water Transportation Systems
This suggests that these dock jobs were very valuable to the workers, and this is borne out by the initiation fees charged to enter the dock worker unions. For example, the fee to enter the cotton screwmen's union (a union of dock workers who stowed, or screwed, cotton into the holds of ships) in New Orleans in 1884 was $50. On the Great Lakes, the most common (modal) initiation fee for long-shoremen's locals in the early 20th century was $50. These initiation fees are extremely high by historical standards. It would have taken approximately from 7 to 10 times longer for a worker (working at the unskilled wages of the time) to earn these dock initiation fees than to earn the mid-20th century modal initiation fee (of $50) for unions in the American Federation of Labor (AFL).
The monopoly power of dock worker unions during this period was quantitatively significant in the sense that it raised the overall water transportation price a significant amount. For example, the monopoly profit earned by longshoring unions in New Orleans (that is, their actual earnings less the earnings of similarly skilled workers) in the mid-1880s amounted to roughly 20-30 percent of to-tal transport charges on cotton (longshoring charges plus steamship freight charges) from New Orleans to New York.
We also show that some of the groups with monopoly power in the U.S. water transport industry chose to use in-efficient technologies. That a monopolist will choose an inefficient technology is certainly an unconventional idea, but it is one with theoretical and factual support, which we
5
discuss below. Moreover, we present evidence that dock worker unions clearly chose to use inefficient technologies. For example, dock worker unions in New Orleans and on the Pacific Coast had work rules that limited the use of equipment. Other union work rules resulted in "a waste of energy and hard work," according to the head of the Pa-cific Coast longshoremen's union, testifying to the U.S. Congress (quoted in Ferguson 1961). After this Pacific Coast union was formed in 1934, new work rules signifi-cantly slowed the pace of work. Labor productivity (tons loaded and unloaded per hour) fell dramatically.
The development of railroads in the 19th century great-ly reduced this tendency toward monopoly in the water transport industry. U.S. water transportation systems were susceptible to the creation of holdup points. But the power at such points was also susceptible to being greatly reduced by railroads. Take the example of shipping cotton grown near the Mississippi River, in Louisiana, to New York. Be-fore railroads, if dock worker unions raised wages in New Orleans, so that the coastal route to New York became more expensive, the only other option for cotton growers was to go up the Mississippi to the Erie Canal. With the development of railroads, many more options became available. Now the cotton could be transported overland to other ports on the Gulf of Mexico—say, Galveston, Texas, or Mobile, Alabama—and then shipped to New York. Without the railroads, this was not economical because of the extremely high cost of wagon transportation. More-over, with railroads, the cotton didn't have to go to any port at all. It could simply be taken overland to New York.
We present evidence that this ability of railroads to divert traffic to different ports or directly overland greatly reduced monopoly power in ports, leading to lower water transport prices and fewer inefficient technologies in the industry.
First, we discuss prices. We describe examples of how competition from railroads helped lower the wages of dock workers and the fees of combinations. The examples come from all the major water transport systems and both the 19th and 20th centuries.
• By about 1880, railroads began diverting water traffic from New Orleans in a significant way. Strong pres-sure was put on dock union wages. From 1885 to 1905, the wages of unionized cotton screwmen in New Orleans fell as much as 20 percent while general wages in that area were increasing.
• Late in the 19th century, railroads running from Bal-timore (and Philadelphia) to Chicago were diverting
traffic from the Erie Canal, and that competition led Buffalo warehousemen to reduce their charges.
• Early in the 20th century, railroads diverting traffic clearly broke strikes of dock workers in New Orleans, in Boston, and on the Pacific Coast, thus preventing these workers from increasing their wages.
• And in the early 1960s, in recognition of the railroad competition that U.S. coastal shipping faced, long-shoremen on the U.S. East Coast agreed to charge coastal water traffic up to one-quarter of what the longshoremen charged foreign traffic.
Second, we show that railroad competition led to the dropping of inefficient technologies in the water transport industry. Some dock worker unions in New Orleans changed their work rules over the period 1885-1905 so as to increase the pace of work 20 percent. Some unions also dropped work rules which required unskilled work to be done by skilled workers. Tendencies Toward Monopoly In this section, we argue that there are generally strong ten-dencies toward monopoly in water transportation systems. The first part of this section focuses on structural features of the industry that make it ripe for monopoly. The second part itemizes various groups in the industry in the United States in the 19th and 20th centuries that the evidence sug-gests had some monopoly power. Susceptibility Here we discuss three features of the water transport in-dustry that generally make it tend toward monopolistic be-havior: the ability to create holdup points, the existence of scale economies, and extensive government regulation.
• Holdup Points A holdup point is a simple concept. Suppose goods are shipped between points A and B such as in Chart 2. In the chart, there are several routes from A to B. But there are some points, such as point H, through which all cargo must pass. We say that there is a holdup point at H if a group is able to capture this point and charge everyone who passes through it a fee, or toll. Everyone trying to travel from A to B, that is, has no choice but to pay the group in order to do so.
Let us call the set of all routes between two points A and B that go through point H the H-system of routes. In Chart 2, of course, all routes belong to the //-system. How-ever, one can imagine drawing an arc that goes from A to B but lies everywhere below the routes on the chart and
6
Thomas J. Holmes, James A. Schmitz, Jr. Competition at Work
Chart 2 The Geometry of Holdup Points
Alternative Routes From A\oB
Point
has no point in common with them other than A and B. This route would not be part of the //-system of routes.
Suppose there is a holdup point at H, but the rest of the //-system is competitive; that is, there are no other holdup points, and prices charged to use vessels are set at marginal cost. Using arguments from the industrial organization literature, we can see, straightforwardly, that the profit-maximizing toll revenue at H is the same as what the mo-nopoly profit would be if the entire //-system were monop-olized. This follows the standard argument that when there is a monopoly over one input and the technology is Leon-tief with respect to other inputs, the monopolist has no in-centive to vertically integrate into the other inputs (Carlton and Perloff 1990). The technology of getting from A to B here is a fixed-coefficient one, since for every unit trans-ported from A to B, one unit needs to go through H.
Two characteristics of U.S. water transportation systems in the period we are studying made them susceptible to groups creating holdup points along them. First, for nearly all commodities, either there was only one relevant system on which to ship goods, as in Chart 2, or there were just two systems. In other words, for many products, there was little competition between systems. Second, along these systems, there were natural holdup points at points of transshipment, again, places where cargo is moved from one mode of transport to another, for example, from a riverboat to an oceangoing ship. The location of transship-ment points is determined by geography—where a river hits an ocean, such as at New Orleans, or where a canal hits a lake, such as at Buffalo.
Consider the example of shipping cotton grown near the Mississippi River, in Louisiana, to New York. In most
circumstances, before railroads arrived, the relevant route involved shipping the cotton a relatively short distance down the Mississippi River and then on through the Gulf of Mexico and up the East Coast to New York. Along this route, there was a natural holdup point in New Orleans, where the cotton had to be transferred from a riverboat to an oceangoing vessel. If workers could successfully union-ize the docks at New Orleans, they could create a holdup point. If a single firm or a small group could buy up Jhe docks at the port, it could create a holdup point. Besides that, as an intermediate stage of the transshipment process, goods were often transferred to warehouses. If a group could monopolize the warehouses in New Orleans, that group, too, could create a holdup point.
If groups began to turn New Orleans into a holdup point and started raising prices, then cotton growers, of course, had the option of using other water transportation systems that did not include New Orleans. But these options were limited: There was only one other water system from the middle of the country to the East Coast, the system that included the Erie Canal. For a cotton grower in Louisiana, therefore, costs in New Orleans would have had to get very high before the system through the Erie Canal would look attractive.
For other goods, like grain grown in Ohio, the two sys-tems were better substitutes. But even here there were only two water transport systems, the one including New Or-leans and the one with the Erie Canal. If one group were to set,up a holdup point in New Orleans and another group were to set up a holdup point in Buffalo, there would be a duopoly situation (in which two transshipment points com-peted).2
If grain was to move north by the water system that included the Great Lakes and the Erie Canal, then Buffalo was a natural holdup point. How about the possibilities of holdups in originating ports on the Great Lakes, like Chicago? The transshipment point at Chicago was not unavoidable like that at, say, New Orleans. If groups in Chicago attempted to charge too much, there were other options: Milwaukee, Toledo, and Cleveland.
But delivering grain to another port instead of Chicago may not have been a great option. Again, without rail-
2If a series of canals running from Chicago to New York, Philadelphia, and so on could have been built, just like a series of railroads were built from the East to the West in the United States, then there would have been more water transport systems and less chance of holdup points being created. But there were significant problems for canal traffic crossing the Appalachian and other mountains, and such a series of canals may not have been much of an option.
7

roads, diverting traffic from one port to another could be extremely expensive. Moreover, if groups could organize throughout the Great Lakes ports, there would be no es-caping them. Some groups did organize throughout these ports. For example, one group, the Tugboat Trust, con-trolled most of the towing services throughout the Great Lakes. Also, the longshoremen's union organized most of the docks on the lakes. According to Hoagland (1917, p. 104), "by 1899 almost every man working on the Lake Erie docks was a member of that organization" (the Inter-national Longshoremen's Association). Since some of these groups were organized throughout the Great Lakes ports and diverting traffic without railroads could be ex-pensive, the possibility of holdup points in Chicago and other originating ports was significant.
• Scale Economies Another feature of the water transport industry also gives it potential to be monopolistic: the efficient scale of pro-duction in this industry is sometimes large relative to the size of the market. When this sort of situation exists, ship-ping companies can charge rates above competitive levels. We argue that this situation did exist in some parts of the U.S. water transport industry in the 19th and 20th centu-ries.
This situation particularly applied on the coastal routes. Here the relevant market was the shipment of a wide range of goods between two cities (again, a city-pair route)? As we shall see, many city-pair routes were relatively small markets. Some of those markets had only a few sailings per week.
There are also reasons to think that the efficient scale of production in coastal shipping was large. It is reasonable to think that this activity might require multiple vessels. Con-sumers of transportation services value a regular schedule of departures and a variety of departure times. Having a large scale of operation makes these features possible.
In coastal routes, then, the efficient scale of production was probably large relative to the market.4 Most individual markets (city-pair routes) would be served by a single steamship line. We demonstrate this point in Table 1, which lists the steamship lines operating in 1881 between Baltimore and other ports along the East Coast. The table shows that each market (that is, Baltimore and the other city of the pair) was served by only one line, except New York, which was served by two. Moreover, most of these lines had multiple steamships in service; for example, sev-en operated between Baltimore and Norfolk. Note also that the number of trips between city-pairs each month varies
widely, from 5 to 60. But about half of the city-pairs had 10 or fewer monthly trips. This means that ships sailed between those city-pairs less often than three times a week. This pattern is consistent with the view that the scale of entry in this industry is large relative to the market.
The historical coastal shipping market likely shares many similarities with today's airline industry. In the air-line industry, many city-pairs are served by a single carrier, and some think that this market power is exploited by the airlines. • Regulation Still another feature of the water transport industry that makes it strongly conducive to a monopolistic tendency is the high degree of government regulation it generally has had. In most countries throughout the world, the water transport industry is extensively regulated and protected by the government.
This feature of the industry is, of course, unlike the oth-er two: it is not a primitive feature of the technology as are holdup points and scale economies. But government reg-ulation is such a striking feature and plays such a signif-icant role in the industry that it needs to be acknowledged. The U.S. regulations we now describe have been in force in varying degrees since the nation was founded; they have thus been a more or less permanent fixture of the indus-try's environment, albeit one that was chosen in the polit-ical forum and not by nature.
We discuss just three types of laws that have protected this industry in the United States. First, laws have prohib-ited any foreign ships from shipping between any two U.S. ports; foreign competition on domestic routes has been out-lawed. Second, U.S. shipping companies have been re-quired to purchase ships from U.S. shipbuilders; foreign competition in shipbuilding has been outlawed. And third, U.S. shipping companies have had to hire U.S. citizens to fill a portion of their crews;5 foreign competition for many jobs has been outlawed.
3On a river route, a boat goes right past every city along the route. This makes de-fining markets hard, since a boat on a route from St. Paul, Minnesota, to New Orleans goes right by St. Louis and so in some sense is in the St. Paul-St. Louis market as well. But along a coast, cities can be deep in a bay or upriver. So a steamship on a route from New York to Norfolk could stop at Baltimore or Philadelphia, but doing that would take the ship substantially out of its way.
4This was not the situation everywhere in this industry. On the Erie Canal, the ef-ficient scale of production was small relative to the size of the market. This business could be entered with a single barge. The market primarily was the shipment of grain from Buffalo to Albany. Massive amounts of grain moved over this route, so the size of the market was large relative to the scale of efficient production.
5 All officers had to be U.S. citizens, for example.
8

Thomas J. Holmes, James A. Schmitz, Jr. Competition at Work
Table 1 Suggestive Evidence of Scale Economies in U.S. Coastal Shipping Steamship Lines Operating Between Baltimore and Other Ports Along the U.S. East Coast in 1881
The Market: Between Baltimore, Md., and This City Lines Serving Each Port
Number of Steamships
Monthly Arrivals and Departures
Northern Ports Boston, Mass. Merchants and Miners 12* 8 Providence, R.I. Merchants and Miners 12* 8 New York, N.Y. Merchants and Miners
New York and Baltimore 12* 7
8 30
Philadelphia, Penn. Baltimore and Philadelphia 6 30
Chesapeake Bay Ports Havre de Grace, Md. Baltimore and Susquehanna 2 30 Chestertown, Md. Chester River 2 30 Annapolis, Md. Eastern Shore 7 50 Patuxent River, Md. Weems 4 20 Alexandria, Va., and Washington, D.C. Potomac 1 10 York River, Va. Richmond, York River 5 45
Southern Ports Norfolk, Va. Baltimore Steam Packet 7 60 Roanoke River, N.C. Baltimore and Roanoke 4 5 New Berne, N.C. New Berne 3 10 Charleston, S.C. Merchants 3 6 Savannah, Ga. Merchants and Miners 12* 6
*The Merchants and Miners Transportation Company used 12 steamships between Baltimore and the four ports it served from there. Source: U.S. Treasury Department 1881, pp. 116-17
Given the technological considerations that made the water transport industry ripe for monopoly, government restrictions on foreign competition contributed significant-ly to the monopolistic character of this industry. As men-tioned, scale economies were particularly likely to be sub-stantial in coastal trade. By outlawing foreign ships on this system, the monopoly problem was exacerbated. That for-
eign firms could not sell ships in the United States tended to increase the power of any groups in the domestic ship-building industry with monopolistic tendencies. We have not explored the structure of the domestic shipbuilding industry in detail, but it had unions in the 19th century (Heinrich 1997).6 That U.S. shipping firms could not hire totally foreign crews tended to increase the power of any seamen's unions in the domestic shipping industry. Groups We have seen that there are structural features of the wa-ter transport industry that push it toward monopoly. Now we describe two types of groups in the U.S. industry that seem to have had some monopoly power: unions and combinations. We also briefly discuss the U.S. history of these groups. • Unions Some unions of laborers in the water transport industry seem to have had significant power to influence their wa-ges and working conditions in the United States in both the 19th and 20th centuries.
Dock Workers. Strikes of dock workers in New York date from.at least 1836 (Barnes 1915, p. 93).
Dock worker unions in New Orleans date from at least 1850 (Arnesen 1991, p. 21). These unions wielded signifi-cant power throughout most of the period from the U.S. Civil War to the early 20th century, as the evidence below indicates. After the 1881 dock worker strike, the mayor of Ne\v Orleans observed that the strike's success demon-strated the "weakness of the power of the state when a few labor organizations could do as they pleased, and set at defiance law and order, and stop the business of such a large city as New Orleans" (quoted in Arnesen 1991, p. 72). The unions involved in the movement of cotton were particularly strong. A Chicago newspaper observed that "no such a monopoly ever existed before" (quoted in Arnesen 1987, p. 142).
Dock worker unions on the Great Lakes date from at least 1870 (Commons 1905, p. 60). Late in the 19th cen-tury, these unions appear to have had substantial power, as the evidence below indicates.
Riverboat Pilots. The United States had unions of river-boat pilots as early as 1841 (Hunter 1949, p. 468). There is as yet no hard evidence about the extent to which such
These unions were not particularly strong (and may have weakened throughout the latter part of the 19th century), but that may well have been because of the new competition from railroads, which cut the demand for new ships.
9
unions were able to raise wages above competitive levels. However, some claimed during the 1850s that the riverboat pilots, who were empowered to certify new pilots under the Steamboat Inspection Act of 1852, were refusing to certify new pilots, thereby significantly increasing the wages of existing pilots (Hunter 1949, p. 471-72).
Seamen. Unions on the vessels of the Great Lakes (as opposed to on the docks there) date from at least 1854 (Hoagland 1917, p. 32). On the Great Lakes, the unions of workers on boats during the latter part of the 19th century do not seem to have been as successful as those on the docks. Seamen unions were vigorously resisted by employ-er groups. Late in the 19th century, there was much vio-lence between employers and union supporters. Some of these unions achieved closed shop status. • Combinations Another type of group in the U.S. water transport industry also seems to have had significant power to influence pric-es in this industry: combinations. These are alliances of in-dividuals or companies which teamed up in order to better achieve their common ends. We discuss first warehouse-men combinations, then shipping line combinations.
Warehousemen. Some observers at the time thought that warehousemen in Chicago, Buffalo, and New Orleans had some market power in the 19th century. (See, for example, Veblen's 1892 discussion, some of which we re-view later.)
By the 1890s, the power of warehousemen in New Or-leans was a subject of great concern among merchants in that city. Their business had declined as cotton shipments were diverted in large numbers away from the port of New Orleans. In discussing the reasons for the decline, Hester (1896, p. 4) describes the effects of both the power of labor unions in the city to set their own wages and work rules (which we alluded to above) and the agreements among warehousemen there to follow similar pricing policies:
By far the most serious impediments have been the labor problem and [cotton] press and warehouse combination. These were actually strangling the local cotton trade. For a long time it was simply a question of "stand and deliver." Certain fixed charges and rules were determined on, and each and every bale consigned to a New Orleans merchant must abide by them. Expediency was not considered; the cotton must stand the tax, or, if not, go elsewhere for a market or be shipped "through." The labor question reached a point in 1895 culminating in serious disturbances on the levee front, the troubles curtailing the gross movement of cotton that season about 500,000 bales. The result has been, however, to clear the atmosphere in that respect, and con-
ditions are now more favorable than they have been for many years. The press and warehouse combination has con-tinued in existence up to the present time. While its opera-tions have been injurious to New Orleans, and while its charges have been potent factors in restricting the local trade, it would not be just to set upon its members the seal of con-demnation. The real fault lay in existing conditions, of which they avail themselves to secure the best possible returns for the capital invested. They did what any and all merchants in any city or section would have done.
Hester seems to know about holdup points. Shipping Lines. Off the dock, combinations and col-
lusive practices in ocean shipping were common through-out the world in both the 19th and 20th centuries (McGee 1961). This was true of U.S. ocean shipping as well.
The Gulf of Mexico had a lot of collusive activity among steamship fines. Baughman reports it there both be-fore and after the U.S. Civil War (1968a, p. 137; 1968b). According to Baughman (1968b, pp. 374-75), "in 1878 the Morgan and Mallory lines signed the first of a series of secret agreements equilibrating New York and New Or-leans sea rates to Texas. Henceforth, they abandoned rate cutting as a competitive tactic at sea—except against third parties."
Early in the 20th century, the U.S. Congress appointed a commission to investigate combinations and collusive practices in the entire U.S. domestic and foreign trade. This group was known as the Alexander Commission. After studying the U.S. domestic coastal trade, this commission (U.S. Congress 1914, p. 421) concluded that "competition in rates between domestic water lines . . . has been . . . effectively eliminated."
The Alexander Commission's report cites several fac-tors to support that conclusion. Concentration of owner-ship of shipping lines was very high.7 Not only that, but
7The Alexander Commission (U.S. Congress 1914) reported that around 1913, of all the steamers and tonnage employed in the Atlantic and Gulf coast trades by regular lines (that is, excluding the steamers of some "very small and purely local lines"), the Eastern Steamboat Corporation owned 11.3 percent of the steamers and 10 percent of the tonnage and the Atlantic, Gulf & West Indies Steamship Lines owned 18.2 percent of the steamers and 22 percent of the tonnage. These two steamship lines, therefore, owned about one-third of the tonnage. The rest of the tonnage was owned by railroads.
While the commission's report does not provide a complete breakdown of railroad holdings of steamships, a few points can be made. The Morgan steamship line, owned by the Southern Pacific Co. (a railroad), owned 9 percent of the steamers and 17 percent of the tonnage (U.S. Congress 1914, pp. 389-90). The New York, New Haven & Hartford R.R. Co. owned many steamship lines. One was the Merchants & Miners Transportation Co., which owned 11 percent of the steamers and 12 percent of the ton-nage.
Hence, based on just the partial data available, the two steamship line combina-tions, together with these two railroads, the Southern Pacific and the New York, New Haven & Hartford, owned at least 60 percent of the steamship tonnage. More likely, they owned much more than that.
10

Thomas J. Holmes, James A. Schmitz, Jr. Competition at Work
the few existing lines stayed out of each other's way. Ac-cording to the commission, there was only one regular water carrier between New York and the ports of Portland (Maine), Boston, Philadelphia, Baltimore, Norfolk, Wil-mington, Charleston, Savannah, Jacksonville, and New Or-leans. The commission (p. 370) reported that "Galveston is the only important Gulf port which has two services from New York—the Mallory and Morgan irnes—but these . . . work in absolute harmony."8
The few big lines that operated in the U.S. coastal trade also had methods of working together to crush new en-trants, the Alexander Commission reported. One method was the use of "fighting ships" (U.S. Congress 1914, p. 393). If a new steamship line attempted to enter a route, the established lines, or combinations, would add steam-ships to that route, called fighting ships, which had only one purpose: to drive the new entrant from the market. Sometimes the established combinations would move even before entry had occurred. For example, the commission reports (p. 393) that "Mr. F. S. Groves stated that at about the time of the organization of his line [the Philadelphia & Gulf Line] the Southern Steamship Co., operating between Philadelphia and Tampa, promptly advertised the extension of its service to New Orleans, and through this act was instrumental in stopping subscriptions to the stock of the Philadelphia & Gulf Line."9
The Alexander Commission also studied collusive prac-tices on the Great Lakes. In most Great Lakes shipping markets, the extent of these practices seems to have been less than on the coastal routes. In one market, however, it may have been greater. According to the commission (U.S. Congress 1914, p. 340), "the Great Lakes Towing Com-pany controls exclusively the towing of all the Lake Erie ports of any importance and also that of Chicago, South Chicago, Gary, Duluth and the Soo." Formed in 1899, the Great Lakes Towing Company, commonly called the Tug-boat Trust, was found to be in violation of the Sherman Antitrust Act in 1910.
Effects of Monopoly In this section, we first present evidence that some of the groups listed above were able to use their monopoly power to raise prices above competitive levels in both the 19th and 20th centuries. We then show that the use of that power translated into huge markups on costs at transship-ment points, which added significantly to the total costs of transportation. Finally, we present evidence that monopoly power in the water transport industry also led to the adop-tion of inefficient technology.
High Prices Here we show that a major component of shipping costs, the price of labor, was affected by the monopoly power of unions. We show that hourly wages earned by dock work-ers in New Orleans, in New York, and on the Great Lakes were significantly higher than competitive wages would have been. We do this by comparing the wages of dock workers to those of workers in the same area, at the same time, who did jobs of comparable skill. • Dock Wages in New Orleans... We first compare the wages of union dock workers in New Orleans in 1904-5 to those of other unionized workers in New Orleans, including those in the railroad industry. We then compare union dock worker wages to wages of work-ers in manufacturing establishments in New Orleans. The conclusion is that in 1904-5, the dock workers earned sub-stantial premiums over the earnings of most of these work-ers and had some of the highest hourly wage rates of all such workers in New Orleans.10
The Report of the Bureau of Statistics of Labor for Lou-isiana—1904-05 (Lee 1906) lists the agreements reached between various employer groups and unions in New Orleans in 1904-5. We display the hourly wage rates in some of those agreements in Chart 3." Clearly, the freight handlers on the docks received substantially more than railroad freight handlers. The cotton screwmen (who re-ceived 560 per hour) were skilled workers. But the other types of dock freight handlers arguably were not skilled. Yet longshoremen received from two to three times their railroad counterparts (between 400 and 500 vs. between 160 and 200).
The teamsters (or drivers) on the docks also received high wages relative to other unionized teamsters. The dray-men—who hauled goods by cart, or dray—received 300 an hour; the coal wheelers, 400 an hour. These wages are from one and a half to two times larger than those of the unionized teamsters in the carriage industry (200) and the beer industry (210).
While railroad worker unions were particularly weak compared to dock worker unions, the chart suggests they
8This pattern of one shipping line serving a city-pair is also consistent with our argument that scale of entry in this industry was large relative to the market.
9The Southern Steamship Co. was part of the Atlantic, Gulf & West Indies Steam-ship Lines combination.
10Below we show, with more limited data, that dock worker wage premiums in New Orleans were even greater 20 years earlier.
11 For Chart 3 and several of the other quantitative charts and tables, we have com-piled some detailed notes. These are available on request.
11

Chart 3 Dock Workers Were Paid More Than Most Other Workers in New Orleans Hourly Wage Rates (Cents) in Union Agreements and in Manufacturing Establishments, 1904-5
Freight Handlers-UNION
Dock -Teamsters Machinists UNION MFG. UNION
Machine Shops
Rail 39
MFG. — Engineers UNION MFG.
Building Beer Trades 33 33
Inside Outside
Source: Lee 1906
were not weak compared to other unions. Machinists in the railroad unions received about what machinists received in a union agreement with the machine shops (340 vs. 330 for inside work and vs. 390 for outside).12
With wages between 400 and 500 an hour, the long-shoremen earned more than some of the unionized workers in skilled trades: union agreements signed in 1904-5 put the wages of engineers at 330 and, again, those of machin-ists between 330 and 390.
We next compare the wages of dock workers in New Orleans to those in manufacturing establishments in New Orleans (reported in Lee 1906). Averages for some types of these workers are also displayed in Chart 3. We do not know how many of these manufacturing workers were unionized. These data seem to tell the same story as those from union agreements.
Teamsters on the docks did very well compared to teamsters who drove for manufacturing establishments. While teamsters on New Orleans docks earned 300-400 an hour, hourly wages for teamsters in manufacturing av-eraged 190.13
The hourly pay for general help and laborers in manu-facturing (not shown on the chart) averaged 150 an hour. At 400-500 an hour, the wages of longshoremen, who may arguably be classified as unskilled, were significantly above the wages of unskilled workers in other industries.
The longshoremen (and, hence, the screwmen) on the docks also earned more than many of the skilled workers in manufacturing establishments. For example, longshore-men earned more than machinists and engineers in manu-facturing, who both earned 290 an hour on average.
In summary, the hourly wage rates paid to New Orleans dock workers in 1904-5 were substantially higher than those paid to freight handlers, teamsters, and unskilled la-bor in other industries, the jobs that were closest to most of
12Dock workers did not earn more than all unionized workers. For .example, the Louisiana report (Lee 1906) lists wages of an hour for plumbers and 150 an hour for bricklayers.
13This average is calculated as an unweighted arithmetic average across sub-industries in the manufacturing sector. The averages below are also calculated as un-weighted arithmetic averages.
12

Thomas J. Holmes, James A. Schmitz, Jr. Competition at Work
Chart 4 . . . And Elsewhere Hourly Wage Rates (Cents) of Freight Handlers in Dock, Railroad, and Lumber Industries in New York and on the Great Lakes in the 19th and 20th Centuries
1890s
-New York-1874
Dock 40
Rail 17.5
I
Dock Lumber Shovers
50
General Laborers
12 1 4
n
-Great Lakes-
Lumber Loaders
50
Early 1900s Dock
Iron Longshoremen Shovelers
60 60 55
Rail 20
(range) (range) I I
(range)
Sources: Commons 1905, pp. 66, 73; Barnes 1915, p. 96; Kleven 1941, pp. 453-54
the dock worker jobs. They were also higher than skilled wage jobs like machinists and engineers. • ... And Elsewhere The New Orleans wage differences existed elsewhere in the U.S. water transport industry too. Dock worker wages were also substantially higher than the wages of other freight handlers and unskilled workers in New York and on the Great Lakes. In Chart 4, we display some of the wages in these areas.
Barnes (1915) reports that in 1874, longshoremen in New York were paid 400 an hour, and those in rail yards 17.50 an hour. Barnes (1915, p. 96) mentions this in the context that the longshoremen wages were about to be attacked by employers. The longshoremen, he says, "re-ceived 40 cents for day work, 80 cents for night work, and $1.00 for Sundays. When work was steady there was the possibility of large earnings. Why, it was asked [by New York merchants], should the price for handling cargo freight be so high when railroad freight was handled at the rate of 17 1/2 cents an hour."
Kleven (1941, p. 454) states that unionized dock work-ers on the Great Lakes who loaded lumber onto boats (whom he calls "shovers") earned 500 an hour through the 1890s and into the 20th century. He also discusses the wage of "common laborers" in the lumber industry and argues that it ranged from 120 to 140 an hour. The shovers obviously earned a substantial premium over unskilled la-bor.
Discussing the early 20th century, Commons (1905), too, says that "lumber loaders" (shovers) earned 500 an hour on the docks; he puts the wages of longshoremen handling lumber at 600 an hour and dock iron shoveler wages at 550-600 an hour. Commons says railroad freight handlers earned only 170-200 an hour.
• Union Initiation Fees Dock work was often sporadic and sometimes subject to danger, which might seem to make it less attractive to workers in general. But these jobs were highly valuable to workers, which is clear from the large initiation fees they had to pay to enter the unions.
13

The initiation fees in some of the late 19th century dock worker unions were large measured either by the time required to earn those fees or by historical standards. In Table 2, we present the time required to earn the union in-itiation fees by workers in various occupations. For histor-ical comparison, we also present the time required to earn the fees to enter general labor unions after World War EL
The fee to enter the New Orleans cotton screwmen's union in 1884 was $50. Railroad freight handlers at the time would have had to work about 333 hours to make that much; unskilled workers would have needed 500 hours. Commons (1905) reports a range of fees for longshore-men's locals on the Great Lakes in the early 20th century, but he also puts the modal fee at $50. In this later period, railroad freight handlers would have had to work about 250-90 hours to make enough to join that union, and un-skilled workers would have needed 333 hours. These are substantial fees for a worker to pay to join a union.
These fees are also high by historical standards. Taft (1946) reports a range of fees for AFL unions after World War II and puts the modal fee at $50. At that time, it would have taken a worker approximately 46 and 49 hours working at railroad wages and unskilled wages, respective-ly, to earn this fee. Hence, it would have taken approxi-mately from 7 to 10 times longer for a worker (working at the unskilled wages of the time) to earn these dock ini-tiation fees than to earn the mid-20th century modal fee for AFL unions.
High Transport Costs The evidence above indicates that some groups at trans-shipment points had significant monopoly power. But did this translate into significantly higher costs for the entire water transportation system? Here we argue that it did. • Transshipment Costs We begin by showing that transshipment costs were a big share of total water transportation charges. In Table 3, we present some late 19th century water transportation charg-es, including port charges (for moving cargo between ports and vessels) and freight charges (for moving cargo across water) for two routes: the northern route from Chicago to New York (from the Great Lakes to Buffalo to the Erie Canal) and the southern route from New Orleans to New York (a coastal route). The port charges on the northern route amounted to roughly half the freight charges, 10.50 per bushel vs. 200 per bushel (Lee 1938, p. 173). On the southern route, the port charges were even larger (Hester 1896, p. 4); they were greater than or equal to the freight charges.14
Table 2 U.S. Dock Worker Jobs Were Valuable Approximate Time for Various Workers to Earn $50 Initiation Fee for Dock and AFL Unions in the Late 19th Century and the Early 20th Century
Hours Needed to Earn Fee at
Year Union Railroad Wages Unskilled Wages
1884 Cotton Screwmen 333 500 New Orleans
Early 1900s Longshoremen 250-90 333 Great Lakes
1946 AFL Unions 46 49
Sources: Commons 1905, Kleven 1941, Taft 1946, U.S. Bureau of the Census 1975, Arnesen 1991
In Table 4, we present our own estimates of transship-ment costs on cotton moving from New Orleans to New York in 1885. In contrast to Hester (1896), we want to consider cotton that comes into New Orleans on a river-boat. (Hester considered only cotton coming in on trains.) Also, we will make the calculations for a period 10 years earlier than Hester did, for a time when union wages were higher (and had not yet come under pressure from the railroads).
To do our own calculations, first let's see what type of costs a bale of cotton would incur as it was moved from New Orleans to New York. The charges in the port of New Orleans began at the wharf, where riverboats that had traveled down the Mississippi River were unloaded. The screwmen were paid to unload the boats and the long-shoremen were paid to take the cotton from the screwmen and place it on the wharf.15 Next the cotton was transport-ed from the wharf where the riverboats had landed, per-haps initially to warehouses. These services were provided by the teamsters on the docks, the draymen. Cotton stored
14U.S. Treasury Department 1888 reports a range of steamship freight charges from New Orleans to New York for 1885.
15Though the screwmen's skill was in loading cotton onto vessels, they also had demanded and won the right to unload vessels (even though this was an unskilled job, as we shall see below).
14

Thomas J. Holmes, James A. Schmitz, Jr. Competition at Work
Table 3 Estimates of Water Shipping Charges On Two U.S. Water Routes in the Late 19th Century*
Type of Charge Northern Route: Chicago to New York*:
Cents per Bushel of Grain
Southern Route: New Orleans to New York
Dollars per Bale of Cotton
Port Charges Commissions at Chicago 1.50 Storage in Chicago 2.5 Elevator at Buffalo 2.0 Commissions at Buffalo 1.5 Expenses in New York 3.0
Total Port Charges 10.50
Drayage and Storage for 30 Days $ .35 Extra Storage for 30 Days .10 Compressing .50 Drayaget to Shipside .20 Insurance for 60 Days .24 Screwing into Ship .50 Wharfage, Tarpaulin, etc. .15
Total Port Charges $2.04
Freight Charges To Buffalo
To New York by Canal
Total Freight Charges
6.50 13.5
20.00
To New York
Total Freight Charges
$1.25—$2.00
$1.25-$2.00
* The charges on the northern route are for about 1870; those for the southern route, 1895 (port) and 1885 (freight).
**On the northern route, cargo had other per bushel charges besides: 0.250 for inspection in Chicago and 1.250 for insurance.
t Drayage is work by dock teamsters, or draymen. Sources: U.S. Treasury Department 1888, Hester 1896, Lee 1938
in warehouses was handled by the cotton yardmen. Other dock workers may have had roles.
Lastly, the draymen transferred the cotton to the wharfs where the ocean steamships were located. Then the cotton needed to be loaded onto those steamships. The longshore-men handed the cotton up to the screwmen, who screwed it into the ships. The fueling of the ships was provided by the coal wheelers. The cotton was then steamed to New York.
Though we know that all of these groups had strong unions—that is, the screwmen, the longshoremen, the draymen, the cotton yardmen, the coal wheelers, and others—and we know the hourly wages for many of these groups, at this point we can only approximate the per bale charges for the screwmen and the longshoremen.
These approximate charges in 1885 are displayed in Table 4.16 For loading vessels, the screwmen had a union limit of 75 bales per day per gang. Gangs (of five mem-
bers) were paid $31 a day. At 75 bales, the cost to the shipper of the screwmen's work is, then, 410 a bale. Now, in loading vessels, the longshoremen handed cotton up to the screwmen. We do not know how many longshoremen served the screwmen, though we do know that the long-shoremen were often idle and had as a work rule that they were paid during these idle periods. If one longshoreman served one screwman, then the longshoremen's charge would have been 330 per bale (5 men x 500 per hour x 10 hours = $25 per day, or 330 per bale).
For unloading vessels, we do not know the rate at which the screwmen handed bales down to the longshore-men. But suppose, first, that it was the same as the loading rate, 75 bales per gang per day. Then the screwmen's un-loading charge would have been the same as their loading
16In these calculations, we are using wages of longshoremen and screwmen in the mid-1880s, which are given in Table 6 below.
15
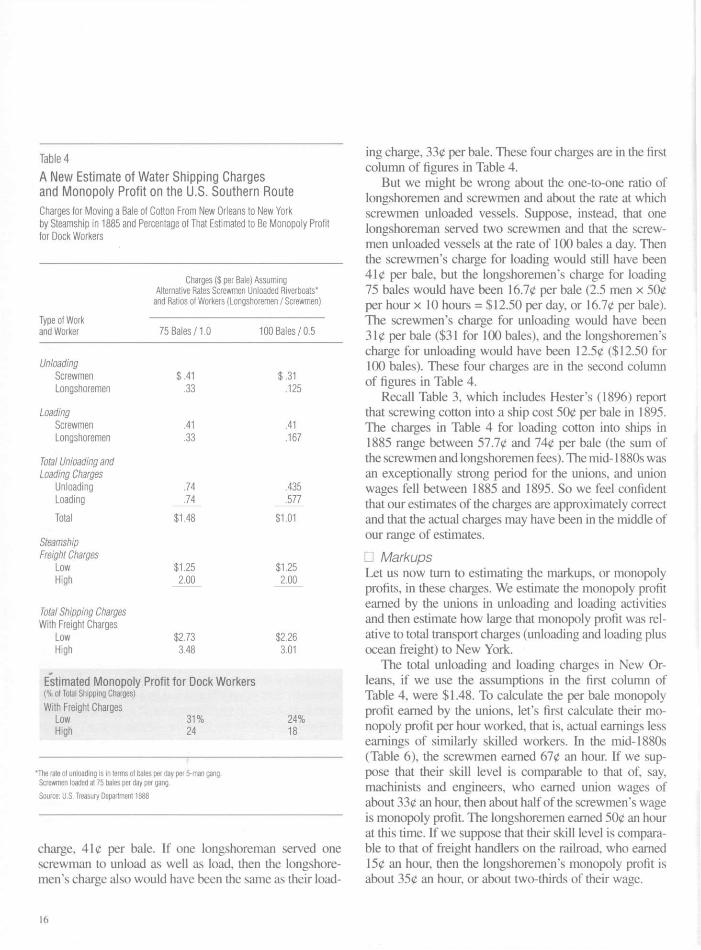
Table 4 A New Estimate of Water Shipping Charges and Monopoly Profit on the U.S. Southern Route Charges for Moving a Bale of Cotton From New Orleans to New York by Steamship in 1885 and Percentage of That Estimated to Be Monopoly Profit for Dock Workers
Charges ($ per Bale) Assuming Alternative Rates Screwmen Unloaded Riverboats*
and Ratios of Workers (Longshoremen / Screwmen)
Type of Work and Worker 75 Bales/1.0 100 Bales/0.5
Unloading Screwmen Longshoremen
Loading Screwmen Longshoremen
Total Unloading and Loading Charges
Unloading Loading Total
Steamship Freight Charges
Low High
Total Shipping Charges With Freight Charges
Low High
$.41 .33
.41
.33
.74
.74 $1.48
$1.25 2.00
$2.73 3.48
.31
.125
.41
.167
.435
.577
Estimated Monopoly Profit for Dock Workers (% of Total Shipping Charges) With Freight Charges
Low 31% High 24
$1.01
$1.25 2.00
$2.26 3.01
24% 18
*The rate of unloading is in terms of bales per day per 5-man gang. Screwmen loaded at 75 bales per day per gang. Source: U.S. Treasury Department 1888
charge, 410 per bale. If one longshoreman served one screwman to unload as well as load, then the longshore-men's charge also would have been the same as their load-
ing charge, 330 per bale. These four charges are in the first column of figures in Table 4.
But we might be wrong about the one-to-one ratio of longshoremen and screwmen and about the rate at which screwmen unloaded vessels. Suppose, instead, that one longshoreman served two screwmen and that the screw-men unloaded vessels at the rate of 100 bales a day. Then the screwmen's charge for loading would still have been 410 per bale, but the longshoremen's charge for loading 75 bales would have been 16.70 per bale (2.5 men x 500 per hour x 10 hours = $12.50 per day, or 16.70 per bale). The screwmen's charge for unloading would have been 310 per bale ($31 for 100 bales), and the longshoremen's charge for unloading would have been 12.50 ($12.50 for 100 bales). These four charges are in the second column of figures in Table 4.
Recall Table 3, which includes Hester's (1896) report that screwing cotton into a ship cost 500 per bale in 1895. The charges in Table 4 for loading cotton into ships in 1885 range between 57.70 and 740 per bale (the sum of the screwmen and longshoremen fees). The mid-1880s was an exceptionally strong period for the unions, and union wages fell between 1885 and 1895. So we feel confident that our estimates of the charges are approximately correct and that the actual charges may have been in the middle of our range of estimates.
• Markups Let us now turn to estimating the markups, or monopoly profits, in these charges. We estimate the monopoly profit earned by the unions in unloading and loading activities and then estimate how large that monopoly profit was rel-ative to total transport charges (unloading and loading plus ocean freight) to New York.
The total unloading and loading charges in New Or-leans, if we use the assumptions in the first column of Table 4, were $1.48. To calculate the per bale monopoly profit earned by the unions, let's first calculate their mo-nopoly profit per hour worked, that is, actual earnings less earnings of similarly skilled workers. In the mid-1880s (Table 6), the screwmen earned 670 an hour. If we sup-pose that their skill level is comparable to that of, say, machinists and engineers, who earned union wages of about 330 an hour, then about half of the screwmen's wage is monopoly profit. The longshoremen earned 500 an hour at this time. If we suppose that their skill level is compara-ble to that of freight handlers on the railroad, who earned 150 an hour, then the longshoremen's monopoly profit is about 350 an hour, or about two-thirds of their wage.
16
Thomas J. Holmes, James A. Schmitz, Jr. Competition at Work
Let's now calculate the monopoly profit per bale. Total monopoly profit equals half of the screwmen's per bale charges and two-thirds of the longshoremen's, or 410 + 440 = 850.
With the lowest steamship freight charge to New York, total unloading and loading plus freight charges was $2.73. Monopoly profit thus amounts to 31 percent of total trans-port charges ($0.85 -f $2.73). If, instead, we use the highest steamship freight charge, monopoly profit is 24 percent of total charges ($0.85 -h $3.48).
The total unloading and loading charge in New Orleans if we use the assumptions in the second column of Table 4 was $1.01. Total monopoly profit equals half the screw-men's charges and two-thirds of the longshoremen's, or 360 + 190 = 550. With the lowest steamship freight charge, then, monopoly profit amounts to 24 percent of total transport charges ($0.55 -r $2.26). If, instead, we use the highest steamship charge to New York, monopoly profit is 18 percent of total charges ($0.55 -f $3.01).
Thus, as Table 4 displays, the monopoly profit earned by New Orleans dock worker unions in unloading and loading activities may have been between 18 and 31 per-cent of total transport costs.
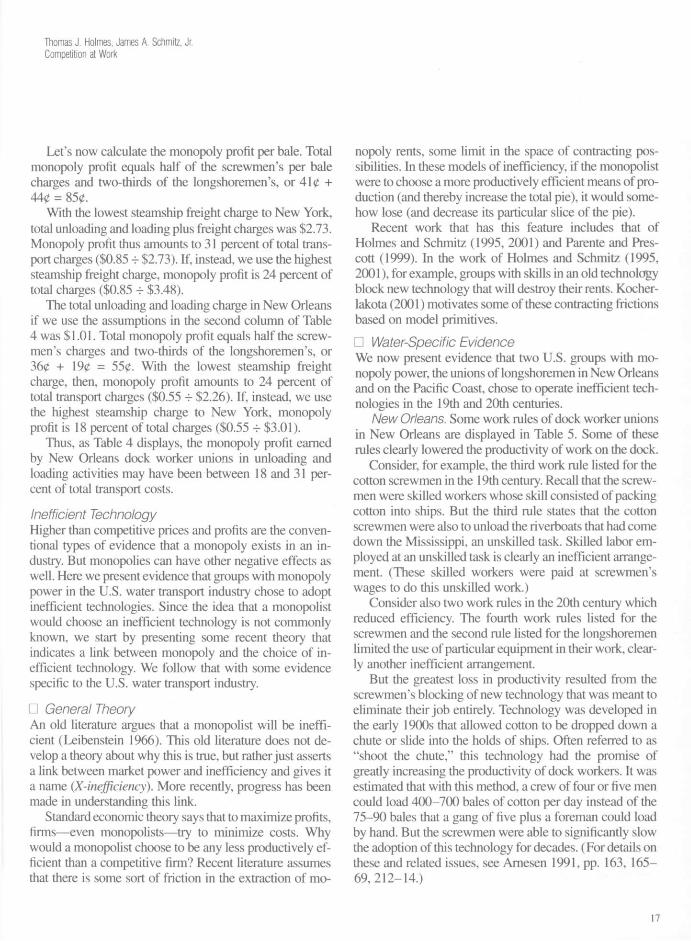
Inefficient Technology Higher than competitive prices and profits are the conven-tional types of evidence that a monopoly exists in an in-dustry. But monopolies can have other negative effects as well. Here we present evidence that groups with monopoly power in the U.S. water transport industry chose to adopt inefficient technologies. Since the idea that a monopolist would choose an inefficient technology is not commonly known, we start by presenting some recent theory that indicates a link between monopoly and the choice of in-efficient technology. We follow that with some evidence specific to the U.S. water transport industry.
• General Theory An old literature argues that a monopolist will be ineffi-cient (Leibenstein 1966). This old literature does not de-velop a theory about why this is true, but rather just asserts a link between market power and inefficiency and gives it a name (X-inefficiency). More recently, progress has been made in understanding this link.
Standard economic theory says that to maximize profits, firms—even monopolists—try to minimize costs. Why would a monopolist choose to be any less productively ef-ficient than a competitive firm? Recent literature assumes that there is some sort of friction in the extraction of mo-
nopoly rents, some limit in the space of contracting pos-sibilities. In these models of inefficiency, if the monopolist were to choose a more productively efficient means of pro-duction (and thereby increase the total pie), it would some-how lose (and decrease its particular slice of the pie).
Recent work that has this feature includes that of Holmes and Schmitz (1995, 2001) and Parente and Pres-cott (1999). In the work of Holmes and Schmitz (1995, 2001), for example, groups with skills in an old technology block new technology that will destroy their rents. Kocher-lakota (2001) motivates some of these contracting frictions based on model primitives.
• Water-Specific Evidence We now present evidence that two U.S. groups with mo-nopoly power, the unions of longshoremen in New Orleans and on the Pacific Coast, chose to operate inefficient tech-nologies in the 19th and 20th centuries.
New Orleans. Some work rules of dock worker unions in New Orleans are displayed in Table 5. Some of these rules clearly lowered the productivity of work on the dock.
Consider, for example, the third work rule listed for the cotton screwmen in the 19th century. Recall that the screw-men were skilled workers whose skill consisted of packing cotton into ships. But the third rule states that the cotton screwmen were also to unload the riverboats that had come down the Mississippi, an unskilled task. Skilled labor em-ployed at an unskilled task is clearly an inefficient arrange-ment. (These skilled workers were paid at screwmen's wages to do this unskilled work.)
Consider also two work rules in the 20th century which reduced efficiency. The fourth work rules listed for the screwmen and the second rule listed for the longshoremen limited the use of particular equipment in their work, clear-ly another inefficient arrangement.
But the greatest loss in productivity resulted from the screwmen's blocking of new technology that was meant to eliminate their job entirely. Technology was developed in the early 1900s that allowed cotton to be dropped down a chute or slide into the holds of ships. Often referred to as "shoot the chute," this technology had the promise of greatly increasing the productivity of dock workers. It was estimated that with this method, a crew of four or five men could load 400-700 bales of cotton per day instead of the 75-90 bales that a gang of five plus a foreman could load by hand. But the screwmen were able to significantly slow the adoption of this technology for decades. (For details on these and related issues, see Arnesen 1991, pp. 163, 165— 69,212-14.)
17

Table 5 Some Work Rules of New Orleans Dock Worker Unions In the 19th and 20th Centuries
Rules in Each Time Period
Type ot Worker Type of Work Rule Mid-1880s Mid-1900s
Cotton Screwmen 1. Limit on amount of work per shift Gang of screwmen to load no more than 75 bales of flat cotton with screws
Gang to load no more than 90 bales of cotton per shift
n.a. Gang to load no more than 80 casks of tobacco per shift
2. Fine for exceeding work limit n.a. $50 fine for exceeding cotton or tobacco limit on first offense; expulsion from union on second
3. Work creation Screwmen not only to load cotton into Screwmen only to load cotton into oceangoing vessels, but also to unload oceangoing vessels; to unload only cotton from riverboats in emergencies (like fire), with $25
fine per gang per day for violation
4. Limit on equipment use n.a. Sling loads limited to 3 round bales of cotton and 2 bales of flat cotton, with $25 fine for violation
n.a. No top hooks to be used in any vessel being stowed by hand; $50 fine on first offense, explusion from union on second
Longshoremen 1. Limit on amount of work per shift Longshoremen to work at same pace as screwmen
n.a.
2. Limit on equipment use n.a. Minimum of 2 workers required for any work performed using trucks, except work with cotton, hemp, railroad iron, and pig copper
n.a. = not available Sources: Lee 1906, Arnesen 1991
The Pacific Coast. The monopoly power held by Pa-cific Coast longshoremen unions also reduced efficiency over the middle part of the 20th century.
While the longshoremen unions on the West Coast dat-
ed to the 19th century, they gained a significant increase in monopoly power in the mid-1930s, when they organized a coastal union, the International Longshore and Ware-house Union (ELWU). This union represented workers in
18

Thomas J. Holmes, James A. Schmitz, Jr. Competition at Work
most ports along the coast, and it gained significant control of the work process.
Employers complained that after the formation of the ILWU, the pace of work slowed significantly and union work rules were adopted that imposed additional costs on the employer when mechanization was attempted. One significant change to slow work was to dramatically re-duce the maximum weight of each bundle of cargo lifted (the sling load). According to Mills and Wellman (1987, p. 177), before the formation of the coastal union in 1934, "the 'general, breakbulk cargo' sling-load . . . had been 4000-4400 pounds" in San Francisco. After the formation of the union, a limit of 2,100 pounds was placed on these sling loads (Mills and Wellman 1987, p. 183).
While such a limit on sling loads dramatically reduced the amount of work done per hour, it also obviously had a potential benefit of reducing accidents on the job. But there were even clearer cases of waste and inefficiency tied to the unions. These were readily acknowledged by the unions as work practices they insisted on which led to inefficiencies.
One example of an inefficient work practice is the re-quirement by the longshoremen that cargo moved by plat-forms (pallets) be placed on the "skin of the dock" (Fergu-son et al. 1961, p. 515, n. 6). The inefficiency of this was acknowledged by the head of the ILWU, Harry Bridges, in Congressional testimony, in response to a question about such practices. He said, "That is one of the practices we have to get rid of. That is one of the practices that is prevalent in San Pedro [California] we have to get rid of because it is a waste of energy and hard work. It does not make mechanization pay off" (quoted in Ferguson et al. 1961, pp. 515-16).
Another example is from a history of the ILWU (writ-ten by the ILWU). This publication discusses the great pressure unions felt to reform dock work practices when employers began to take advantage of technological in-novations in the late 1950s. With regard to this, the union history states that "the union concluded that new methods and machines would be introduced no matter how great members' resistance to change . . . . The union and the employers... agreed the following principles would shape the 1960 contract: the shipowners and stevedoring contrac-tors were freed from restrictions on the introduction of labor-saving devices, relieved of the use of unnecessary workers, and assured of the elimination of work practices which impeded the efficient flow of cargo" (Vrana 1997). Clearly, the union acknowledged that there were unneces-sary workers on the docks.
Chart 5 Productivity of U.S. Pacific Coast Longshoremen Tons per Worker Hour Loaded and Unloaded, Annually Between 1926 and 1953*
1.42 1.35
1.16 1.04
.69 .70 7 3 .72
1926 1930 1934 1938 1942 1946 1950 1953
*Gaps in plots are due to unavailable data. Source: Ferguson et al. 1961, p. 519
In the middle part of the 20th century, then, employers and unions agreed that union work practices reduced pro-ductivity. While there isn't a major study of productivity, we can take a broad look at some numbers. In Chart 5, we present the labor productivity of the Pacific Coast long-shoremen during the first half of the 20th century (with productivity measured by the number of tons loaded and unloaded per worker hour). The years 1926 and 1933 are before the coastal union was formed in 1934. Note that workers' productivity fell dramatically after that. The data plotted in the chart do not control for the types of good handled, the amount of traffic handled by the various ports, and so on. They are admittedly only suggestive. But what they show is not surprising, given the limit on sling loads and other work practices imposed by the union.
Effects of Competition Now we show that in the United States the competition of railroads lessened the monopoly power of groups in the water transport industry and that this competition led to the lowering of prices and the dropping of inefficient technolo-gies in this industry. We focus on the railroads' influence on the monopoly power of groups at holdup points since we have the most evidence for these groups.
As we mentioned, U.S. water transportation systems were susceptible to the creation of holdup points. But,
19

again, the monopoly power at such points was also sus-ceptible to being weakened by railroads, which provided an economical option to water transportation that had not existed before. Once this option existed, if shippers wanted to avoid holdup points, they could, by moving goods partly or totally by railroads. This competition had dramatic ef-fects on the water transport industry.
Lower Prices First we discuss how the development of railroads reduced the power of dock worker unions, which inevitably led to a reduction in water transport costs.
• Railroad Competition Lowered Union Wages... The competition of railroads took business away from waterways and thus reduced monopoly wages in the U.S. water transport industry. A prime example comes from the port of New Orleans.
By the late 1880s, railroads were putting significant pressure on the docks in New Orleans. Some cotton was going overland to New York, bypassing water altogether. And some cotton was being shipped by train to New Or-leans, thereby eliminating the unloading work of dock workers.
To see an example of how quickly railroads eliminated the unloading and other dock work, examine Chart 6. It shows the amount of cotton arriving in New Orleans from the Red River Valley area by water and by rail between 1878 and 1887. Whereas no cotton arrived by rail before 1881, by 1887 much more came by rail than by water (and the amount of cotton coming by water had even decreased in absolute terms).
The path of dock worker wages relative to other New Orleans wages reflects this pressure from railroads. That path between the mid-1880s and the mid-1900s is summa-rized in Table 6. While screwmen's wages fell more than 16 percent and longshoremen's wages fell 20 percent over this period, the wages of freight handlers for the Illinois Central Railroad increased nearly 7 percent.
A large share of these drops in New Orleans dock worker wages probably was due to the railroad competi-tion. The drops were certainly not due to a general decline in wages in the nation or the region. At the time dock worker wages were falling, the wages of workers in other industries were rising. We do not have good wage data to compare the wages through time of particular types of workers in New Orleans, like teamsters, machinists, and engineers.17 But aggregate data series are suggestive. Be-tween 1890 and 1905, for example, when dock worker
Chart 6 How Fast Railroads Took Over the Transportation of Cotton Amount of Cotton Arriving in New Orleans From the Red River Valley and the Texas and Louisiana Regions Tributary to It, in Thousands of Bales, Annually, 1878-87*
322.5
By Water
193.8 186.6
145.1 144.6
1878 1879 1880 1881 1882 1883
*Gaps in plots are due to unavailable data. Source: U.S. Treasury Department 1888, p.170
1885 1886 1887
wages were falling, the average hourly wages in U.S. manufacturing industries rose 20 percent, and average annual earnings in all U.S. industries rose 14 percent. At the same time, average aggregate wages in the U.S. South were keeping up with those in the nation (Rosenbloom 1990, p. 94, Table 2). Hence, at neither the national level nor the regional level were wages feeling the significant downward pressure that is apparent in the wages of New Orleans dock workers.
• ... Lowered Warehouse Fees... Late in the 19th century, railroad competition also affected other dock charges. In his analysis of wheat prices in the 19th century, Veblen (1892, pp. 89-90) discusses the mar-
For the middle 1880s, for example, there are data on wages for some of these groups in one publication (U.S. Labor Department 1898). And for the middle 1900s, there are data on wages for some of the groups in another publication (U.S. Labor Department 1906). But the samples for these two periods are drawn from such different populations that comparing them does not seem appropriate.
20

Thomas J. Holmes, James A. Schmitz, Jr. Competition at Work
Table 6 How Wages Changed Over Time in New Orleans Hourly Wages Between the Mid-1880s and the Mid-1900s
Hourly Wages Paid in
Type of Worker Mid-1880s Mid-1900s % Change
New Orleans Workers On Docks
Cotton Screwmen 670 Longshoremen 50
On Railroads Freight Handlers* 150
U.S. Workers Average Hourly Earnings** All Manufacturing Industries 200
Average Annual Earnings** All Industries $486
"These are workers at the Illinois Central Railroad. "These are earnings in 1890 and 1905.
Sources: U.S. Bureau of the Census 1975, Arnesen 1991
ket power of warehousemen in the Buffalo water transport industry and how railroad competition, particularly rail-roads running from Philadelphia and Baltimore to Chicago, reduced that power.18
Railroad competition with the Erie canal system threatened to divert the grain trade from that route to other ports, as Philadelphia and Baltimore, and this led to close scrutiny of local charges at Buffalo and New York, with a view to re-moving any abuses that burdened the traffic. Criticism and re-crimination ensued between the trade corporations of the two cities, in which some interesting developments, due to the vir-tual monopoly long possessed by the Erie Canal route, came to light. It was found that the charges, at Buffalo perhaps more elaborately than elsewhere, had been ingeniously ar-ranged to take as high toll as might be on every bushel . . . . Under the stress of necessity the middle-men, who drew their income from the traffic, gradually and reluctantly lowered their charges during the seventies to a point at which their amount would no longer work to the manifest detriment of the traffic.
• ... Prevented Union Wage Increases... Early in the 20th century, railroads were used to break dock worker strikes, thus preventing the unions from in-creasing their already high wages. We present just a few examples here.
Because of labor unrest in New Orleans in 1902-3, Arnesen (1987, p. 161) reports, shipping lines rerouted ships away from the port of New Orleans to other gulf ports. This diversion was economical only because these were railroads.
In Boston, a 1912 strike of longshoremen was broken. To defeat the strike, employers used strikebreakers, but also the diversion of traffic to prevent longshoremen from achieving their wage demands in the strikes. According to McLaughlin (1998), "when the strike began, the employ-ers' organization announced that freight being transported by rail to Boston from the west would be re-routed to New York, Baltimore, and Portland, and New-England bound ocean freight would be re-routed to New York."
On the Pacific Coast, Vrana (1997) reports, "shipown-ers . . . imported African Americans as strikebreakers against the white trade unionists, or diverted cargo away from a struck port to be worked by members of a different local.... The shipowners used these tactics to divide and destroy longshore unions on the Pacific Coast in the strikes of 1916, 1919 and 1921." • ... And Reduced Union Royalties In the middle of the 20th century, railroad competition also led labor unions to make more concessions to their em-ployers, including lowering their own charges to employers for permitting new technology to be used on the job.
In the late 1950s, for example, a new technology was being introduced into water transportation that promised to reduce port charges significantly. For the first time, freight was being put in containers, which could be more easily loaded and unloaded from ships—and with fewer workers. The use of containers thus significantly reduced handling costs in ports.
Dock workers understandably did not like this innova-tion. While the longshoremen on the West and East coasts had powerful unions in the 1950s and initially attempted to fight it, they ultimately conceded the employers' right to introduce containers into dock work in return for some fi-nancial rewards. On the West Coast, generous severance
1 8 It seems to have been a widespread view that there was an elevator monopoly at Buffalo. Ellis (1948, p. 287) argues that "the elevator monopoly in that city [Buf-falo] came in for much criticism for the next decade," by which he meant the 1870s.
560 -16.4% 40 -20.0
160 6.7%
240 20.0%
$554 14.0%
21

payments were given to longshoremen who chose to retire early.
On the East Coast, shippers agreed to give longshore-men a royalty per ton for freight that arrived in containers. This dock worker union recognized, however, that this in-novation provided some hope that coastal shipping could recover some of the market that had been captured by trains and trucks. Hence, this union agreed to charge a smaller royalty per ton on containers from ships in the coastal domestic market than from those in the foreign market. The royalties on domestic containers were small, as much as one-quarter of those on foreign containers. The dock worker union agreed to reduce its royalties because it hoped that these smaller charges would help the water transport industry compete with railroads.
The schedule of royalty payments to the International Longshoremen's Association (ILA) workers in New York in the early 1960s is illustrative (Goldberg 1973, p. 261). In this area, royalties on containers in the foreign trade were a function of the degree of automation of the ship and ranged from 350 per ton for conventional ships to 700 per ton for partially automated ships to $1 per ton for the most automated ships. At the same time, for all coastal domestic containers, the royalty was just 280 per ton. Hence, on the most automated ships, the foreign charge was nearly four times the domestic charge.
Fewer Inefficient Technologies Now we demonstrate that lower prices is not all that the development of railroads accomplished in the U.S. water transport industry. It also led groups in this industry with monopoly power to drop some inefficient technologies. We first demonstrate that this sort of effect is possible by describing some evidence from outside the water transport industry. Then we give a few specific water transport ex-amples.
• Non-Water Industry Evidence A clear example of increases in competition leading some groups with monopoly power to drop inefficient technolo-gies comes from the world iron ore market. Galdon-Sanchez and Schmitz (2000) show that the collapse in world steel production in the early 1980s meant that iron ore mines in some countries were under significant threat of closure. Around this time, in most of these countries, iron ore labor productivity doubled in just a few years. Much of the gains are attributed to changes in work rules.
The iron ore industry in the United States illustrates this effect. Schmitz (2001) demonstrates that work rule changes
played the major role in the doubling of U.S. iron ore pro-ductivity. These work rule changes led to an increase in the effort per hour worked and a decrease in the amount of re-dundant effort at the mines.
• Water Industry Evidence Workers in the U.S. water transport industry also accepted changes in how they worked in order to become more ef-ficient and make transportation by water more competitive with railroads.
In New Orleans, for example, in the mid-1900s, the screwmen's union agreed to increase the limit on the rate at which they would screw cotton into oceangoing ships. The maximum rate increased from 75 to 90 bales per gang per day, an increase of 20 percent. (Recall Table 5.) These skilled screwmen also gave up the right to unload cotton as well as load it. (See their third work rule on Table 5.) Since screwmen were skilled and unloading was an un-skilled task, this change clearly improved the efficiency of how workers in the water transport industry were used.
Work rule changes were made on the East and West coasts as well. Around the middle of the 20th century, remember, the ILA agreed to reduce the royalties it charged on domestic traffic in order to try to regain some of the market lost to railroads. That competition also led this union to accept a reduction in the number of workers used on certain types of jobs. The use of containers had reduced the number required for some jobs, and the union did not try to maintain its existing rules. As Goldberg (1973, p. 261) says, "recognising that container operations held out the promise of reviving the near-defunct domestic coastwise and inter-coastal trades, the ILA agreed to a re-duction in the number of gangs required on board ship for tne new domestic trade operations."
The Overall Contribution of Railroads? We have demonstrated that the introduction of railroads significantly reduced the effects of monopoly in the water transport system in the United States. Until now, this con-tribution of railroads has not been recognized by re-searchers. They have assumed, explicitly or implicitly, that without railroads, the U.S. long-distance transportation in-dustry would have been competitive, not monopolistic. Therefore, any quantitative estimates researchers have made about the contribution of railroads to U.S. .economic growth are likely to be far too small. Here we look at one prominent researcher's estimate and attempt to determine, at least qualitatively, how far off it might be.
22
Thomas J. Holmes, James A. Schmitz, Jr. Competition at Work
Fogel's Calculation Fogel (1964) is the first researcher to attempt to quantify the contribution of railroads to U.S. economic growth. (He won a Nobel Prize for this and subsequent work.) He chooses a year at the end of the 19th century, 1890, and asks, How much lower would U.S. gross national product (GNP) in 1890 have been if railroads had not been intro-duced by then? As Fogel argues, an upper bound to this loss is the extra cost that the nation would have had to pay to transport the same goods that actually had been trans-ported in 1890, to the same places, but under the assump-tion that railroads had not been introduced.
• A Necessary Assumption In order to quantitatively estimate this cost, Fogel needed to take a stand on how prices and productivity in the water transport industry would have evolved without railroads. That is, he needed a theory about how the water transport industry operated. The theory he chose is competitive the-ory.
According to this theory, the long-run prices and pro-ductivity in the water transport industry would have evolved independently of those in the railroad industry. Under certain assumptions, then, if there had been no railroad, water transport prices in 1890 would have been the prices that actually were charged in that year.19 If that were true, then calculating the extra cost of shipping some number of units of a good by water as opposed to by rail-road required simply multiplying that number by the dif-ference between the 1890 water and rail prices.
Fogel does this. He starts by restricting his attention to agricultural goods in general and then to four of the major goods: wheat, corn, beef, and pork. He approximates the total quantity of each of these goods moved over each of the main transportation routes. He then asks how much greater the cost of transporting these same quantities of goods, over these same routes, would have been if rail-roads had not been developed. Again, this extra cost is an upper bound to the loss in national income if railroads had not been developed. The extra costs could have been smaller since without railroads, agricultural production could have been relocated or otherwise reconfigured to make shipment to market less costly.
Fogel splits the calculation of the extra cost of trans-porting agricultural goods into two parts. He first calculates the extra cost on long hauls, that is, on interregional ship-ments of goods, for example, from Chicago to New York. To make these shipments, water would have been used if rails had not been developed. The cost of not having rail-
roads for interregional shipments is estimated by Fogel to be 0.6 percent of 1890 GNP. Fogel then calculates the extra cost on short hauls, that is, on intraregional ship-ments, for example, from a farm in Illinois to the city of Chicago. For short hauls, water and wagon would have been used if rails had not been developed, and wagons were an extremely expensive form of transportation. Fogel's estimate of the extra cost for intraregional ship-ments is twice that for interregional shipments: 1.2 percent of 1890 GNP. Hence, Fogel's total estimated extra cost for transporting these major agricultural goods is the sum of the two estimates (0.6 + 1.2), or 1.8 percent of GNP.
• Interregional Detail Let us describe in a bit more detail Fogel's interregional calculation. Let xr denote the quantity of wheat shipped interregionally by rail in 1890 over a particular route. Let the water and rail freight rates on wheat on this route be denoted px
w and pxr, respectively.
Water transport had obvious disadvantages compared to rail transport, including a longer shipment time; a greater insurance cost; greater storage costs, because water routes were closed in the winter; and the necessary extra cost of many transshipments along the way. Fogel prices these dis-advantages and comes up with a number c* which is an es-timate of these additional costs of shipping by water rather than rail.20 Hence, the extra costs of shipping by water the interregional rail shipments of xr over this route are esti-mated to be
(1) (pJ + c J - p X .
By summing these extra costs across goods and inter-regional routes, Fogel arrives at his estimate of the extra cost of making interregional shipments if railroads had not been developed. • The Total Contribution Again, Fogel estimates that the extra cost of moving agri-cultural goods by water and wagons alone in 1890 to be
1 9 T W O assumptions are needed for this result. First, as the water transport industry expanded, costs in the industry had to be nonincreasing. (The industry should have had a nonincreasing long-run marginal cost curve.) Fogel (1979) presents evidence that, if anything, the water transport industry was a decreasing marginal cost industry. Second, the year 1890 had to have been one in which the water transport industry had adjusted to the railroad. In a competitive industry, the owners of capital will continue to operate capital as long as prices cover variable costs, but will no longer make new investments if that's all they cover. The assumption is that by 1890, water prices covered variable and capital costs.
20Fogel (1964) also adds an estimate of the capital costs of canals in cw since tolls on the Erie Canal were eliminated by 1890.
23

1.8 percent of GNP. While Fogel does not calculate the extra cost of moving nonagricultural goods by water and wagon alone, he speculates about what that cost would have been (1964, pp. 219-24). Fogel then suggests that the extra cost for all goods, agricultural and otherwise, would very likely not have exceeded 5 percent of GNP. In other words, Fogel concludes that railroads contributed at most 5 percent to U.S. national income in 1890. Objections Fogel's use of competitive theory to approximate the workings of the U.S. water transport industry has not gone unchallenged. For example, McClelland (1968) has argued that without railroads, there would have been monopoly power on the canals and, hence, higher transport prices in the period Fogel is studying.
Fogel (1979) has had two responses to this argument. First, Fogel says briefly that to the extent canal boat own-ers did have monopoly power and raised prices, this was an income transfer, not a social cost, and he is only in-terested in social costs (Fogel 1979, p. 19, n. 27). But monopolies distort output, and that distortion has social costs. While these costs have often been calculated as quite small, they need not be.
Fogel's second point, his main point, is that monopoly power was an irrelevant issue on the canals in the 19th century, at least in the United States. Fogel argues that there was free entry on the canals and that the competitive abstraction was a reasonable one for the Erie Canal.
But Fogel uses the competitive abstraction for the entire water industry, not just the canal routes.21 And the Erie Canal carried a relatively small part of the U.S. goods moved by water, as Chart 7 shows. Yet, as far as we can tell, there has been little debate about the reasonableness of Fogel's competitive assumption. Fogel (1979) himself makes only brief reference to it. After discussing the canal monopoly issue, Fogel (1979, p. 21) makes a much more general claim about 19th century water transportation. He argues that
In the American case, parties on all sides of the transportation debates of the nineteenth century agreed that it was the com-petitive pressure of waterways that kept railroad rates low, rather than the competitive pressure of railroads that kept waterway rates low.
Fogel seems to be saying here that in the 19th century, mo-nopoly power was not an issue anywhere in the U.S. water transport system.
Chart 7 The Distribution of Business Among U.S. Water Transportation Systems In 1890
% of Tons Originated
o of Ton Miles Carried
16 30
12 30
33 37
39
37
39 30
Atlantic and Gulf Coasts
Erie Canal
Great Lakes
Mississippi and Ohio Rivers
Source: Fogel 1979, Appendix, Table 1
Toward a New Number If Fogel is wrong in his competitive assumption, then he is underestimating the contribution that railroads made to U.S. economic growth. Our historical analysis above has demonstrated that Fogel's assumption is inappropriate; the U.S. water transport industry had a monopolistic tendency, and the entry of railroads lowered prices and made technol-ogy less inefficient in the long-distance transportation in-dustry. Quantitatively taking account of this overlooked contribution of railroads to come up with a new number is beyond our scope here. But we can describe how to qual-itatively see that such an exercise may yield a much larger number than Fogel's 5 percent. First, we look at Fogel's method with monopoly; that is, we calculate the extra cost of transportation with monopoly. Some may say that by doing this, we are simply calculating transfers and not social costs. But we think the exercise is instructive, and at least some fraction of the extra cost of transportation with monopoly must be social costs. Second, we argue that this
Fogel (1979) argues that the Erie Canal system was competitive in 1890. But as we argue above, substantial monopoly power can be exercised over a trade route even if portions of the route are competitive. Hence, knowledge about the competitive con-ditions on one segment of a route tells us nothing about the competitive conditions over the entire route.
24

Thomas J. Holmes, James A. Schmitz, Jr. Competition at Work
fraction may well be large, by discussing recent work on the costs of monopoly.
Before sketching Fogel's calculation with monopoly, however, let us first conjecture that calculating the extra cost of transporting goods without railroads, when we rec-ognize monopoly, will not necessarily produce an upper bound to the actual cost, as it did when there was no monopoly. Without monopoly, the logic as to why such a calculation provides an upper bound is clear. We can apply the first and second welfare theorems about the equiva-lence between competitive equilibria and social planner problems and then think of a planner who can decide to move the location of agricultural production if and only if income is increased. But with monopoly, the welfare the-orems go out the window, and this argument is no longer applicable.
• Fogel's Calculation With Monopoly To make Fogel's calculation with monopoly, let's call the monopoly water transport price and extra cost that would have prevailed without railroads (/?*)' and (c*)', respec-tively, and note that these variables are greater than their competitive counterparts by definition. With a water trans-port monopoly, the extra cost of not having railroads for interregional wheat shipments that actually had been made by train would be
(2) [{p*J + (cxJ-p^xr.
Because the monopoly variables are greater than the com-petitive variables, the extra cost (2) is obviously greater than Fogel's extra cost (1). With monopoly, we must add to this an extra cost of making wheat shipments that had actually gone by water, denoted xw. This extra cost, then, becomes
(3 ) [ ( p : ) ' + ( 0 ' - ( p xw + c x
w ) ] x w .
But this is not all. Recall that Fogel considered only four agricultural goods. He ignored some agricultural goods because they were primarily carried by water, and the only costs he calculated involved shifting goods from railroads to water. The primary example here is cotton.22
Fogel ignores shipments of cotton because a lot of it was transported by water, and he assumes water transport prices were competitive. But since competition from railroads was pushing down the monopoly price of shipping cotton, Fogel's calculation misses a significant income boost from the development of railroads.
How much does he miss? Let yw be the quantity of cotton shipped interregionally by water. Then Fogel misses
(4) [(Pyj + (O' ~ (Pl+cyw)]yw-
The extent to which the calculation that recognizes mo-nopoly exceeds the calculation that does not depends, of course, on the extent to which railroads reduced the water transport industry's tendency toward monopoly in long-distance transportation. It also depends on the year of the calculation since railroads entered the various regions of the United States at different rates. As time passed, rail-roads became denser and thus had a greater impact on the water transport monopoly.
The extra cost of shipping without railroads when mo-nopoly is recognized, relative to the extra cost when mo-nopoly is ignored, then, involves summing terms like (2), (3), and (4) and dividing the result by terms like (1). If we look at the sum of (2) and (3) relative to term (1), we have
(5) {[(PXJ + «Y - (Pxw+cxw)]xj[(p*w+c*w)-p* ]xr}
+ { Kp'J + «)'-px]xr/[(PxJ + K)-Px]xr}.
The second term here is bounded below by
(6) [(PD' + KYV(PX„+<).
This is the water transport price with monopoly relative to the water transport price with railroad competition.
We have shown that in the United States many water transport charges were two and three times the competi-tive levels. While our evidence is for charges at transship-ment points, such magnitudes may well have prevailed on other parts of the system as well. Moreover, transshipment charges were a large share of total shipping charges.
So the idea that the level of water transport prices with-out railroads may have been twrce the level of prices with rail competition may not be unreasonable. Fogel uses the 1890 water and rail transport prices between Chicago and New York as representative of the country. Both of these prices certainly fell dramatically in the second half of the 19th century, during the period of intense competition between water and rail transportation. This can be seen for wheat shipment prices, adjusted for inflation, in Chart 8.
22Wheat, corn, beef, and pork accounted for 42 percent of the income originating in U.S. agriculture in 1889. Cotton accounted for 11 percent (Fogel 1964, p. 25).
25

Note that Fogel uses a water transshipment charge of 500 a ton in his calculations. We have seen in Table 4 that in New Orleans the charge on cotton was much high-er. In the mid-1880s, cotton screwmen there charged 410 to load a bale of cotton. Since a bale weighs about 500 pounds, the screwmen loading charge was $1.64 a ton. And recall, this is the charge for only the last task on the dock. On Table 4 we have seen that the smallest per bale unloading and loading charge is $1.01, which amounts to about $4.00 a ton. But unloading and loading charges were not all the charges in the port. There were also charges for teamsters (draymen) and cotton yardmen, for example. Hester (1896) puts the draymen charges in 1895 at 200 a bale, or 800 a ton. (See Table 3.) In 1885, the draymen charges were likely larger. Hence, the transship-ment charge for a ton of cotton in New Orleans in 1885 was probably about $5.00—10 times Fogel's charge.
Most of this difference may well have been due to the extremely strong monopoly held by the dock worker unions in New Orleans. The strength of this monopoly stemmed from the lack of long-distance transportation alternatives at this time and the fact that cotton was grown close to New Orleans. But the New Orleans monopoly gives us some idea of the power that unions and combina-tions elsewhere with some monopoly power could have developed if railroads and other long-distance transporta-tion alternatives had not been developed.23
Using Applied General Equilibrium While making Fogel's calculation with monopoly is sug-gestive, it is, of course, no substitute for using quantitative general equilibrium theory to answer Fogel's question about the contribution of railroads. In future work, we plan to do that—to make a direct quantitative calculation of what the loss in U.S. national income would have been without railroads, recognizing that they limited the monop-olistic tendencies in the U.S. long-distance transportation industry. Here we briefly discuss some recent advances in theory which suggest that the costs of monopoly in that in-dustry could have been large.
By charging high prices, a monopolist distorts output, and this has allocative efficiency consequences. Such wel-fare losses, Harberger triangles, are typically thought to be small. But they may not be. The competition of railroads reduced monopoly prices significantly (more than in typ-ical calculations) and led to less inefficient technologies (ignored in typical calculations).
But just as important, a monopoly in transportation is a particular cause of concern because it limits trade between
Chart 8 A Plunge in Transportation Prices Charges for Moving Wheat From Chicago to New York by Water and by Rail, Deflated by Consumer Price Index Annual Index of Charges, 1858-95
Index
Sources: Tunell 1897, U.S. Bureau of the Census 1975
regions. Several recent studies suggest that the welfare losses from this sort of monopoly, which can be thought of as akin to higher tariffs, may be large.
Romer (1994) examines the distortions caused by tar-iffs, which are formally equivalent to transportation prices in his model. He concludes that the welfare cost of the re-duction in product variety can, in principle, substantially outweigh the welfare cost of the Harberger triangle output distortions from tariffs. Klenow and Rodriguez-Clare (1997) have quantitatively studied the cost of reduced product variety caused by higher tariffs.
2 3I t is true, of course, that cotton and other agricultural goods, like grains, are dif-ferent, and most others are easier to handle than cotton. Some of the extra cost in cot-ton handling may have been due to this difference. Recall, however, that there were a lot of union restrictions on the use of equipment in handling cotton in New Orleans which themselves increased the handling cost. Recall also that in the early 1900s, a ma-jor technological innovation that made cotton handling more like grain handling ("shoot the chute") was blocked by the cotton screwmen.
26

Thomas J. Holmes, James A. Schmitz, Jr. Competition at Work
High monopoly transport prices can also foster monop-oly in other industries. Holmes and Schmitz (1995, 2001) show that by lowering tariffs between areas, which is equivalent to lowering the price of transportation, compe-tition is increased in other sectors. They argue that this increased competition can lead to productivity gains in other sectors as, for example, inefficient work practices are abandoned.
Investment in an industry will also be affected by mo-nopoly pricing (Grossman and Hart 1986, Farrell and Gallini 1988, Williamson 1989, and McLaren 2000). The problem arises when there is limited commitment by agents. Holmes (1990) discusses how a monopoly in gas-oline, together with a limited ability of the gasoline mo-nopolist to commit to low future prices of gasoline, will lead to inefficiently low investment in capital goods (for example, cars) that use gasoline. In the same way, a mo-nopoly in water transportation will lead to inefficient in-vestment in the types of capital (for example, factories and farm infrastructure) that use water transportation as a com-plementary input.
Conclusion By examining the U.S. long-distance transportation in-dustry in the 19th and 20th centuries, we have seen com-petition at work. We have demonstrated two main things: (1) that monopoly has been pervasive in the U.S. water transport industry and has led to prices higher than compet-itive levels plus the use of technologies less efficient than could have been used and (2) that competition from rail-roads greatly reduced the power of this monopoly, which is evident in lower prices and less inefficiency in the water transport industry.
Unlike Fogel (1964), we have not yet produced an es-timate of how much the development of railroads contrib-uted to U.S. economic growth. Fogel famously boiled down his analysis of that contribution to a number. In his estimate, the development of railroads had a value to the 1890 U.S. economy of no more than 5 percent of GNP. But Fogel worked in a competitive framework, ignoring the monopoly in the long-distance transportation industry. In future work, we plan to attempt to come up with a new number that takes into account the weakening of that monopoly. We expect that this work may lead to a sub-stantial upward revision of Fogel's estimate.
One way to get a sense of what the new number might be is to do what Fogel did—and one of the things we did in this article: examine the available data for a representa-
tive area. Fogel extrapolates from the shipment of grain between Chicago and New York; we can extrapolate from the movement of cotton through the New Orleans dock. We are assuming that what was happening in New Orleans in the early 1880s (before railroads made big inroads there) is indicative of what would have happened in the rest of the country if railroads had not been developed. We have seen that water transport prices in New Orleans were about twice competitive levels and that union restrictions on how to do dock work lowered productivity there, perhaps by one-half.
We don't know yet what the value to the U.S. economy as a whole would be from halving the total U.S. transporta-tion cost and reducing the use of inefficient technology. Rather than throw out a new number here, we will end by pointing out that the transportation sector is a special sec-tor, closely linked to the rest of the economy. Changes in this sector reverberate widely. At the least, improved trans-portation increases specialization and competition in other sectors. These benefits thus magnify the benefits of re-source savings from simple reductions in the cost of trans-portation.
27

References
Arnesen, Eric. 1987. To rule or ruin: New Orleans dock workers' struggle for control, 1902-1903. Labor History 28 (Spring): 139-66.
. 1991. Waterfront workers of New Orleans: Race, class, and politics, 1863-1923. New York: Oxford University Press.
Barnes, Charles B. 1915. The longshoremen. New York: Russel Sage Foundation. Baughman, James P. 1968a. Charles Morgan and the development of Southern trans-
portation. Nashville: Vanderbilt University Press. . 1968b. The evolution of rail-water systems of transportation in the Gulf
Southwest, 1836-1890. Journal of Southern History 34 (August): 357-81. Carlton, Dennis W., and Perloff, Jeffrey M. 1990. Modern industrial organization.
Glenview, 111.: Scott, Foresman/Little, Brown Higher Education. Commons, John R. 1905. Types of American labor unions: The longshoremen of the
Great Lakes. Quarterly Journal of Economics 20 (November): 59-85. Ellis, David Maldwyn. 1948. Rivalry between the New York Central and the Erie Ca-
nal. New York History 29 (July): 268-300. Farrell, Joseph, and Gallini, Nancy T. 1988. Second-sourcing as a commitment: Mo-
nopoly incentives to attract competition. Quarterly Journal of Economics 103 (No-vember): 673-94.
Ferguson, Allen R., et al. 1961. The economic value of the United States Merchant Ma-rine. Evanston, 111.: Transportation Center, Northwestern University.
Fogel, Robert William. 1964. Railroads and American economic growth: Essays in econometric history. Baltimore: Johns Hopkins Press.
. 1979. Notes on the social savings controversy. Journal of Economic History 39 (March): 1-54.
Galdon-Sanchez, Jose E., and Schmitz, James A., Jr. 2000. Threats to industry survival and labor productivity: World iron-ore markets in the 1980's. Research Department Staff Report 263. Federal Reserve Bank of Minneapolis.
Goldberg, Joseph P. 1973. Longshoremen and the modernisation of cargo handling in the United States. International Labour Review 107 (March): 253-79.
Grossman, Sanford J., and Hart, Oliver D. 1986. The costs and benefits of ownership: A theory of vertical and lateral integration. Journal of Political Economy 94 (Au-gust): 691-719.
Heinrich, Thomas R. 1997. Ships for the seven seas: Philadelphia shipbuilding in the Age of Industrial Capitalism. Baltimore: Johns Hopkins University Press.
Hester, Henry G. 1896. Cotton: Its relations to leading American seaports, past and present. Manufacturers' Record 29 (July 24): 3-5.
Hoagland, Henry Elmer. 1917. Wage bargaining on the vessels of the Great Lakes. Studies in the Social Sciences. Vol. 6, No. 3. University of Illinois.
Holmes, Thomas J. 1990. Consumer investment in product-specific capital: The mo-nopoly case. Quarterly Journal of Economics 105 (August): 789-801.
Holmes, Thomas J., and Schmitz, James A., Jr. 1995. Resistance to new technology and trade between areas. Federal Reserve Bank of Minneapolis Quarterly Review 19 (Winter): 2-17.
. 2001. A gain from trade: From unproductive to productive entrepre-neurship. Journal of Monetary Economics 47 (April): 417-46.
Hunter, Louis C. 1949. Steamboats on the Western rivers: An economic and techno-logical history. Cambridge, Mass.: Harvard University Press.
Klenow, Peter J., and Rodriguez-Clare, Andres. 1997. Quantifying variety gains from trade liberalization. Manuscript. Graduate School of Business, University of Chi-cago.
KJeven, Bernhardt J. 1941. Wisconsin lumber industry. Ph.D. dissertation. University of Minnesota.
Kocherlakota, Narayana R. 2001. Building blocks for barriers to riches. Research De-partment Staff Report 288. Federal Reserve Bank of Minneapolis.
Lee, Guy A. 1938. History of the Chicago grain elevator industry, 1840-1890. Ph.D. dissertation. Harvard University.
Lee, Robert E., ed. 1906. Report of the Bureau of Statistics of Labor for the State of Louisiana—1904-05. New Orleans: Miller and Brandao.
Leibenstein, Harvey. 1966. Allocative inefficiency vs. "X-inefficiency." American Eco-nomic Review 56 (June): 392-415.
McClelland, Peter C. 1968. Railroads, American growth, and the new economic his-tory: A critique. Journal of Economic History 28 (March): 102-23.
McGee, John S. 1961. Ocean freight rate conferences. In The economic value of the United States Merchant Marine, by Allen R. Ferguson et al. Evanston, 111.: Trans-portation Center, Northwestern University.
McLaren, John. 2000. "Globalization" and vertical structure. American Economic Re-view 90 (December): 1239-54.
McLaughlin, Francis M. 1998. The replacement of the Knights of Labor by the Inter-national Longshoremen's Association in the Port of Boston. Historical Journal of Massachusetts 26 (Winter): 27-45.
Mills, Herb, and Wellman, David. 1987. Contractually sanctioned job action and work-ers' control: The case of the San Francisco longshoremen. Labor History 28 (Spring): 167-95.
Parente, Stephen L., and Prescott, Edward C. 1999. Monopoly rights: A barrier to riches. American Economic Review 89 (December): 1216-33.
Romer, Paul. 1994. New goods, old theory, and the welfare costs of trade restrictions. Journal of Development Economics 43 (February): 5-38.
Rosenbloom, Joshua L. 1990. One market or many? Labor market integration in the late nineteenth-century United States. Journal of Economic History 50 (March): 85-107.
Schmitz, James A., Jr. 2001. What determines labor productivity? Lessons from the dramatic recovery of the U.S. and Canadian iron-ore industries. Research De-partment Staff Report 286. Federal Reserve Bank of Minneapolis.
Taft, Philip. 1946. Dues and initiation fees in labor unions. Quarterly Journal of Eco-nomics 60 (February): 219-32.
Tunell, George G. 1897. Appendix to The diversion of the flour and grain traffic from the Great Lakes to the railroads. Journal of Political Economy 5 (June): 413-20.
U.S. Bureau of the Census. 1975. Historical statistics of the United States, colonial times to 1970. Washington, D.C.: Bureau of the Census, U.S. Department of Com-merce.
U.S. Congress. 1914. House. Committee on the Merchant Marine and Fisheries. Report on steamship agreements and affiliations in the American foreign and domestic trade. Prepared by S. S. Huebner. Including the recommendations of the Com-mittee. Proceedings of the Committee on the Merchant Marine and Fisheries in the investigation of shipping combinations under House Resolution 587. Vol. 4. 63rd Cong. Washington, D.C.: Government Printing Office.
U.S. Labor Department. 1898. Wages in the United States and Europe, 1870-1898. Bulletin of the Department of Labor. No. 18 (September): 665-93.
. 1906. Bulletin of the Bureau of Labor. No. 65 (July): 132-58. U.S. Treasury Department. 1881. Report on the internal commerce of the United
States: Commerce and navigation. Part I, by Joseph Nimmo, Jr. Washington, D.C.: Government Printing Office.
. 1888. Report on the internal commerce of the United States: Commerce and navigation. Part II, by William F. Switzler. Washington, D.C.: Government Printing Office.
28

Thomas J. Holmes, James A. Schmitz, Jr. Competition at Work
Veblen, Thorsten B. 1892. The price of wheat since 1867. Journal of Political Econ-omy 1 (December): 68-103.
Vrana, Eugene Dennis. 1997. The ILWU story: Six decades of militant unionism. Berkeley, Calif.: International Longshore & Warehouse Union. Available at http://www.ilwulocal30.com/history.htm.
Williamson, Oliver E. 1989. Transaction cost economics. In Handbook of industrial organization, Vol. 1, ed. Richard Schmalensee and Robert D. Willig, Chap. 3, pp. 136-82. Handbooks in Economics, No. 10. Amsterdam: North-Holland.