3. Laboratory Test Results. Laboratory Test Items Cylinder specimens, D=5cm, L=10cm, are used for...
12
3. Laboratory Test Results 3. Laboratory Test Results
-
Upload
clyde-lloyd -
Category
Documents
-
view
219 -
download
1
Transcript of 3. Laboratory Test Results. Laboratory Test Items Cylinder specimens, D=5cm, L=10cm, are used for...

3. Laboratory Test Results3. Laboratory Test Results

Laboratory Test ItemsLaboratory Test Items
• Cylinder specimens, D=5cm, L=10cm, are used for laboratory test.
• Soil strength is determined by Unconfined Compression Test.
• The spectral characteristic is measured by optical spectrometer.

An example of weatheringAn example of weathering
Liaozhong Jing (Mar.30.2002)Liaozhong Jing (Mar.30.2002)

Weathering-induced surface changeWeathering-induced surface change
Start dayStart day
after 90 daysafter 90 days
after 120 daysafter 120 days
outdoor-exposure test using a cylinder specimen
deterioration process
deterioration process
caused by weathering
caused by weathering

Test CaseTest Case
Series NSeries N N0N0 N80N80 N90N90 N100N100
Number of dry-wet iterations
0 80 90 100
Weathering Progress
Series PSeries P P0P0 P80P80 P90P90 P100P100
Number of dry-wet iterations
0 80 90 100
Series N : without Relics Preservation Admixture (TOT) Series P : with Relics Preservation Admixture (TOT)
TOT has developed by Tanaka Geology Consultants, Co.Ltd.

Unconfined Compression Test ResultsUnconfined Compression Test Results-Series N (not used TOT)--Series N (not used TOT)-
0
1
2
3
4
5
0.0 0.5 1.0 1.5 2.0 2.5
Strain(%)
Stre
ss(M
Pa) N0
N1
N2
N3
deter
iorati
on pr
oces
s cau
sed b
y wea
ther
ing
deter
iorati
on pr
oces
s cau
sed b
y wea
ther
ing
The peak value of Stress is called Unconfined Compression Strength (soil strength).

Because of TOT effects, the peak values became larger than Series N.
0
1
2
3
4
5
0.0 0.5 1.0 1.5 2.0 2.5
Strain(%)
Stre
ss(M
Pa) P0
P1
P2
P3
Unconfined Compression Test ResultsUnconfined Compression Test Results-Series P (used TOT)--Series P (used TOT)-
deter
iorati
on pr
oces
s cau
sed b
y wea
ther
ing
deter
iorati
on pr
oces
s cau
sed b
y wea
ther
ing
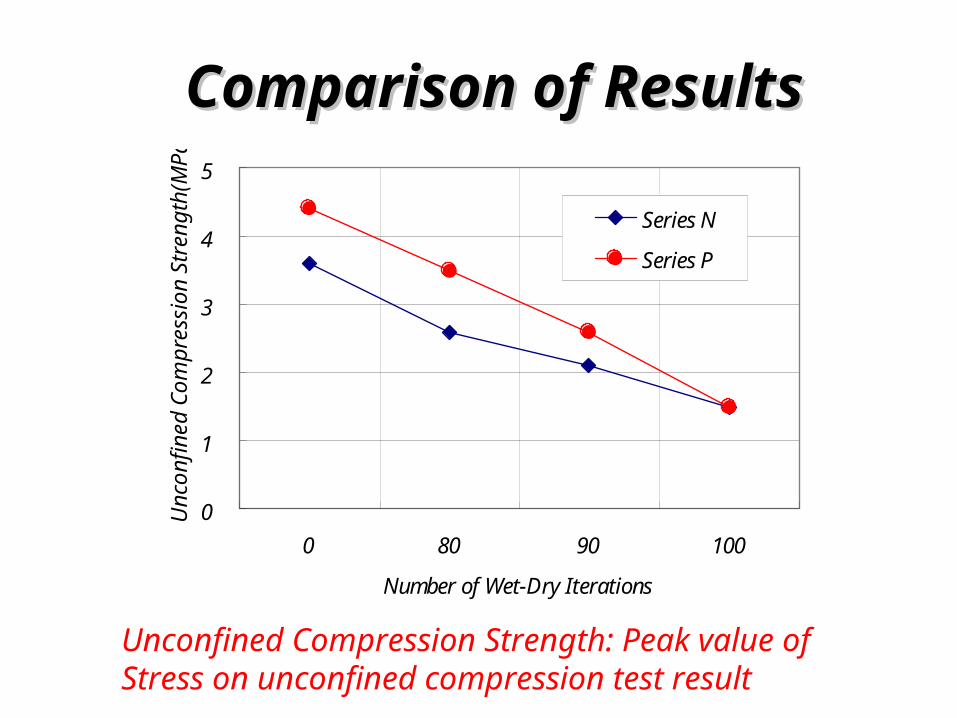
Comparison of ResultsComparison of Results
0
1
2
3
4
5
0 80 90 100
Number of Wet-Dry Iterations
Unc
onfin
ed C
ompr
essi
on S
tren
gth(
MP
a)
Series N
Series P
Unconfined Compression Strength: Peak value of Stress on unconfined compression test result

0
200
400
600
800
1000
300 500 700 900 1100
Wavelength(nm)
Inte
nsity
(Cou
nt)
N0
N1
N2
N3
Spectral CharacteristicsSpectral Characteristics-Series N--Series N-
dete
rior
atio
n p
roce
ss c
ause
d by
wea
ther
ing
dete
rior
atio
n p
roce
ss c
ause
d by
wea
ther
ing

0
200
400
600
800
1000
300 500 700 900 1100
Wavelength(nm)
Inte
nsity
(Cou
nt)
P0
P1
P2
P3
Spectral CharacteristicsSpectral Characteristics-Series P--Series P-
dete
rior
atio
n p
roce
ss c
ause
d by
wea
ther
ing
dete
rior
atio
n p
roce
ss c
ause
d by
wea
ther
ing

0
200
400
600
800
1000
300 500 700 900 1100
Wavelength(nm)
Inte
nsity
(Cou
nt)
N0
N1
N2
N3
Relationship between Soil Strength and Relationship between Soil Strength and the Spectral Characteristicthe Spectral Characteristic
0
1
2
3
4
5
0.0 0.5 1.0 1.5 2.0 2.5
Strain(%)
Stre
ss(M
Pa) N0
N1
N2
N3
0
200
400
600
800
1000
300 500 700 900 1100
Wavelength(nm)
Inte
nsity
(Cou
nt)
P0
P1
P2
P3
0
1
2
3
4
5
0.0 0.5 1.0 1.5 2.0 2.5
Strain(%)
Stre
ss(M
Pa) P0
P1
P2
P3

Relationship between Soil Strength and Relationship between Soil Strength and the Spectral Characteristicthe Spectral Characteristic
0
1
2
3
4
5
300 400 500 600 700 800 900 1000
Number of Wet-Dry Iterations
Unc
onfin
ed C
ompr
essi
on S
tren
gth(
MP
a)
Series N
Series P
exponential relationship between them
This figure shows a possibility of soil state monitoring from satellite imageries.