3 EXPERIMENTAL INVESTIGATION OF FIBERGLASS REINFORCED...
13
International Journal of Design and Manufacturing Technology (IJDMT), ISSN 0976 – 6995(Print), ISSN 0976 – 7002(Online) Volume 4, Issue 1, January- April (2013), © IAEME 30 EXPERIMENTAL INVESTIGATION OF FIBERGLASS REINFORCED MONO-COMPOSITE LEAF SPRING Rakesh Hota 1 , Kshitij Kumar 2 , Ganni Gowtham 3 , Avinash Kumar Kotni 4 1 Mtech Manufacturing Engineering, VIT University, Vellore 2 Btech Automotive Engineering, VIT University, Vellore 3 Btech Energy Engineering, VIT University, Vellore 4 Btech Mechanical Engineering, ITER, Bhubaneswar ABSTRACT The Automotive industry has witnessed major growth in use of fiberglass reinforced polymers. One such area of application is the composite leaf springs. Leaf springs are used in suspension systems for vehicles. Currently the ideal choice is the multiple laminated leaf steel springs. The aim is to compare a mono composite leaf spring with a steel leaf spring for different test conditions. Physical testing is carried out for two different samples 60% epoxy- 40% E-fibreglass and 50% epoxy - 50% E-fibreglass, both prepared in the laboratory. The study gives a comparative analysis between the composite leaf spring and steel leaf spring based on physical properties. Keywords: Leaf Spring, Mono-composite, fibreglass INTRODUCTION Several papers have been published denoting the application of composites in leaf spring. Other conventional suspension systems work on the same principles as a conventional leaf spring. However leaf springs use excess material when compared to other suspension systems for the same load and shock absorbing performance which makes it heavy. This can be improved by composite leaf springs. Various advantages which the composites have on their counterpart conventional structural materials have been analysed by Breadmore et al. [1]. A leaf spring is subjected to millions of variation in stresses throughout its life cycle which causes its failure at a value less than the estimated value. Thus this is the most important factor to be studied, fatigue characteristic of composite multi-leaf spring which has been done in Finite Element Analysis by Kueh et al [2]. INTERNATIONAL JOURNAL OF DESIGN AND MANUFACTURING TECHNOLOGY (IJDMT) ISSN 0976 – 6995 (Print) ISSN 0976 – 7002 (Online) Volume 4, Issue 1, January- April (2013), pp. 30-42 © IAEME: www.iaeme.com/ijdmt.html Journal Impact Factor (2012):1.8270 (Calculated by GISI) www.jifactor.com IJDMT © I A E M E
Transcript of 3 EXPERIMENTAL INVESTIGATION OF FIBERGLASS REINFORCED...

International Journal of Design and Manufacturing Technology (IJDMT), ISSN 0976 –
6995(Print), ISSN 0976 – 7002(Online) Volume 4, Issue 1, January- April (2013), © IAEME
30
EXPERIMENTAL INVESTIGATION OF FIBERGLASS REINFORCED
MONO-COMPOSITE LEAF SPRING
Rakesh Hota1, Kshitij Kumar
2, Ganni Gowtham
3, Avinash Kumar Kotni
4
1Mtech Manufacturing Engineering, VIT University, Vellore
2Btech Automotive Engineering, VIT University, Vellore
3Btech Energy Engineering, VIT University, Vellore
4Btech Mechanical Engineering, ITER, Bhubaneswar
ABSTRACT
The Automotive industry has witnessed major growth in use of fiberglass reinforced
polymers. One such area of application is the composite leaf springs. Leaf springs are used in
suspension systems for vehicles. Currently the ideal choice is the multiple laminated leaf steel
springs. The aim is to compare a mono composite leaf spring with a steel leaf spring for
different test conditions. Physical testing is carried out for two different samples 60% epoxy-
40% E-fibreglass and 50% epoxy - 50% E-fibreglass, both prepared in the laboratory. The
study gives a comparative analysis between the composite leaf spring and steel leaf spring
based on physical properties.
Keywords: Leaf Spring, Mono-composite, fibreglass
INTRODUCTION
Several papers have been published denoting the application of composites in leaf
spring. Other conventional suspension systems work on the same principles as a conventional
leaf spring. However leaf springs use excess material when compared to other suspension
systems for the same load and shock absorbing performance which makes it heavy. This can
be improved by composite leaf springs.
Various advantages which the composites have on their counterpart conventional
structural materials have been analysed by Breadmore et al. [1]. A leaf spring is subjected to
millions of variation in stresses throughout its life cycle which causes its failure at a value
less than the estimated value. Thus this is the most important factor to be studied, fatigue
characteristic of composite multi-leaf spring which has been done in Finite Element Analysis
by Kueh et al [2].
INTERNATIONAL JOURNAL OF DESIGN AND MANUFACTURING TECHNOLOGY (IJDMT)
ISSN 0976 – 6995 (Print) ISSN 0976 – 7002 (Online)
Volume 4, Issue 1, January- April (2013), pp. 30-42
© IAEME: www.iaeme.com/ijdmt.html
Journal Impact Factor (2012):1.8270 (Calculated by GISI)
www.jifactor.com
IJDMT
© I A E M E

International Journal of Design and Manufacturing Technology (IJDMT), ISSN 0976 –
6995(Print), ISSN 0976 – 7002(Online) Volume 4, Issue 1, January- April (2013), © IAEME
31
Considering the fact that the conventional leaf spring is one of the potential
components for weight reduction it has been an area of interest for automobile industries [3].
The various advantages possessed by the composite materials [6] make this an attractive
alternative material for the designers. In an experimental investigation comparison between
the single leaf spring of variable thickness composite spring of fibreglass reinforced fibre
with mechanical and dimensional properties similar to the conventional steel leaf spring was
done by Al-Qureshi et al [4].
G.S.S. Shankar [8] studied the analysis and design of low cost fabrication of a mono
composite leaf spring with bonded end joints. Since static and fatigue strengths of a
composite is leaf spring are much better when compared to conventional leaf springs [5], it is
thus possible to use composite leaf springs in place of conventional leaf springs. This also
helps in weight reduction with no compromise to load carrying capacity [7].
A parabolic leaf spring, with the spring width decreasing hyperbolically and the thickness
increasing linearly from the spring eyes towards the axle seat, was found to be the most
optimum design [9].The calculation of the fatigue life of the conventional steel leaf spring is
taken from [10] and the calculation of the fatigue life of composite leaf spring is found by the
Hawang and Han relation [11].
II. SPRING STEEL MATERIAL USED FOR TESTING PURPOSES
Material designation is 65Si7 which has a Director Identification Number (DIN)
designation of 65Si7 and material number designation that is 1.5028
TABLE 1: Chemical composition in weight %
Carbon (C) 0.610
Silicon (Si) 1.650
Phosphorus (P) 0.039
Manganese (Mn) 0.810
Sulphur (S) 0.037
TABLE 2: Physical Properties at ambient temperature
Tensile Strength (MPa) 1921
Yield Strength (MPa) 1349
Young’s Modulus 1.8 x 10⁵
Poisson’s Ratio 0.32
Density (g/cm3) 7.80
III. FABRICATION OF COMPOSITE SAMPLES
Layup Selection
The amount of elastic energy that can be stored by a leaf spring varies directly with
the square of maximum allowable stress and inversely with the modulus of elasticity both in
the longitudinal direction. Composite materials like the E-Glass/ Epoxy in the direction of
fibres have good characteristics for storing strain energy. So, the layup is selected to be
unidirectional along the longitudinal direction of the spring. The unidirectional layup may
International Journal of Design and Manufacturing Technology (IJDMT), ISSN 0976 –
6995(Print), ISSN 0976 – 7002(Online) Volume 4, Issue 1, January- April (2013), © IAEME
32
weaken the spring at the mechanical joint area and require strengthening the spring in this
region.
DiGlycidyl Ether of Bisphenol A was used as epoxy resin and Tri-Ethylene Tetra-
Amine was used as hardener. E-Glass fibres were used as reinforcements.
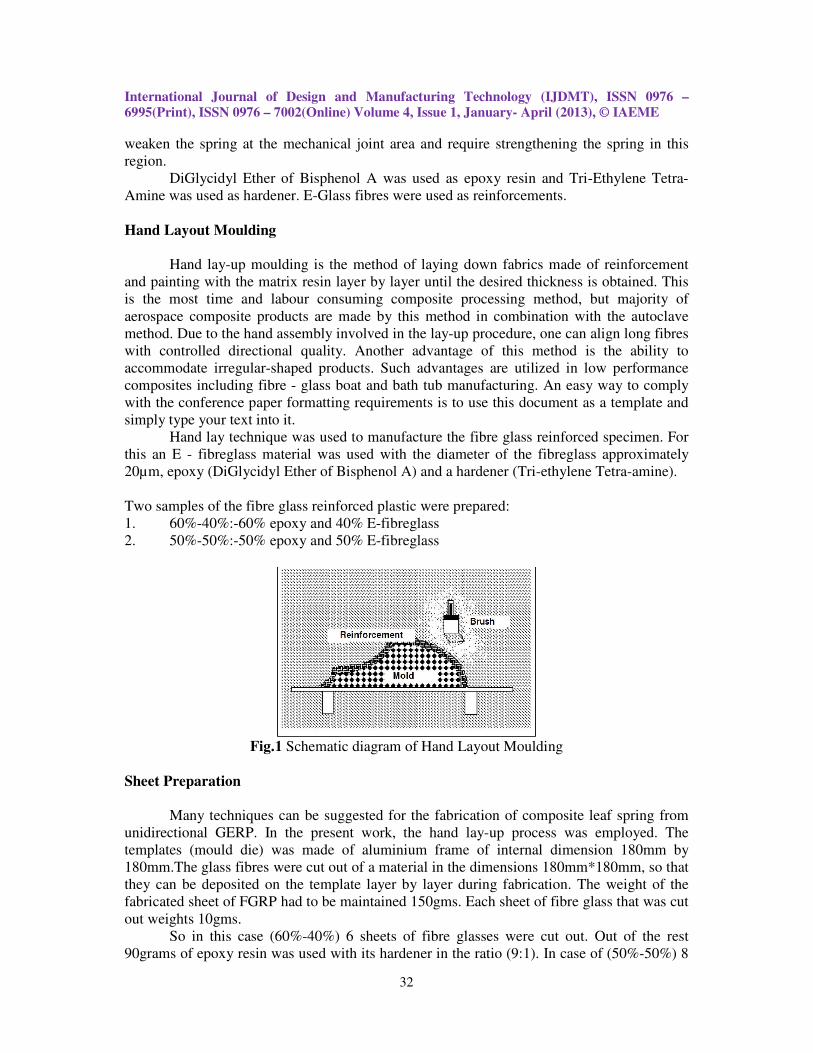
Hand Layout Moulding
Hand lay-up moulding is the method of laying down fabrics made of reinforcement
and painting with the matrix resin layer by layer until the desired thickness is obtained. This
is the most time and labour consuming composite processing method, but majority of
aerospace composite products are made by this method in combination with the autoclave
method. Due to the hand assembly involved in the lay-up procedure, one can align long fibres
with controlled directional quality. Another advantage of this method is the ability to
accommodate irregular-shaped products. Such advantages are utilized in low performance
composites including fibre - glass boat and bath tub manufacturing. An easy way to comply
with the conference paper formatting requirements is to use this document as a template and
simply type your text into it.
Hand lay technique was used to manufacture the fibre glass reinforced specimen. For
this an E - fibreglass material was used with the diameter of the fibreglass approximately
20µm, epoxy (DiGlycidyl Ether of Bisphenol A) and a hardener (Tri-ethylene Tetra-amine).
Two samples of the fibre glass reinforced plastic were prepared:
1. 60%-40%:-60% epoxy and 40% E-fibreglass
2. 50%-50%:-50% epoxy and 50% E-fibreglass
Fig.1 Schematic diagram of Hand Layout Moulding
Sheet Preparation
Many techniques can be suggested for the fabrication of composite leaf spring from
unidirectional GERP. In the present work, the hand lay-up process was employed. The
templates (mould die) was made of aluminium frame of internal dimension 180mm by
180mm.The glass fibres were cut out of a material in the dimensions 180mm*180mm, so that
they can be deposited on the template layer by layer during fabrication. The weight of the
fabricated sheet of FGRP had to be maintained 150gms. Each sheet of fibre glass that was cut
out weights 10gms.
So in this case (60%-40%) 6 sheets of fibre glasses were cut out. Out of the rest
90grams of epoxy resin was used with its hardener in the ratio (9:1). In case of (50%-50%) 8

International Journal of Design and Manufacturing Technology (IJDMT), ISSN 0976 –
6995(Print), ISSN 0976 – 7002(Online) Volume 4, Issue 1, January- April (2013), © IAEME
33
sheets of fibre glass were cut out. Out of this the rest 90gms epoxy resin was used with its
hardener in the ratio (9:1).
In the conventional hand lay-up technique, a releasing agent (silicone gel) was applied
uniformly to the mould which had good surface finish. This was followed by the uniform
application of epoxy resin over glass fibre. Another layer was layered and epoxy resin was
applied with the help of a brush and a roller was used to remove all the trapped air. This
process continued till all the pre measured materials were used. Care must be taken during the
individual lay-up of the layers to eliminate the fibre distortion, which could result in lowering
the strength and rigidity of the spring as a whole. The duration of the process took around 30
minutes. The mould was allowed to cure for 1 day at room temperature.
After curing the sheet was pulled out and was cut using a hack-saw according to the
required dimensions for different experiments. Alumina-calcium-borosilicate glasses with a
maximum alkali content of 2 wt.% used as general purpose fibres where strength and high
electrical resistivity are required.
Fig.2 FGRP manufactured at 50% w/w E-Glass Fibre
Fig.3 FGRP manufactured at 40% w/w E-Glass Fibre
IV. EXPERIMENTAL TESTS
Flexural Test
Testing of flexural properties of polymer matrix composites is done by using a bar of
rectangular cross section supported on a beam and deflected at a constant rate. The test
method outlines a three point loading system for centre loading. This test method is designed
for polymer matrix composites and uses a standard 32:1 span-to-thickness ratio. Since the
flexural properties of many materials can vary depending on temperature, rate of strain and

International Journal of Design and Manufacturing Technology (IJDMT), ISSN 0976 –
6995(Print), ISSN 0976 – 7002(Online) Volume 4, Issue 1, January- April (2013), © IAEME
34
specimen thickness, it may be appropriate to test materials at varied parameters. Test
procedure the procedure outlines a three point loading system for centre loading. Most
commonly the specimen lies on a support span and the load is applied to the centre by the
loading nose producing three-point bending at a specified rate.
Standard specimen thickness is 4 mm (0.16 in), standard specimen width is 13 mm
(0.5 in) and standard specimen length is 20% longer than the support span. If the standard
specimen is not available, alternative specimen sizes may be used. Equipment used is
Universal Testing Machine, Three Point Flexural Fixture
Dynamic Mechanical Analysis
Dynamic Mechanical Analysis determines elastic modulus (or storage modulus, G'),
viscous modulus (or loss modulus, G'') and damping coefficient (Tan D) as a function of
temperature, frequency or time. Results are typically provided as a graphical plot of G', G'',
and Tan D versus temperature. DMA identifies transition regions in plastics, such as the glass
transition, and may be used for quality control or product development. DMA can recognize
small transition regions that are beyond the resolution of DSC (Differential Scanning
Calorimetry). The test specimen is clamped between the movable and stationary fixtures, and
then enclosed in the thermal chamber. Frequency, amplitude, and a temperature range
appropriate for the material are input. The Analyser applies torsional oscillation to the test
sample while slowly moving through the specified temperature range.
Test specimens are typically 56 x 13 x 3 mm, cut from the centre section of a tensile
bar, or a multipurpose test specimen.
Equipment used is Rheometric Scientific RDA III Dynamic Mechanical Analyser.
Deflection Temperature Under Load (HDT or Heat Deflection Test)
Heat deflection temperature is defined as the temperature at which a standard test bar
deflects a specified distance under a load. It is used to determine short-term heat resistance. It
distinguishes between materials that are able to sustain light loads at high temperatures and
those that lose their rigidity over a narrow temperature range.
The bars are placed under the deflection measuring device. A load of 0.45 MPa or
1.80 MPa is placed on each specimen. The specimens are then lowered into a silicone oil bath
where the temperature is raised at 2° C per minute until they deflect 0..25 mm for ASTM,
0.32 mm for ISO flat-wise, and 0.34 mm for ISO edgewise standard bar 5" x ½" x ¼" is used
for ASTM. Equipment used is Atlas HDV2 DTUL/ VICAT tester.
Tensile Test
ASTM D3039 tensile testing is used to measure the force required to break a polymer
composite specimen and the extent to which the specimen stretches or elongates to that
breaking point. Tensile tests produce a stress-strain diagram, which is used to determine
tensile modulus. The data is often used to specify a material, to design parts to withstand
application force and as a quality control check of materials.
Specimens are placed in the grips of a Universal Test Machine at a specified grip separation
and pulled until failure. For ASTM D3039 the test speed can be determined by the material
specification or time to failure (1 to 10 minutes). A typical test speed for standard test

International Journal of Design and Manufacturing Technology (IJDMT), ISSN 0976 –
6995(Print), ISSN 0976 – 7002(Online) Volume 4, Issue 1, January- April (2013), © IAEME
35
specimens is 2 mm/min (0.05 in/min). An extensometer or strain gauge is used to determine
elongation and tensile modulus. Depending upon the reinforcement and type, testing in more
than one orientation may be necessary.
The most common specimen for ASTM D3039 has a constant rectangular cross section, 25
mm (1 in) wide and 250 mm (10 mm) long. Optional tabs can be bonded to the ends of the
specimen to prevent gripping damage.
Impact Test
The tensile impact test measures the amount of force needed to break a specimen
under a high speed tensile load introduced through a swinging pendulum.
The thickness and width of the test specimen is recorded. The specimen is then
clamped to the cross-head and placed into the pendulum. The pendulum is released and
allowed to strike the anvil breaking the specimen. The tensile impact energy is recorded and
then corrected impact energy is calculated. Type L specimens, with a gauge length of
9.53mm (0.375") provide a greater differentiation between materials. Equipment used is TMI
Impact Tester.
V. RESULTS AND DISCUSSIONS
Tensile Test
Tests were carried out at temperature of 23°C and humidity at 54% inside the
laboratory at rate of 10mm/min. Figure given below represent the flexural Stress versus strain
graph for 60% Epoxy + 40% E-glass fibre and 50% Epoxy + 50% E-glass fibre. The table
gives the values stresses and strains.
Fig.4 Tensile Stress – Strain Graph for Composition 1: 60% Epoxy + 40% E-glass fibre (light
red) and Composition 2: 50% Epoxy + 50% E-glass fibre (dark red)

International Journal of Design and Manufacturing Technology (IJDMT), ISSN 0976 –
6995(Print), ISSN 0976 – 7002(Online) Volume 4, Issue 1, January- April (2013), © IAEME
36
TABLE 3: Tensile test
Composition
1
Composition
2
Material 60% Epoxy-
40% E-glass
Fibre
50% Epoxy-
50% E-glass
Fibre
Tensile stress at
Maximum Load
(MPa)
120.43 152.14
Tensile stress at
Break (Standard)
(MPa)
62.00 150.78
Tensile stress at
Yield (MPa)
120.43 152.14
Tensile strain at
Yield (%)
6.65 8.48
Thickness (mm) 3.00 3.20
Width (mm) 24.65 23.28
Tensile strain at
Break (Standard)
(%)
6.83 8.49
Modulus (MPa) 2217.43 2609.91
Maximum Load
(N)
8906.27 11334.29
Load at Break
(Standard) (N)
4585.11 11233.13
Energy at
Maximum Load
(J)
22.76 29.32
Tensile strain at
Maximum Load
(mm/mm)
0.06 0.08
Tensile extension
at
Maximum Load
(mm)
5.59 6.62
Tensile extension
at
Break (Standard)
(mm)
5.73 6.62
Energy at Break
(Standard) (J)
24.06 29.42

International Journal of Design and Manufacturing Technology (IJDMT), ISSN 0976 –
6995(Print), ISSN 0976 – 7002(Online) Volume 4, Issue 1, January- April (2013), © IAEME
37
Flexural Test
Tests were carried out at temperature of 23°C and humidity at 50% inside the
laboratory. Figures given below represent the flexural Stress versus strain curve for 60%
Epoxy + 40% E-glass fibre and 50% Epoxy + 50% E-glass fibre and . The table gives the
values stresses and strains.
Fig.5 Flexural Stress – Strain Graph for Composition 1: 60% Epoxy + 40% E-glass fibre
Fig.6 Flexural Stress – Strain Graph for Composition 2: 50% Epoxy + 50% E-glass fibre

International Journal of Design and Manufacturing Technology (IJDMT), ISSN 0976 –
6995(Print), ISSN 0976 – 7002(Online) Volume 4, Issue 1, January- April (2013), © IAEME
38
TABLE 4: Flexural test
Composition
1
Composition
2
Material 60% Epoxy-
40% E-glass
Fibre
50% Epoxy-
50% E-glass
Fibre
Max. Load (N) 472.09 524.27
Max. Stress (MPa) 229.41 229.62
Flex Modulus
(MPa)
9268.03 10235.91
Flexure extension
at
Max. Flexure load
(mm)
4.45 4.34
Width (mm) 13.17 13.53
Thickness (mm) 3.75 4.05
Flexure stress at
Max Flexure load
(MPa)
229.41 229.62
Support Span
(mm)
60 64.80
Dynamic mechanical Analysis
Dynamic mechanical Analysis is a technique where a small deformation is applied to
a specimen in a cyclic manner. This allows the materials response to stress, temperature, and
frequency to be studied. The DMA determines changes in sample properties resulting from
changes in five experimental variables like temperature, time, frequency, force, and stress.
The deformation can be applied sinusoidal in nature, in a constant (or step fashion), or under
a fixed rate. In the above experiment stress was varies in a sinusoidal manner. The sample
was clamped between the ends of two parallel arms. The distance between the arms were
adjusted by means of a precision mechanical slide to accommodate a wide range of sample
length from less than 1mm up to 65 mm.
An electromechanical motor attached to one arm was used to drive the sample system
to a selected stress. The transformer mounted on the driven arm was used to measure the
sample response, strain and frequency as a function of the applied stress. The sample was
positioned in a temperature controlled chamber. The storage modulus, being in phase with the
applied stress, represents the elastic component of the material’s behaviour or its stiffness.
Higher the storage modulus higher is the elastic behaviour means it represents the amount of
energy stored in the material which deforms it.
Loss modulus represents the damping or tan delta is the ratio of loss modulus to
storage modulus and represents how well the material can get rid of the energy transferred to
it.

International Journal of Design and Manufacturing Technology (IJDMT), ISSN 0976 –
6995(Print), ISSN 0976 – 7002(Online) Volume 4, Issue 1, January- April (2013), © IAEME
39
Fig.7 DMA for Composition 1: 60% Epoxy + 40% E-glass fibre
As can be seen from figure 7 the storage modulus decreases (first gradually and then
drastically) with increase in temperature. This means that with increase in temperature the
stiffness of the material decreases. Tan delta represents how well can the material get rid of
the energy transferred to it. As can be seen from the graph at lower temperatures the value of
tan delta is very small. It rises gradually and is peak at 119.48°C and falls drastically after
that. This means that the material used is most suitable for application at temperatures above
80°C. The glass transition temperature is found to be 119.48°C.
Fig.8 DMA for Composition 2: 50% Epoxy + 50% E-glass fibre
As can be seen from figure 8 the storage modulus decreases (first gradually and then
drastically) with increase in temperature. This means that with increase in temperature the
stiffness of the material decreases. Tan delta represents how well can the material get rid of
the energy transferred to it. As can be seen from the graph at lower temperatures the value of
tan delta is very small. It rises gradually and is peak at 107.18°C and falls drastically after

International Journal of Design and Manufacturing Technology (IJDMT), ISSN 0976 –
6995(Print), ISSN 0976 – 7002(Online) Volume 4, Issue 1, January- April (2013), © IAEME
40
that. This means that the material used is most suitable for application at temperatures above
80°C. The glass transition temperature is found to be 107.18°C. Thus, two sheets of each
composition were manufactured. For each test 3 samples were cut out from the sheets. The
samples which gave the best result have been documented here. The reason for the variation
in the properties may be due to the defects like air entrapment, lack of complete curing and in
some places the lack of complete wetting of the fibres. A weight reduction of 88.95% is
achieved by using composite leaf spring (21.8gms in case of tensile test sample) in place of
spring steel leaf spring (198 g). This is the main basis of our experiment as we wanted to test
a material of less weight which in turn increases the efficiency the vehicle by reduction in its
unsprung weight.
Heat Deflection Test
The Heat Distortion Temperature is determined by the following test procedure
outlined in ASTM D648. The test specimen is loaded in three-point bending in the edgewise
direction. The outer fibre stress used for testing used was 1.82 MPa, and the temperature was
increased at 2 °C/min until the specimen deflected 0.254 mm. HDT test machine range is
between 20°C - 300°C. Based on the analysis it is found that Composition 1 60% Epoxy-40%
E-glass Fibre specimen is preferred in our application.
TABLE 5: Heat Deflection Test
Composition 1 Composition 2
Material 60% Epoxy-
40% E-glass
Fibre
50% Epoxy-
50% E-glass
Fibre
Depth (mm) 0.94 0.92
Width (mm) 4.40 3.80
Pressure (psi)
Applied
264 264
Load (grams) 575 485
Deflection
(mm)
0.114 0.254
Temperature
(°C)
289.3 283.9
Impact Test
The apparatus consists of a pendulum axe swinging at a notched sample of material.
The energy transferred to the material was noted down from a computer. Both the specimen
did not break.

International Journal of Design and Manufacturing Technology (IJDMT), ISSN 0976 –
6995(Print), ISSN 0976 – 7002(Online) Volume 4, Issue 1, January- April (2013), © IAEME
41
TABLE 6: Impact test
Composition 1 Composition 2
Material 60% Epoxy -
40%
E-glass Fibre
50% Epoxy - 50%
E-glass Fibre
ASTM A370
Dimensions
10mm x 3.3mm
x 55mm
10mm x 3.3mm x
55mm
Pendulum energy
(J)
2.74 2.74
Energy transferred
(J)
2.70 2.73
Impact Strength
(KJ/m2)
84.54 78.18
CONCLUSIONS
The various tests and analysis were performed on the two compositions. The materials
for spring steel and composite materials (60% Epoxy + 40% E-glass fiber and 50% Epoxy +
50% E-glass fiber) were chosen on the basis of costs and availability of the materials. Based
on the experimental tests the following conclusions can be drawn:
It was found that there was a weight reduction of 88.95% in composite leaf spring as
compared to conventional steel leaf spring. The maximum stiffness produced was found to be
66.9N/mm which is almost comparable to steel (76.68N/mm). Both composite samples
passed the heat deflection tests which prove their feasibility for practical use. Fatigue life was
found to be 10112 cycles as compared to 6164 cycles of steel spring. Moreover the natural
frequency was 1.3 times more than the 12Hz produced on road which decreases resonance
and hence increased rider comfort.
Overall from the above tests the 60% Epoxy + 40% E-glass fiber was found to be better than
the 50% Epoxy + 40% E-fiber glass. This can be seen from the Dynamic Mechanical Tests
where we got a higher transition temperature (119.8oC), lesser average storage modulus,
higher Tan D value and higher loss modulus.
REFERENCES
[1] Breadmore, P., Johnson, C.F., 1986. The potential for composites in structural
automotive applications. Composites Science and Technology, 26(4): 251-81.
[2] Kueh, J.J., Faris, T., 2011. Finite element analysis on the static and fatigue
characteristics of composite multi-leaf spring. Journal of Zhejiang University-Science A
(Applied Physics & Engineering) 2011.
[3] Lukin, P., Gasparyants, G., Rodionov, V., 1989. Automobile Chassis-Deign and
Calculations Moscow: MIR Publishers.
[4] Al-Qureshi, H.A., 2001. Automobile Leaf Springs from Composite Materials. Journal
of Materials Processing Technology 118(2001):58-61.
[5] Shokrieh, M.M., Rezaei, D., 2003. Analysis and Optimization of a Composite Leaf
Spring. Composite Structures 60 (2003): 317-325.

International Journal of Design and Manufacturing Technology (IJDMT), ISSN 0976 –
6995(Print), ISSN 0976 – 7002(Online) Volume 4, Issue 1, January- April (2013), © IAEME
42
[6] Pandey, P.C., 2004. Composite Materials. NPTEL [3.1.2 Civil Engineering] (2004).
[7] Vijayarangan, S., Alagappan, V., Rajedran, I., 1999. Design optimization of leaf
springs using genetic algorithms. Institution of Engineers India Mechanical Division, 79:
135-9. Shankar, G.S.S., Vijayarangan, S 2006.
[8] Mono Composite Leaf Spring for Light Weight Vehicle – Design, End Joint Analysis
and Testing. Materials Science. Vol.12, No 3, 2006.
[9]Shokrieh, M.M., Rezaei, D., 2003. Analysis and Optimization of a composite leaf spring.
Composite Structures 60(2003) 317-325.
[10] Kumar, M.S., Vijayarangan, S., 2006. Static Analysis and Fatigue Life Prediction of
Steel and Composite Leaf Spring for Light Passenger Vehicles. Journal of Scientific and
Industrial Research. Vol. 66, February 2007, pp 128-134.
[11] Hawang, W., Han, K.S. Fatigue of composites - Fatigue modulus concept and life
prediction, J.Com Materials 20 (1986) 154-165.
[12] Dr. Mala Thapar Kuthiala and Dr. Sadhana Mahajan, “Proposed Value Projection
Hierarchy Model for Fibreglass Reinforced Plastic (FRP) Products” International Journal of
Management (IJM), Volume 3, Issue 3, 2012, pp. 112 - 120, ISSN Print: 0976-6502,
ISSN Online: 0976-6510, Published by IAEME .