3 ECFE and School Readiness Funding Issues
20
3 ECFE and School Readiness Funding Issues SUMMARY Statewide, Early Childhood Family Education (ECFE) programs served 24 percent of children under age five in 1998-99 in weekly classes or home visits, and School Readiness programs served 32 percent of children ages three and four. The participation rates of individual districts varied widely, and there is no reliable statewide information on the extent of unmet needs for these programs. In 1999, two-thirds of districts had ECFE reserve fund balances that exceeded guidelines subsequently established by the Department of Children, Families, and Learning. The Legislature should consider the merits of various options for changing ECFE funding practices, including (1) restricting funding for districts with large ECFE fund balances; (2) reducing guaranteed minimum funding levels; and (3) allocating a portion of ECFE funding based on the actual number of persons served, not just the size of the eligible population. The Legislature should also consider establishing a reserve fund for School Readiness, and the department should monitor district ECFE and School Readiness finances more closely. As discussed in Chapter 1, Early Childhood Family Education (ECFE) and School Readiness are administered by local Minnesota school districts. This chapter examines these two programs in further detail, and it addresses the following questions: • To what extent are ECFE and School Readiness programs available throughout Minnesota, and is there evidence of unmet needs for services? To what extent does program enrollment vary around the state? • How are state funds for ECFE and School Readiness allocated? • What is known about the way districts spend ECFE and School Readiness funds? To what extent do districts have reserves of unspent funds? To answer these questions, we reviewed data collected by the Department of Children, Families, and Learning (CFL), including annual ECFE and School Readiness reports, Uniform Financial Accounting and Reporting Standards (UFARS) data, and revenue data. We also interviewed staff at CFL and in school districts across the state, and we conducted a survey of 41 ECFE and School Readiness programs regarding their fee structures.
Transcript of 3 ECFE and School Readiness Funding Issues

3ECFE and School ReadinessFunding Issues
SUMMARY
Statewide, Early Childhood Family Education (ECFE) programsserved 24 percent of children under age five in 1998-99 in weeklyclasses or home visits, and School Readiness programs served 32percent of children ages three and four. The participation rates ofindividual districts varied widely, and there is no reliable statewideinformation on the extent of unmet needs for these programs. In1999, two-thirds of districts had ECFE reserve fund balances thatexceeded guidelines subsequently established by the Department ofChildren, Families, and Learning. The Legislature should considerthe merits of various options for changing ECFE funding practices,including (1) restricting funding for districts with large ECFE fundbalances; (2) reducing guaranteed minimum funding levels; and (3)allocating a portion of ECFE funding based on the actual number ofpersons served, not just the size of the eligible population. TheLegislature should also consider establishing a reserve fund forSchool Readiness, and the department should monitor district ECFEand School Readiness finances more closely.
As discussed in Chapter 1, Early Childhood Family Education (ECFE) and SchoolReadiness are administered by local Minnesota school districts. This chapterexamines these two programs in further detail, and it addresses the followingquestions:
• To what extent are ECFE and School Readiness programs availablethroughout Minnesota, and is there evidence of unmet needs forservices? To what extent does program enrollment vary around thestate?
• How are state funds for ECFE and School Readiness allocated?
• What is known about the way districts spend ECFE and SchoolReadiness funds? To what extent do districts have reserves of unspentfunds?
To answer these questions, we reviewed data collected by the Department ofChildren, Families, and Learning (CFL), including annual ECFE and SchoolReadiness reports, Uniform Financial Accounting and Reporting Standards(UFARS) data, and revenue data. We also interviewed staff at CFL and in schooldistricts across the state, and we conducted a survey of 41 ECFE and SchoolReadiness programs regarding their fee structures.

ECFE PROGRAM AVAILABILITY ANDPARTICIPATION
ECFE has grown considerably since its start as a pilot program in six schooldistricts in 1974. We found that:
• All but 4 of Minnesota’s 347 school districts operated ECFE programsin 1999-2000.
The only districts that did not have an ECFE program were Walnut Grove,Butterfield, Franconia, and Prinsburg.1 Together, these districts reported only 122children under age five living within their boundaries in 1998-99. Some schooldistricts operate programs jointly with other districts, but officials from theDepartment of Children, Families, and Learning told us that each district thatparticipates in the program has at least one site within its boundaries where ECFEservices are provided.
To evaluate the level of participation in ECFE programs, we analyzed data thatschool districts report annually to CFL regarding the number of (1) ECFEparticipants, and (2) children in the district under age five. Specifically, weanalyzed the reported unduplicated number of persons participating in ECFEclasses or home visits during the 1998-99 year, and we excluded from our analysispersons reported as participating only in ECFE special events or activities.2 Wefound that:
• Statewide, about 24 percent of children under age five participated inECFE classes or home visits during 1998-99.
• Individual districts varied considerably in their reported participationlevels—from less than 10 percent of children under age five to morethan 50 percent.
Table 3.1 shows districts with more than 500 residents under age five that servedthe highest and lowest percentages of children in ECFE during 1998-99. Staff inthese districts provided a variety of explanations for their participation levels.Fergus Falls ECFE staff attributed the district’s high participation rate to itsrelatively short classes (some are only four weeks long) and its use ofnon-governmental grants to expand program offerings. Columbia HeightsECFE staff said that the district’s high reported level of participation in 1998-99was probably inaccurate, and more careful counts in 1999-2000 resulted in a60 percent decline in reported participation. In the Pipestone-Jasper district,ECFE-sponsored visits to the homes of all families with newborn children may
46 EARLY CHILDHOOD EDUCATION PROGRAMS
ECFE servicesare widelyavailablethroughoutMinnesota.
1 Franconia and Prinsburg are classified as “non-operating” districts – which means they do notoperate public schools.
2 Districts are supposed to annually report the unduplicated number of persons who participatedonly in ECFE special events or activities, but some district staff questioned whether these countsare as accurate as counts of persons in classes or home visits. CFL staff told us that, in trainingsessions, they have defined class or home visit participants as those persons who have participated inat least three visits or class sessions during the year. However, this has not been communicated todistricts in written instructions for the annual report, so it is unclear whether districts have definedparticipants in a consistent manner.
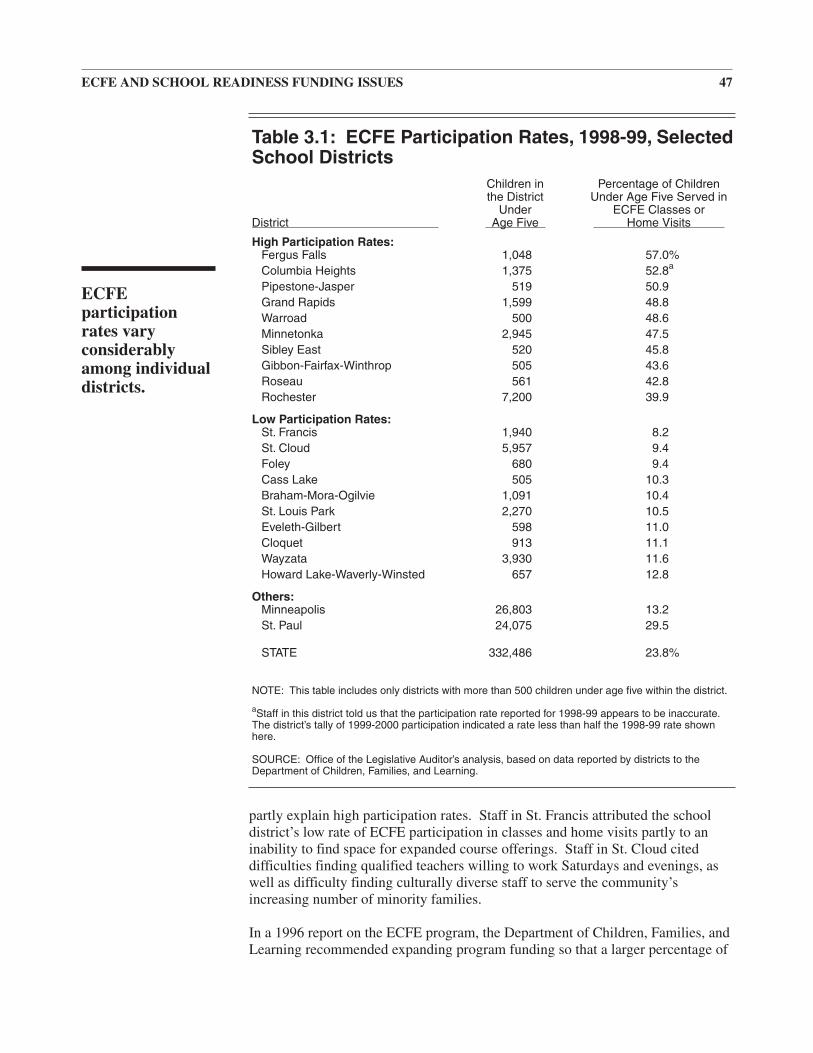
partly explain high participation rates. Staff in St. Francis attributed the schooldistrict’s low rate of ECFE participation in classes and home visits partly to aninability to find space for expanded course offerings. Staff in St. Cloud citeddifficulties finding qualified teachers willing to work Saturdays and evenings, aswell as difficulty finding culturally diverse staff to serve the community’sincreasing number of minority families.
In a 1996 report on the ECFE program, the Department of Children, Families, andLearning recommended expanding program funding so that a larger percentage of
ECFE AND SCHOOL READINESS FUNDING ISSUES 47
Table 3.1: ECFE Participation Rates, 1998-99, SelectedSchool Districts
Children in Percentage of Childrenthe District Under Age Five Served in
Under ECFE Classes orDistrict Age Five Home Visits
High Participation Rates:Fergus Falls 1,048 57.0%Columbia Heights 1,375 52.8a
Pipestone-Jasper 519 50.9Grand Rapids 1,599 48.8Warroad 500 48.6Minnetonka 2,945 47.5Sibley East 520 45.8Gibbon-Fairfax-Winthrop 505 43.6Roseau 561 42.8Rochester 7,200 39.9
Low Participation Rates:St. Francis 1,940 8.2St. Cloud 5,957 9.4Foley 680 9.4Cass Lake 505 10.3Braham-Mora-Ogilvie 1,091 10.4St. Louis Park 2,270 10.5Eveleth-Gilbert 598 11.0Cloquet 913 11.1Wayzata 3,930 11.6Howard Lake-Waverly-Winsted 657 12.8
Others:Minneapolis 26,803 13.2St. Paul 24,075 29.5
STATE 332,486 23.8%
NOTE: This table includes only districts with more than 500 children under age five within the district.
aStaff in this district told us that the participation rate reported for 1998-99 appears to be inaccurate.The district’s tally of 1999-2000 participation indicated a rate less than half the 1998-99 rate shownhere.
SOURCE: Office of the Legislative Auditor’s analysis, based on data reported by districts to theDepartment of Children, Families, and Learning.
ECFEparticipationrates varyconsiderablyamong individualdistricts.

the eligible population could be served. It said that “many families do notparticipate because they are experiencing complex and stressful family situations.Resources for more comprehensive services are of particular importance.”3
Likewise, a recent report by the Early Care and Education Finance Commissionsaid that “ECFE is unable to reach approximately 95,000 qualifying parents due toinsufficient funding.”4 However,
• Neither the Department of Children, Families, and Learning nor otherorganizations have systematically collected information that could beused to accurately assess the extent of unmet needs for ECFE servicesstatewide.
Some parents may benefit from ongoing, multi-year participation in ECFE whiletheir children are under age five; others may find that a semester of classes isadequate to meet their needs. Thus, without further evidence of unmet needs, it isnot clear that a program whose classes and home visits serve one-fourth ofeligible families in a given year (plus many other families through specialactivities) is underserving Minnesota’s population.
Presently, there is no reliable statewide information on the extent to whichfamilies interested in ECFE services have been unable to access them. Thedepartment did not collect information on local ECFE waiting lists prior to the1999-2000 school year. For 1999-2000, the department requested districts toreport the “estimated number of families on waiting lists,” but it did not specify aconsistent method of counting these families.5 Consequently, we do not think thatthe department’s information on local waiting lists is a reliable indicator of unmetneeds.
On a statewide basis, there is no clear evidence that ECFE is underservingfamilies with below-average incomes. Minnesota’s median household incomewas $47,240 in 1999, and surveys of 1998-99 ECFE participants showed that 40percent had incomes under $40,000 and 43 percent had incomes over $50,000.6
There may be instances where ECFE program fees have discouragedlower-income parents from enrolling, but state law requires school districts toestablish “reasonable” sliding fee schedules for these programs and to “waive the
48 EARLY CHILDHOOD EDUCATION PROGRAMS
There is noreliable statewideinformation toindicate whetherthere are unmetneeds for ECFEservices.
3 Marsha R. Mueller, Immediate Outcomes of Lower-Income Participants in Minnesota’sUniversal Access Early Childhood Family Education (St. Paul: Minnesota Department of Children,Families, and Learning, April 1996), 83.
4 Early Care and Education Finance Commission, The Action Plan for Early Care and Educationin Minnesota (Minneapolis, November 2000), 13.
5 The department requested this information in districts’ 1999-2000 annual ECFE reports.However, waiting lists likely fluctuate considerably during the school year, and the department didnot specify (1) a date during the reporting period that districts should use when reporting the size oftheir waiting lists, or (2) a method for ensuring that families on waiting lists are still interested inECFE services.
6 Participants are asked to report their incomes in specified ranges, so it is not possible todetermine the exact number of respondents with incomes above or below the state median householdincome. The number of participants reporting their household income in the ECFE participant sur-vey represented only 36 percent of the families who participated in ECFE classes or home visitsstatewide in 1998-99, so it is possible that the survey results do not accurately reflect the actualincome distribution among participating families.
fee for a participant unable to pay.”7 Most of the school district fee policies wereviewed clearly emphasized the option of fee waivers or reductions.
ECFE FUNDING ISSUES
BackgroundEarly Childhood Family Education started as a pilot program in 1974 with sixdistricts receiving grants totaling $230,000. In 1975, program size doubled and12 districts received a total of $500,000 in grants. ECFE continued to grow, bothin funding and number of programs until 1981, when appropriations were scaledback for the 1982-83 biennium. In 1983, the Legislature changed the ECFEfunding mechanism from allocating funds through competitive grants to allocatingfunds based on the number of children in each district; grants were also providedto districts to ease the transition to the new funding formula. Fiscal year 1986 wasthe first year ECFE funds were allocated solely through a statewide fundingformula.8 In 1986, districts received ECFE funding at the rate of $79.25 per childunder age five. Funding has since increased to the current per-child rate of$115.96 ($113.50 of base funding allowance plus $2.46 of additional state aid),but it has not kept up with inflation.9 Table 3.2 illustrates the per-child fundingrate for ECFE since 1986.10
In fiscal years 2000 and 2001, each school district received $115.96 for each childunder age five residing in the district on October 1 of the previous year.11 The lawsets a minimum level of district ECFE funding equivalent to the amount of basefunding that would be allocated if a district had 150 children under age five (infiscal year 2001, this equals 150 multiplied by $113.50, or $17,025). ECFErevenue is slated to increase to $120 per child for fiscal year 2002, which wouldincrease the minimum funding level for individual districts to $18,000 per year.
Districts generally receive ECFE aid according to the formula outlined in statute.However, some districts receive less than the statutory minimum funding if (1) theLegislature does not appropriate sufficient funding, resulting in a prorating of each
ECFE AND SCHOOL READINESS FUNDING ISSUES 49
For 2000 and2001, ECFEprogramsreceived about$116 in statefunds per eligiblechild.
7 Minn. Stat. (2000) §124D.13, subd. 6.
8 Minnesota Department of Children, Families, and Learning, History of Minnesota EarlyChildhood Family Education, Program Development (Roseville, MN, 1999) and Lois Engstrom,interview by author, Telephone conversation, Roseville, Minnesota, September 18, 2000.
9 In 1986, the Legislature provided funding to serve 20 percent of the eligible population in somecapacity. Program participation levels have increased since 1986, while state funding (in constantdollars) has not. Programs are now serving 24 percent of the eligible population through classes orhome visits and an additional 20 percent through special activities. Furthermore, in 1995 mostdistricts shifted community education Teachers Retirement Association (TRA) and FICAexpenditures from the general fund to program-specific funds such as ECFE and School Readiness.On average, TRA and FICA expenditures now comprise about 9 percent of these programs’ budgets.See Minn. Laws (1995) ch. 3, art. 4, sec. 15, subd. 1b and Minn. Stat. (2000) §123B.79, subd. 3.
10 The 1997 Legislature provided a one-time appropriation of $2 million to be used for grants toincrease services to families with children under one year of age. Minn. Laws (1997), ch. 162, art. 1,sec. 13 and sec. 18, subd. 7.
11 Minn. Stat. (2000) §124D.135, subd. 1; Minn. Laws (1999), ch. 205, art. 1, sec. 65; and Minn.Laws (2000), ch. 489, art. 1, sec. 26. Districts receive ECFE funding through a combination of stateaid and local levy.

district’s allocation, or (2) they “underlevy” for ECFE. If the Legislature does notappropriate enough revenue, CFL prorates the ECFE aid across all districts –including districts that are supposed to receive the statutory minimum fundinglevel. Due to prorating in fiscal year 1999, those districts that received theminimum level of ECFE funding actually received less than the $17,025 requiredby statute.12 Similarly, if a district does not levy the entire amount as required instatute, the ECFE aid must be reduced in proportion.13 In fiscal year 1999, onlyfour districts did not levy the entire amount required by law and thus receivedreduced ECFE state aid.14
Reserve FundsAs outlined in Minnesota statutes, school districts are required to use ECFE fundsonly for ECFE programming. In addition, all ECFE revenues received by theschool district, including state aid, levies, fees, and grants, must be maintained in
50 EARLY CHILDHOOD EDUCATION PROGRAMS
Table 3.2: ECFE Per-Child Funding Allowance,FY 1986-2001
ECFE Funding Inflation-AdjustedFiscal Year Per Child ECFE Allowance (2000 $)
1986 $ 79.25 $121.80
1987 79.25 119.47
1988 84.50 122.39
1989 84.50 117.02
1990 85.45 113.04
1991 87.75 110.22
1992 96.50 117.66
1993 101.25 119.82
1994 101.25 116.97
1995 101.25 113.66
1996 101.25 110.69
1997 101.25 107.67
1998 111.25 116.46
1999 113.50 116.90
2000a 115.96 115.96
2001a 115.96 N/A
aIncludes additional $2.46 per eligible child in special state ECFE aid.
SOURCE: Office of the Legislative Auditor’s analysis of Department of Children, Families, andLearning data. Adjusted for inflation using the CPI-W. Bureau of Labor Statistics, Consumer PriceIndex-Urban Wage Earners and Clerical Workers (2000); http://stats.bls.gov/top20.html; accessedSeptember 4, 2000.
School districtsmay use ECFEfunds only forECFE programs.
12 In 1999, 68 districts received less than $17,025 of ECFE funding due solely to prorating.
13 Minn. Stat. (2000) §124D.135, subds. 3-4.
14 Bird Island, Campbell, Detroit Lakes, and South Koochiching school districts did not fully levyfor ECFE in fiscal year 1999.

a reserve account for ECFE.15 By placing these funds in a reserve account, theyare protected from being used for any other school district program. We foundthat:
• In fiscal year 1999, many school districts had large ECFE reserve fundbalances.
In fiscal year 1999, over 20 percent of districts had ECFE reserve fund balancesequal to 100 percent or more of their annual state ECFE revenues. Reservefunds from these districts totaled almost $4 million in fiscal year 1999. About43 percent of districts had fund balances exceeding 50 percent of annual revenues,totaling over $7 million in fiscal year 1999. ECFE program staff at CFL do notsystematically monitor districts’ ECFE reserve fund balances. However, in fiscalyear 2000, CFL issued guidelines suggesting that districts maintain 8 to 17percent of annual ECFE revenue in their reserve fund.16 In 1999, two-thirds ofdistricts had reserve funds larger than 17 percent of annual revenue; reserve fundsfor these districts totaled over $12 million. Table 3.3 shows total ECFE revenuesand reserve fund balances for fiscal year 1999.
To better understand districts with large ECFE fund balances (equal to 100percent or more of annual revenues), we investigated how these districts differedfrom those with smaller reserve balances. Table 3.4 shows the average number ofECFE parent-child classes and participants for districts with small eligiblepopulations (150 or fewer ECFE-eligible children). For the most part, the data inTable 3.4 indicate that there are some real differences between small districts withlarge fund balances and small districts with small fund balances. Specifically, thedata in Table 3.4 illustrate that:
ECFE AND SCHOOL READINESS FUNDING ISSUES 51
Table 3.3: ECFE Revenues and Reserve Balances,FY 1999
Total ECFEPercentage Reserve Total ECFE
Districts with of Fund Balances RevenuesReserves Equal to: Number All Districts (in Millions) (in Millions)
Over 100 percent of annualECFE revenues 78 23% $ 3.9 $ 2.3
Over 50 percent of annualECFE revenues 146 43 7.1 7.2
Over 17 percent of annualECFE revenues 231 67 12.1 24.8
ALL DISTRICTS 343 100% $12.2 $37.7
SOURCE: Office of the Legislative Auditor’s analysis of Department of Children, Families, andLearning data.
Almostone-fourth ofdistricts haveECFE fundbalances greaterthan their annualECFE revenue.
15 Minn. Stat. (2000) §124D.135, subds. 5 and 7.
16 Betty Cooke, Debbykay Peterson, and Lois Engstrom, Early Childhood Family Initiatives Team,Minnesota Department of Children, Families, and Learning, to Early Childhood Family Education,School Readiness, and Way To Grow Coordinators, Early Childhood Family Education and SchoolReadiness Conference Information, General Information, and Program Updates, March 15, 2000,memorandum.

• In fiscal year 1999, ECFE programs in districts with 150 or fewerECFE-eligible children and large fund balances served fewer totalparticipants and offered fewer classes than similar-sized ECFEprograms with smaller fund balances.
For instance, small districts with large fund balances offered half as manyparent-child classes as comparably-sized districts with smaller fund balances.Likewise, small districts with large fund balances served less than half as manychildren as comparably-sized districts with smaller fund balances.17
Table 3.5 shows the median percentage of the ECFE-eligible population served bydistricts of varying sizes and with varying fund balances. The data in Table 3.5illustrate the importance of district size on a district’s ECFE program. As is clearfrom the table:
• Regardless of fund balance size, ECFE programs in districts with 150or fewer eligible children typically served a larger percentage of theeligible population than ECFE programs in districts with over 150eligible children.
Table 3.5 shows that there is little difference among districts of the same sizeregarding the median percentage of eligible children served. However, there is anoticeable difference when comparing districts with ECFE-eligible populations of150 or fewer to districts with larger eligible populations. In fiscal year 1999, themedian small district served about 40 percent of the eligible population throughclasses or home visits and 67 percent in some capacity. At the same time, themedian district with more than 150 eligible children served 26 percent of theeligible population through classes or home visits and 45 percent in some
52 EARLY CHILDHOOD EDUCATION PROGRAMS
Table 3.4: ECFE Parent-Child Classes andParticipants in Districts with 150 or Fewer ECFE-Eligible Children, FY 1999
Large Fund Small FundBalance BalanceN = 29 N = 43
Average number of parent-child classes 15.8 31.9Average number of participants under age five 70.2 144.2Average number of parent participants 74.0 86.7
NOTE: “Large fund balances” are defined as reserve funds equal to 100 percent or more of annualECFE revenues. “Small fund balances” are defined as reserve funds equal to less than 100 percent ofannual ECFE revenues.
SOURCE: Office of the Legislative Auditor’s analysis of Department of Children, Families, andLearning data.
Among smalldistricts, thosewith large ECFEfund balancesserved fewerfamilies thanthose withsmaller balances.
17 Our analysis indicates that districts with 150 or fewer ECFE-eligible children and small fundbalances offered more parent-child classes per capita than did similar-sized districts with larger fundbalances. Likewise, these small districts with small fund balances served more parents and childrenper capita than similar-sized districts with larger fund balances.

capacity. In sum, districts with 150 or fewer eligible children served asignificantly larger portion of the eligible population than did larger districts.
In our view, the Legislature should consider possible changes in the ECFEfunding formula to address the large reserve fund balances that many districtshave. We recommend that the Legislature consider the following policy options:
RECOMMENDATION
The Legislature should consider (1) restricting ECFE funding for districtswhose reserve fund balances exceed a certain level; (2) eliminating orreducing the minimum funding level in the ECFE law; or (3) allocating aportion of ECFE funding based on the actual number of persons served, notjust the size of the eligible population.
The first option would place a cap on ECFE reserve fund balances and adjustannual allocations to reflect this limit. If limits were placed on ECFE reservebalances, funding that would otherwise go to the capped districts could beredirected to districts with smaller fund balances or higher demand for services.We think it was appropriate for the Department of Children, Families, andLearning to issue guidelines to districts on suitable reserve levels, butincorporating reserve fund policies directly into the ECFE funding formula mightencourage greater compliance. This option would require the department toincrease its oversight of district fund balances.
ECFE AND SCHOOL READINESS FUNDING ISSUES 53
Table 3.5: Median Percentage of ECFE-EligiblePopulation Served, FY 1999
Districts with Districts with150 or Fewer More Than 150 All
ECFE-Eligible Children ECFE-Eligible Children DistrictsLarge Fund Small Fund Large Fund Small Fund
Balance Balance Balance BalanceN = 29 N = 43 N = 42 N = 193 N = 307
Median percentageof eligible childrenserved in classes orhome visits 39% 42% 25% 26% 28%
Median total percentageof eligible childrenserved in classes,home visits, or specialactivities. 68 67 39 47 49
NOTE: “Large fund balances” are defined as reserve funds equal to 100 percent or more of annualECFE revenues. “Small fund balances” are defined as reserve funds equal to less than 100 percent ofannual ECFE revenues.
SOURCE: Office of the Legislative Auditor’s analysis of Department of Children, Families, andLearning data.
Small districtsserved a largerpercentage of theECFE-eligiblepopulation thandid largerdistricts.
The Legislatureshould considerseveral optionsfor revising theECFE fundingformula.

Limits on districts’ reserve funds may conflict with local school district policies.For example, one district with an ECFE fund balance equal to 42 percent ofannual revenues told us that district policy requires a fund balance equal to at least30 percent of annual expenditures. Another district with a fund balance equal to26 percent of annual revenues told us that it is building new space for the ECFEprogram, which will be available in 2003; the district is maintaining a large fundbalance in anticipation of the transition to the new facilities.
The second option would eliminate or reduce the minimum ECFE funding levelguaranteed in statute.18 This provision of law was supposed to ensure that thestate’s smallest districts could provide at least a basic ECFE program for theirdistrict. However, the data indicate that 29 of the 72 programs that receive theminimum ECFE funding level have accumulated at least one year’s worth of
funding in reserve while also typically serving a larger portion of their eligiblepopulation than most districts in the state. The other 43 districts receiving thestate’s minimum funding also generally serve above-average percentages of theirresidents in ECFE, and only 17 of these districts had fund balances in fiscal year1999 that were less than 17 percent of their annual revenues. In sum, the state’ssmallest districts have typically had high participation rates in their programs,often combined with the accumulation of large fund balances. Staff in one smalldistrict with a large ECFE reserve balance told us that the district has usedECFE-dedicated funds for non-ECFE purposes, although we did notindependently confirm this. Staff in several other small districts told us they arehaving difficulty recruiting additional families to participate in ECFE – mainlydue to lack of parent interest, not lack of funding. On the other hand, it is possiblethat reducing the minimum funding level could cause hardship for those smalldistricts that do not have large ECFE reserve fund balances.
54 EARLY CHILDHOOD EDUCATION PROGRAMS
Districts thatreceive theminimumguaranteedlevel of ECFEfunding typicallyhave highparticipationrates and fundbalanceslarger thanrecommendedby CFL.
18 In fiscal year 1999, districts with less than 150 ECFE-eligible children received a total of$607,000 in additional ECFE funds as a result of the guaranteed minimum funding level.

The third option would allocate a portion of ECFE funding based on the numberof children and parents served, rather than allocating all funding based on thenumber of eligible participants. Funding programs based on population servedwould likely limit the amount of reserve funds districts could accrue since fundingwould be linked to services provided. While this would be a change from thecurrent ECFE funding formula, it would more closely parallel Minnesota’s K-12funding system.19 In addition, funding ECFE based on population served wouldprovide an incentive for programs to enroll families.
In 1984, the Minnesota Council on Quality Education issued a report on ECFEfunding options. The council said that, over the long term, policy makers shouldconsider allocating ECFE funds on the basis of measures other than the number ofeligible children in each district. It suggested eventually changing the fundingmechanism to a formula based on actual participation. Specifically, the reportstated, “In the judgment of the Council, [funding based on eligible population]should be allowed for a five year maximum in the case of a new program. Afterthat, a district’s aid should be linked to actual participation.”20
Adoption of a participant-based funding formula would require the Legislature orCFL to determine what constitutes a program participant for funding purposes.For example, guidelines would have to be established on how, if at all, to count theparticipation of a family that attends only one class or special activity. Allocatingfunding based on population served would also require CFL to more diligentlymonitor district-reported participation levels. The participation data are notaudited for accuracy by CFL, and some districts told us they questioned theaccuracy of their reported levels of participation in ECFE special activities.Finally, the Legislature or CFL would have to determine a new per-child fundingrate to fairly compensate districts for the ECFE programs provided.
SCHOOL READINESS PROGRAMAVAILABILITY AND PARTICIPATION
The Legislature started the School Readiness program in 1991, and the number ofparticipating school districts has grown considerably since then. In fact,
• All but six of Minnesota’s school districts operated state-fundedSchool Readiness programs in 1999-2000.
The only districts that did not participate in School Readiness were Farmington,Lyle, Pine Point, New Richland-Hartland-Ellendale-Geneva, Franconia, andPrinsburg.21 Together, these districts reported 1,795 children under age five within
ECFE AND SCHOOL READINESS FUNDING ISSUES 55
Funding ECFEbased onpopulationserved wouldrequire increasedmonitoring ofdistrict-reportedparticipationlevels.
19 The primary component of Minnesota’s K-12 funding formula, the basic education revenue,equals the per-pupil allowance multiplied by the actual pupil units in each district for the schoolyear. For more information, see Minnesota School Finance, A Guide for Legislators (St. Paul:Minnesota House of Representatives Research Department, December 1998), 20.
20 Council on Quality Education, Study of Alternate Funding Formulas for Early Childhood andFamily Education (St. Paul, February 1984), 45.
21 Franconia and Prinsburg are classified as “non-operating” districts, which means they do notoperate public schools.
their boundaries in 1998-99. Department of Children, Families, and Learningstaff told us that all districts with School Readiness programs have at least oneprogram site within their boundaries, even in cases where the district operates ajoint program with another district.
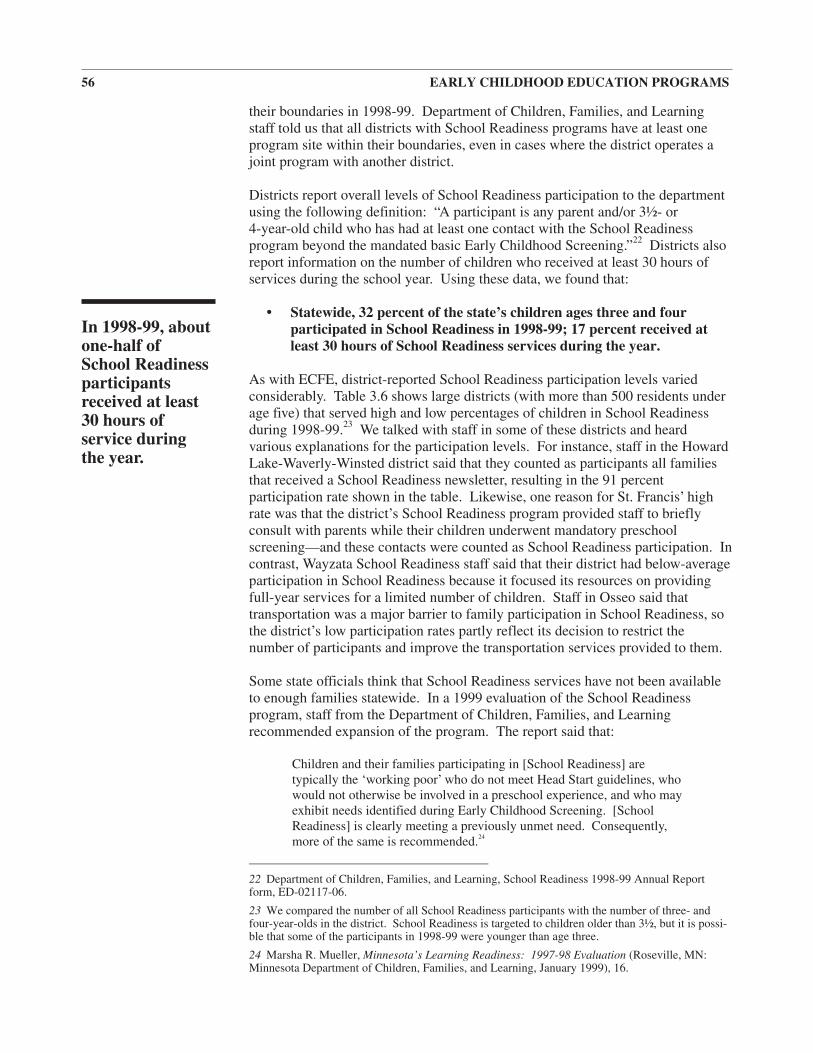
Districts report overall levels of School Readiness participation to the departmentusing the following definition: “A participant is any parent and/or 3½- or4-year-old child who has had at least one contact with the School Readinessprogram beyond the mandated basic Early Childhood Screening.”22 Districts alsoreport information on the number of children who received at least 30 hours ofservices during the school year. Using these data, we found that:
• Statewide, 32 percent of the state’s children ages three and fourparticipated in School Readiness in 1998-99; 17 percent received atleast 30 hours of School Readiness services during the year.
As with ECFE, district-reported School Readiness participation levels variedconsiderably. Table 3.6 shows large districts (with more than 500 residents underage five) that served high and low percentages of children in School Readinessduring 1998-99.23 We talked with staff in some of these districts and heardvarious explanations for the participation levels. For instance, staff in the HowardLake-Waverly-Winsted district said that they counted as participants all familiesthat received a School Readiness newsletter, resulting in the 91 percentparticipation rate shown in the table. Likewise, one reason for St. Francis’ highrate was that the district’s School Readiness program provided staff to brieflyconsult with parents while their children underwent mandatory preschoolscreening—and these contacts were counted as School Readiness participation. Incontrast, Wayzata School Readiness staff said that their district had below-averageparticipation in School Readiness because it focused its resources on providingfull-year services for a limited number of children. Staff in Osseo said thattransportation was a major barrier to family participation in School Readiness, sothe district’s low participation rates partly reflect its decision to restrict thenumber of participants and improve the transportation services provided to them.
Some state officials think that School Readiness services have not been availableto enough families statewide. In a 1999 evaluation of the School Readinessprogram, staff from the Department of Children, Families, and Learningrecommended expansion of the program. The report said that:
Children and their families participating in [School Readiness] aretypically the ‘working poor’ who do not meet Head Start guidelines, whowould not otherwise be involved in a preschool experience, and who mayexhibit needs identified during Early Childhood Screening. [SchoolReadiness] is clearly meeting a previously unmet need. Consequently,more of the same is recommended.24
56 EARLY CHILDHOOD EDUCATION PROGRAMS
In 1998-99, aboutone-half ofSchool Readinessparticipantsreceived at least30 hours ofservice duringthe year.
22 Department of Children, Families, and Learning, School Readiness 1998-99 Annual Reportform, ED-02117-06.
23 We compared the number of all School Readiness participants with the number of three- andfour-year-olds in the district. School Readiness is targeted to children older than 3½, but it is possi-ble that some of the participants in 1998-99 were younger than age three.
24 Marsha R. Mueller, Minnesota’s Learning Readiness: 1997-98 Evaluation (Roseville, MN:Minnesota Department of Children, Families, and Learning, January 1999), 16.

ECFE AND SCHOOL READINESS FUNDING ISSUES 57
Table 3.6: School Readiness Participation Rates,1998-99, Selected School Districts
Percentage of ChildrenAges Three and Four Served in
Children in 30 or Morethe District Any School Hours of SchoolAges Three Readiness Readiness
District and Four Activity Activities
High Participation Rates:Howard Lake-Waverly-Winsted 304 90.8% 32.9%Waseca 371 74.7 19.4Burnsville 2,201 74.3 43.4Monticello 565 73.1 15.2St. Francis 905 72.7 24.3Watertown-Mayer 282 70.6 6.7Pine River-Backus 200 66.0 41.0Warroad 192 65.6 65.6Grand Rapids 638 65.4 22.6Stewartville 250 65.2 65.2
Low Participation Rates:Farmington 701 0.7 0.7Edina 976 4.0 *Osseo 3,670 5.5 *St. Cloud 2,269 5.8 1.9Cannon Falls 218 6.4 6.4Cloquet 399 7.0 7.0St. Louis Park 908 7.3 6.7Brainerd 1,107 7.5 7.1White Bear Lake 1,350 9.0 8.6Wayzata 1,572 9.5 2.2
Others:Minneapolis 10,057 15.8 7.9St. Paul 9,679 31.7 12.6
STATE 137,930 31.6% 16.7%
NOTE: This table includes only districts with more than 500 children under age five within the district.The districts shown had the highest and lowest participation rates, based on participation in at leastone activity during the year. We excluded three districts that reported overall participation rates ex-ceeding 100 percent of the district’s number of three- and four-year-olds.
*Data for Edina and Osseo are not shown because the number of children the district reported withmore than 30 hours of School Readiness services exceeded the total number of children reportedparticipating in any activity.
SOURCE: Office of the Legislative Auditor’s analysis, based on data reported by districts to theDepartment of Children, Families, and Learning.

However, while we agree that the School Readiness program has helped to fillgaps that would otherwise exist in Minnesota’s system of prekindergartenservices,
• The Department of Children, Families, and Learning has notsystematically documented the extent to which families interested inSchool Readiness services have been unable to access them.
The department does not collect information on School Readiness waiting lists orother measures of unmet needs. Data presented earlier indicate that schooldistricts vary in School Readiness participation levels, but the reasons for thisvariation are not always apparent. In general, it is difficult to quantify the levelsof School Readiness services that are being provided and objectively evaluatewhether these service levels are sufficient to meet the state’s needs.25
It is also difficult to determine whetherSchool Readiness services have beensufficiently available to low-incomefamilies. State law allows (but does notrequire) school districts to charge feesfor School Readiness, using a slidingscale. The law says that the fees mustbe set at a level that enables “eligiblechildren of all socioeconomic levels toparticipate in the program.”26 The lawalso requires districts to waive fees forparticipants unable to pay. It ispossible that districts’ fees areprohibitive for some families, but thiscould not be determined without anin-depth review of the way the feeschedules have actually been applied.In 1998-99, districts reported that26 percent of parents in SchoolReadiness programs paid the full feescharged by districts, 15 percent paidreduced fees, and 59 percent paid no
fees.27 CFL’s statewide information systems do not contain reliable data on thetotal fee revenues collected by districts, nor does CFL have information on therates charged by each district.
58 EARLY CHILDHOOD EDUCATION PROGRAMS
In 1998-99, overone-half offamiliesparticipating inSchool Readinesspaid no fees.
25 State law requires individual School Readiness programs to develop a comprehensive plan “toanticipate and meet the needs of participating families.” There is no comparable statewide plan orneeds assessment.
26 Minn. Stat. (2000) §124D.15, subd. 12.
27 In surveys of School Readiness participants by CFL, 70 percent of respondents during 1998-99reported household incomes of $50,000 or less, and the state median household income in 1999 was$47,240. However, the number of participants reporting their household income in the voluntarySchool Readiness participant survey represented only 28 percent of the parents who participated inSchool Readiness in 1998-99. Thus, it is possible that the survey results do notaccurately reflect the actual income distribution among participating families.

We reviewed the 1999-2000 fee schedules of 41 districts. Eleven of these districtscharged no fees for their ongoing School Readiness programs. At the otherextreme, the Rosemount-Apple Valley-Eagan School District charged $130 permonth to families with a child in School Readiness preschool three days per week.
SCHOOL READINESS FUNDING ISSUES
In recent years, many states have implemented (or expanded) publicly-fundedprekindergarten programs other than Head Start. A recent Children’s DefenseFund study examined prekindergarten programs that focus primarily on theeducation of children, and it found that:
• Minnesota (with its School Readiness program) is one of 36 states plusthe District of Columbia that have state-funded prekindergartenprograms other than Head Start.28
Three states have “universal” preschool programs; that is, they are not specificallytargeted to at-risk children or children from low-income families. Georgia’sprogram, funded with more than $200 million per year in lottery proceeds, is opento all four-year-olds in the state, and funding has generally been sufficient toaccommodate all families wishing to participate. Two other states (New York andOklahoma) and the District of Columbia also have universal eligibility for theirpreschool programs, but participation has been limited by funding levels.Minnesota is 1 of 14 states that allow children to enroll in prekindergartenprograms (specifically, School Readiness) before they are four years old.29
In Chapter 2, we noted that Minnesota’s state spending for Head Start was largerthan that of most states. In contrast, state spending for Minnesota’s other“kindergarten readiness” program (School Readiness) has not been as generous,compared with similar programs in other states. We found that:
• In 1998-99, Minnesota spent $32 per state resident under age five onthe School Readiness program, ranking 24 among the 50 states inspending for public preschool programs other than Head Start.
Heading the list were Georgia ($374 per resident under age five), Massachusetts($200), Connecticut ($179), Oklahoma ($157), Illinois ($155), Kentucky ($153),and Texas ($143).30 Minnesota’s combined spending for School Readiness andHead Start ($90 per state resident under age five) was the fourteenth highestamong states.
ECFE AND SCHOOL READINESS FUNDING ISSUES 59
Minnesota’sfunding forSchool Readinessis modestcompared withsome states’funding forsimilarprograms.
28 Karen Schulman, Helen Blank, and Danielle Ewen, Seeds of Success: State PrekindergartenInitiatives, 1998-1999 (Washington, D.C.: Children’s Defense Fund, 1999), 30-31 and 179-209.This includes states that have kindergarten programs for four-year-olds.
29 Ibid., xiii, 27-36, and 59-69.
30 Spending data are from Schulman and others, Seeds of Success, 30-31; July 1999 estimates ofstate residents under age five are from the U.S. Census Bureau (http://www.census.gov/population/estimates/state/st-99-09.txt; accessed November 1, 2000). The spending data are for child-focusedprograms only and exclude parent-focused programs such as ECFE. In 1998-99, the ECFE stateappropriation per Minnesota resident under age five (not including local levies) was $43.85.

The Minnesota Legislature first appropriated funding for School Readiness(then called Learning Readiness) for the 1991-92 program year, and 365 of the425 districts (86 percent) participated in School Readiness that year.31 TheLegislature intended the initial $8 million in state funding to be used for start-upcosts of the program and did not establish ongoing funding until fiscal year1994.32 Funding has increased slightly since 1994, although it has remainedrelatively flat once adjusted for inflation. Table 3.7 illustrates the funding historyfor School Readiness through fiscal year 2001.
Minnesota allocates School Readiness funds to school districts based 50 percenton the number of four-year-old children in the district and 50 percent on thenumber of pupils in the district eligible for free or reduced-price school lunch.Unlike the ECFE funding formula, there is no minimum funding level for SchoolReadiness programs. As a result, in fiscal year 1999, 134 districts received lessthan $10,000 in School Readiness funding and 56 districts received less than$5,000 (the lowest funding for a program was $1,200). Because local or statewidechanges in the number of four-year olds or the number of children receiving freeand reduced-price lunch can change School Readiness aid allocations, state anddistrict staff told us it is difficult to predict the actual funding available for the
60 EARLY CHILDHOOD EDUCATION PROGRAMS
Table 3.7: School Readiness Funding, FY 1992–2001Total School Adjusted for
Readiness Funding Inflation (2000 $)Fiscal Year (in Millions) (in Millions)
1992 $ 8.0 $ 9.81993 0.0 0.01994 9.5 11.01995a 11.0 12.41996 9.5 10.41997 9.5 10.11998b 10.2 10.71999 10.4 10.72000 10.4 10.42001 10.4 N/A
aIn fiscal year 1995, a $1.5 million grant (allocated to all participating districts) was added to theSchool Readiness grant as part of violence prevention initiatives. This is included in the 1995 fundinglevel reported in this table.
bIn fiscal year 1998, $80,000 in one-year grants was given to Greenway and Fergus Falls schooldistricts for special purposes. This is not included in the 1998 funding level reported in this table.
SOURCE: Minnesota Department of Children, Families, and Learning, Minnesota Public SchoolsOverview of Learning Readiness Program Participation, Funding, and Services January 1992-January1999 (Roseville, MN, 1999). Adjusted for inflation using the CPI-W. Bureau of Labor Statistics,Consumer Price Index-Urban Wage Earners and Clerical Workers (2000);http://stats.bls.gov/top20.html; accessed September 4, 2000.
School Readinessfunding hasremainedrelatively flat,once adjusted forinflation.
31 Minnesota Department of Children, Families, and Learning, “1995 Update: Learning Readinessin Minnesota Public Schools;” http://www.cyfc.umn.edu/children/learnready.html; accessed June 2,2000.
32 The Legislature allocated $20 million for School Readiness for 1993, but the governor vetoedthis appropriation.

program. In fact, a firm budget number is generally not available to districts untilafter the program year has concluded.33
Minnesota statutes require school districts to use School Readiness funds only forSchool Readiness programming and transportation. State law also requiresdistricts to keep School Readiness funding in a separate account.34 However,unlike ECFE, there is no statewide reserve fund for this purpose. As a result,there is no way to verify that districts are maintaining the integrity of SchoolReadiness funds. CFL staff told us that establishing a reserve fund for SchoolReadiness would be useful and would guarantee the preservation of SchoolReadiness funding for the intended programs. Establishing another reserve fundmight increase the administrative burden for districts and CFL. However, it wouldbe reasonable to expect CFL to monitor districts’ School Readiness fund balanceson an ongoing basis, particularly in light of the large balances some districts haveaccumulated in their ECFE programs. Establishing a School Readiness reservefund would provide an additional level of program oversight for SchoolReadiness.
RECOMMENDATION
The Legislature should consider establishing a reserve fund for SchoolReadiness – similar to that established for ECFE.
STATE MONITORING OF DISTRICTFINANCES
ExpendituresSchool districts use the Uniform Financial Accounting and Reporting Standards(UFARS) computer system to report a variety of financial data, including ECFEand School Readiness program expenditures and account balances. Althoughquestions about the accuracy of UFARS data have been raised in the past, thisremains the primary tool that state officials have to monitor school districtspending.35
We reviewed fiscal year 1999 UFARS expenditure data, by district, for SchoolReadiness and ECFE. Several districts reported no expenditures, or very fewexpenditures, for either School Readiness or ECFE, despite receiving programrevenue and providing the services. For example, 15 districts reported no School
ECFE AND SCHOOL READINESS FUNDING ISSUES 61
Several districtsreported noexpenditures forECFE or SchoolReadinessalthough theyhad receivedrevenueearmarked forthe program.
33 Greg Sogaard, Program Finance – Education Finance and Debbykay Peterson, Early ChildhoodFamily Initiatives, Minnesota Department of Children, Families, and Learning, to School ReadinessCoordinators and Community Education Directors, School Readiness Aid Entitlement, September10, 1999, memorandum.
34 Minn. Stat. (2000) §124D.16, subds. 3-4.
35 For example, see Office of the Legislative Auditor, School District Spending (St. Paul, February1990).

Readiness expenditures, even though they received School Readiness revenueranging from $1,800 to $63,700. An additional 33 districts reported spending lessthan 50 percent of their School Readiness revenue in fiscal year 1999. Onedistrict reported only $339 in 1999 School Readiness expenditures, even thoughthe district received over $1 million in School Readiness funding.
CFL staff could not explain the discrepancies between the expenditure andrevenue data for ECFE or School Readiness. Staff who administer these programsdo not make substantial use of UFARS data to monitor ECFE or School Readinessexpenditures. In addition, CFL’s early childhood program staff have not workedwith the agency’s finance and management staff to systematically monitor thefinancial status of districts’ programs. As a result, CFL staff may be missingopportunities to oversee district spending practices and perhaps improve localprograms. For example, if CFL finance and management staff regularly providedCFL program staff with information on districts that have spent less than 50percent of their School Readiness funding in a given year, program staff mighthelp these districts develop strategies to recruit more families or offer moreservices. In this and other ways, we found that:
• The Department of Children, Families, and Learning provides littleoversight of districts’ ECFE and School Readiness expenditures.
Staff who administer the ECFE and School Readiness programs rely largely onpersonal contacts and districts’ annual reports to obtain information on ECFEprogram operations. However, districts are not required by law to submit ECFEannual reports (11 of the 346 participating districts did not submit them in1998-99), and these reports do not include program expenditure information.Districts are required by law to submit biennial School Readiness plan updates,and CFL staff review the content of these documents. These updates includeforecasted budget estimates, but they do not provide actual expenditureinformation.
In our view, CFL program staff should take further advantage of the data alreadycollected by the department through the UFARS computer system. Ourcomparisons of district expenditure and revenue data raise questions about theconsistency and reliability of UFARS expenditure data. However, additionaloversight from CFL’s ECFE and School Readiness staff would likely improve thequality and use of the UFARS data.
RECOMMENDATION
The Department of Children, Families, and Learning early childhoodprogram staff should use the data collected through UFARS to monitordistricts’ ECFE and School Readiness expenditures and programs.
Reserve Fund BalancesIn fiscal year 2000, as noted earlier, CFL staff published guidelines suggestingthat districts maintain an ECFE reserve fund balance equal to between 8 and 17percent of their annual ECFE revenues. Two-thirds of districts had an ECFE fund
62 EARLY CHILDHOOD EDUCATION PROGRAMS
CFL programstaff shouldmake further useof the spendingdata collectedthrough UFARS.

balance in fiscal year 1999 that exceeded 17 percent of annual ECFE revenues.Large reserve funds have only recently come to the attention of CFL staff, andthere is little oversight of these balances. CFL asked districts to report reservefund balance data in their fiscal year 2000 ECFE annual reports – the first time thedepartment has requested this information in the annual reports. However, CFLalready collects this data through UFARS. We spoke with a number of districtsregarding their ECFE reserve fund balances over the course of this evaluation.Districts consistently confirmed the accuracy of the reserve fund data containedwithin the UFARS system. In our view, ECFE program staff could use theexisting UFARS data on an ongoing basis to identify districts with large reservebalances and work with them to better use their ECFE funding.
While many districts have large ECFE fund balances, we found that a number ofother districts have negative ECFE fund balances. CFL’s Uniform FinancialAccounting and Reporting Standards manual states that the ECFE “reserveaccount is not allowed to go into deficit.”36 Despite these UFARS guidelines:
• About 25 percent of all districts with an ECFE program had anegative ECFE fund balance during at least one of the three years weexamined (fiscal years 1997, 1998, and 1999).
In addition, 24 districts had a negative ECFE fund balance in all three years weexamined (1997 through 1999). Among the 346 districts that offered an ECFEprogram in 1999, 46 had a negative ECFE fund balance.37 Half of these 46districts experienced a worsening fund balance between fiscal years 1997 and1999.
Our discussions with district staff indicated that many districts are unaware thatthe UFARS guidelines do not allow negative ECFE fund balances. Furthermore,ECFE program staff at CFL were not familiar with the UFARS guidelines thatdiscourage negative ECFE fund balances. CFL program staff indicated thathaving a negative ECFE balance is an acceptable occurrence and that districtsallocate community or general education funding to cover any negative balance.While a negative fund balance is most likely the result of faulty bookkeeping, itcould be an indication of a more serious problem. As with the large fundbalances, data on negative fund balances are available through the UFARSreporting system and should be used by the ECFE program staff at CFL.
To address problems with both large and negative ECFE fund balances, werecommend the following:
ECFE AND SCHOOL READINESS FUNDING ISSUES 63
Many districtshave negativeECFE fundbalances.
36 Minnesota Department of Children, Families, and Learning, UFARS Manual, Balance SheetAccounts (Roseville, MN, July 2000), 18-19.
37 Districts are treated separately for financial purposes, regardless of whether they sharedprograms or administrative responsibilities with other districts.

RECOMMENDATION
The Department of Children, Families, and Learning should use the datacollected through UFARS to monitor districts’ ECFE fund balances andwork with districts to resolve any problems.
Fee SchedulesAs discussed earlier, school districts may establish a sliding fee scale for SchoolReadiness programs and are required by law to have a sliding fee scale for ECFEprograms.38 For both of these programs, fees must be waived for any participantunable to pay. In general, we found that:
• There is little oversight of districts’ ECFE and School Readiness feeschedules.
Currently, CFL program staff collect data on forecasted School Readiness feerevenues through districts’ biennial plan updates; they do not have reliableinformation on actual fee revenues collected. CFL also does not collect anyinformation on the levels of ECFE program fees paid by participants. Withoutadditional data on fee revenues, CFL cannot get an accurate picture of how muchtotal revenue districts have available for ECFE or School Readiness programs. Inaddition, without information on variation in districts’ fee revenues, it is difficultto assess whether districts’ fees pay for portions of total program costs that are toolarge or too small. We surveyed 41 districts across the state to learn about theirECFE and School Readiness fee schedules and found a large range in feescharged. However, 6 of the 41 districts reported that they charge no fees forECFE, despite the requirement in law that every district establish an ECFE slidingfee scale. CFL program staff should work with such districts to create anappropriate fee scale.
RECOMMENDATION
The Department of Children, Families, and Learning should monitordistricts’ ECFE and School Readiness fee schedules to ensure compliancewith state law. The department should also collect accurate information onthe total fee revenues actually collected for these programs.
64 EARLY CHILDHOOD EDUCATION PROGRAMS
38 Minn. Stat. (2000) §124D.15, subd. 12 and Minn. Stat. (2000) §124D.13, subd. 6.