3-D CENTERLINE EXTRACTION OF AXONS IN CONFOCAL MICROSCOPIC...
58
3-D CENTERLINE EXTRACTION OF AXONS IN CONFOCAL MICROSCOPIC STACKS A Thesis Presented by Ranga Sharath Srinivasan to The Department of Electrical And Computer Engineering in partial fulfillment of the requirements for the degree of Master of Science in Electrical and Computer Engineering Northeastern University Boston, Massachusetts December 2006
-
Upload
phungtuyen -
Category
Documents
-
view
214 -
download
1
Transcript of 3-D CENTERLINE EXTRACTION OF AXONS IN CONFOCAL MICROSCOPIC...

3-D CENTERLINE EXTRACTION OF AXONS IN CONFOCAL MICROSCOPIC STACKS
A Thesis Presented by
Ranga Sharath Srinivasan
to
The Department of Electrical And Computer Engineering
in partial fulfillment of the requirements for the degree of
Master of Science
inElectrical and Computer Engineering
Northeastern UniversityBoston, Massachusetts
December 2006

NORTHEASTERN UNIVERSITYGraduate School of Engineering
Thesis Title: 3-D centerline extraction of axons in confocal microscopic stacks.
Author: Ranga Sharath Srinivasan
Department: Electrical and Computer Engineering.
Approved for Thesis Requirement of the Master of Science Degree
__________________________________________ ____________________
Thesis Advisor: Prof. Eric Miller Date
__________________________________________ ____________________
Thesis Advisor: Prof. Xiaobo Zhou Date
__________________________________________ ____________________
Thesis Reader: Prof. Dana Brooks Date
__________________________________________ ____________________
Department Chair: Prof. Ali Abur Date
Graduate School Notified of Acceptance:
__________________________________________ ____________________
Director of the Graduate School: Prof. Yaman Yener Date
Copy Deposited in Library:
__________________________________________ ____________________
Reference Librarian: Date

Acknowledgments
I express sincere gratitude to my advisors, Prof. Eric Miller and Dr. Xiaobo Zhou,
who were always open to new ideas and discussion. Their guidance, support and
enthusiasm always inspired me. I am grateful to have had the fortunate opportunity of
working with them. I would like to thank Dr. Stephen Wong for the opportunity to work
in his laboratory at the Harvard Center for Neurodegeneration and Repair, and also for
providing funds that supported this work. I am thankful to Dr. Xiaoyin Xu for his inputs
and encouragement which were invaluable during research. I would also like to
acknowledge my colleague, Fuhai Li, whose help was always forthcoming during many
stages of research.
I am grateful to Prof. Dana Brooks for his constructive comments and suggestions
regarding this thesis, and also for being a part of the committee. I also thank Dr. Jeff
Lichtman and Dr. Ju Lu for providing an interesting and challenging problem to solve.
Special thanks go to my cousin, Dr. Prashant Bhadri, whose advice and
encouragement have helped me at every step in my pursuit of the Master's degree. Deep
appreciation goes to Sushant Tripathi, Nimish Parikh and Alex Gordon for their help and
support, especially at times when I needed it the most. I want to convey my heartfelt
gratitude to my parents and my brother whose love and support made it all possible. This
thesis is dedicated to them.

Table of Contents
Acknowledgments..........................................................................................................iv
List of Figures................................................................................................................ vi
1. Introduction..................................................................................................................... 1
1.1 Background .............................................................................................................. 1
1.2 Comprehensive review of existing and related work ...............................................2
1.3 Outline of the approach.............................................................................................7
1.4 Contributions of the work......................................................................................... 8
2. Two Dimensional Template Based Tracking................................................................10
2.1 The Concept of Maximum Intensity Projection......................................................11
2.2 Automating the Process...........................................................................................13
2.3 Template Based Centerline Detection.....................................................................15
2.3.1 Directional Templates..................................................................................... 15
2.4 Estimation of The Third Dimension....................................................................... 20
3. Slice-Based Tracking.................................................................................................... 22
3.1 Seed Point Estimation............................................................................................. 25
3.1.1 The Mean-Shift Algorithm.............................................................................. 26
3.2 Segmentation...........................................................................................................28
3.2.1 The Seeded Watershed Algorithm...................................................................29
3.2.2 Guided Region Growing..................................................................................30
4. Results........................................................................................................................... 37
5. Conclusion and Future Work........................................................................................ 46
6. Bibliography..................................................................................................................48

List of Figures
1.1 Maximum intensity projection image of axons in a dataset......................................... 4
2.1 Basic flow of the algorithm.........................................................................................10
2.2 An example of a stack of cross-sectional images of two axons..................................11
2.3 Maximum intensity projection images........................................................................12
2.4 Automatic detection and alignment of seed points..................................................... 14
2.5 Directional templates for the left edge........................................................................16
2.6 The prediction and alignment of the center point....................................................... 18
2.7 Local maximum intensity search................................................................................ 21
3.1 Preprocessing the cross-sectional image.....................................................................23
3.2 Axon cross-over in the maximum intensity projection image.................................... 24
3.3 Local maximum intensity search................................................................................ 25
3.4 Trajectory of the mean-shift algorithm....................................................................... 27
3.5 Seeds estimated by the mean-shift algorithm............................................................. 28
3.6 Segmentation of axons using watershed algorithm.................................................... 30
3.7 Segmentation of axons using guided region growing.................................................35
4.1 Dataset one..................................................................................................................38
4.2 Tracking results on dataset one...................................................................................39
4.3 Dataset two..................................................................................................................40
4.4 Tracking results on dataset two...................................................................................41
4.5 Tracking results on dataset three.................................................................................43
vi

4.6 Comparison of segmentation results in dataset one....................................................44
4.7 Comparison of segmentation results in dataset two....................................................45
4.8 Comparison of segmentation results in dataset three..................................................45
vii

Abstract
Extraction of geometrical features of biological structures is an active research topic.
Accurate tracking algorithms provide valuable quantitative data which not only helps
reduce manual labor, but also helps biologists answer a range of basic-science questions.
This thesis presents a hybrid algorithm for the centerline extraction of axons in a stack of
cross-sectional images acquired from a laser scanning confocal microscope. In our work,
recovery of neuronal structures from such datasets helps biologists address questions
regarding the pattern of synapse elimination at neuromuscular junctions in a developing
muscle in mammals. Although many algorithms for centerline extraction exist in practice,
none are designed for this particular application. The data acquired using fluorescence
microscopy contains many artifacts such as blurred boundaries, non-uniform intensities
of fluorescent radiations and the presence of noise, which make the tracking process
difficult. A robust segmentation algorithm based on probabilistic region growing is
introduced, which uses the shape and intensity information of the axons in the cross-
sections to minimize the errors in tracking. The final result of the tracking algorithm is a
three dimensional centerline model. We demonstrate our algorithm on three datasets and
compare its performance with the repulsive snake algorithm.

Chapter 1
Introduction
A new algorithm for the analysis of axons from sequential fluorescent microscopic image
stacks is developed in this thesis. The algorithm presented here needs minimal user
interaction to accurately detect the centerlines of the axons in the dataset. The raw data
available for analysis consists of stacks of cross-sectional images of the axons obtained
from neonatal mice using laser scanning confocal microscopes (Olympus Flouview
FV500 and Bio-Rad 1024) [1]. The goal of the developed algorithm is to build a three
dimensional model of the centerlines of the axons present in the dataset.
1.1 Background
The pattern of synapse elimination at the neuromuscular junctions is considered, by some
biologists, to be indicative of the changes occurring in the developing brain of a mammal.
In a developing muscle, the axonal branches of several motor neurons compete with each
other at neuromuscular junctions, which results in withdrawal of all branches but one [1],
[2]. Quantitative information, such as orientation, length and width, of the axons present
in the dataset is critical in addressing a variety of questions regarding the pattern of
retraction of motor axons during synapse elimination in a developing muscle. Since the
size of the datasets is large, accurate algorithms are needed in order to obtain useful
results in manageable time. The centerline extraction from axons is also an important
1

CHAPTER 1. INTRODUCTION 2
step in separating spines from the dendrite shafts using the grass-fire algorithm [3]. The
following section provides an overview of the algorithms in practice.
1.2 Comprehensive review of existing and related work
The existing segmentation and tracking algorithms can be broadly categorized into three
groups:
● Tracking in a two dimensional projection image.
● Tracking in a sequence of cross-sectional images.
● Tracking in a three dimensional domain.
A common approach to detect the centerlines of tubular objects in a stack of cross-
sectional images is to reduce the dimensions of the data followed by centerline detection
using edge information [4]. From an imaging point of view, the data reduction step, also
known as Maximum Intensity Projection (MIP), is nothing but finding a 2-D image that is
easiest to work with.
A fully automatic directional template based approach was introduced in [4] to track
the centerlines of retinal fundus images. Basically, the edges and the orientation were
found by correlating the image with the templates defined in quantized directions. The
centerlines were then estimated in an iterative manner using the orientation and edge
information. Though this method is easily implementable and is very efficient, the
performance deteriorates with an increase in dataset complexity and degradation in the
quality of images.

CHAPTER 1. INTRODUCTION 3
Another approach to detect the centerlines and the width of objects is curvilinear
structure detection [5]. Gaussian masks were used to approximate derivatives of the
image to achieve sub-pixel accuracy in extraction of geometrical features. This algorithm
treats the image as a function of its co-ordinates and exploits the geometric properties of
the objects. The edges are first detected by using derivatives of a Gaussian kernel
followed by a linking algorithm to find the centerlines. Though highly accurate in finding
the edges and centerlines, this algorithm is computationally intensive.
Graph-search based techniques, such as the live wire algorithm [6], can also be used
to track the centerlines in the MIP image. After the user selects the starting point on the
image, the algorithm interactively finds the boundaries of the objects in the image. More
specifically, after a point is manually defined, the algorithm computes the shortest path to
every other pixel in the image based on a predefined cost function. NeuronJ [7], a plug-in
to the freely available software, ImageJ [8], uses this technique to find the centerlines of
elongated objects in the image. Although fast, they fail to extract the centerlines when the
objects adjacent to each other do not have clearly defined boundaries. Moreover, when
the dataset being analyzed is complex in nature, the start and end points of the axons in
the MIP image may not be clear to the user and hence, this method is prone to errors. An
example of such an MIP image is shown in Figure 1.1.
Though most of the MIP-based algorithms are easily implementable and are
computationally very efficient, they are unable to track the objects when they are
complex or seem to cross-over in the MIP image.

CHAPTER 1. INTRODUCTION 4
Figure 1.1 – Maximum intensity projection image of axons in a dataset.
The second class of algorithms tackles the tracking problem by analyzing the dataset
in the cross-sectional domain. The methods that fall in this category are generally more
precise and complex in nature than the MIP-based algorithms discussed earlier. These
algorithms track the centerlines of the objects sequentially and track cross-sections of all
the objects present in the dataset at the same time. The sequential images of the cross-
sections of the objects in the dataset look more or less like time-lapse microscopy images
of cellular structures. Hence, most of the algorithms developed for segmenting and
tracking the latter, can be used to track the centerlines of tubular objects.
A popular algorithm in use today for segmenting and tracking time-lapse microscopic
images is the snake model [9]. This algorithm iteratively finds the boundaries of the
objects in the image by improving on a rough initial approximation of the object. The

CHAPTER 1. INTRODUCTION 5
snake algorithm can track objects in a sequence of images, provided the cross-sections do
not shift too much from one slice to the next. The snake converges to the object boundary
by minimizing an energy functional which consists of internal and external energies. The
internal energy corresponds to the tension and rigidity of the snake and the external
energy attains low values near the edges of the objects. Besides being computationally
intensive, the boundaries detected by this algorithm are inaccurate in cases where the
cross-sections of adjacent objects have blurred edges. An improvement over this
algorithm was introduced in the repulsive snake model [10]. This algorithm uses a
repulsive force to correctly segment close lying cross-sections of axons in a stack of
confocal microscopic images. Similar to the original snake model, it has the disadvantage
of inaccurate detection of boundaries due to the presence of imaging artifacts such as
blurriness and noise in the image.
The authors of [11] use level-sets as the basis to segment drosophila RNAi
fluorescence cellular images. As opposed to the snake model, which is based on energy
minimization, level-sets use the geometric flow to converge to the true boundaries of the
objects from a rough approximation. The nuclei of cells are first segmented and are used
as the initial boundaries to segment the cytoplasm of the cells. Though this algorithm is
very accurate in segmenting the objects in the presence of noise and blurred boundaries,
it is computationally intensive.
Reconstruct [12] is another freely available software that can be used to track objects
in a sequence of cross-sectional images. The process of segmentation starts at a point
defined by the user. The region starts growing in all directions from this point and stops

CHAPTER 1. INTRODUCTION 6
when a predefined threshold is reached. If the segmentation results are found to be
inaccurate, the user defines the object boundaries. As the final result, the software
provides a 3-D reconstruction of the objects for visualization and quantitative analysis.
The main disadvantage of this software is that the user intervention is needed more often
in complex datasets since it is unable to segment close lying objects with blurred
boundaries.
The last category of algorithms track the objects in the dataset based on purely three
dimensional techniques. The main advantage of these algorithms is that they can track the
objects in the dataset regardless of their orientation with respect to the sampling direction
in which the images were acquired. If the objects are oriented normal to the sampling
direction, their shape remains fairly the same and their drift is minimal from one slice to
the next. On the contrary, if they are oriented along the sampling direction, their cross-
sections appear and disappear randomly and their shapes take arbitrary forms in a
sequence of slices in the dataset.
A fully-automatic 3-D tracking method described in [13] builds on the template based
tracking algorithm in [4]. The axons over short distances in the dataset are approximated
by a cylinder with elliptical cross-sections having a certain curvature along its axis.
Similar to the templates defined in [4], 3-D templates are defined in quantized directions.
Four sets of directional templates are used to estimate the center and the orientation of the
axon in each iteration. The centerlines of the axons are tracked iteratively by correlating
the voxels in the dataset with these directional templates. Although being theoretically
attractive, the implementation complexity renders this approach unfeasible in practice.

CHAPTER 1. INTRODUCTION 7
An algorithm based on fuzzy connectivity for segmentation and analysis of intra-
thoracic airway trees was presented in [14]. The dataset is analyzed iteratively inside a
moving cylindrical region of interest. Inside a region of interest, this method grows two
regions, foreground and background, simultaneously which compete for the voxels. The
centerlines are then found by skeletonization process and the orientation of the region of
interest in the next iteration is found using the orientation of the centerlines. The
computational complexity of this algorithm grows with an increase in the size of the
datasets, and hence is not practical.
Usually, the resolution of the acquired images is better along the transverse axis than
along the optical axis. Since all the algorithms mentioned in this section require a certain
amount of manual intervention such as, determining the MIP image for analysis or
deciding the direction for sequential analysis, their behavior is not dependent on the
resolution difference. The algorithms described so far, are either complex in nature or
unable to precisely track the centerlines of the objects in the presence of artifacts
mentioned earlier. The algorithm proposed in this thesis presents an accurate and easily
implementable method to track axons in 3-D datasets in spite of the degradation in the
acquired images.
1.3 Outline of the approach
The basic approach of hybrid tracking algorithm is to track well-separated axons in the
MIP image and adopt more computationally demanding algorithms when the centerlines
of the axons seem to intersect each other. Chapter 2 describes the method used for
CHAPTER 1. INTRODUCTION 8
tracking the centerlines in the MIP images of the datasets. The process starts after the best
MIP image, which has the clearest details of the axons present in the dataset, is manually
identified. In case of an axon cross-over, we make use of the cross-sectional views of the
dataset. The approach adopted to track and segment the axon cross-sections is described
in Chapter 3. Chapter 4 presents the tracking results of the hybrid algorithm in three
datasets. A 3-D model of the axon centerlines are shown in this chapter along with the
centerlines in the MIP image. The results are validated with the manual tracking results
obtained using the software, Reconstruct.
1.4 Contributions of the work
As mentioned earlier, the cross-sectional images are analyzed when the centerlines of the
axons intersect each other in the MIP image. The seeded watershed algorithm [15] is
used to segment the axon cross-sections. Unfortunately, it is unable to accurately segment
the axons when the boundaries are blurred or when adjacently lying axon cross-sections
have a considerable difference in intensities. An enhanced version of the seeded
watershed algorithm called “Guided region growing algorithm” is developed here. The
basic watershed algorithm is based entirely on the intensity information of the objects in
the image and hence, leads to improper segmentation of the objects in the presence of the
artifacts mentioned earlier. The guided region growing algorithm is based on the
watershed algorithm, but guided by constraints. A probabilistic model is trained using the
features extracted from the previously segmented cross-sectional slices to guide our
algorithm to the correct object boundaries. The robustness of the guided region growing

CHAPTER 1. INTRODUCTION 9
algorithm is demonstrated by comparing the segmentation results with the repulsive
snake model in Chapter 4. Apart from being easily implementable, the hybrid algorithm
presented here accurately tracks the centerlines of the axons with minimal user
intervention.
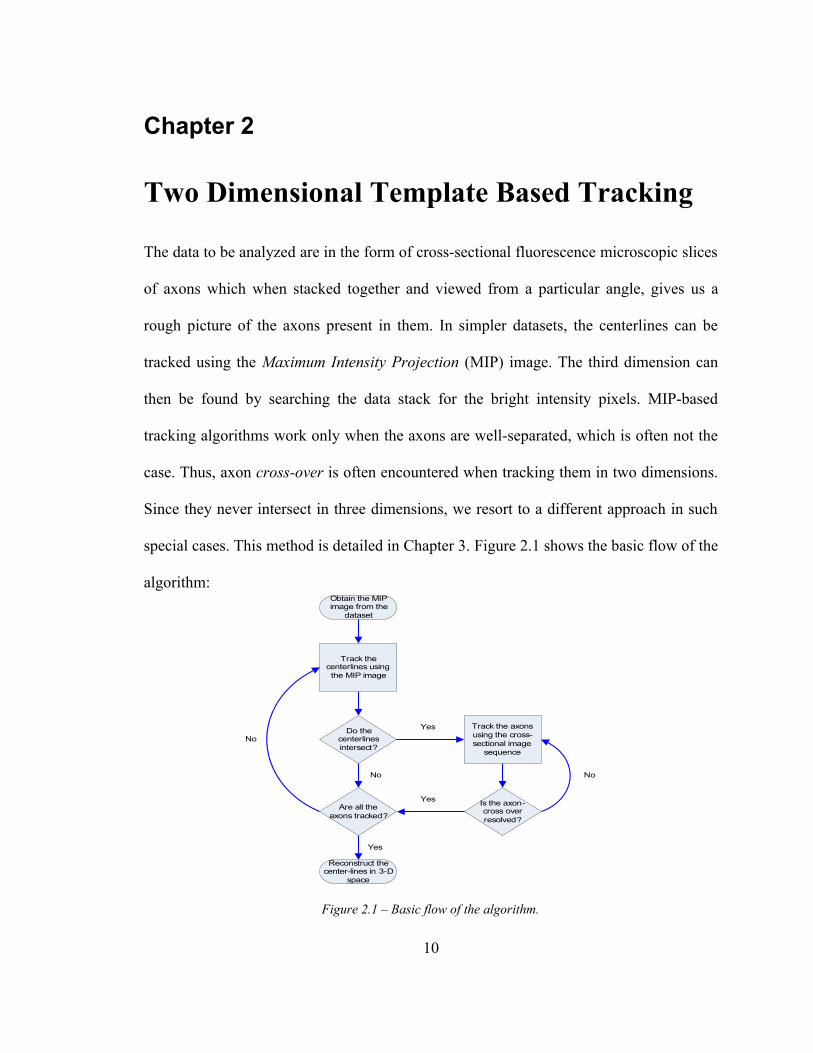
Chapter 2
Two Dimensional Template Based Tracking
The data to be analyzed are in the form of cross-sectional fluorescence microscopic slices
of axons which when stacked together and viewed from a particular angle, gives us a
rough picture of the axons present in them. In simpler datasets, the centerlines can be
tracked using the Maximum Intensity Projection (MIP) image. The third dimension can
then be found by searching the data stack for the bright intensity pixels. MIP-based
tracking algorithms work only when the axons are well-separated, which is often not the
case. Thus, axon cross-over is often encountered when tracking them in two dimensions.
Since they never intersect in three dimensions, we resort to a different approach in such
special cases. This method is detailed in Chapter 3. Figure 2.1 shows the basic flow of the
algorithm:
Figure 2.1 – Basic flow of the algorithm.
10
Obtain the MIP image from the
dataset
Track the centerlines using the MIP image
Track the axons using the cross-sectional image
sequence
Do the centerlines intersect?
Are all the axons tracked?
Is the axon-cross over resolved?
Reconstruct the center-lines in 3-D
space
No
No No
Yes
Yes
Yes

CHAPTER 2. TWO DIMENSIONAL TEMPLATE BASED TRACKING 11
2.1 The Concept of Maximum Intensity Projection
In a 3 dimensional dataset, the MIP can be visualized along any direction. As the name
suggests, the MIP along a direction is nothing but a projection of the maximum
intensities along that direction on a plane perpendicular to it. Consider a simple dataset
which consists of cross-sectional slices of only two axons. Figure 2.2 illustrates the 3D
dataset obtained by stacking these cross-sections together. In our case, MIP is visualized
along the three orthogonal directions.
Figure 2.2 - An example of a stack of cross-sectional images of two axons.
The above figure shows the MIP plane along one of the orthogonal directions, where
the axons look like elongated tubular structures, and the cross-sectional plane, where their
cross-sections look like circles or ellipses in the ideal case or compact "blobs" in practice.
The dotted lines shown above are the centerlines of the axons present in the dataset. Each
center point in the MIP plane corresponds to a cross-sectional slice. An example of a
segment of the data where the cross-sectional analysis is performed is shown by solid

CHAPTER 2. TWO DIMENSIONAL TEMPLATE BASED TRACKING 12
blue lines. The algorithm begins after the user identifies the best MIP plane which
contains the clearest details about the axons present in the data stack. Figure 2.3 shows
the three possible MIP images in a data stack:
Figure 2.3 - Maximum intensity projection images. (a) MIP along Y-axis. (b) MIP along Z-axis. (c) MIP
along X-axis.
The MIP image along the Z-axis is clearest and hence is the easiest and the best
image for centerline tracking.
(c)
(a) (b)

CHAPTER 2. TWO DIMENSIONAL TEMPLATE BASED TRACKING 13
2.2 Automating the Process
In order to automate the process of tracking, seeds are introduced in the MIP image [4].
These are the valid points on the image where the algorithm can start tracking. The pixels
in the image are classified either as valid seed points lying inside the axon or as pixels
belonging to the background. The image is low-pass filtered to remove noise. In order to
categorize the pixels, a grid of predetermined resolution is drawn on the MIP image. The
resolution of the grid is determined by visual inspection. This should be high enough to
detect ample number of seed points in each axon in the MIP image. The mean and the
standard deviation of the intensities are computed over the pixels lying on the intersection
points of the vertical and horizontal grid lines. For a pixel to be categorized as a seed
point, its intensity should exceed a threshold defined by:
T=
where, is the mean and is the standard deviation of the intensities of the
pixels. For these seed points to be valid, all their immediate neighbors should have
intensities higher than the threshold mentioned above. This minimizes the possibility of a
seed point being detected due to noise in the image.
To reduce the errors in tracking, it is helpful if these seed points lie towards the center
of the axons. Edges of the axons, with the seed points as centers, are detected and are
used to align the seeds towards the centerline. Template based tracking is used for this
purpose which is described in detail in the next section. Figure 2.4 illustrates this process
of detecting and aligning the seed points on two datasets.

CHAPTER 2. TWO DIMENSIONAL TEMPLATE BASED TRACKING 14
Figure 2.4 – Automatic detection and alignment of seed points. (a) Seed points detected on a grid. (b) Seed
points after alignment towards the center.
The red points in Figure 2.4 (a) are the seed points detected on a grid with a
resolution of 20 pixels. Figure 2.4 (b) shows the seeds aligned towards the center of the
axons. After the edges are detected at all the seed points in the image, the maximum and
(a)
(b)

CHAPTER 2. TWO DIMENSIONAL TEMPLATE BASED TRACKING 15
minimum values of the sum of the edges are used to update the maximum and minimum
width of the axons in the MIP image for further analysis.
2.3 Template Based Centerline Detection
The detection of centerlines of axons in the MIP image begins with the process of
template matching. Directional templates are defined for each quantized direction and are
correlated with the image in order to detect the edges, orientation and the centerlines of
the axons present in the image. To facilitate accurate detection of the centerlines, the MIP
image is preprocessed to improve the contrast at the edges. Laplacian filter is used for the
purpose of edge enhancement.
2.3.1 Directional Templates
Tracking the centerlines of the axons is primarily based on the two dimensional detection
of the edges and angle of orientation. Sixteen directional templates for each edge are
defined with a resolution of 22.5o. These directional templates act as a smoothing filter
along the orientation of the axons and as a differentiator across the edges of the axons.
Figure 2.5 shows the directional templates for left edge defined over the first quadrant.
Each of these templates is rotated by multiples of 90o to initialize the templates for rest of
the 12 directions. The templates for detecting the right edge are defined similarly by
reversing the signs of the templates for the left edge.

CHAPTER 2. TWO DIMENSIONAL TEMPLATE BASED TRACKING 16
Figure 2.5 – Directional templates for the left edge at (a) 0o (b) 22.5o (c) 45o (d) 67.5o
The directional templates are designed such that the sum of squared weights is the
same in any direction. This makes the comparison of the correlation responses from
different directional templates fair. These templates are used to detect the edges and the
orientation of the axons and hence the centerlines. The algorithm begins with the first
seed point in the image. The edges are calculated by computing the correlation of the left
and right directional templates with the image at varying distances from this seed point.
The distance is varied normal to the orientation that the template was designed for, until it
reaches a distance of M /2 , where M is the maximum width of the axon present in
the MIP image, which is determined by visual inspection. The correlation response of the
template with the image can be written as:
C l , , d=∑ I . Lx−dcos , y−dsin
(b)
(c) (d)
(a)

CHAPTER 2. TWO DIMENSIONAL TEMPLATE BASED TRACKING 17
where, d is the distance from the center in the direction normal to , L is the
left template defined at the angle , I is the image and x , y are the co-
ordinates of the center. The maximum left template response at an angle, , can be
written as:
C l , , max= maxd∈0,1,. .. , M /2
C l , d ,
and hence, the left edge is determined as:
Dl , = argmaxd ∈0,1,. .. , M /2
C l , d ,
The right edge is found in a similar fashion.
Initially, since the orientation of the axon is unknown, the process is repeated for all
16 directions. The direction in which the template's response is maximum is declared as
the orientation of the axon at that point. This can be written as:
= argmax∈0o , 22.5o , ..., 337.5o
C l , ,max
Once the angle of orientation is found, the center point for the next iteration can be
predicted by moving along this direction by a distance of pixels. This can be written
as:
x i1= x i− . sin & y i1= y i . cos
Choosing a large value of the step size, , reduces the computation time. But, there are
chances of the center point jumping to a close lying axon. This parameter is set according
to the dataset under analysis. In any dataset, to avoid the centerlines from jumping to a
nearby axon, the value of should not exceed the minimum width of the axons in the

CHAPTER 2. TWO DIMENSIONAL TEMPLATE BASED TRACKING 18
image. The process for detecting the edges and angle of orientation is repeated as
described earlier at the new center point. Since the changes in the axon orientation are
known to be fairly smooth, the search can be limited to a range of ±22.5o from the
current angle of orientation instead of all 16 directions.
The predicted center points will not be aligned at the actual center if the axon is not
oriented at exact multiples of 22.5o. This causes errors in tracking. To circumvent this
problem, the position of the center point is corrected using the left and right edge
information. This correction factor can be written as:
x=D r−Dl .cos /2 & y=Dr−Dl . sin/2
The modified center point can thus be written as:
x i1=x i1x & y i1=yi1 y
The process of prediction of the center point and its correction after the detection of
the left and right edges is illustrated in Figure 2.6.
Figure 2.6 – The prediction and alignment of the center point.

CHAPTER 2. TWO DIMENSIONAL TEMPLATE BASED TRACKING 19
As the new center points are detected in the above mentioned fashion, seed points are
searched in its vicinity. The seed points are searched in a circular area with the radius set
to the step size . If the seed points are found, they are labeled with the current axon
number. This process makes sure that the center points are inside the axon. The alignment
of the seed points, as mentioned earlier in this chapter, reduces the chances of a seed
point being missed out during this process. The algorithm is terminated for the current
axon if the predicted center point lies outside the image.
The process is also repeated to trace the axon in the backward direction. If no seed
points are found in the vicinity of the centerlines after a predefined number of iterations (
), the centerline is declared invalid. This parameter was experimentally found to be
20 . Once found invalid, the centerline of the axon currently being traced is deleted
and all the seed points marked by this axon are cleared. Another criterion for terminating
the process is if the sum of the maximum responses from the left and right templates falls
below a particular threshold defined as:
T=361 F av−Bav
where, F av is the average foreground intensity and Bav is the average background
intensity which are calculated in the automatic seed detection step using the points lying
on the grid. is a factor that determines how the algorithm will behave to changes in
the template response. A higher value will terminate the algorithm prematurely whereas a
lower value will lead to false detections. In our case, the value of is selected to be
0.5. Since the template response to a unit change in intensity is 36, it is used to calculate

CHAPTER 2. TWO DIMENSIONAL TEMPLATE BASED TRACKING 20
the threshold.
After the centerline for an axon is either completely detected or deleted due to the
above mentioned constraints, the algorithm begins with the next seed point in the image.
This way all the seed points are labeled as the axons are traced. The centerline for the
traced axon consists of the set of points [ x i , y i] . All the axons are considered to be
traced if the number of unmarked seed points in the image falls below . This
minimizes the possibility of the algorithm starting at a seed point that maybe located
outside the axon due to noise in the image. This parameter is computed as =l / .
, where l is the minimum length of the axon present in the image. This is determined
by the user after a visual inspection of the MIP image.
2.4 Estimation of The Third Dimension
The two dimensional template based tracking described earlier in this chapter helps detect
the two co-ordinates of the axons in the dataset. In order to build the three dimensional
model for the centerlines of the axons, we need to find the third dimension which can be
done by searching for the bright pixels in the cross-sections corresponding to each center
point in the MIP plane. The two co-ordinates of each center point on the MIP plane help
in locating the slice in the stack and the line of search where the centers of the axons will
lie in the cross-sectional plane. In order to find the location of the centers of the axons in
this plane, a local maximum intensity search is performed. Figure 2.7 illustrates this
process. If more than one point is found by this process, the one with the least deviation
from the previous center is declared as the third co-ordinate.
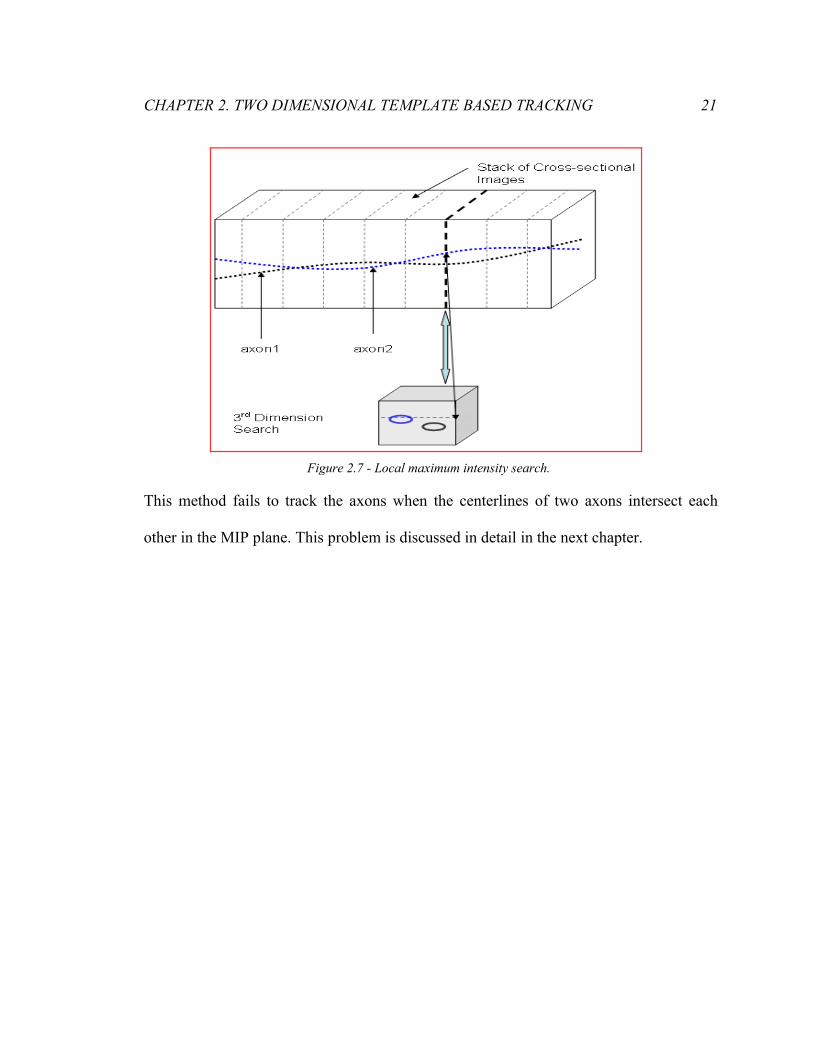
CHAPTER 2. TWO DIMENSIONAL TEMPLATE BASED TRACKING 21
Figure 2.7 - Local maximum intensity search.
This method fails to track the axons when the centerlines of two axons intersect each
other in the MIP plane. This problem is discussed in detail in the next chapter.

Chapter 3
Slice-Based Tracking
Though the two dimensional template based tracking method described in Chapter 2 is
computationally efficient, it cannot track the centerlines when the axons seem to cross-
over in the MIP image. A cross-over is detected by the algorithm when the centerline of
the axon currently being traced intersects the centerline of an already traced axon in the
MIP image. Figure 3.2 illustrates this phenomenon. In order to deal with this situation,
we have developed an algorithm that works directly on the cross-sectional information.
Since this method presented in this chapter is computationally expensive as compared
to the algorithm in Chapter 2, it is applied to only a few sections in the dataset where
there is an ambiguity due to the cross-over. Once the axons are found to be well separated
in three dimensional space, the template-based tracking is used again to track the axons.
The cross-sectional images of the axons suffer from blurriness and intensity non-
uniformity which make the segmentation, and hence the tracking, difficult. Hence, all the
cross-sectional images being analyzed by the slice-based tracking method have to be
preprocessed to minimize the effects of these artifacts. This is done using the Hessian
method of adaptive smoothing [17]. This helps in noise removal from the raw image and
at the same time, enhances the features of the objects in the image as shown in Figure 3.1.
22

CHAPTER 3. SLICE-BASED TRACKING 23
Figure 3.1 - Preprocessing the cross-sectional image. (a) Raw image. (b) Processed image.
The axon cross-sections are segmented using seeded watershed algorithm [15].
Similar to the seeds introduced in the MIP image, another set of seed points are used here
which serve as the starting points for the seeded watershed algorithm. The introduction of
seed points is necessary since the traditional watershed algorithm suffers from a serious
drawback of over-segmentation. Hence, seed points have to be specified for every cross-
sectional slice being analyzed. The mean-shift [16] algorithm is used to estimate the
seed points. A guided region growing approach is adopted in cases when the seeded
watershed algorithm fails to segment the axon cross-sections.
The process of analyzing the cross-sectional slices begins by identifying the cross-
section where the axons are well separated. This is defined as the location in the MIP
image where the centers of the axons in question are separated by more than a certain
distance, d, defined as:
d=d currentd traced
(a) (b)

CHAPTER 3. SLICE-BASED TRACKING 24
where, d current and d traced are the diameters of the current and the intersecting axon.
They are determined by using the left and right edge information from the template-based
MIP tracking algorithm. This location is shown by the blue line in Figure 3.2.
Figure 3.2 – Axon cross-over in the maximum intensity projection image.
Since each point on the centerlines of the axons in the MIP image correspond to a
cross-sectional slice, as shown in Figure 2.1, we pull out the corresponding slice from the
data stack to initiate the process of segmentation. Once the axons are found to be well
separated again in three dimensional space, the template-based tracking is used to track
the axons in the MIP image.
Once the cross-sectional slice is identified to being the segmentation, the initial center
points of the axons are extracted by the third dimension search, as described in Section
2.4. Since the position of the axons in the cross-sections change with successive slices,
we need to track all the axons present in the slice at the same time. It can be observed in
Figure 3.2, that only two axons have been traced so far before a cross-over is

CHAPTER 3. SLICE-BASED TRACKING 25
encountered. Hence, only two seed points can be automatically found in the
corresponding cross-sectional slice by the third dimension search. The centers of the
remaining axons are manually identified. The process of seed point detection along with
the segmentation results are shown in Figure 3.3 .
Figure 3.3 - Local maximum intensity search. (a) The line of search. (b) Seed points found by local
maximum intensity search. (c) Manually identified centers. (d) Segmentation using seeded watershed
algorithm.
3.1 Seed Point Estimation
The centers found in the current slice serve as the initial seed points for the next slice.
The axon cross-sections will most probably be shifted from their position in the previous
cross-sectional slice. Hence, the centers of the axons from the previous slice cannot
directly be used as seed points, and need correction. The mean-shift algorithm, which is
based on the intensity information of the axon cross-sections, is used to estimate the seed
points.
(a) (b) (c) (d)

CHAPTER 3. SLICE-BASED TRACKING 26
3.1.1 The Mean-Shift Algorithm
The mean-shift algorithm works on the principle of a moving kernel for seed point
detection and uses the intensity information of the objects in the image to calculate the
centers. The kernel is a circular window with each position in the kernel having the same
weight. The kernel with radius R is defined as:
K c ={1,if ∥x−c∥≤R0,if ∥x−c∥R
where, c is the center of the kernel and x is any point in the image. The kernel is
first centered at the initial seed point obtained directly from the previous slice and the
new center is calculated as:
mi1=∑pK p− mi. g p .p
∑pK p− mi . g p
where, p is any point in the image, g p is the intensity at point p and i is
the iteration count. In the next iteration, the center is updated with the calculated mean
and the kernel is now placed at this point and the process is repeated until the algorithm
converges, i.e. until the shift in mean mi−mi−1 reduces to zero. In order to avoid
infinite looping, the algorithm is terminated once the number of iterations reaches a
particular threshold.
In the presence of a close lying brighter axon, the mean shift tends to estimate the
seed point towards the edges of the actual axon cross-section. Figure 3.5(a) shows one
such case. It can be seen, as shown inside the yellow ellipse, that the seed point of one of

CHAPTER 3. SLICE-BASED TRACKING 27
the axons has moved completely into the neighboring axon. This results in wrong
segmentation of axons, which is shown in Figure 3.5(b). Thus, constraints are imposed on
the mean-shift algorithm. Firstly, the mean-shift is applied to axons in a window. Figure
3.4 shows the trajectory of the mean-shift algorithm applied to a single axon cross-section
inside a window. The size of the window is set to the diameter of a circle having the same
area as the segmented axon cross-section in the previous slice. Since the change in the
position and shape of the axon cross-sections is known to be fairly smooth, it can be
reasonably assumed that the axon cross-section does not shift from its position in the
previous slice by more than its radius.
Figure 3.4 – Trajectory of the mean-shift algorithm.
The maroon cross indicates the initial seed point. The series of blue crosses show the
trajectory of the algorithm and the final seed point is shown by the red cross. The next
constraint is placed on the radius of the kernel as:
R= minr , a 2

CHAPTER 3. SLICE-BASED TRACKING 28
where, r is the radius of a circle with the same area as the segmented region and a
is the minor axis after fitting an ellipse to the segmented region. This also helps in
minimizing the errors in finding the seed points when the axon has irregular shapes.
Figure 3.5(c) shows the results of the mean-shift algorithm with the above mentioned
constraints. Figure 3.5(d) illustrates the corresponding segmentation results using the
seeded watershed algorithm.
Figure 3.5 – Seeds estimated by the mean-shift algorithm. (a) Seeds found without constraints.
(b) Segmentation results using seeds in (a). (c) Seeds found using constraints. (d) Segmentation results
using seeds in (c).
3.2 Segmentation
In addition to finding the centers of the cross-sections of axons in the image,
segmentation is also used to extract boundaries of the axons in the dataset for both
visualization and analysis. The watershed algorithm [15] treats an image as a three-
dimensional map, the co-ordinates as the first two dimensions and the intensity as the
third. If an image is viewed this way, it contains valleys and mountains. Three regions are
(a) (b)
(d)(c)

CHAPTER 3. SLICE-BASED TRACKING 29
defined on such a landscape: (1) regional minima which serve as starting points for the
algorithm to begin, (2) points where if a drop of water is placed, it will certainly flow
towards the regional minima (also known as the catchment basin), and (3) points where if
a drop of water is placed, it is equally likely to flow towards any of the minima
surrounding it ( also known as watershed lines).
The algorithm begins by filling water starting from the regional minima. As the
catchment basins fill up, at some point they overflow into the neighboring basins. A dam
is built at these locations to prevent the water from overflowing. The dams built this way
after the landscape is completely immersed in water, form the boundaries of the objects
in the image.
3.2.1 The Seeded Watershed Algorithm
As mentioned earlier, the traditional watershed algorithm suffers from a drawback of
over-segmentation. The cause of over-segmentation is the presence of many regional
minima in the image. Since the watershed starts filling water in the image from these
points, the number of regions after the segmentation depends on the number of regional
minima. In order to avoid this, the image is morphologically modified to have regional
minima only at the seed points. Thus, the seeds act as the starting point for the watershed
algorithm to begin. The water in the catchment basins starts rising from these seeds and
the boundaries are formed once the water begins to overflow into the adjoining basins.
Figure 3.6 illustrates the segmentation results in a cross-section containing five axons
before and after the imposition of seeds:

CHAPTER 3. SLICE-BASED TRACKING 30
Figure 3.6 - Segmentation of axons using watershed algorithm. (a) Original image. (b) Segmentation
without imposition of seeds. (c) Image after imposition of seeds. (d) Segmentation using watershed after
imposition of seeds.
3.2.2 Guided Region Growing
Since the watershed algorithm makes use of only the intensity information of the objects
in the image, a segmentation error may result when the axon cross-sections have very low
intensity and are lying close to a brighter axon. Figure 3.7 shows one such instance. It is
assumed that the axons do not change drastically in shape from slice to slice and hence, a
segmentation error is declared if the area of the axon differs by more than 50% from the
previous slice. The seeds detected by the mean-shift algorithm are shown in Figure
3.7(a). Instead of seed points, seed regions can be used to improve the performance of the
seeded watershed algorithm. Figure 3.7(b) shows the seed regions initialized to an ellipse
whose major and minor axis are set to half their values determined in the previous slice,
centered at the seed points detected by the mean-shift algorithm. As seen in Figure 3.7(c),
the seeded watershed algorithm is unable to resolve close lying axons having a significant
difference in intensities, as shown in the yellow ellipse. A guided region growing
(a)
(c) (d)
(b)

CHAPTER 3. SLICE-BASED TRACKING 31
algorithm is introduced in this section which is used to segment such images.
This algorithm is based on the watershed algorithm, but is guided by constraints. It
uses a probabilistic approach to segment the axons in the image. Since the axons do not
vary too much from slice to slice, a fair amount of similarity is assumed between cross-
sections of the axons in consecutive slices. This forms the foundation of the guided
region growing algorithm. The following steps briefly outline the algorithm:
● Extract features from 'N' previously segmented slices of the dataset using
seeded watershed algorithm.
● Build the probabilistic model that will guide the region growing algorithm.
● Start the region growing from the seed points in the image based on the
likelihood calculated by the model.
The various parameters involved as discussed here.
Deciding the training set 'N'
Selecting the number of training samples is important, since a large number of samples
will average out the variations in the cross-sections, which will result in improper
segmentation. Lesser number of samples means larger variances which causes the
likelihoods to lie in either of the two extremes. In our case, we have chosen training
samples from 10 previously segmented slices.
Deciding the features
The features are extracted from the previously segmented slices after fitting an ellipse to

CHAPTER 3. SLICE-BASED TRACKING 32
the segmented axons. Popular features that are usually used for training the model are
length of major axis, length of minor axis, perimeter, average intensity, difference in
centers from one cross-section to the next, area and orientation. Since the axon cross-
sections have irregular shapes and varying intensity, only a few features can actually be
useful in our case. The selected features have to be such that there is an increase in
likelihood only if the region grows into a particular shape and at a specific angle. It was
found that the orientation and perimeter are sufficient features to properly guide the
algorithm to converge to the actual shape of the axons in the cross-section.
Building the probabilistic model
After extracting the above mentioned features from the previously segmented images,
they are fit to Gaussian distribution and are used to train the model. The mean and the
covariance matrices are computed for each axon present in the image based on these
features. The similarity of the shape and size of a cross-section of an axon in any two
slices is dependent on the distance between them. In other words, the similarity between
the cross-sections of an axon lying close together is more than those that are far-spaced.
Thus, the feature vectors used for training are weighted to imply the similarity between
the objects in the current slice and the training feature. These weights are set to
wn=eN−n1 ,where, n is the distance between the current slice and the slice where
the features were extracted from and N is the number of slices used to train the model.
As it can be seen, the influence of the feature vectors decreases exponentially as we move
away from the current slice. The weights are then normalized as wn=w n/W , where

CHAPTER 3. SLICE-BASED TRACKING 33
W=∑n=1
N
w n
The weighted mean for the feature vectors are then calculated as:
w=∑n=1
N
wn. f n
where f n is the feature vector of the segmented axon cross-section, n slices away from
the current slice. The weighted covariance matrix is then computed as:
Rw=∑n=1
N
w n . f n− wT∗ f n− w
After the training samples are obtained from 'N' previous slices, they are used to train
the probabilistic model. The likelihood of occurrence of a region with a particular feature
vector, f , is computed as:
Once the model is built this way, it acts as the central force driving the region growing.
Guided region growing
As mentioned before, the watershed algorithm begins filling water from the regional
minima. Thus, the number of regions into which the image will be segmented, depends
on the number of seeds in the image. The algorithm begins with the regions shown in
Figure 3.7(b). As pixels are analyzed, they are marked with a label which indicates the
region to which they belong.
p f=1
2∣ Rw∣1/2 e
−12 { f − w
T Rw−1 f − w}

CHAPTER 3. SLICE-BASED TRACKING 34
The water is filled in the image based on a threshold that is increased in subsequent
iterations. In order to make the algorithm less computationally demanding, only the
pixels lying inside a region of interest are considered for analysis. The image pixels are
first categorized into three groups based on their intensities. The image is then binarized
with a threshold determined as:
T= I lowI mid 2
where, I low and I mid are the groups corresponding to low and medium intensities.
This helps avoid errors in binarization when the axons have low intensities.
The threshold in the first iteration is set to one level higher than the lowest intensity
pixel in the region of interest. All the pixels in the image that are lesser than this
threshold are considered to be submerged in water in the current iteration.
A list of unlabeled pixels is maintained for all the pixels that are submerged so far.
For each of the regions in the image, connected components are searched from this list.
Each of these pixels in the list is individually added to the regions and the likelihood of
the new region is computed using the probability mode. The pixel is retained in the
region if there is an increase in the likelihood, and removed otherwise.
The same process is repeated until the threshold reaches to the maximum value of the
pixel in the region of interest. Figure 3.7 compares the segmentation results of our
algorithm with the seeded watershed algorithm. Figure 3.7(d)-(e) compare the blown up
version of the segmentation results of the seeded watershed algorithm and guided region
growing algorithm.

CHAPTER 3. SLICE-BASED TRACKING 35
Figure 3.7 - Segmentation of axons using guided region growing. (a) Original image with seeds found
using mean-shift. (b) Seed regions. (c) Boundaries using seeded watershed algorithm with seed regions.
(d) Magnified version of boundaries in (c). (e) Boundaries detected with guided region growing.
As it can be seen in Figure 3.7(e), in spite of the low intensity of the axon, as shown
in the yellow ellipse in Figure 3.7(c), the guided region growing algorithm is successfully
able to determine the boundary. It should be noted that, accurate detection of the centers
of the axons, especially the faint and small ones, is crucial in preventing propagation of
error to subsequent slices. Apart from wastage of computation time, wrongly detected
axons directly affect the underlying biological issue.
The algorithm for solving the cross-over of axons as described in this chapter is
repeated until the centerlines of the axons which were crossing over in the MIP image are
resolved. After all the axons in the dataset are tracked this way, two types of segments of
centerlines result: fragments tracked using two dimensional centerline tracking and those
tracked using slice-based tracking. Since the centerlines tracked in the MIP image have
no cross-over ambiguity, the third dimension of each of the centers can be found by
(a) (b) (c) (d) (e)

CHAPTER 3. SLICE-BASED TRACKING 36
searching for the local maximum intensity pixels in the corresponding slices. In the latter
case, the two co-ordinates of the centers tracked in the cross-sectional slices along with
the slice number give us the three dimensions of the centers. The results of the 3-D
centerline reconstruction are illustrated in the next chapter and are validated with manual
tracking results. In order to demonstrate the robustness of the tracking algorithm, the
guided region growing algorithm is compared with the repulsive snake model.

Chapter 4
ResultsThree datasets were analyzed using the algorithm described in this thesis. The centerlines
of the axons are presented in both, two dimensions, in the MIP image, and in the three
dimensional domain. The various parameters that were manually initialized for the
datasets are:
● The number of cross-sectional slices in the dataset and their prefix.
● The maximum width of the axons in the MIP image.
● The resolution of the grid for the automatic detection of seeds in the MIP image
for the 2-D directional template based tracking.
● The initial seed points for the segmentation algorithm in the first axon cross-
section each time when an axon cross-over is detected.
The results are validated with the manual reconstruction results. The axons were
manually tracked using Reconstruct, a freely available software on the internet. Finally,
we compare the performance of the guided region growing algorithm with the repulsive
snake model on one cross-sectional image from each of the three datasets.
The first dataset contained 4 axons in total with 256 cross-sectional images, each
having a resolution of 141 x 512 pixels. The cross-sectional images were sampled along
the Y direction. Figure 4.1 shows the MIP image along with the cross-over of axons in
the MIP image. The maximum width of the axon was set to 20 pixels and the
resolution of the grid for the MIP image was set to 10 pixels.
37

CHAPTER 4. RESULTS 38
Figure 4.1 – Dataset one. (a) The MIP image. (b) Cross-over of axons.
Figure 4.2(a) shows the manual reconstruction of the axons. Approximately 50% of
the dataset was tracked using the cross-sectional tracking algorithm. The average
deviation of the centerlines detected by our algorithm from the manually tracked results
was found to be 1.755 pixels. The 2-D MIP and the 3-D model of the centerlines are
shown in Figure 4.2(b)-(c).
(a) (b)

CHAPTER 4. RESULTS 39
Figure 4.2 – Tracking results on dataset one. (a) Manual tracking results. (b) Centerlines in the MIP
image. (c) 3-D model of the centerlines.
(a) (b)
(c)

CHAPTER 4. RESULTS 40
The second dataset contained 6 axons with 256 cross-sectional images, each having a
resolution of 43 x 512 pixels. The cross-sectional images were sampled along the X
direction. Figure 4.3 (a) shows the MIP image for this dataset. The cross-over of the
axons in the MIP image is shown by the white ellipse in Figure 4.3 (b).
Figure 4.3 – Dataset two. (a) The MIP image. (b) The phenomenon of cross-over.
The maximum width of the axon was set to 40 pixels and the resolution of the grid for
the MIP image was set to 15 pixels. Figure 4.4 shows the tracking results for the dataset.
The average deviation of the centerlines detected by our algorithm from the manually
tracked results was found to be 1.6431 pixels. Approximately 75% of the dataset was
tracked using the cross-sectional tracking algorithm. The 2-D and the 3-D centerlines are
shown in Figure 4.4(b)-(c).
(a) (b)
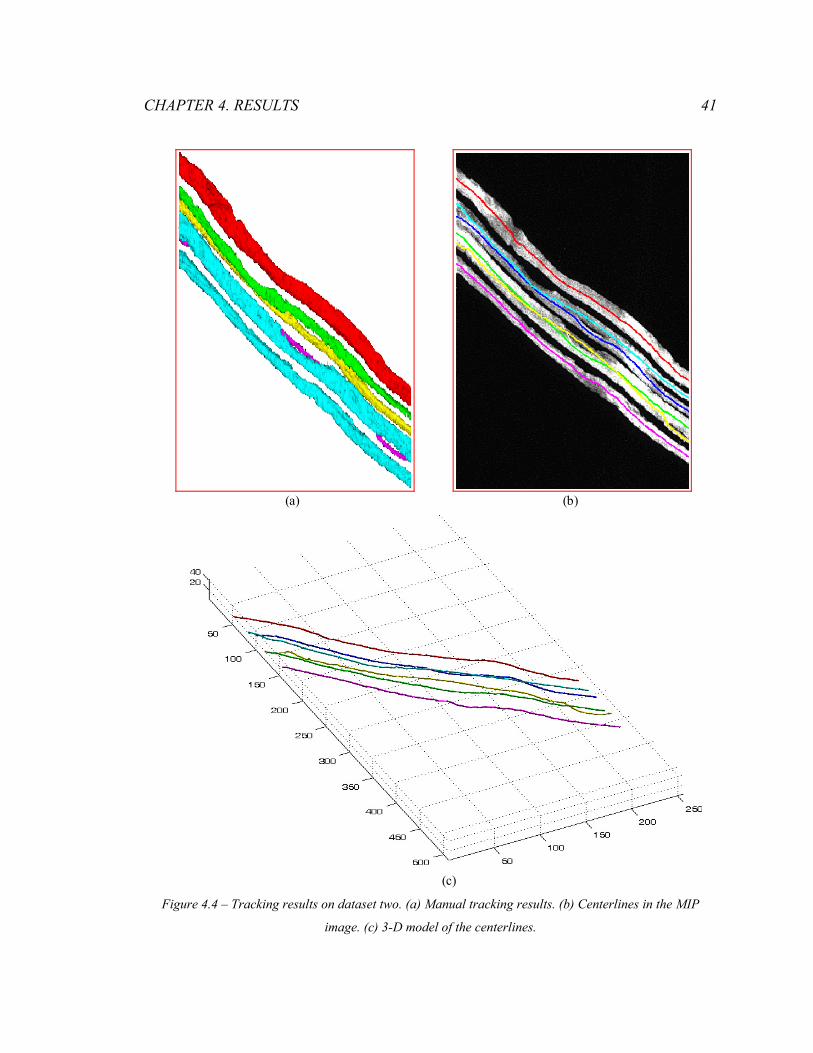
CHAPTER 4. RESULTS 41
Figure 4.4 – Tracking results on dataset two. (a) Manual tracking results. (b) Centerlines in the MIP
image. (c) 3-D model of the centerlines.
(a) (b)
(c)

CHAPTER 4. RESULTS 42
As it can be noticed, as the complexity of the dataset increases, a major part of the
centerlines of the axons are tracked using the cross-sectional information. The final
dataset contained 7 axons with 256 cross-sectional images, each having a resolution of
42 x 512 pixels. The cross-sectional images were sampled along the X direction. Due to
the complex nature of the dataset, the centerlines of the axons are tracked entirely using
the cross-sectional images. Hence, the centers of the axons in the first cross-sectional
image were manually identified. Figure 4.5(a) shows the MIP image for the dataset. The
manual tracking results for this dataset is shown in Figure 4.5(b). Figure 4.5(c)-(d) show
the 2-D MIP and 3-D model of the centerlines of the axons. In comparison with the
manual tracking results, the average deviation of the tracked axon centerlines was found
to be 1.8141 pixels.
(a) (b)

CHAPTER 4. RESULTS 43
Figure 4.5 – Tracking results on dataset three. (a) The MIP image. (b) Manual reconstruction. (c)
Centerlines in the MIP image. (d) 3-D model of the centerlines.
In order to demonstrate the accuracy and robustness of the proposed method in this
thesis, the segmentation results are compared with that of the repulsive snake model. In
this algorithm, the user has to define the initial boundaries and the centers of the axons in
the first cross-sectional image of the dataset. The snake then iteratively evolves to the
individual boundaries of the axons by minimizing the energy functional. The following
figures compare the repulsive snake model and the guided region growing models. Since
the datasets mentioned earlier in this section contain hundreds of cross-sectional images,
one cross-section from each of the datasets is used to compare the two algorithms. Figure
4.6 shows the results of the two algorithms in the first dataset.
(c) (d)

CHAPTER 4. RESULTS 44
Figure 4.6 - Comparison of segmentation results in dataset one. (a) Repulsive snake model. (b) Guided
region growing.
It can be seen that the boundaries of axons detected using the repulsive snake model
are not accurate when the axon cross-sections suffer from intensity non-uniformity.
Hence, the centers of the axons found in this manner are inaccurate which results in the
propagation of error to subsequent slices. The guided region growing, on the other hand,
is more robust in handling such situations. Figure 4.7 compares the two algorithms in
another such image from the second dataset.
(a) (b)

CHAPTER 4. RESULTS 45
Figure 4.7 - Comparison of segmentation results in dataset two. (a) Repulsive snake model. (b) Guided
region growing.
Due to the imaging artifacts, the repulsive snake model is unable to evolve to the true
boundaries of the axons in the image. This is overcome by the guided region growing
algorithm by using the shape information from the previous slices. Figure 4.8 compares
the two algorithms in the final dataset.
Figure 4.8 - Comparison of segmentation results in dataset three. (a) Repulsive snake model. (b) Guided
region growing.
(a) (b)
(a) (b)

Chapter 5
Conclusion and Future Work
The centerlines of axons in three datasets were tracked using the hybrid algorithm
presented in this thesis. It was able to find the centerlines of the axons in spite of the
imaging artifacts present in the acquired images. A significant improvement in the
performance of the traditional region growing algorithm (seeded watershed algorithm)
was demonstrated by incorporating constraints. The performance of the guided region
growing algorithm was compared with the repulsive snake algorithm, and was found to
be more successful in tracking the axons accurately in the datasets.
The scope of improvements in the approach presented in this thesis can be
summarized as follows:
● The pixels in each iteration in the guided region growing approach can be
reordered to find alternate paths to grow individual regions based on the highest
probability among the arrangements.
● Modifications to the algorithm can be made to track the branching of axons in the
datasets. Either manual or automatic identification of the branch points can help
track more complex datasets. Manual identification would involve user
intervention whenever two axon cross-sections come close to each other. On the
other hand, automatic labeling can be done by exploiting the fact that the axons
split or merge only in a specific direction in the dataset. For example, in our case,
46

CHAPTER 5. CONCLUSION AND FUTURE WORK 47
the axons can split only in the direction of sampling of the cross-sectional images.
In other words, splitting and merging are mutually exclusive phenomena if a
specific direction along the sequence of cross-sectional images in the dataset is
considered. This could be used to minimize errors in classification of close lying
axons.
● As mentioned earlier in Chapter 1, if the axons are aligned along the sampling
direction in which the cross-sectional images were acquired, their cross-sections
appear and disappear randomly and their shapes take arbitrary forms. The
algorithm can be altered to analyze such axons as well. More specifically, two
approaches could be adopted in such cases:
1. Re-sample the dataset normal to the orientation of the axons, so that the cross-
sections of the axons remain fairly the same throughout the dataset.
2. Subdivide the dataset into smaller and simpler ones, so that the tracking
results of these individual data stacks can be merged together.
The guided region growing algorithm presented in this thesis can also be used to track
other tubular structures in a sequence of cross-sectional images. Apart from being
computationally inexpensive, the algorithm is easy to implement and at the same time,
accurate.

Bibliography
[1] Narayanan Kasthuri and Jeff W. Lichtman, “The role of neuronal identity in synaptic
competition”, Letters to Nature, Volume 424, No. 6947, p.426-430, July 2003.
[2] Cynthia R. Keller-Peck, Mark K. Walsh, Wen-Biao Gan, Guoping Feng, and Jeff W.
Lichtman, “Asynchronous synapse elimination in neonatal motor units: studies using
GFP transgenic mice”, Neuron, Volume 31, No. 3, p.381-394, August 2001.
[3] Xiaoyin Xu, Jie Cheng, Rochelle M. Witt, Bernardo L. Sabatini and Stephen T.C.
Wong, “A shape analysis method to detect dendritic spine in 3D optical microscopy
image”, 3rd IEEE International Symposium on Biomedical Imaging: Macro to Nano,
p.554-557, April 2006.
[4] Ali Can, Hong Shen, James N. Turner, Howard L. Tanenbaum and Badrinath
Roysam, “Rapid automated tracing and feature extraction from retinal fundus images
using direct exploratory algorithms”, IEEE Transactions on Information Technology in
Biomedicine, Volume 3, No. 2, p.125-138, June 1999.
[5] Cartsen Steger, “An unbiased detector of curvilinear structures”, IEEE Transactions
on Pattern Analysis and Machine Intelligence, Volume 20, No. 2, p.113-125, Feb 1998.
[6] William A. Barrett and Eric N. Mortensen, “Interactive Live-Wire Boundary
Extraction”, Medical Image Analysis, Volume 1, No. 4, p.331-341, 1997.
[7] E. Meijering, M. Jacob, J.-C.F. Sarria, P. Steiner, H. Hirling and M. Unser, “Design
and validation of a tool for neurite tracing and analysis in fluorescence microscopy
48

BIBLIOGRAPHY 49
images”, Cytometry Part A, Volume 58A, No. 2, p.167-176, March 2004.
[8] Abramoff, M.D., Magelhaes, P.J. and Ram, S.J., "Image Processing with ImageJ",
Biophotonics International, Volume 11, Issue 7, p.36-42, 2004.
[9] Michael Kass, Andrew Witkin and Demetri Terzopoulos, “Snakes: Active contour
models”, International Journal of Computer Vision, Volume 1, No. 4, p.321-331, January
1988.
[10] Hongmin Cai, Xiaoyin Xu, Ju Lu, Jeff W. Lichtman, S.P. Yung and Stephen T.C.
Wong, “Repulsive force based snake model to segment and track neuronal axons in 3D
microscopy image stacks”, NeuroImage, Volume 32, Issue 4, p.1608-1620, October
2006.
[11] Guanglei Xiong, Xiaobo Zhou, Liang Ji, P. Bradley, N. Perrimon, and Stephen T.C.
Wong, “Automated Segmentation of Drosophila RNAi Fluorescence Cellular Images
Using Deformable Models”, IEEE Transactions on Circuits and Systems I, Volume 53,
No. 11, p.2415-2424, November 2006.
[12] Fiala, J.C., “Reconstruct: a free editor for serial section microscopy”, Journal of
Microscopy, Volume 218, Part 1, p.52- 61, January 2005.
[13] Khalid A. Al-Kofahi, Sharie Lasek, Donald H. Szarowski, Christopher J. Pace,
George Nagy, James N. Turner, and Badrinath Roysam, “Rapid automated three-
dimensional tracing of neurons from confocal image stacks”, IEEE Transactions on
Information Technology in Biomedicine, Volume 6, No. 2, p.171-187, June 2002.
[14] Juerg Tschirren,, Eric A. Hoffman, Geoffrey McLennan, and Milan Sonka,

BIBLIOGRAPHY 50
“Intrathoracic airway trees: segmentation and airway morphology analysis from low-dose
CT scans”, IEEE Transactions on Medical Imaging, Volume 24, No. 12, p.1529-1539,
December 2005.
[15] Rafael C. Gonzalez R and Richard E. Woods, “Digital Image Processing”, Addison
Wesley, 2nd edition, p.617-626, 1992.
[16] Debeir, O., P. Van Ham, et al., “Tracking of migrating cells under phase-contrast
video microscopy with combined mean-shift processes”, IEEE Transactions on Medical
Imaging, Volume 24, No. 6, p.697-711, June 2005.
[17] Carmona, R.A. and Sifen Zhong, “Adaptive smoothing respecting feature
directions”, IEEE Transactions on Image Processing, Volume 7, No. 3, p.353-358, March
1998.