ENGLISH 1301 KAREN FRENCH Cause-Effect. STEPHEN KING “Why We Crave Horror Movies”
date post
20-Dec-2015Category
view
214download
2
3

2

1

ACTION!!!

Introduction
• We explored the top 100 movies in the last 10 years in terms of gross revenues
• We investigated why certain movies have high opening weekend revenues
• We also examined how certain aspects influenced sales
DO YOU KNOW WHICH MOVIE DID THE BEST?????

TITANIC!!!!

Genre Share for top 100 movies (in percent %)
Action, 20.00%
Adventure, 9.00%
Comedy, 20.00%Drama, 14.00%
Family, 18.00%
Horror, 2.00%
Indie, 1.00%
Romance, 4.00%
Sci-Fi, 12.00%
Genre Share for top 10 movies (in percent %)
Adventure, 10.00%
Comedy, 10.00%
Sci-Fi, 20.00% Action, 20.00%
Family, 20.00%
Drama, 20.00%
Exploratory Data Analysis

Rating Share top 100 movies (in percent %)
R, 17.00% G, 7.00%
PG, 22.00%
PG-13, 54.00%
G
PG
PG-13
R
Rating Share top 10 movies (in percent %)
PG-13, 50.00%
PG, 30.00%
R, 10.00%G, 10.00%
G
PG
PG-13
R

Distribution of Opening Weekend Revenues
0
5
10
15
20
25
30
35
Opening Weekend Revenues
Num
ber
of M
ovie
s
0.00%
50.00%
100.00%
BoxPlot
$597,362 $20,597,362 $40,597,362 $60,597,362 $80,597,362 $100,597,362 $120,597,362
My Big Fat Greek Wedding
Spiderman 2
Median: American Pie 2 & Meet the Fockers

Distribution of Gross Revenue
0
5
10
15
20
25
30
35
40
45
50
Total Revenues
Nu
mb
er
of
Mo
vie
s
.00%
50.00%
100.00%
Gross
$- $100,000,000
$200,000,000
$300,000,000
$400,000,000
$500,000,000
$600,000,000
Dinosaurs
Titanic
Median: Ocean’s Eleven & What Women Want

Distribution of Budget
0
5
10
15
20
25
30
Budget
Nu
mb
er o
f M
ovie
s
.00%
50.00%
100.00%
Budget
$- $50,000,000 $100,000,000 $150,000,000 $200,000,000
The Blair Witch Project
Median: Ocean’s Eleven
Titanic &
Spiderman 2

Number of Screens
108 1108 2108 3108 4108
Number of Screens Distribution
0
10
20
30
40
50
60
Number of Screens
Nu
mb
er
of
Mo
vie
s
.00%
50.00%
100.00%
My Big Fat Greek Wedding Shrek 2
My Big Fat Greek Wedding
Good Will Hunting
Passion of Christ
Beautiful Mind
The Blair Witch Project
Good Will Hunting

Rate of Return for all data
0 500 1000 1500 2000 2500 3000 3500 4000
Rate of return after elmination of four largest outliers
0.859144 2.859144 4.859144 6.859144 8.859144
Distribution of Rate of Returns
0
5
10
15
20
25
30
35
Rate of Returns
Nu
mb
er
of
Mo
vie
s
.00%
50.00%
100.00%
Terminator 3: Rise of Machines
The Blair Witch Project
My Big Fat Greek Wedding
Good Will Hunting
Passion of Christ
There’s Something About Mary
Scary Movie
The Water Boy
AP: The Spy Who.
Shrek 2

Gross Yearly Revenues for the last 10 years
y = 2E+08x - 4E+11
R 2 = 0.502
0
500000000
1000000000
1500000000
2000000000
2500000000
3000000000
3500000000
1996 1997 1998 1999 2000 2001 2002 2003 2004 2005
YEARS
RE
VE
NU
ES
Revenues per Movie for the Last 10 Years
0
50000000
100000000
150000000
200000000
250000000
300000000
1996 1997 1998 1999 2000 2001 2002 2003 2004 2005
YEARS
RE
VE
NU
E P
ER
MO
VIE

Statistical Analysis1. Data Overview
Opening Weekend v Screens
0
500
1000
1500
2000
2500
3000
3500
4000
4500
$- $20,000,000 $40,000,000 $60,000,000 $80,000,000 $100,000,000 $120,000,000 $140,000,000
Opening Weekend

Continue…
Gross v Opening Weekend
$-
$100,000,000
$200,000,000
$300,000,000
$400,000,000
$500,000,000
$600,000,000
$700,000,000
$- $20,000,000 $40,000,000 $60,000,000 $80,000,000 $100,000,000 $120,000,000 $140,000,000
Opening Weekend

Continue…
Opening Weekend vs. Budget
0
50000000
100000000
150000000
200000000
250000000
0 20000000 40000000 60000000 80000000 100000000 120000000 140000000
Opening Weekend

Regressions
Opening Weekend Rev vs. Screens
$-
$20
,000
,000
$40
,000
,000
$60
,000
,000
$80
,000
,000
$10
0,000
,000
$12
0,000
,000
$14
0,000
,000
050
010
0015
0020
0025
0030
0035
0040
0045
00
Screens
Op
en
We
eke
nd
Open Weekend
Predicted Open Weekend
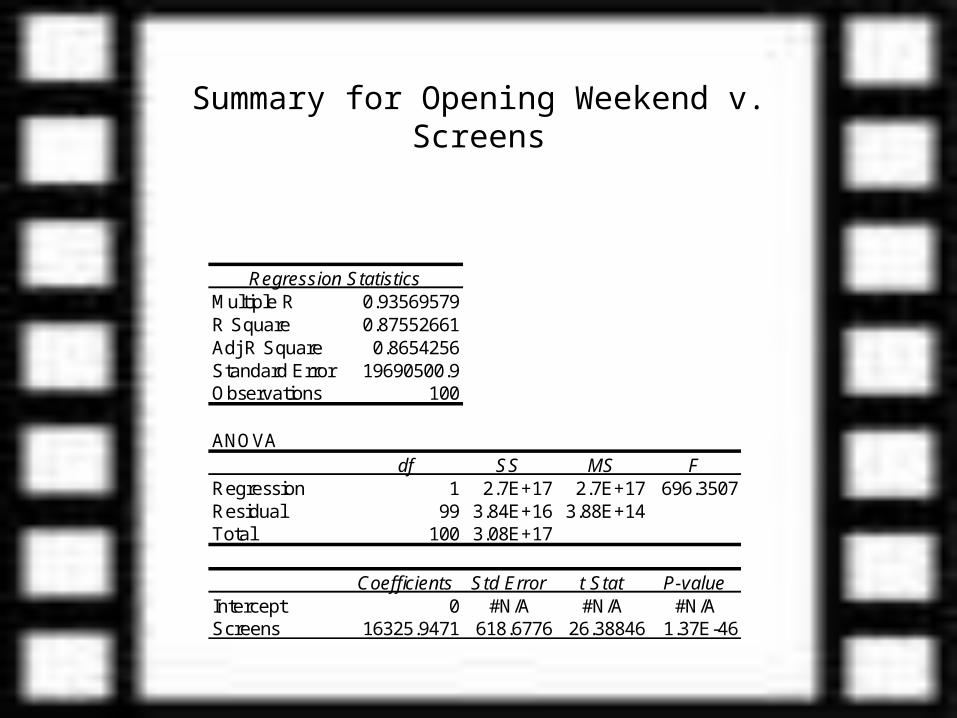
Summary for Opening Weekend v. Screens
Regression StatisticsMultiple R 0.93569579R Square 0.87552661Adj R Square 0.8654256Standard Error 19690500.9Observations 100
ANOVAdf SS MS F
Regression 1 2.7E+17 2.7E+17 696.3507Residual 99 3.84E+16 3.88E+14Total 100 3.08E+17
Coefficients Std Error t Stat P-valueIntercept 0 #N/A #N/A #N/AScreens 16325.9471 618.6776 26.38846 1.37E-46
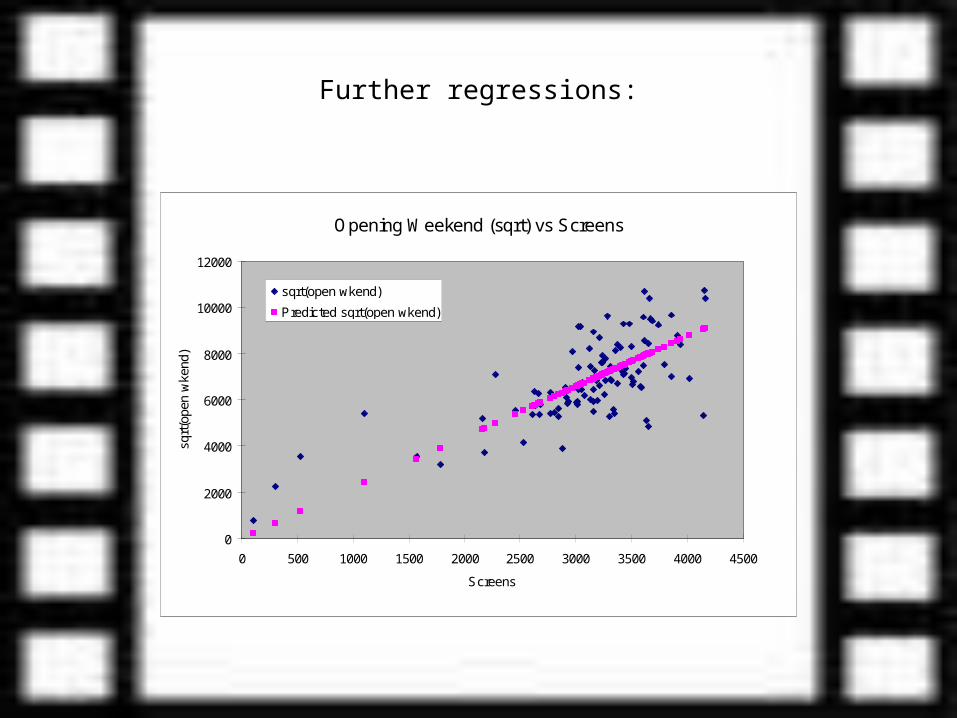
Further regressions:
Opening Weekend (sqrt) vs Screens
0
2000
4000
6000
8000
10000
12000
0 500 1000 1500 2000 2500 3000 3500 4000 4500
Screens
sqrt
(ope
n w
kend
)
sqrt(open wkend)
Predicted sqrt(open wkend)

Summary of Opening Weekend (Sqrt) vs. Screens
Regression StatisticsMultiple R 0.98283686R Square 0.96596829Adj R Square 0.95586728Standard Error 1309.20978Observations 100
ANOVAdf SS MS F
Regression 1 4.82E+09 4.82E+09 2810.052Residual 99 1.7E+08 1714030Total 100 4.99E+09
Coefficients Std Error t Stat P-valueIntercept 0 #N/A #N/A #N/AScreens 2.18059006 0.041136 53.00992 1.73E-74

Continued…
Opening Weekend vs Budget
$0
$20,000,000
$40,000,000
$60,000,000
$80,000,000
$100,000,000
$120,000,000
$140,000,000
$0 $50,000,000 $100,000,000 $150,000,000 $200,000,000 $250,000,000
Budget (est)
Op
en
We
eke
nd
Open Weekend
Predicted Open Weekend

Summary for Opening Weekend vs. Budget
Regression StatisticsMultiple R 0.44671158R Square 0.19955123Adj R Square 0.19129918Std Error 22115568.2Observations 99
ANOVAdf SS MS F
Regression 1 1.18E+16 1.18E+16 24.18202Residual 97 4.74E+16 4.89E+14Total 98 5.93E+16
Coefficients Std Error t Stat P-valueIntercept 26594357.5 5268121 5.048168 2.09E-06Budget (est) 0.27039426 0.054986 4.917522 3.57E-06

•Gross Revenues are highly dependent upon the amount of time movies are in theaters.
Time in Theaters vs Gross Revenues (sqrt)
0
5000
10000
15000
20000
25000
30000
0 50 100 150 200 250 300 350 400
Time in Theaters (in days)
Sqr
t (G
ross
)
sqrt(gross)
Predicted sqrt(gross)
More…

Conclusion• As you can see, the revenues relate to:
– Number of screens – Advertisement– Demographics– Word of mouth
• Distribution looks pretty normal• The top 100 movies were released in
summer and winter months

That’s all folks!!!